A Comparison of Burned Area Time Series in the Alaskan Boreal Forests from Different Remote Sensing Products


Abstract
:
1. Introduction
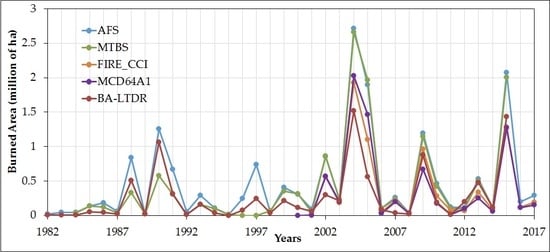
- Building BA time series for the Alaskan boreal forest region from sensors with varying spatial resolutions. The latest versions of the following products available for the Alaska region were considered: BABD-MTBS (30 m), Fire_CCI (250 m), MCD64A1 (500 m), and BA-LTDR (5 km).
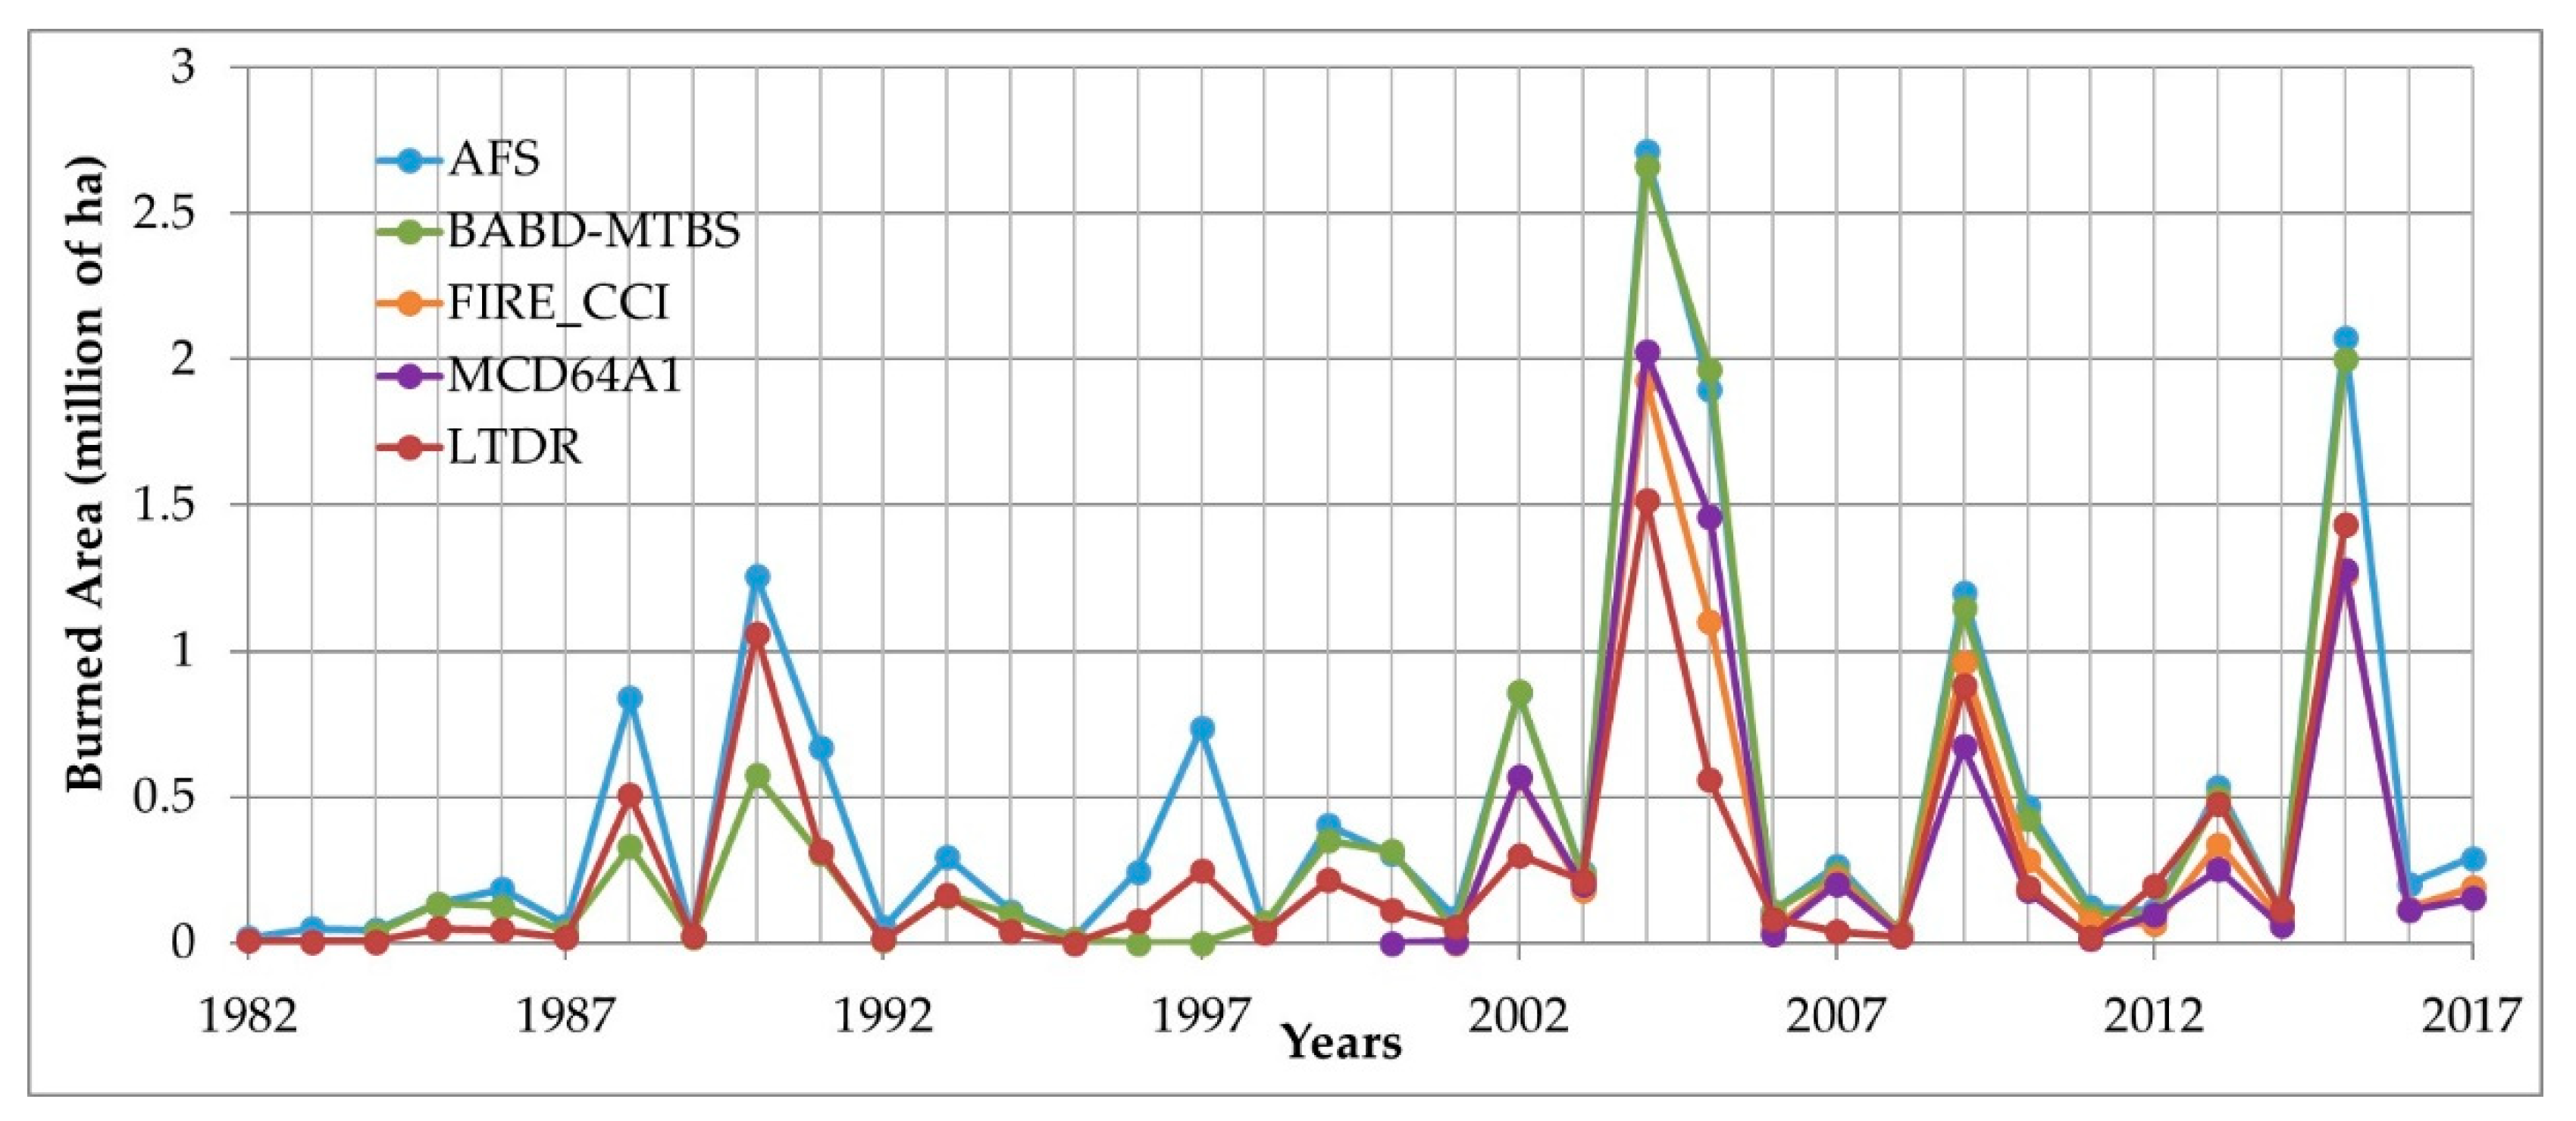
- Calculating the distribution of yearly BA estimations for each product. Conducting a comparison and correlation analysis against the AFS reference data.
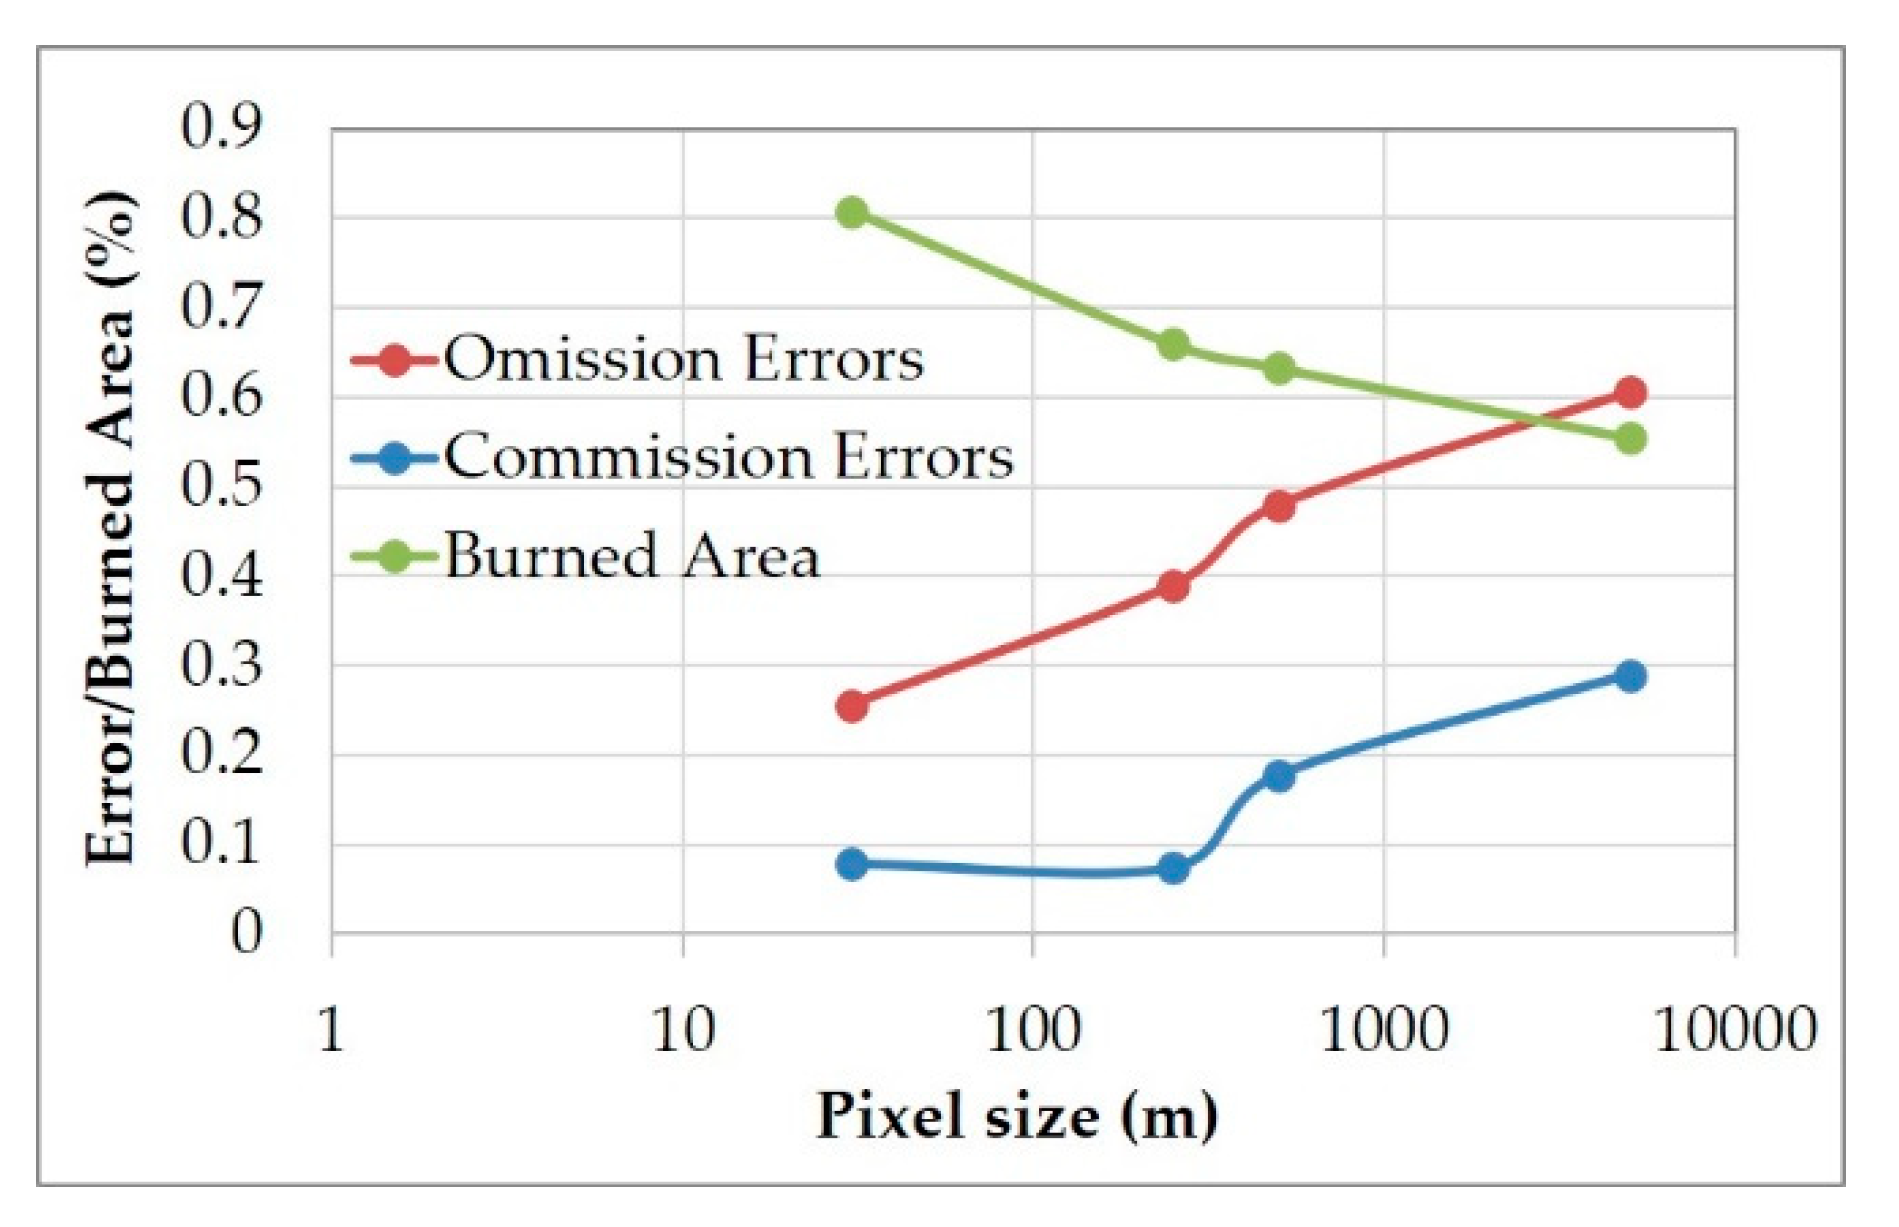
- Assessing the spatial accuracy of the BA products against reference data from metrics resulting from confusion matrices (omission and commission errors).
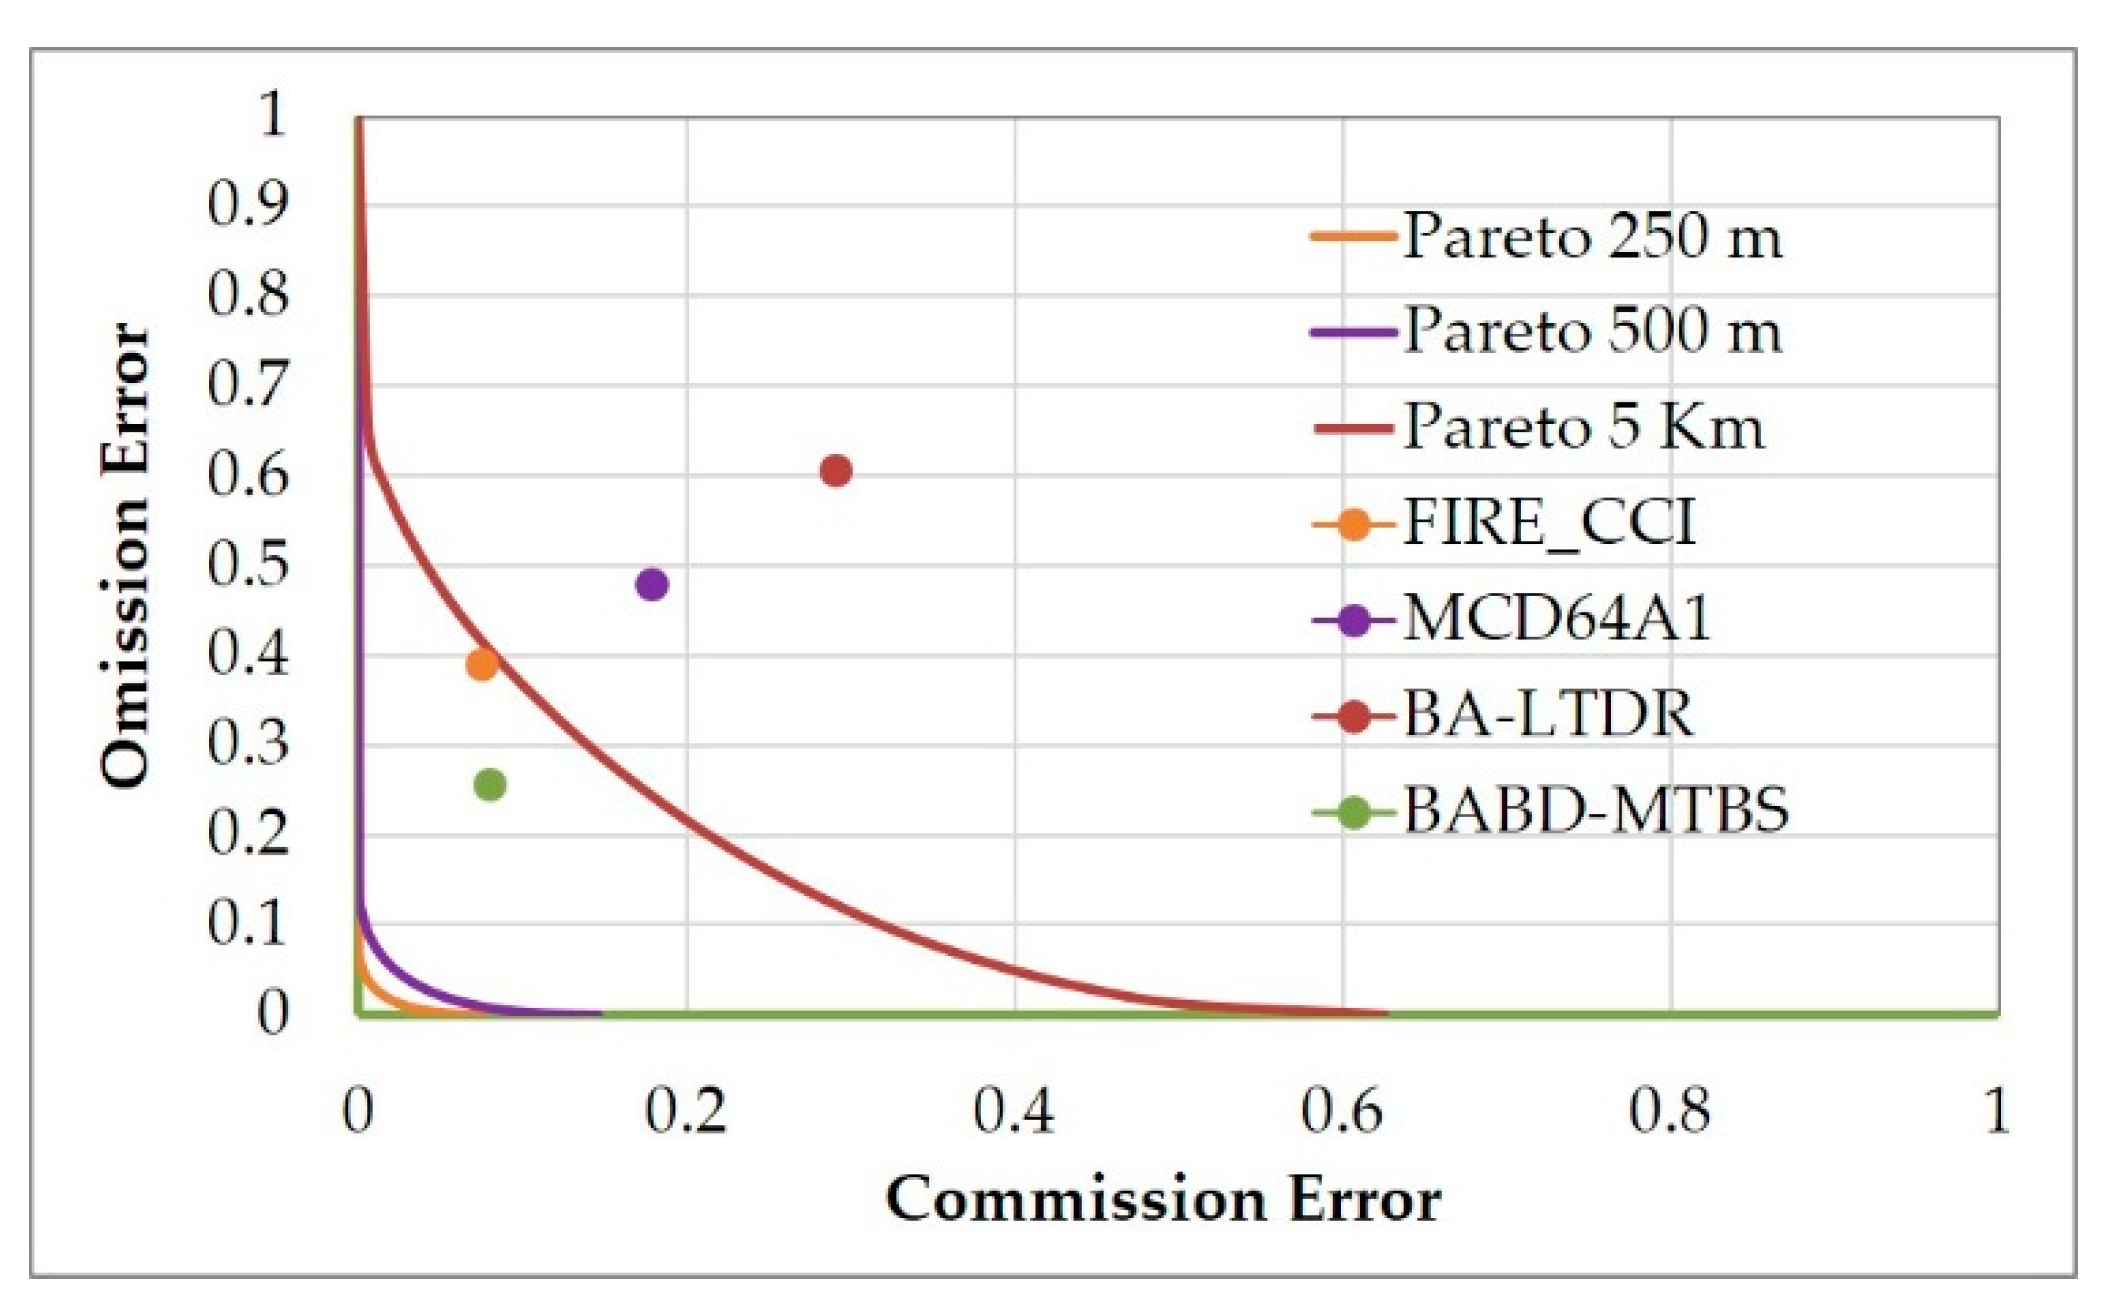
- Assessing the theoretical opportunities for improvement in the current BA products through building Pareto boundaries at various spatial resolutions (250 m, 500 m, and 5 km) from reference data.
2. Materials and Methods
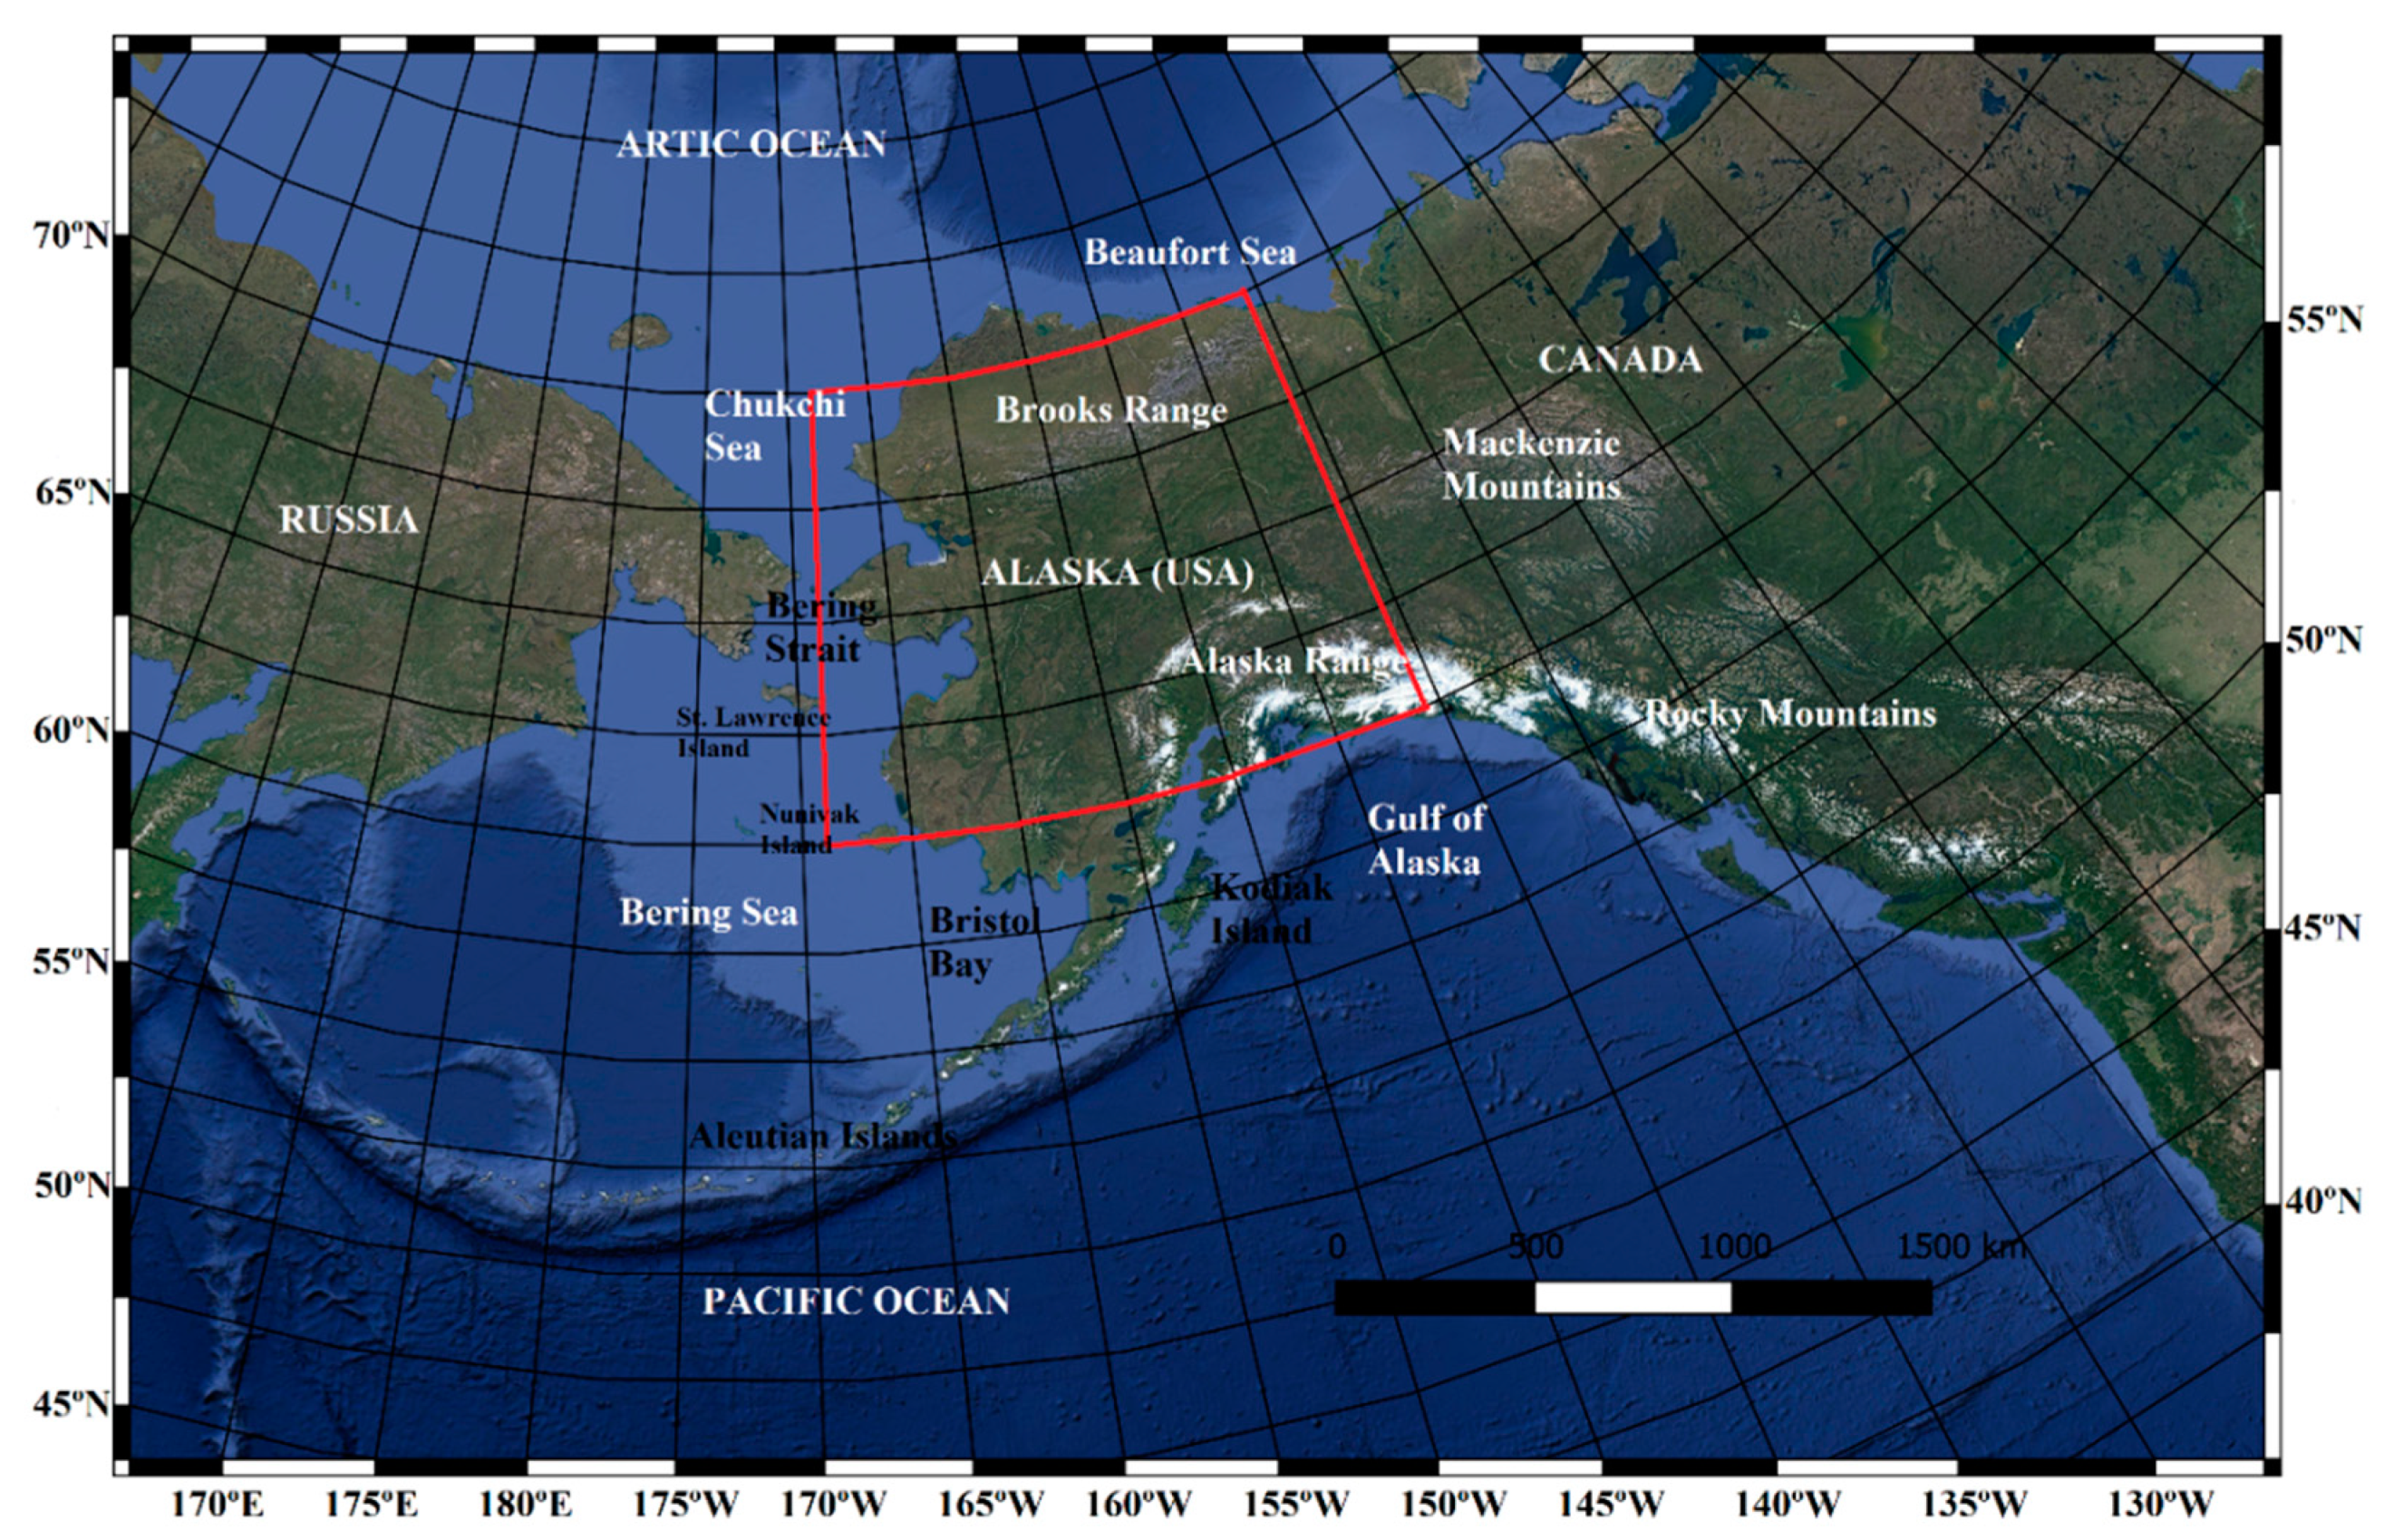
2.1. Study Region
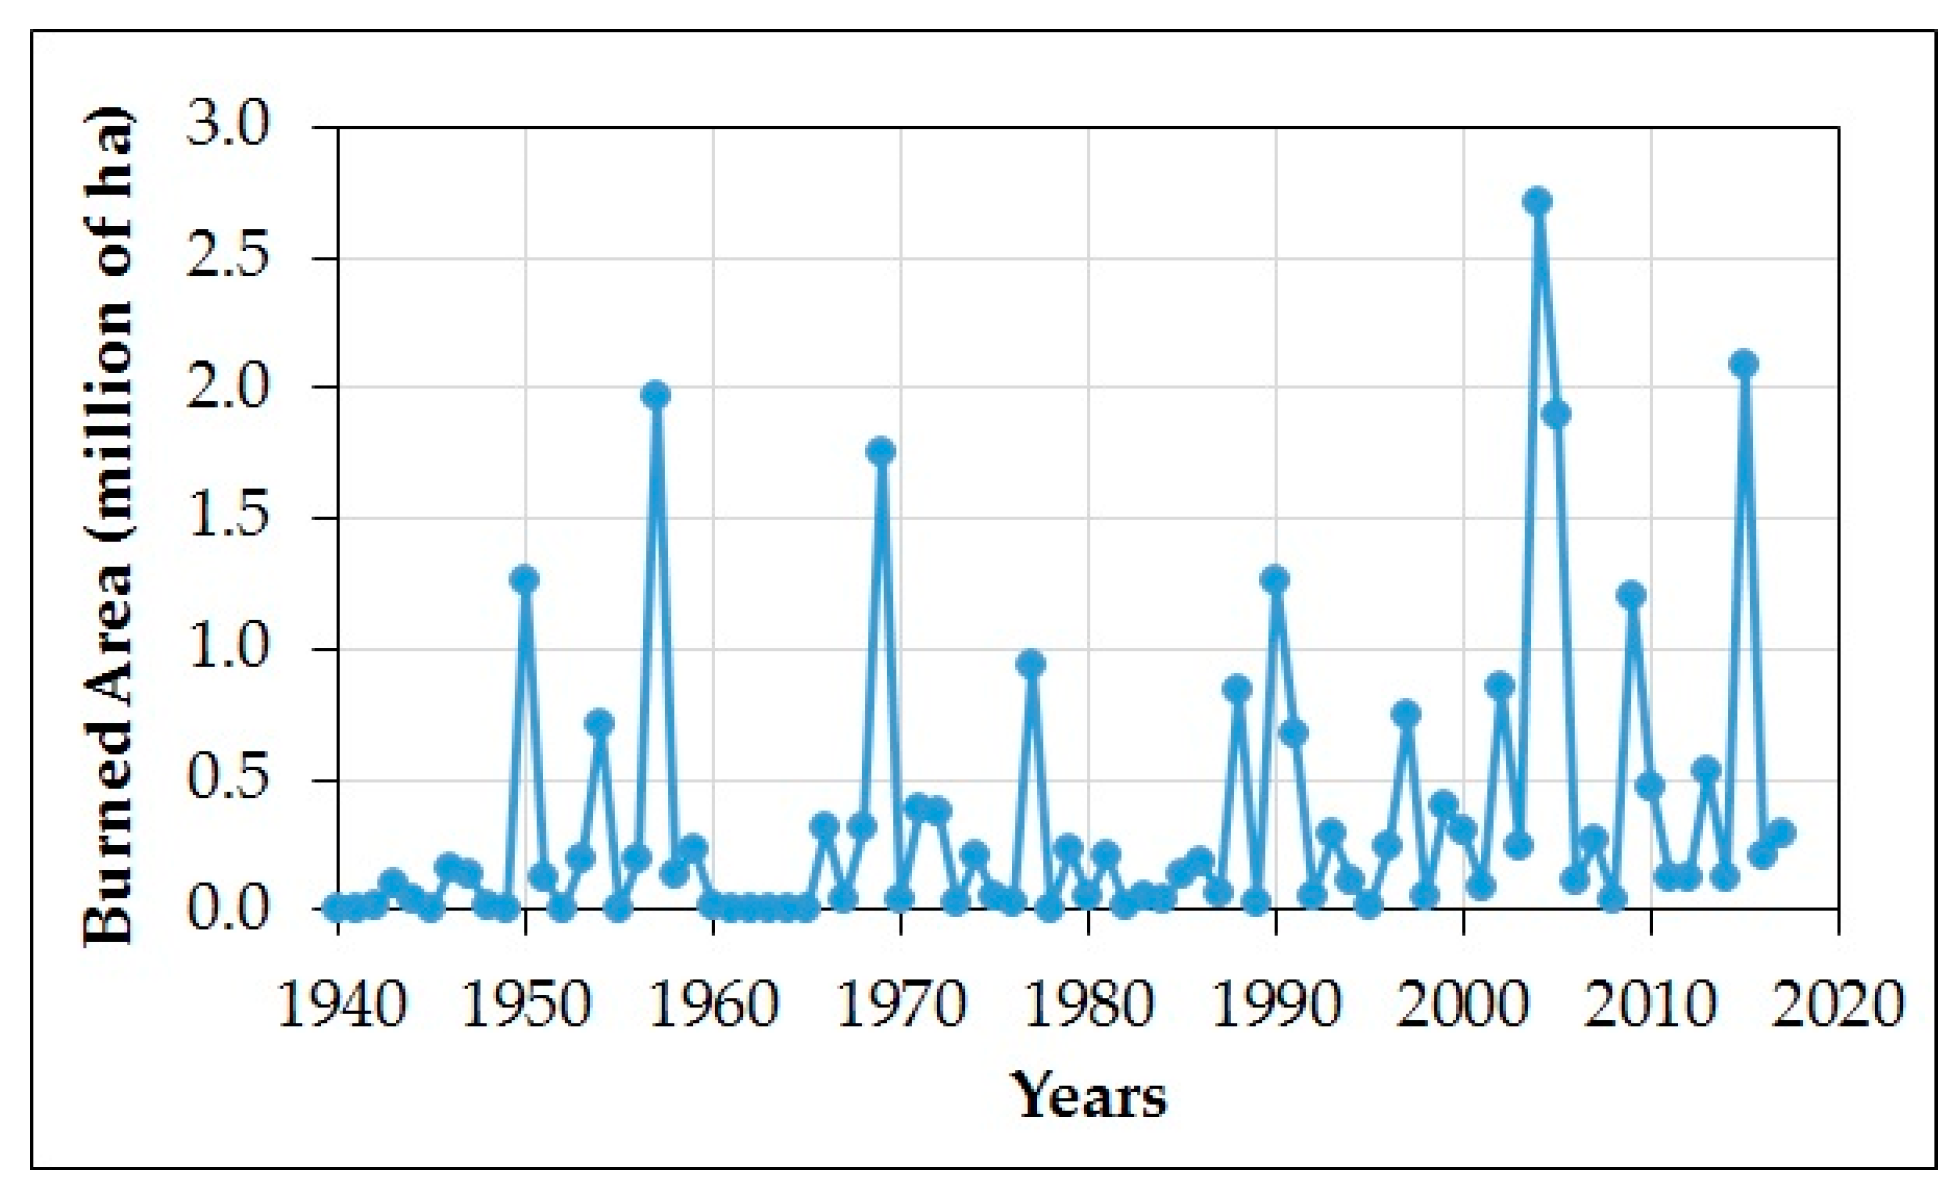
2.2. Reference Data
2.3. Burned Area Time Series
2.3.1. BABD-MTBS
2.3.2. Fire_CCI 5.1
2.3.3. MCD64A1 Collection 6
2.3.4. BA-LTDR
2.4. Accuracy Assessment
3. Results
3.1. Annual Burned Area Distribution
3.2. Spatial Accuracy of the BA Products
3.3. Pareto Boundaries of Burned Area Products
4. Discussion
5. Conclusions
Author Contributions
Funding
Acknowledgments
Conflicts of Interest
References
- Mann, D.H.; Rupp, T.S.; Olson, M.A.; Duffy, P.A. Is Alaska’s Boreal Forest Now Crossing a Major Ecological Threshold? Arct. Antarct. Alp. Res. 2012, 44, 319–331. [Google Scholar] [CrossRef]
- Potter, C. Ecosystem carbon emissions from 2015 forest fires in interior Alaska. Carbon Balance Manag. 2018, 13. [Google Scholar] [CrossRef]
- Chen, G.; Hayes, D.J.; McGuire, A.D. Contributions of wildland fire to terrestrial ecosystem carbon dynamics in North America from 1990 to 2012. Glob. Biogeochem. Cycles 2017, 31, 878–900. [Google Scholar] [CrossRef]
- Mouteva, G.O.; Czimczik, C.I.; Fahrni, S.M.; Wiggins, E.B.; Rogers, B.M.; Veraverbeke, S.; Xu, X.; Santos, G.M.; Henderson, J.; Miller, C.E.; et al. Black carbon aerosol dynamics and isotopic composition in Alaska linked with boreal fire emissions and depth of burn in organic soils. Glob. Biogeochem. Cycles 2015, 29, 1977–2000. [Google Scholar] [CrossRef]
- Kasischke, E.S.; Verbyla, D.L.; Rupp, T.S.; McGuire, A.D.; Murphy, K.A.; Jandt, R.; Barnes, J.L.; Hoy, E.E.; Duffy, P.A.; Calef, M.; et al. Alaska’s changing fire regime—Implications for the vulnerability of its boreal forests. Can. J. For. Res. 2010, 40, 1313–1324. [Google Scholar] [CrossRef]
- Kasischke, E.S.; Verbyla, D.L. Fire trends in the Alaskan boreal forest. In Alaska’s Changing Boreal Fororest; Chapin, F.S., III, Oswood, M.W., Van Cleve, K., Viereck, L.A., Verbyla, D.L., Eds.; Oxford University Press: New York, NY, USA, 2006; pp. 285–301. [Google Scholar]
- Melillo, J.M.; Richmond, T.C.; Yohe, G.W. Climate Change Impacts in the United States: The Third National Climate Assessment; Chapin, F.S., III, Trainor, S.F., Cochran, P., Huntington, H., Markon, C., McCammon, M., McGuire, A.D., Serreze, M., Eds.; U.S. Global Change Research Program: Washington, DC, USA, 2014; pp. 514–536. [Google Scholar]
- Kasischke, E.; Christensen, N.J.; Stocks, B. Fire, global warming, and the carbon balance of boreal forests. Ecol. Appl. 1995, 5, 437–451. [Google Scholar] [CrossRef]
- Van der Werf, G.R.; Randerson, J.T.; Giglio, L.; van Leeuwen, T.T.; Chen, Y.; Rogers, B.M.; Mu, M.; van Marle, M.J.E.; Morton, D.C.; Collatz, G.J.; et al. Global fire emissions estimates during 1997–2016. Earth Syst. Sci. Data 2017, 9, 697–720. [Google Scholar] [CrossRef]
- Yi, K.; Bao, Y. Estimates of wildfire emissions in boreal forests of China. Fororests 2016, 7, 158. [Google Scholar] [CrossRef]
- Chu, T.; Guo, X. Remote sensing techniques in monitoring post-fire effects and patterns of forest recovery in boreal forest regions: A review. Remote Sens. 2013, 6, 470–520. [Google Scholar] [CrossRef]
- Mouillot, F.; Schultz, M.G.; Yue, C.; Cadule, P.; Tansey, K.; Ciais, P.; Chuvieco, E. Ten years of global burned area products from spaceborne remote sensing-A review: Analysis of user needs and recommendations for future developments. Int. J. Appl. Earth Obs. Geoinf. 2014, 26, 64–79. [Google Scholar] [CrossRef]
- Lentile, L.B.; Holden, Z.A.; Smith, A.M.S.; Falkowski, M.J.; Hudak, A.T.; Morgan, P.; Lewis, S.A.; Gessler, P.E.; Benson, N.C. Remote sensing techniques to assess active fire characteristics and post-fire effects. Int. J. Wildland Fire 2006, 15, 319–345. [Google Scholar] [CrossRef]
- Toth, C.; Jóźków, G. Remote sensing platforms and sensors: A survey. ISPRS J. Photogramm. Remote Sens. 2016, 115, 22–36. [Google Scholar] [CrossRef]
- Upadhyay, V.; Kumar, A. Hyperspectral Remote Sensing of Forests: Technological advancements, Opportunities and Challenges. Earth Sci. Inform. 2018, 11, 487–524. [Google Scholar] [CrossRef]
- Giglio, L.; Boschetti, L.; Roy, D.P.; Humber, M.L.; Justice, C.O. The Collection 6 MODIS burned area mapping algorithm and product. Remote Sens. Environ. 2018, 217, 72–85. [Google Scholar] [CrossRef] [PubMed]
- Roy, D.P.; Boschetti, L.; Justice, C.O.; Ju, J. The collection 5 MODIS burned area product—Global evaluation by comparison with the MODIS active fire product. Remote Sens. Environ. 2008, 112, 3690–3707. [Google Scholar] [CrossRef]
- Roy, D.P.; Jin, Y.; Lewis, P.E.; Justice, C.O. Prototyping a global algorithm for systematic fire-affected area mapping using MODIS time series data. Remote Sens. Environ. 2005, 97, 137–162. [Google Scholar] [CrossRef]
- Chuvieco, E.; Lizundia-Loiola, J.; Pettinari, M.L.; Ramo, R.; Padilla, M.; Tansey, K.; Mouillot, F.; Laurent, P.; Storm, T.; Heil, A.; et al. Generation and analysis of a new global burned area product based on MODIS 250 m reflectance bands and thermal anomalies. Earth Syst. Sci. Data Discuss. 2018, 2015–2031. [Google Scholar] [CrossRef]
- Barbosa, P.M.; Stroppiana, D.; Grégoire, J.M.; Pereira, J.M.C. An assessment of vegetation fire in Africa (1981–1991): Burned areas, burned biomass, and atmospheric emissions. Glob. Biogeochem. Cycles 1999, 13, 933–950. [Google Scholar] [CrossRef]
- Pereira, J.M.C. A comparative evaluation of NOAA/AVHRR vegetation indexes for burned surface detection and mapping. IEEE Trans. Geosci. Remote Sens. 1999, 37, 217–226. [Google Scholar] [CrossRef]
- Barbosa, P.M.; Grégoire, J.M.; Pereira, J.M.C. An algorithm for extracting burned areas from time series of AVHRR GAC data applied at a continental scale. Remote Sens. Environ. 1999, 69, 253–263. [Google Scholar] [CrossRef]
- Li, Z.; Nadon, S.; Cihlar, J. Satellite-based detection of Canadian boreal forest fires: Development and application of the algorithm. Int. J. Remote Sens. 2000, 21, 3057–3069. [Google Scholar] [CrossRef]
- Kasischke, E.S.; French, N.H.F. Locating and estimating the areal extent of wildfires in alaskan boreal forests using multiple-season AVHRR NDVI composite data. Remote Sens. Environ. 1995, 51, 263–275. [Google Scholar] [CrossRef]
- Sukhinin, A.I.; French, N.H.F.; Kasischke, E.S.; Hewson, J.H.; Soja, A.J.; Csiszar, I.A.; Hyer, E.J.; Loboda, T.; Conrad, S.G.; Romasko, V.I.; et al. AVHRR-based mapping of fires in Russia: New products for fire management and carbon cycle studies. Remote Sens. Environ. 2004, 93. [Google Scholar] [CrossRef]
- Soja, A.J.; Cofer, W.R.; Shugart, H.H.; Sukhinin, A.I.; Stackhouse, P.W.; McRae, D.J.; Conard, S.G. Estimating fire emissions and disparities in boreal Siberia (1998–2002). J. Geophys. Res. D Atmos. 2004, 109. [Google Scholar] [CrossRef]
- Gitas, I.Z.; Mitri, G.H.; Ventura, G. Object-based image classification for burned area mapping of Creus Cape, Spain, using NOAA-AVHRR imagery. Remote Sens. Environ. 2004, 92, 409–413. [Google Scholar] [CrossRef]
- Chuvieco, E.; Englefield, P.; Trishchenko, A.P.; Luo, Y. Generation of long time series of burn area maps of the boreal forest from NOAA-AVHRR composite data. Remote Sens. Environ. 2008, 112, 2381–2396. [Google Scholar] [CrossRef]
- Ponomarev, E.I.; Kharuk, V.I.; Ranson, K.J. Wildfires dynamics in Siberian larch forests. Forests 2016, 7, 125. [Google Scholar] [CrossRef]
- Pedelty, J.; Devadiga, S.; Masuoka, E.; Brown, M.; Pinzon, J.; Tucker, C.; Vermote, E.; Prince, S.; Nagol, J.; Justice, C.; et al. Generating a long-term land data record from the AVHRR and MODIS instruments. Int. Geosci. Remote Sens. Symp. IGARSS 2007, 1021–1024. [Google Scholar] [CrossRef]
- Moreno Ruiz, J.A.; Riaño, D.; Arbelo, M.; French, N.H.F.; Ustin, S.L.; Whiting, M.L. Burned area mapping time series in Canada (1984–1999) from NOAA-AVHRR LTDR: A comparison with other remote sensing products and fire perimeters. Remote Sens. Environ. 2012, 117, 407–414. [Google Scholar] [CrossRef]
- Guindos-Rojas, F.; Arbelo, M.; García-Lázaro, J.R.; Moreno-Ruiz, J.A.; Hernández-Leal, P.A. Evaluation of a Bayesian algorithm to detect Burned Areas in the Canary Islands’ Dry Woodlands and forests ecoregion using MODIS data. Remote Sens. 2018, 10, 789. [Google Scholar] [CrossRef]
- García-Lázaro, J.R.; Moreno-Ruiz, J.A.; Riaño, D.; Arbelo, M. Estimation of burned area in the Northeastern Siberian boreal forest from a Long-Term Data Record (LTDR) 1982–2015 time series. Remote Sens. 2018, 10, 940. [Google Scholar] [CrossRef]
- Chuvieco, E.; Congalton, R.G. Application of remote sensing and geographic information systems to forest fire hazard mapping. Remote Sens. Environ. 1989, 29, 147–159. [Google Scholar] [CrossRef]
- Díaz-Delgado, R.; Pons, X. Spatial patterns of forest fires in Catalonia (NE of Spain) along the period 1975–1995 analysis of vegetation recovery after fire. For. Ecol. Manag. 2001, 147, 67–74. [Google Scholar] [CrossRef]
- Bastarrika, A.; Chuvieco, E.; Martín, M.P. Mapping burned areas from landsat TM/ETM+ data with a two-phase algorithm: Balancing omission and commission errors. Remote Sens. Environ. 2011, 115, 1003–1012. [Google Scholar] [CrossRef]
- Koutsias, N.; Karteris, M. Burned area mapping using logistic regression modeling of a single post-fire Landsat-5 Thematic Mapper image. Int. J. Remote Sens. 2000, 21, 673–687. [Google Scholar] [CrossRef]
- Zhu, Z. Change detection using landsat time series: A review of frequencies, preprocessing, algorithms, and applications. ISPRS J. Photogramm. Remote Sens. 2017, 130, 370–384. [Google Scholar] [CrossRef]
- Eidenshink, J.; Schwind, B.; Brewer, K.; Zhu, Z.L.; Quayle, B.; Howard, S. A Project for Monitoring Trends in Burn Severity. Fire Ecol. 2007, 3, 3–21. [Google Scholar] [CrossRef]
- Hawbaker, T.J.; Vanderhoof, M.K.; Beal, Y.J.; Takacs, J.D.; Schmidt, G.L.; Falgout, J.T.; Williams, B.; Fairaux, N.M.; Caldwell, M.K.; Picotte, J.J.; et al. Mapping burned areas using dense time-series of Landsat data. Remote Sens. Environ. 2017, 198, 504–522. [Google Scholar] [CrossRef]
- Vanderhoof, M.K.; Fairaux, N.; Beal, Y.J.G.; Hawbaker, T.J. Validation of the USGS Landsat Burned Area Essential Climate Variable (BAECV) across the conterminous United States. Remote Sens. Environ. 2017, 198, 393–406. [Google Scholar] [CrossRef]
- Liu, C.; Frazier, P.; Kumar, L. Comparative assessment of the measures of thematic classification accuracy. Remote Sens. Environ. 2007, 107, 606–616. [Google Scholar] [CrossRef]
- Foody, G.M. Status of land cover classification accuracy assessment. Remote Sens. Environ. 2002, 80, 185–201. [Google Scholar] [CrossRef]
- Belhadj-Khedher, C.; Koutsias, N.; Karamitsou, A.; Ei-Melki, T.; Ouelhazi, B.; Hamdi, A.; Nouri, H.; Mouillot, F. A revised historical fire regime analysis in Tunisia (1985–2010) from a critical analysis of the national fire database and remote sensing. Forests 2018, 9, 59. [Google Scholar] [CrossRef]
- Humber, M.L.; Boschetti, L.; Giglio, L.; Justice, C.O. Spatial and temporal intercomparison of four global burned area products. Int. J. Digit. Earth 2019, 12, 460–484. [Google Scholar] [CrossRef]
- Oliva, P.; Martín, P.; Chuvieco, E. Burned area mapping with MERIS post-fire image. Int. J. Remote Sens. 2011, 32, 4175–4201. [Google Scholar] [CrossRef]
- Anaya, J.A.; Chuvieco, E. Accuracy Assessment of Burned Area Products in the Orinoco Basin. Photogramm. Eng. Remote Sens. 2013, 78, 53–60. [Google Scholar] [CrossRef]
- Mallinis, G.; Koutsias, N. Comparing ten classification methods for burned area mapping in a Mediterranean environment using Landsat TM satellite data. Int. J. Remote Sens. 2012, 33, 4408–4433. [Google Scholar] [CrossRef]
- Boschetti, L.; Flasse, S.P.; Brivio, P.A. Analysis of the conflict between omission and commission in low spatial resolution dichotomic thematic products: The Pareto Boundary. Remote Sens. Environ. 2004, 91, 280–292. [Google Scholar] [CrossRef]
- Moreno-Ruiz, J.A.; García-Lázaro, J.R.; del Águila Cano, I.; Hernández-Leal, P. Burned area mapping in the North American boreal forest using terra-MODIS LTDR (2001–2011): A comparison with the MCD45A1, MCD64A1 and BA GEOLAND-2 products. Remote Sens. 2014, 6, 815–840. [Google Scholar] [CrossRef]
- Boschetti, L.; Stehman, S.V.; Roy, D.P. A stratified random sampling design in space and time for regional to global scale burned area product validation. Remote Sens. Environ. 2016, 186, 465–478. [Google Scholar] [CrossRef]
- Padilla, M.; Stehman, S.V.; Ramo, R.; Corti, D.; Hantson, S.; Oliva, P.; Alonso-Canas, I.; Bradley, A.V.; Tansey, K.; Mota, B.; et al. Comparing the accuracies of remote sensing global burned area products using stratified random sampling and estimation. Remote Sens. Environ. 2015, 160, 114–121. [Google Scholar] [CrossRef]
- Silva, J.M.N.; Sá, A.C.L.; Pereira, J.M.C. Comparison of burned area estimates derived from SPOT-VEGETATION and Landsat ETM+ data in Africa: Influence of spatial pattern and vegetation type. Remote Sens. Environ. 2005, 96, 188–201. [Google Scholar] [CrossRef]
- Moreno-Ruiz, J.A.; Garcia-Lazaro, J.R.; Riano, D.; Kefauver, S.C. The synergy of the 0.05° (∼5 km) AVHRR long-term data record (LTDR) and landsat TM archive to map large fires in the North American boreal region from 1984 to 1998. IEEE J. Sel. Top. Appl. Earth Obs. Remote Sens. 2014, 7, 1157–1166. [Google Scholar] [CrossRef]
- Nowacki, G.J.; Spencer, P.; Fleming, M.; Brock, T.; Jorgenson, T. Unified Ecoregions of Alaska: 2001. U.S. Geological Survey Open-File Report 2002-297; Geological Survey (U.S.): Reston, VA, USA, 2003. [Google Scholar] [CrossRef]
- Chapin, F.S., III; Oswood, M.W.; van Cleve, K.; Viereck, L.A.; Verbyla, D.L. Alaska’s Changing Boreal Forest; Oxford University Press: New York, NY, USA, 2006. [Google Scholar]
- AK Fire History Perimeters. Available online: https://www.arcgis.com/home/item.html?id=d4b8d89f226f4c488e1e4ba054e49be9 (accessed on 23 April 2019).
- Arnone, E.; Francipane, A.; Scarbaci, A.; Puglisi, C.; Noto, L.V. Effect of raster resolution and polygon-conversion algorithm on landslide susceptibility mapping. Environ. Model. Softw. 2016, 84, 467–481. [Google Scholar] [CrossRef]
- Giglio, L.; Schroeder, W.; Justice, C.O. The collection 6 MODIS active fire detection algorithm and fire products. Remote Sens. Environ. 2016, 178, 31–41. [Google Scholar] [CrossRef]
- Stehman, S.V. Selecting and interpreting measures of thematic classification accuracy. Remote Sens. Environ. 1997, 62, 77–89. [Google Scholar] [CrossRef]
- Hovi, A.; Lindberg, E.; Lang, M.; Arumäe, T.; Peuhkurinen, J.; Sirparanta, S.; Pyankov, S.; Rautiainen, M. Seasonal dynamics of albedo across European boreal forests: Analysis of MODIS albedo and structural metrics from airborne LiDAR. Remote Sens. Environ. 2019, 224, 365–381. [Google Scholar] [CrossRef]
- Wang, Z.; Schaaf, C.B.; Sun, Q.; Shuai, Y.; Román, M.O. Capturing rapid land surface dynamics with Collection V006 MODIS BRDF/NBAR/Albedo (MCD43) products. Remote Sens. Environ. 2018, 207, 50–64. [Google Scholar] [CrossRef]
- Campagnolo, M.L.; Sun, Q.; Liu, Y.; Schaaf, C.; Wang, Z.; Román, M.O. Estimating the effective spatial resolution of the operational BRDF, albedo, and nadir reflectance products from MODIS and VIIRS. Remote Sens. Environ. 2016, 175, 52–64. [Google Scholar] [CrossRef]
- Campagnolo, M.L.; Montano, E.L. Estimation of effective resolution for daily modis gridded surface reflectance products. IEEE Trans. Geosci. Remote Sens. 2014, 52, 5622–5632. [Google Scholar] [CrossRef]
- Egorov, A.; Roy, D.; Zhang, H.; Li, Z.; Yan, L.; Huang, H. Landsat 4, 5 and 7 (1982 to 2017) Analysis Ready Data (ARD) Observation Coverage over the Conterminous United States and Implications for Terrestrial Monitoring. Remote Sens. 2019, 11, 447. [Google Scholar] [CrossRef]
- García Lázaro, J.R.; Ruiz, J.A.M.; Arbelo, M. Effect of spatial resolution on the accuracy of satellite-based fire scar detection in the northwest of the Iberian Peninsula. Int. J. Remote Sens. 2013, 34, 4736–4753. [Google Scholar] [CrossRef]

| Total Burned Area (ha) | Percentage of Total Burned Area | ||||
| >100 ha | >1000 ha | >10,000 ha | >50,000 ha | >100,000 ha | |
| 27,114,076 | 99.89% | 98.24% | 82.68% | 48.70% | 30.68% |
| Count of Fires | Percentage of Total fires | ||||
| >100 ha | >1000 ha | >10,000 ha | >50,000 ha | >100,000 ha | |
| 3597 | 77.98% | 47.40% | 15.04% | 3.25% | 1.31% |
| BA Product | BABD-MTBS | Fire_CCI 5.1 | MCD64A1 C6 | BA-LTDR |
|---|---|---|---|---|
| Coverage | USA | Global | Global | Boreal Region (60° N–70° N) |
| Time span | 1984–2016 | 2001–2017 | 2000–present | 1982–2015 |
| Sensor | Landsat TM/ETM+/OLI | Terra-MODIS | Terra-MODIS and Aqua-MODIS | NOAA-AVHRR/Terra-MODIS |
| Spatial resolution | 30 m | 250 m | 500 m | 0.05° (~5 km) |
| Temporal resolution | 16 days | Daily | Daily | 10 days |
| Spectral resolution | 7/8/11 bands (450–12,500 nm) | 15 bands (390–1040 nm) | 36 bands (405–14,385 nm) | 5 bands (580–12,500 nm) |
| Reference | [39] | [19] | [16] | [50] |
| Year | BABD-MTBS | Fire_CCI 5.1 | MCD64A1 C6 | BA-LTDR | ||||
|---|---|---|---|---|---|---|---|---|
| Commission Error | Omission Error | Commission Error | Omission Error | Commission Error | Omission Error | Commission Error | Omission Error | |
| 1982 | 1.000 | 1.000 | ||||||
| 1983 | 1.000 | 1.000 | ||||||
| 1984 | 0.095 | 0.293 | 1.000 | 1.000 | ||||
| 1985 | 0.118 | 0.113 | 0.334 | 0.756 | ||||
| 1986 | 0.126 | 0.407 | 0.388 | 0.852 | ||||
| 1987 | 0.291 | 0.546 | 0.816 | 0.946 | ||||
| 1988 | 0.153 | 0.668 | 0.146 | 0.485 | ||||
| 1989 | 0.154 | 0.233 | 0.826 | 0.810 | ||||
| 1990 | 0.113 | 0.596 | 0.308 | 0.417 | ||||
| 1991 | 0.175 | 0.624 | 0.354 | 0.694 | ||||
| 1992 | 0.268 | 0.847 | 0.700 | 0.927 | ||||
| 1993 | 0.068 | 0.485 | 0.374 | 0.652 | ||||
| 1994 | 0.169 | 0.253 | 0.473 | 0.812 | ||||
| 1995 | 0.143 | 0.324 | 0.000 | 1.000 | ||||
| 1996 | 0.000 | 1.000 | 0.325 | 0.794 | ||||
| 1997 | 0.180 | 1.000 | 0.143 | 0.713 | ||||
| 1998 | 0.391 | 0.123 | 0.760 | 0.823 | ||||
| 1999 | 0.105 | 0.224 | 0.267 | 0.608 | ||||
| Subtotal | 0.139 | 0.619 | 0.295 | 0.616 | ||||
| 2000 | 0.072 | 0.046 | 0.000 | 1.000 | 0.194 | 0.697 | ||
| 2001 | 0.099 | 0.549 | 0.303 | 0.991 | 1.000 | 1.000 | 0.183 | 0.468 |
| 2002 | 0.092 | 0.088 | 0.095 | 0.402 | 0.166 | 0.446 | 0.167 | 0.708 |
| 2003 | 0.080 | 0.114 | 0.093 | 0.311 | 0.386 | 0.488 | 0.335 | 0.410 |
| 2004 | 0.052 | 0.070 | 0.064 | 0.335 | 0.174 | 0.383 | 0.156 | 0.527 |
| 2005 | 0.094 | 0.061 | 0.089 | 0.47 | 0.151 | 0.345 | 0.256 | 0.780 |
| 2006 | 0.091 | 0.082 | 0.147 | 0.609 | 0.424 | 0.830 | 0.718 | 0.782 |
| 2007 | 0.070 | 0.154 | 0.155 | 0.303 | 0.316 | 0.476 | 0.428 | 0.915 |
| 2008 | 0.246 | 0.216 | 0.292 | 0.438 | 0.573 | 0.712 | 0.326 | 0.611 |
| 2009 | 0.042 | 0.083 | 0.062 | 0.247 | 0.094 | 0.491 | 0.185 | 0.400 |
| 2010 | 0.107 | 0.180 | 0.11 | 0.454 | 0.214 | 0.697 | 0.355 | 0.734 |
| 2011 | 0.059 | 0.251 | 0.23 | 0.543 | 0.221 | 0.901 | 0.270 | 0.898 |
| 2012 | 0.123 | 0.225 | 0.118 | 0.48 | 0.516 | 0.574 | 0.828 | 0.695 |
| 2013 | 0.066 | 0.120 | 0.055 | 0.398 | 0.219 | 0.631 | 0.520 | 0.570 |
| 2014 | 0.017 | 0.053 | 0.065 | 0.35 | 0.238 | 0.611 | 0.870 | 0.877 |
| 2015 | 0.042 | 0.075 | 0.041 | 0.415 | 0.155 | 0.478 | 0.301 | 0.516 |
| Subtotal | 0.066 | 0.089 | 0.075 | 0.39 | 0.178 | 0.480 | 0.288 | 0.602 |
| Total | 0.079 | 0.256 | 0.075 | 0.39 | 0.178 | 0.480 | 0.290 | 0.606 |
© 2019 by the authors. Licensee MDPI, Basel, Switzerland. This article is an open access article distributed under the terms and conditions of the Creative Commons Attribution (CC BY) license (http://creativecommons.org/licenses/by/4.0/).
Share and Cite
Moreno-Ruiz, J.A.; García-Lázaro, J.R.; Arbelo, M.; Riaño, D. A Comparison of Burned Area Time Series in the Alaskan Boreal Forests from Different Remote Sensing Products. Forests 2019, 10, 363. https://doi.org/10.3390/f10050363
Moreno-Ruiz JA, García-Lázaro JR, Arbelo M, Riaño D. A Comparison of Burned Area Time Series in the Alaskan Boreal Forests from Different Remote Sensing Products. Forests. 2019; 10(5):363. https://doi.org/10.3390/f10050363
Chicago/Turabian StyleMoreno-Ruiz, José A., José R. García-Lázaro, Manuel Arbelo, and David Riaño. 2019. "A Comparison of Burned Area Time Series in the Alaskan Boreal Forests from Different Remote Sensing Products" Forests 10, no. 5: 363. https://doi.org/10.3390/f10050363
APA StyleMoreno-Ruiz, J. A., García-Lázaro, J. R., Arbelo, M., & Riaño, D. (2019). A Comparison of Burned Area Time Series in the Alaskan Boreal Forests from Different Remote Sensing Products. Forests, 10(5), 363. https://doi.org/10.3390/f10050363