Article

Soil Organic Carbon Content and Microbial Functional Diversity Were Lower in Monospecific Chinese Hickory Stands than in Natural Chinese Hickory–Broad-Leaved Mixed Forests

1
State Key Laboratory of Subtropical Silviculture, Zhejiang A&F University, Hangzhou 311300, China
2
Zhejiang Provincial Key Laboratory of Carbon Cycling in Forest Ecosystems and Carbon Sequestration, Zhejiang A&F University, Lin’an 311300, China
*
Author to whom correspondence should be addressed.
Forests 2019, 10(4), 357; https://doi.org/10.3390/f10040357
Submission received: 19 February 2019 / Revised: 11 April 2019 / Accepted: 19 April 2019 / Published: 25 April 2019
(This article belongs to the Section Forest Ecology and Management)

Abstract

:
To assess the effects of long-term intensive management on soil carbon cycle and microbial functional diversity, we sampled soil in Chinese hickory (Carya cathayensis Sarg.) stands managed intensively for 5, 10, 15, and 20 years, and in reference Chinese hickory–broad-leaved mixed forest (NMF) stands. We analyzed soil total organic carbon (TOC), microbial biomass carbon (MBC), and water-soluble organic carbon (WSOC) contents, applied 13C-nuclear magnetic resonance analysis for structural analysis, and determined microbial carbon source usage. TOC, MBC, and WSOC contents and the MBC to TOC ratios were lower in the intensively managed stands than in the NMF stands. The organic carbon pool in the stands managed intensively for twenty years was more stable, indicating that the easily degraded compounds had been decomposed. Diversity and evenness in carbon source usage by the microbial communities were lower in the stands managed intensively for 15 and 20 years. Based on carbon source usage, the longer the management time, the less similar the samples from the monospecific Chinese hickory stands were with the NMF samples, indicating that the microbial community compositions became more different with increased management time. The results call for changes in the management of the hickory stands to increase the soil carbon content and restore microbial diversity.

1. Introduction

Soil organic carbon is one of the main factors affecting the storage and supply of nutrients in soil, soil structure stability, soil water-holding capacity, and soil biological activity [1,2]. It is also one of the main indicators for evaluating soil fertility and sustainable land use, as it is associated with different soil physico-chemical and biological processes [3]. The quality, quantity, and distribution of soil organic carbon reflects the spatial distribution of surface plant communities [4,5]. Soil labile organic carbon is easily mineralized by microorganisms. Labile organic carbon plays an important role in maintaining fertility and reflecting changes in soil carbon storage, and it is more sensitive to changes in the microenvironment than other forms of organic carbon [6,7,8]. As the main players and regulators of soil nutrient cycles and biochemical processes, soil microbes are one of the most active components in terrestrial ecosystems [9]. Soil microbes play a vital role in plant litter decomposition, which further affects soil physical and chemical properties [10]. Changes in soil microbial biomass and functional composition can be good indicators of soil health [11]. Additionally, soil microbial biomass and functional composition can sensitively reflect small changes in soil ecosystems [12].
In forests, the amount of carbon in soil commonly exceeds that in the above-ground biomass [13]. Since the above-ground plant communities affect the soil organic carbon pool and microbiome [4,5,14,15], quantifying the differences in carbon storage between natural forests and plantations is essential to estimate the effects of stand conversion on carbon sequestration. Both soil organic matter formation and decomposition include processes driven by enzymes produced by soil microbes [16]. A previous study showed that the soil organic carbon (SOC) content and microbial biomass were lower in rubber and oil palm plantations compared to a natural lowland rainforest [6]. Other studies have shown that the SOC content of 35- to 45-year-old larch plantations was lower than that of 60-year-old secondary forest, and similarly the SOC contents were lower in Chinese fir plantations than in the reference natural forest [13,17,18]. In Caragana korshinskii Kom., Hippophae rhamnoides L., and Prunus davidiana Carr. plantations, the SOC contents were higher in the 26-year-old than in the nine-year-old plantations [19]. Yet again, in Alberta, Canada, the differences in C stocks between native aspen forest and poplar plantations were mainly attributed to differences in plant biomass and not to differences in SOC content in the 0–50 cm soil layer [20]. Stand conversion may decrease soil microbial biomass, diversity, and enzyme activity [17,21,22,23]. However, in a comparison of natural rainforests and rubber plantations in Malaysia, the microbial diversities of soil biota were similar, but the community compositions of bacteria, fungi, and nematodes differed [24]. Since the increasing functional diversity of trees results in increased soil enzyme activities [25], monoculture plantations are expected to show lower enzyme activities than natural forests, possibly due to lower microbial biomass. Whether the lower activity is beneficial or detrimental for carbon sequestration remains unclear. Evidently, under different bioclimatic conditions the effects of stand conversion on soil organic carbon and microbiome are different.
Chinese hickory, a tree species unique to China, is mainly distributed in the Tianmu Mountain area in Zhejiang and Anhui [26,27]. The tree is an economically important source of high-grade dried fruits and oil. Management of Chinese hickory plantations, including fertilizer management, pest control, and density control, has been studied systematically, resulting in a set of high-yield cultivation techniques with high annual profits [28]. The economic interests have promoted the transformation of a large number of natural Chinese hickory–broad-leaved mixed forests into monospecific Chinese hickory stands. The management practices, including removing shrubs and weeds and applying synthetic fertilizers, pesticides, and herbicides in the hickory plantations, have become more intense, resulting in acidification and decreased SOC contents [29]. We hypothesized that the soil quality in the monospecific Chinese hickory stands would decrease with the increasing duration of intensive management. To study this, we analyzed and compared soil organic carbon contents and microbial carbon source usage in Chinese hickory stands managed intensively for 5, 10, 15, and 20 years, and in Chinese hickory–broad-leaved mixed forest stands.

2. Materials and Methods

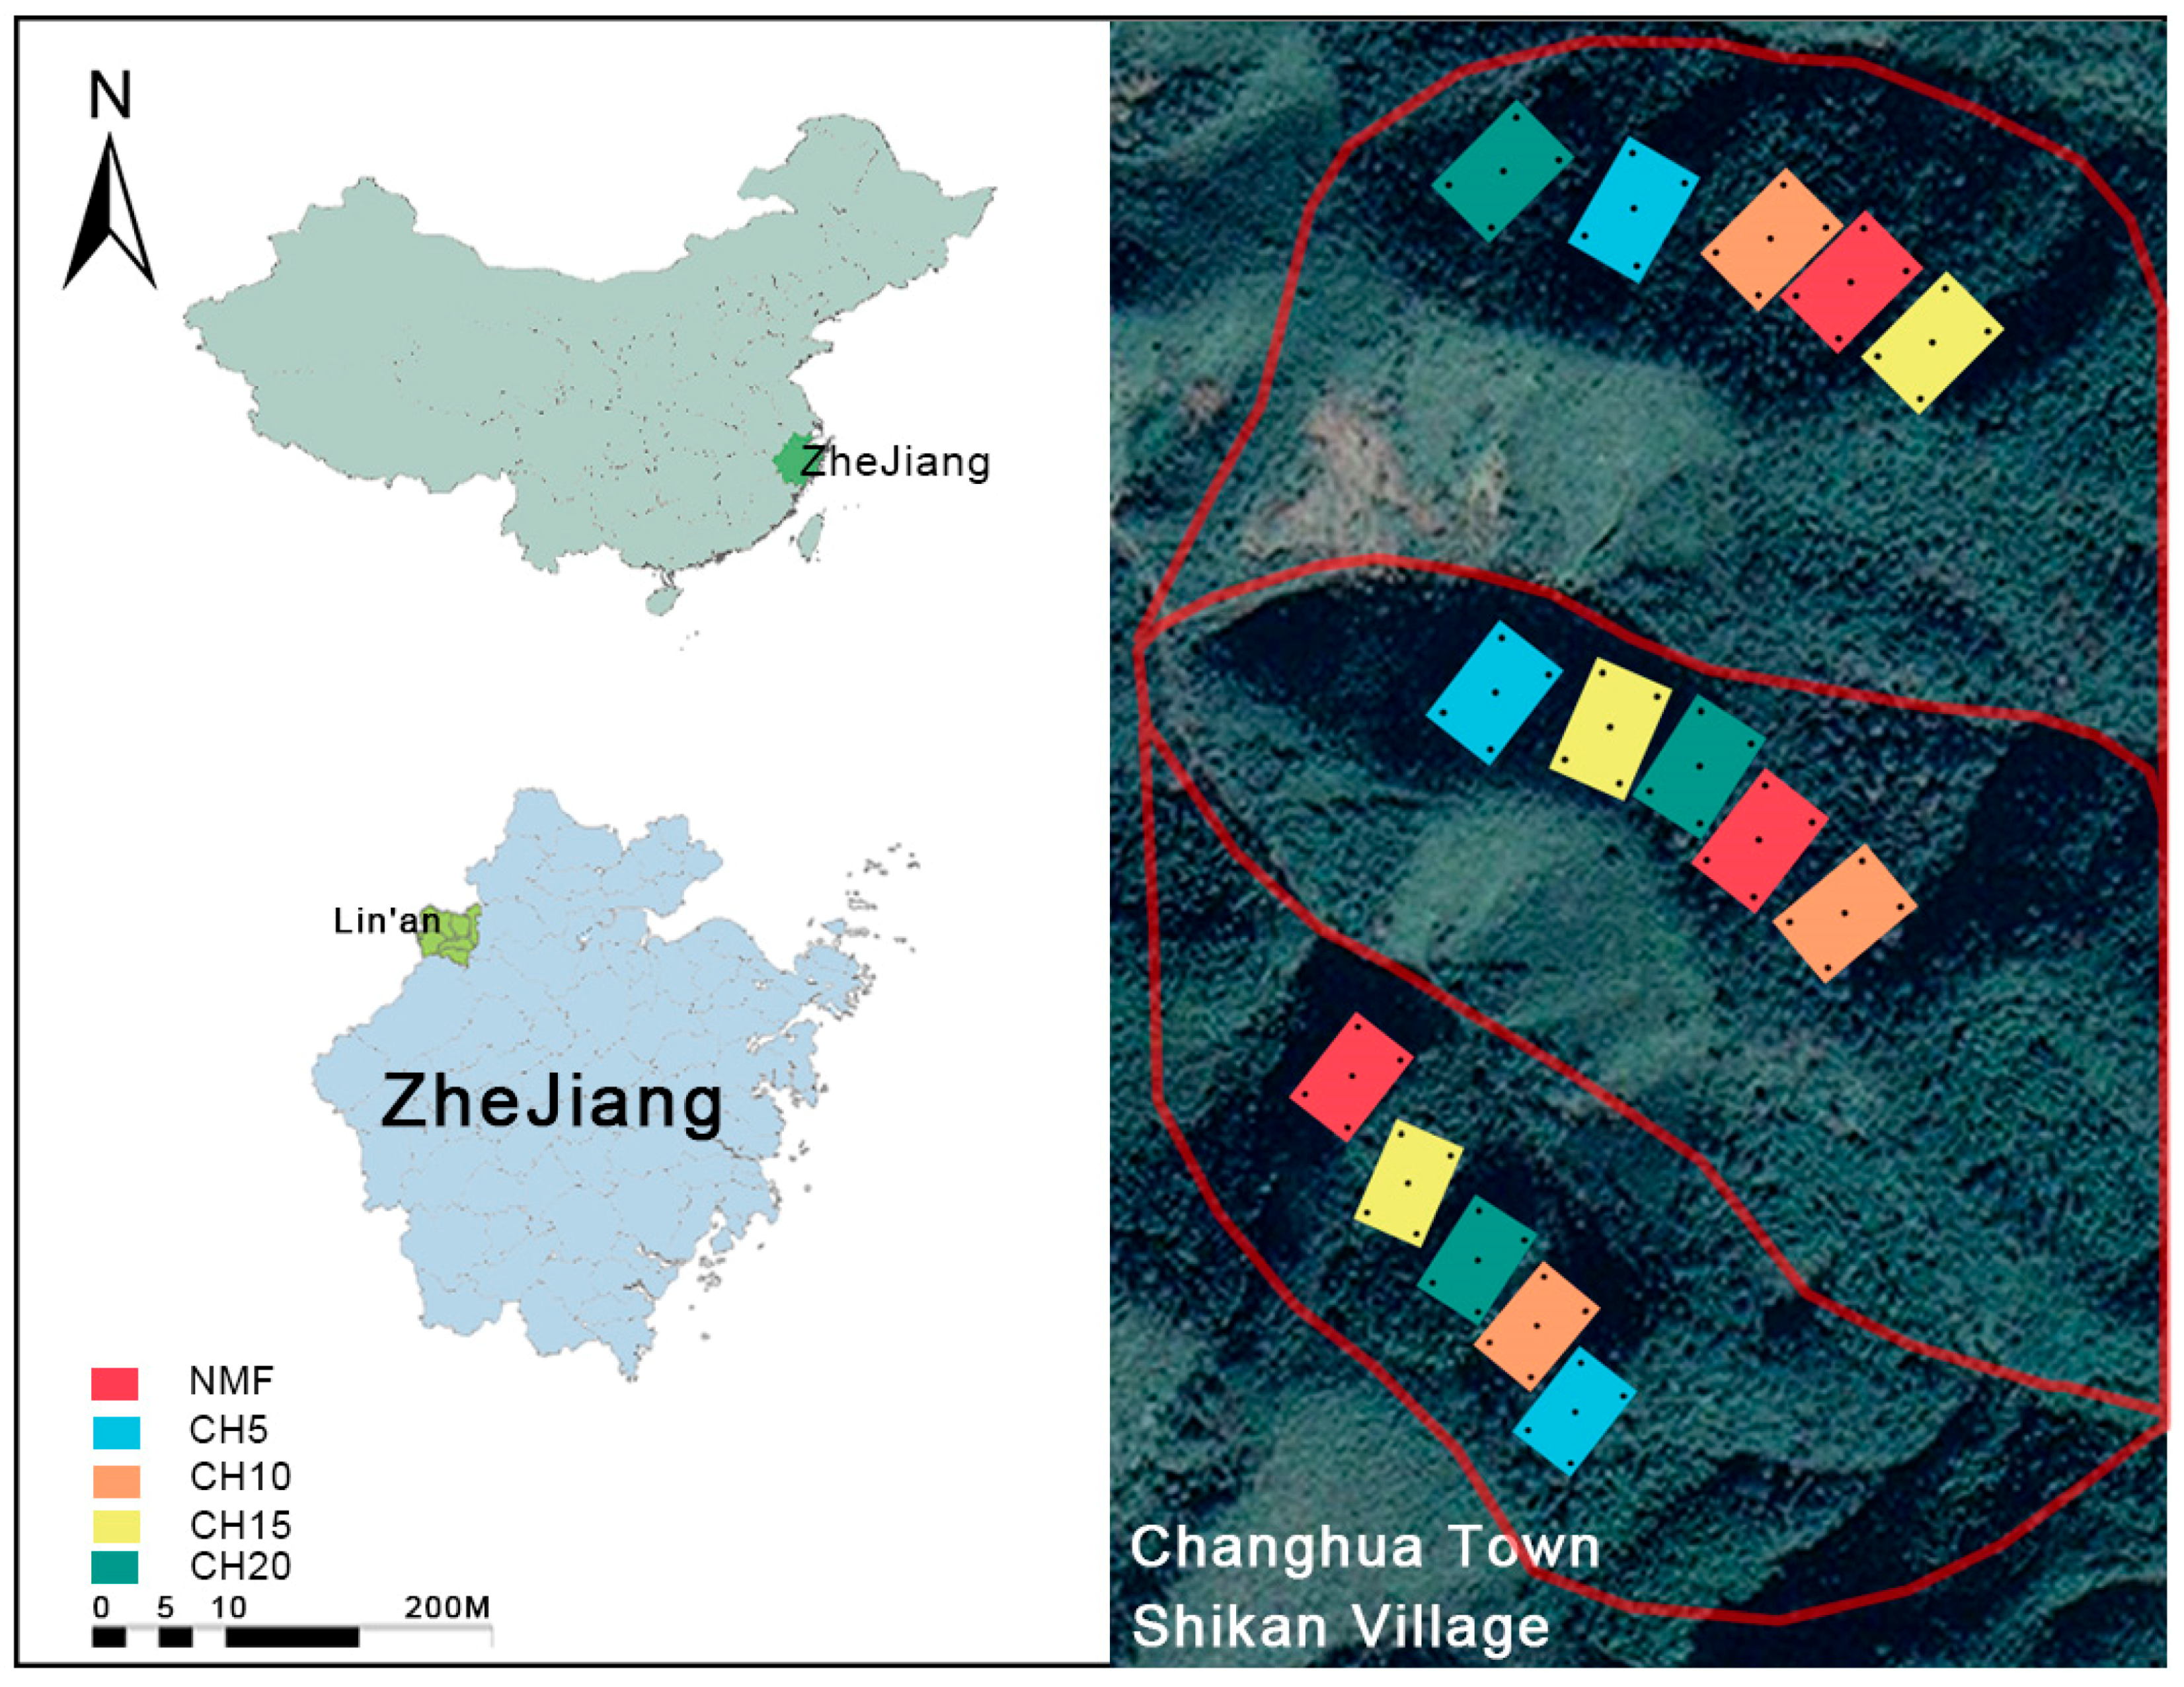
2.1. Research Area Overview

The study area in Shikan, Changhua, Lin’an, Zhejiang (30°03′02′ N,119°08′54″ E; Figure 1) has a typical subtropical monsoon climate with an average annual temperature of 16.4 °C, ranging from −13.3 °C to 41.7 °C. The annual precipitation is 1628 mm. The annual daylight hours and frost-free days are 1774 h and 235 d, respectively. The soil is derived from slate and classified as Ferralsols in the Food and Agriculture Organization (FAO) soil classification system [30]. The studied stands were at an altitude of 200 to 260 m with slopes of about 20° and southwest aspects [31]. The management of the stands included application of compound fertilizer (N:P2O5:K2O = 15:15:15) 600 kg ha−1 in May and early September each year [32].

2.2. Experimental Design

In April 2012, based on Forest Resources Inventory information and a field investigation [31], experimental plots in monospecific Chinese hickory stands with 5 (CH5), 10 (CH10), 15 (CH15), and 20 (CH20) years of intensive management were selected from three watersheds of 42, 45, and 48 ha (Figure 1). Reference plots were in naturally Chinese hickory–broad-leaved mixed forest (NMF) stands adjacent to the monospecific Chinese hickory stands. The original NMF was logged in the 1980s, and since then no more logging has been carried out. The monospecific Chinese hickory stands were all derived from the natural Chinese hickory–broad-leaved mixed forests. The main tree species were Carya cathayensis Sarg, Schima superb Gardn. et Champ., Cyclobalanopsis glauca, and Castanopsis sclerophylla (Lindl.) Schott. in the original natural forest stands (Table 1). There were no shrubs and only a few herbs in the monospecific Chinese hickory stands, and the understory of the mixed forest stands included both shrubs and herbs. Altogether, 15 plots with an area of 1 ha were selected in the watersheds that served as blocks. The slope, gradient, and soil type of the plots in the same block were similar. The basic characteristics of the stands are shown in Table 1. The NMF stands had significantly higher stand densities than that of the intensive managed Chinese hickory stands. The average height and canopy density of NMF stands were similar to those of the CH20 stands.
Soil samples (0–20 cm) were taken using a 10-cm diameter soil sampler from the corners (10 m away from the edge) and middle of each plot and thoroughly mixed to form a composite sample. The soil samples were preserved on ice for 3 hours before being shipped to the laboratory. Each soil sample was passed through a 2-mm nylon mesh. Half of the samples were directly used for microbial analyses. The remaining half of the samples were air-dried and directly used for physico-chemical properties analyses, such as pH, available phosphorus (P), potassium (K), and nitrogen. For total organic carbon determination, the soil was further sieved with a 0.149-mm nylon mesh [33] (Table 2).

2.3. Soil Analyses

The total organic carbon (TOC) content was measured using concentrated H2SO4 and K2Cr2O7, and titrating with Fe(NH4)2(SO4)2·6H2O solution [33,34]. Water-soluble organic carbon (WSOC) content was extracted from 10 g of moist soil at 25 °C. After shaking for 0.5 h at 200 rpm, the samples were centrifuged for 10 min at 20,000 g. The supernatant was filtered through a 0.45-μm membrane [35]. The soil microbial biomass carbon (MBC) content was measured using chloroform fumigation-extraction method [36].
For the 13C-nuclear magnetic resonance (NMR) analysis, the soil samples were pre-treated with hydrofluoric acid [37] and analyzed using nuclear magnetic resonance spectrometry with a 7-mm cross-polarization magic-angle-spinning (CPMAS) detector (Bruker Biospin, Rheinstetten, Baden-Württemberg, Germany), spectral frequency of 75.5 MHz, MAS spinning frequency of 5000 Hz, contact time at 2 ms, and recycle delay time at 2.5 s.
The carbon source usage of soil microbes was analyzed using the Biolog Eco Assay (Biolog, Hayward, CA, USA). The plates were incubated at 25 °C, and color development in each well was recorded as optical density (OD) at 590 nm with a plate reader at regular 24-h intervals [38]. Soil microbial metabolic activity was expressed as the average well color development (AWCD). Shannon (H) and evenness (E) indices were calculated based on carbon source usage [39].

2.4. Statistical Analyses

The data are presented as average ± standard deviation (SD) (n = 3). Statistical differences were tested using analysis of variance (ANOVA) for randomized block design and Duncan’s multiple comparison test in SPSS version 19.0 (IBM, Armonk, NY, USA) [40]. When the ANOVA analysis indicated a significant difference, the Duncan’s multiple comparison test was used to separate the means. An alpha level of 0.05 for significance was used in all statistical analyses, unless mentioned otherwise. Before performing the ANOVA analysis, the normality and homogeneity of raw data were tested, and data were log-transformed if the homogeneity of the variance was not met [41,42,43]. Principal component analysis (PCA) was done using normalized data in the R software (version 3.3.3, Lucent Technologies, Reston, VA, USA). Finally, the Pearson correlation analysis was carried out using SPSS version 19.0. (BM, Armonk, NY, USA).

3. Results

3.1. Soil Organic Carbon Pool

The soil total organic carbon (TOC), microbial biomass carbon (MBC), and water-soluble organic carbon (WSOC) contents were all significantly lower in the intensively managed pure Chinese hickory stands than in the Chinese hickory–broad-leaved mixed forest (p < 0.05) (Table 3). In the managed stands, lower C contents were associated with older stands, yet the difference was not statistically significant.
Compared with the NMF stands, the MBC/TOC ratios were lower in the stands managed intensively for 10, 15, and 20 years (p < 0.05), and the WSOC/TOC ratios were lower in all managed stands (p < 0.05) (Table 3).

3.2. Soil Organic Carbon Structure

The 13C NMR spectrum of organic carbon was divided into seven resonance regions, namely alkyl carbon (0~45 ppm), N-alkyl carbon (45–60 ppm), O-alkyl Carbon (60–90 ppm), acetal carbon (90–110 ppm), aromatic carbon (110–145 ppm), phenolic carbon (145–165 ppm), and carbonyl carbon (165–210 ppm). Compared with the NMF stands, the proportions of N-alkyl carbon in all pure Chinese hickory stands were lower, those of aromatic and phenolic C were higher in 20-year managed stands, and those of carbonyl C were higher in 10-year managed stands (p < 0.05) (Table 4). Compared with the NMF stands, the alkyl C to O-alkyl C ratio was higher in 10-, 15-, and 20-year managed stands, the hydrophilic to hydrophobic C ratio was higher in 15- and 20-year managed stands, and the aliphatic to aromatic C ratio was lower and the aromaticity percentage was higher in the 20-year managed stands (p < 0.05) (Table 4).

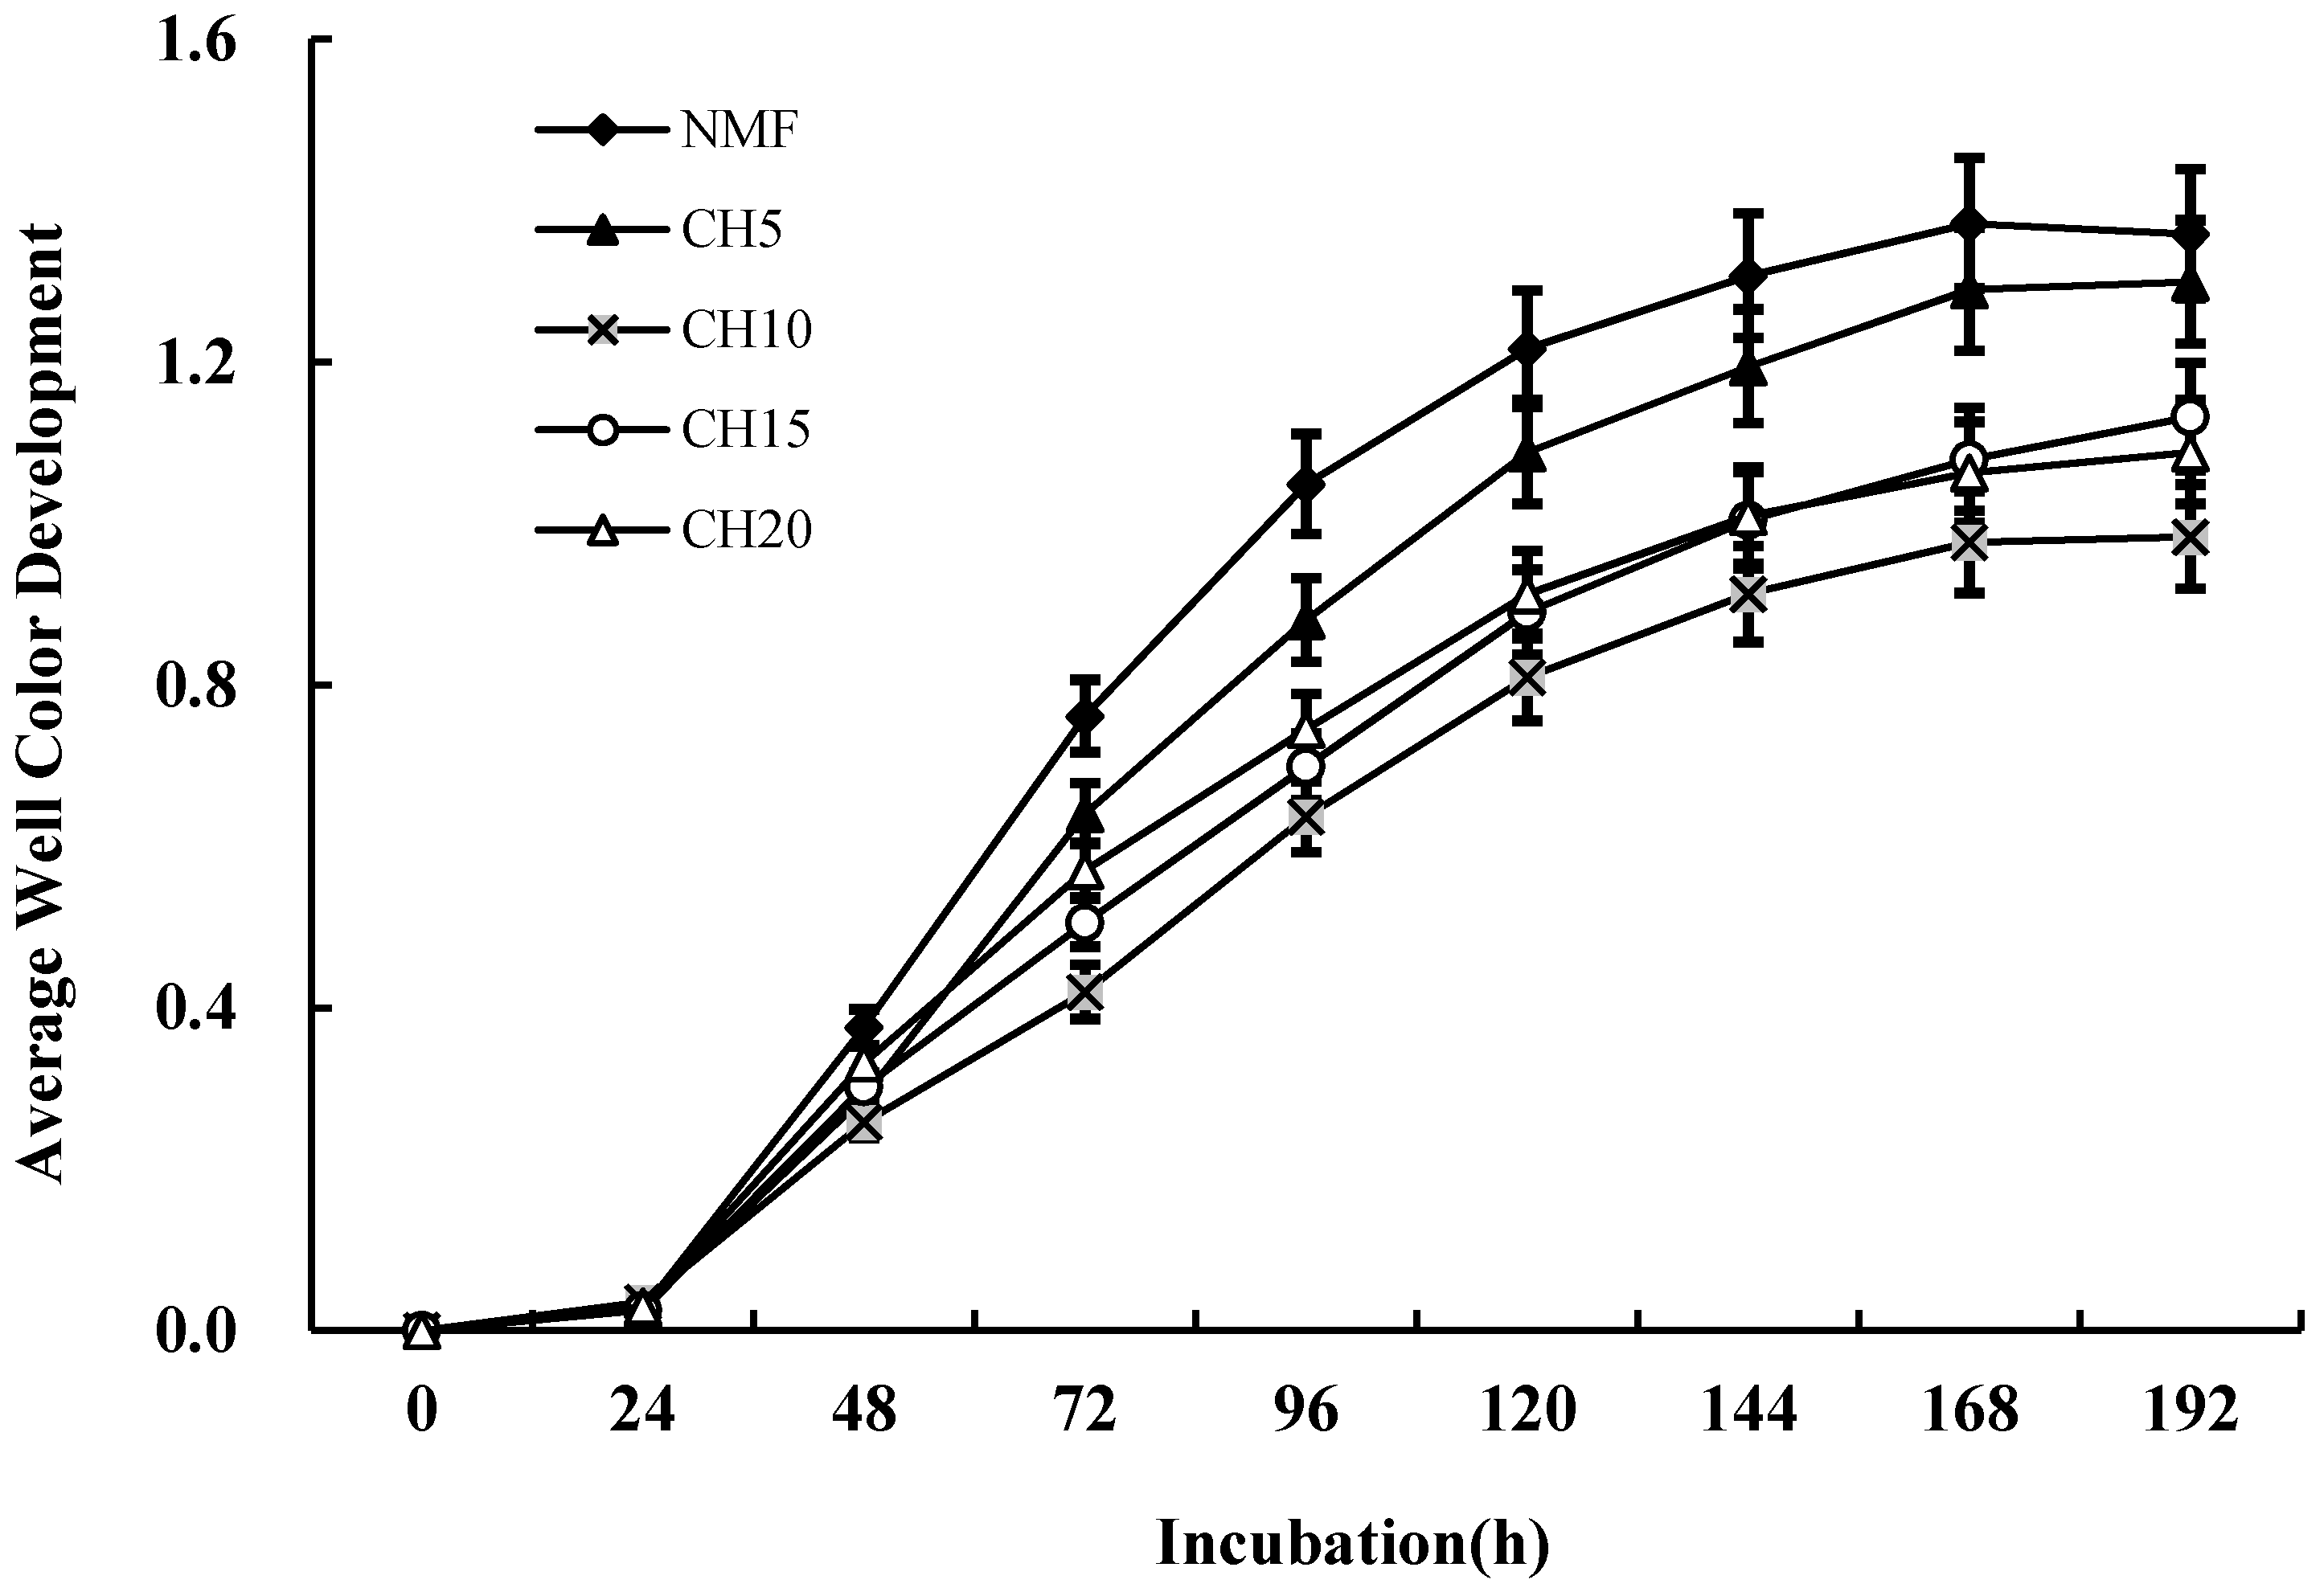
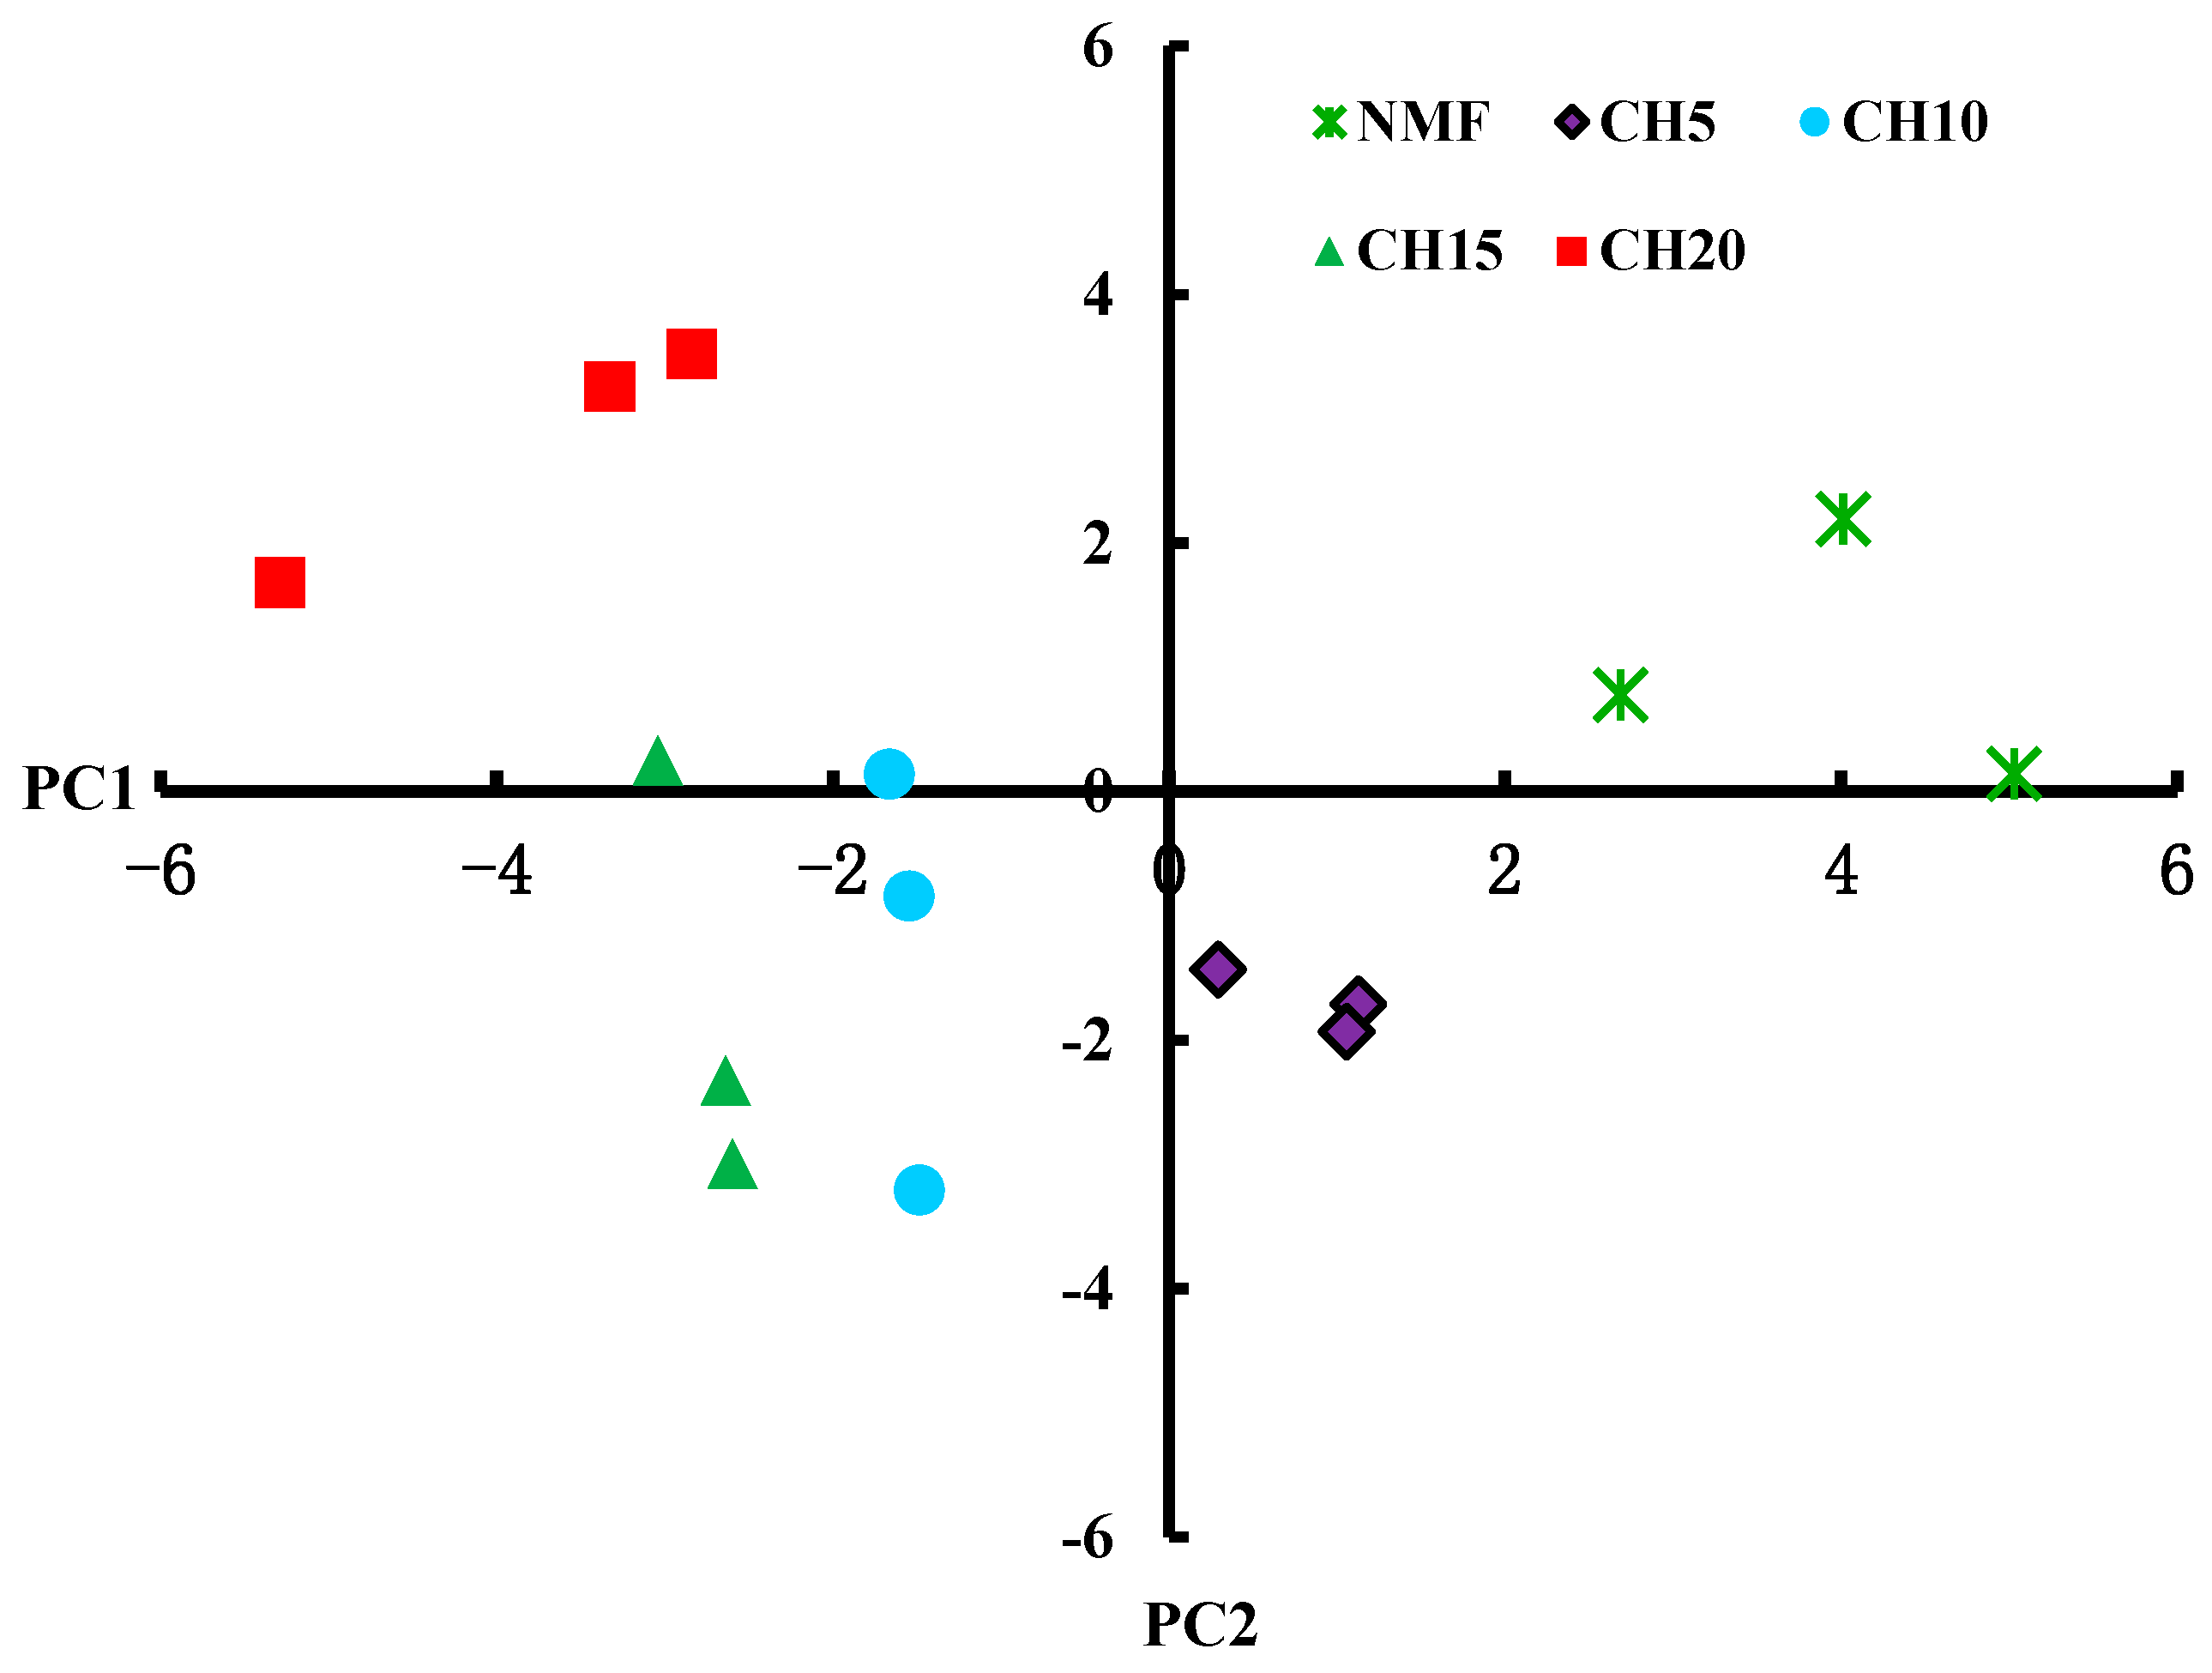
3.3. Differences in Microbial Carbon Source Usage

At the first 24 hours of incubation, no clear differences in AWCD were found among different treatments (Figure 2). As the incubation period increased, the AWCD values rapidly increased. At the incubation duration of 192 h, the average values were 1.358, 1.299, 1.132, 1.088, and 0.983 for NMF, Ch5, CH10, CH15, and CH20 stands, respectively. AWCD values of CH10, CH15, and CH20 stands were significantly lower than those of NMF and CH5 stands (p < 0.05).
Principal component analysis (PCA) based on the carbon source usage at 192 h of incubation separated the NMF samples from the monospecific Chinese hickory stand samples (Figure 3). Furthermore, the longer the management time, the less similar the samples from the monospecific Chinese hickory stands were with the NMF samples, indicating that the microbial community compositions became more different with increasing management time. Compared with the NMF stands and the stands managed intensively for 5 years, the carbon source usage diversities in stands managed for 15 and 20 years were lower and less even (p < 0.05) (Table 5). The diversity correlated positively with TOC, MBC, and WSOC (Table 6).

4. Discussion

4.1. Effects of Intensive Management on Soil Organic Carbon Pool in Chinese Hickory Stands

To estimate the effects of intensive management and management time on soil quality in Chinese hickory stands, we analyzed soil organic carbon contents and microbial carbon source usage in intensively managed Chinese hickory stands and in reference Chinese hickory–broad-leaved mixed forest stands. In our study, the TOC, MBC, and WSOC contents and MBC to TOC ratio were significantly lower in the intensively managed pure Chinese hickory stands than in the Chinese hickory–broadleaved mixed forest stands. Similarly, a comparison of soil organic carbon (SOC) contents in Chinese hickory plantations in 1982 and 2008 indicated that the SOC contents were declining [44,45,46,47]. In a Chinese fir chronosequence in southern China, even in 88-year-old plantations the topsoil microbial biomass carbon (MBC) content and MBC to total organic carbon (TOC) ratio were lower than in natural forest [48]. Presumably, the higher canopy density and the understory shrubs in the NMF result in more litter that can maintain and increase the organic carbon content. In addition, as noticed in Chinese fir plantations in southern China [48], the SOC turnover time may be shorter in plantations. Since the lower canopy density results in higher soil temperature, which increases the decomposition rate of organic matter [17], the decomposition rate of organic matter may be higher before canopy closure. Contrary to Caragana, Hippophae, and Prunus plantations in the temperate Loess Plateau of China, where the SOC contents were higher in older plantations [19], in our study the C contents in the Chinese hickory stands remained similar, suggesting that the TOC contents could not be expected to increase under intensive management.
In the soil organic carbon, decomposition increases the relative abundance of alkyl C [49,50], which in turn increases the proportion of hydrophobic C [51,52]. A high proportion of aliphatic C indicates simpler molecular structures that are more readily decomposed, whereas a high proportion of aromatic C contents indicates complicated structures that are more resistant to decomposition. Land use change from agriculture to aspen plantations was accompanied with a decrease in the proportion of labile C, but at the same time the SOC contents were at the same level and MBC content was higher in the 9-year-old plantations than in the 2-year-old plantations [44]. In our study, compared with the Chinese hickory–broad-leaved mixed forest stands, in the 20-year-old pure Chinese hickory stands the ratios of alkyl to O-alkyl C and hydrophobic to hydrophilic C, as well as the proportion of aromatic C, were higher, suggesting that the decomposition rate of labile organic carbon was exceeding the input rate and that the plantations could not be expected to undergo SOC buildup, possibly due to the intensive management, such as shrub and weed removal and the application of synthetic fertilizers, pesticides, and herbicides.

4.2. Effects of Intensive Management on Soil Microbial Functional Diversity

Differences in carbon source usage patterns indicate differences in the structure of soil microbial communities [53]. Even relatively short-term changes in the management of agricultural soil were detected as changes in carbon source usage [54]. In our study, the diversity in soil microbial carbon source usage was lower in monospecific Chinese hickory stands that were ten or more years old than in the Chinese hickory–broad-leaved mixed forest stands. The reasons for this difference may be the above-ground plant community composition that affects soil microbiome through, for example, litter deposition and root exudates [55,56,57,58], and the overall lower organic carbon content. Another possible explanation is the different structure of soil organic C in the stands managed intensively for the longest period of time; lower proportions of easily degradable compounds may have resulted in lower abundances of microbe functional groups that decompose these compounds. Contrary to results from rubber plantations in Malaysia, where the microbial diversities in plantations and rainforest were similar despite the different community compositions [24,59], in our study diversities were lower in managed stands than in the mixed forest. The diversities were lowest in the plantations managed intensively for fifteen and twenty years, possibly due to the application of herbicides in the Chinese hickory plantation management. The herbicides may have either directly or indirectly affected the soil microbial communities through the decreased amount of litter return due to the lack of shrub layer.

5. Conclusions

Soil total organic carbon (TOC) contents were lower in the intensively managed monospecific Chinese hickory stands than in the Chinese hickory–broad-leaved mixed forest stands. The results suggest that the TOC contents in the managed stands could not be expected to increase under intensive management. Structural analysis revealed that the proportion of stable C structures was higher in the 20-year managed stands than in the NMF stands, indicating that the decomposition rate of labile organic carbon was exceeding the input rate. The lower TOC contents in the managed stands were accompanied with lower diversity in carbon source usage by the soil microbial communities. The results call for a change in the management of the hickory stands to increase the soil carbon content and restore microbial diversity.

Author Contributions

Conceptualization: W.W. and H.L.; methodology: Y.L.; software: K.Z.; validation: P.P.; writing—original draft preparation: W.W. and J.J.; writing—review and editing: W.F. and J.W.; supervision: J.W.; project administration: W.F.; funding acquisition: J.W.

Funding

This study was financially supported by the National Natural Science Foundation of China (No. 41201323) and Zhejiang Key Scientific and Technological Innovation Group (No. 2009R50033).

Acknowledgments

We thank Xinbiao Qian for his help in the laboratory analysis, Huan Liu for her contribution to the field work and Jiaqi Dong for her contribution to the location map producing.

Conflicts of Interest

The authors declare no conflict of interest.

References

  1. Lal, R. Social values of soil carbon. J. Soil Water Conserv. 2014, 69, 186A–192A. [Google Scholar] [CrossRef]
  2. Dai, W.; Fu, W.; Jiang, P.; Zhao, K.; Li, Y.; Tao, J. Spatial pattern of carbon stocks in forest ecosystems of a typical subtropical region of southeastern China. For. Ecol. Manag. 2018, 409, 288–297. [Google Scholar] [CrossRef]
  3. Doran, J.W.; Parkin, T.B. Defining and assessing soil quality. In Defining Soil Quality for a Sustainable Environment; Doran, J.W., Ed.; Soil Sci. Soc. Am Publication No. 35; SSSA: Madison, WI, USA, 1994; pp. 3–21. [Google Scholar]
  4. Catoni, M.; D’Amico, M.E.; Zanini, E.; Bonifacio, E. Effect of pedogenic processes and formation factors on organic matter stabilization in alpine forest soils. Geoderma 2016, 263, 151–160. [Google Scholar] [CrossRef]
  5. Zhang, C.; Xia, B.C.; Lin, J.Y. A basin-scale estimation of carbon stocks of a forest ecosystem characterized by spatial distribution and contributive features in the Liuxihe river basin of Pearl river delta. Forests 2016, 7, 299. [Google Scholar] [CrossRef]
  6. Guillaume, T.; Maranguit, D.; Murtilaksono, K.; Kuzyakov, Y. Sensitivity and resistance of soil fertility indicators to land-use changes: New concept and examples from conversion of Indonesian rainforest to plantations. Ecol. Indic. 2016, 67, 49–57. [Google Scholar] [CrossRef]
  7. Fu, W.J.; Zhao, K.L.; Zhang, C.S.; Wu, J.S.; Tunney, H. Outlier identification of soil phosphorus and its implication for spatial structure modeling. Precis. Agric. 2016, 17, 121–135. [Google Scholar] [CrossRef]
  8. Huang, Z.Q.; Selvalakshmi, S.; Vasu, D.; Liu, Q.Q.; Cheng, H.; Guo, F.T.; Ma, X.Q. Identification of indicators for evaluating and monitoring the effects of Chinese fir monoculture plantations on soil quality. Ecol. Indic. 2018, 93, 547–554. [Google Scholar]
  9. Sofo, A.; Ricciuti, P.; Fausto, C.; Mininni, A.; Grecchio, C.; Scagliola, M.; Malerba, A.D.; Xiloyannis, C.; Dichio, B. The metabolic and genetic diversity of soil bacterial communities depends on the soil management system and C/N dynamics: The case of sustainable and conventional olive groves. Appl. Soil Ecol. 2019, 137, 21–28. [Google Scholar] [CrossRef]
  10. Sayer, E.J. Using experimental manipulation to assess the roles of leaf litter in the functioning of forest ecosystems. Biol. Rev. 2006, 81, 1–31. [Google Scholar] [CrossRef] [PubMed]
  11. Wiesmeier, M.; Urbanskia, L.; Hobleya, E.; Langc, B.; von Lützowa, M.; Marin-Spiottad, E.; van Wesemaele, B.; Rabotf, E.; Ließ, M.; Garcia-Franco, N.; Wollschläger, U.; et al. Soil organic carbon storage as a key function of soils—A review of drivers and indicators at various scales. Geoderma 2019, 333, 149–162. [Google Scholar] [CrossRef]
  12. Burton, J.; Chen, C.R.; Xu, Z.H.; Ghadiri, H. Soil microbial biomass, activity and community composition in adjacent native and plantation forests of subtropical Australia. J. Soils Sediments 2010, 10, 1267–1277. [Google Scholar] [CrossRef]
  13. Fan, S.H.; Guan, F.Y.; Xu, X.L.; Forrester, D.; Ma, W.; Tang, X.L. Ecosystem carbon stock loss after land use change in subtropical forests in China. Forests 2016, 7, 142. [Google Scholar] [CrossRef]
  14. Mellin, C.; MacNeil, M.; Cheal, A.; Emslie, M.; Caley, M. Marine Protected Areas Increase Resilience among Coral Reef Communities. Ecol. Lett. 2016, 19, 626–637. [Google Scholar] [CrossRef] [PubMed]
  15. Zhao, K.L.; Fu, W.J.; Ye, Z.Q.; Zhang, C.S. Contamination and spatial variation of heavy metals in the soil-rice system in Nanxun County, southeastern China. Int. J. Environ. Res. Public Health 2015, 12, 1577–1594. [Google Scholar] [CrossRef]
  16. Burns, R.; De Forest, J.; Marxsen, J.; Sinsabaugh, R.L.; Stromberger, M.E.; Wallenstein, M.D.; Weintraub, M.N.; Zoppini, A. Soil enzymes in a changing environment: Current knowledge and future directions. Soil Biol. Biochem. 2013, 58, 216–234. [Google Scholar] [CrossRef]
  17. Yang, K.; Shi, W.; Zhu, J.J. The impact of secondary forests conversion into larch plantations on soil chemical and microbiological properties. Plant Soil 2013, 368, 535–546. [Google Scholar] [CrossRef]
  18. Zhao, K.L.; Fu, W.J.; Liu, X.M.; Zhang, C.S.; Ye, Z.Q.; Xu, J.M. Spatial variations of concentrations of Copper and its speciation in the soil-rice system in Wenling of southeastern China. Environ. Sci. Pollut. Res. 2014, 21, 7165–7176. [Google Scholar] [CrossRef] [PubMed]
  19. Dang, X.H.; Liu, G.B.; Zhao, L.; Zhao, G.C. The response of carbon storage to the age of three forest plantations in the Loess Hilly Regions of China. Catena 2017, 159, 106–114. [Google Scholar] [CrossRef]
  20. Arevalo, C.B.M.; Bhatti, J.S.; Chang, S.X.; Sidders, D. Ecosystem carbon stocks and distribution under different land-use in north central Alberta. For. Ecol. Manag. 2009, 257, 1776–1785. [Google Scholar] [CrossRef]
  21. Fang, X.; Zhang, J.; Meng, M.; Guo, X.; Wu, Y.; Liu, X.; Zhao, K.; Ding, L.; Shao, Y.; Fu, W. Forest-type shift and subsequent intensive management affected soil organic carbon and microbial community in southeastern China. Eur. J. For. Res. 2017, 136, 689–697. [Google Scholar] [CrossRef]
  22. Fu, W.J.; Zhao, K.L.; Tunney, H.; Zhang, C.S. Using GIS and Geostatistics to Optimize Soil Phosphor and Magnesium Sampling in Temperate Grassland. Soil Sci. 2013, 178, 240–247. [Google Scholar] [CrossRef]
  23. Monkai, J.; Goldberg, S.; Hyde, K.D.; Harrison, R.D.; Mortimer, P.E.; Xu, J.C. Natural forests maintain a greater soil microbial diversity than that in rubber plantations in Southwest China. Agric. Ecosyst. Environ. 2018, 265, 190–197. [Google Scholar] [CrossRef]
  24. Dorsaf, K.; Tripathi, B.M.; Dong, K.; Go, R.; Adams, J.M. Rainforest Conversion to Rubber Plantation May Not Result in Lower Soil Diversity of Bacteria, Fungi, and Nematodes. Microb. Ecol. 2016, 72, 359–371. [Google Scholar]
  25. Alberti, G.; Fornasier, C.N.; Scherer-Lorenzen, M.; Nobili, M.; Peressotti, A.; Hoenig, L.; Bruelheide, H.; Bauhus, J. Tree functional diversity influences belowground ecosystem functioning. Appl. Soil Ecol. 2017, 120, 160–168. [Google Scholar] [CrossRef]
  26. Wu, J.S.; Lin, H.P.; Meng, C.F.; Jiang, P.K.; Fu, W.J. Effects of intercropping grasses on soil organic carbon and microbial community functional diversity under Chinese hickory (Carya cathayensis Sarg.) stands. Soil Res. 2014, 52, 575–583. [Google Scholar] [CrossRef]
  27. Fu, W.; Fu, Z.; Ge, H.; Ji, B.; Jiang, P.; Li, Y.; Wu, J.; Zhao, K. Spatial variation of biomass carbon density in a subtropical region of southeastern China. Forests 2015, 6, 1966–1981. [Google Scholar] [CrossRef]
  28. Wang, Z.J.; Huang, X.Z.; Tang, X.H.; Hang, J.Q.; Qian, L.F.; Li, Z.J. Analysis on economic and ecological benefits of no-tillage management of Carya cathayensis. Acta Ecol. Sin. 2011, 31, 2281–2289. (In Chinese) [Google Scholar]
  29. Li, Y.F.; Hu, S.D.; Chen, J.H.; Müller, K.; Li, Y.C.; Fu, W.J.; Lin, Z.W.; Wang, H.L. Effects of biochar application in forest ecosystems on soil properties and greenhouse gas emissions: A review. J. Soils Sediments 2018, 18, 546–563. [Google Scholar] [CrossRef]
  30. World Reference Base for Soil Resources (WRB). A Framework for International Classification, Correlation and Communication; Food and Agriculture Organization of the United Nations: Rome, Italy, 2006. [Google Scholar]
  31. Wu, J.S. Study on the Characteristics of Soil Organic Carbon under Carya cathayensis Stands. Ph.D. Thesis, Nanjing Forestry University, Nanjing, China, 2014. (In Chinese). [Google Scholar]
  32. Dai, W.; Zhao, K.; Fu, W.; Jiang, P.; Li, Y.; Zhang, C.; Gielen, G.; Gong, X.; Li, Y.; Wang, H.; et al. Spatial variation of organic carbon density in topsoils of a typical subtropical forest, southeastern China. Catena 2018, 167, 181–189. [Google Scholar] [CrossRef]
  33. Lu, R.K. Analytical Methods for Soil and Agro-Chemistry; China Agr Sci. Technol. Press: Beijing, China, 1999. (In Chinese) [Google Scholar]
  34. Dai, W.; Li, Y.; Fu, W.; Jiang, P.; Zhao, K.; Li, Y.; Penttinen, P. Spatial variability of soil nutrients in forest areas: A case study from subtropical China. J. Plant Nutr. Soil Sci. 2018, 181, 827–835. [Google Scholar] [CrossRef]
  35. Liang, B.C.; Mackenzie, A.F.; Schnitzer, M. Management-induced change in labile soil organic matter under continuous corn in eastern Canadian soils. Biol. Fertil. Soils 1998, 26, 88–94. [Google Scholar] [CrossRef]
  36. Brookes, P.C.; Landman, A.; Pruden, G.; Jenkinson, D.S. Chloroform fumigation and the release of soil nitrogen: A rapid direct extraction method to measure microbial biomass nitrogen in soil. Soil Biol. Biochem. 1985, 17, 837–842. [Google Scholar] [CrossRef]
  37. Mathers, N.J.; Xu, Z.H.; Berners-Price, S.J.; Perera, S.; Saffigna, P.G. Hydrofluoric acid pre-treatment for improving 13C CPMAS NMR spectral quality of forest soils in southeast Queensland, Australia. Aust. J. Soil Res. 2002, 40, 655–674. [Google Scholar]
  38. Gomez, E.; Ferreras, L.; Toresani, S. Soil bacterial functional diversity as influenced by organic amendment application. Bioresour. Technol. 2006, 97, 1484–1489. [Google Scholar] [CrossRef]
  39. Selmants, P.C.; Hart, S.C.; Boyle, S.I.; Stark, J.M. Red alder (Alnus rubra) alters community-level soil microbial function in conifer forests of the Pacific Northwest, USA. Soil Biol. Biochem. 2005, 37, 1860–1868. [Google Scholar] [CrossRef]
  40. Fu, W.; Fu, Z.; Zhao, K.; Tunney, H.; Zhang, C. Variation of soil P and other nutrients in a long-term grazed grassland P experiment field. Arch. Agron. Soil Sci. 2014, 60, 1459–1466. [Google Scholar] [CrossRef]
  41. Zhao, K.L.; Fu, W.J.; Qiu, Q.Z.; Ye, Z.Q.; Li, Y.F.; Tunney, H.; Dou, C.Y.; Zhou, K.N.; Qian, X.B. Spatial patterns of potentially hazardous metals in paddy soils in a typical electrical waste dismantling area and their pollution characteristics. Geoderma 2019, 337, 453–462. [Google Scholar] [CrossRef]
  42. Fu, W.J.; Tunney, H.; Zhang, C.S. Spatial variation of soil nutrients in a dairy farm and its implications for site-specific fertilizer application. Soil Tillage Res. 2010, 106, 185–193. [Google Scholar] [CrossRef]
  43. Fu, W.J.; Zhao, K.L.; Tunney, H.; Zhang, C.S. Using Moran’s I and geostatistics to identify spatial patterns of soil nutrients in two different long-term phosphorus application plots. J. Plant Nutr. Soil Sci. 2011, 174, 785–798. [Google Scholar] [CrossRef]
  44. Mujuru, L.; Gotora, T.; Velthorst, E.J.; Nyamangara, J.; Hoosbeek, M.R. Soil carbon and nitrogen sequestration over an age sequence of Pinus patula plantations in Zimbabwean Eastern Highlands. For. Ecol. Manag. 2014, 303, 254–265. [Google Scholar] [CrossRef]
  45. Battle-Bayer, L.; Batjes, N.H.; Bindraban, P.S. Changes in organic carbon stocks upon land use conversion in the Brazilian Cerrado. Agric. Ecosyst. Environ. 2010, 137, 47–58. [Google Scholar] [CrossRef]
  46. Fu, W.J.; Jiang, P.K.; Zhao, K.L.; Zhou, G.M.; Li, Y.F.; Wu, J.S.; Du, H.Q. The carbon storage in Moso Bamboo plantation and its spatial variation in Anji County of southeastern China. J. Soils Sediments 2014, 14, 320–329. [Google Scholar] [CrossRef]
  47. Wu, J.S.; Huang, J.Q.; Liu, D.; Li, J.W.; Zhang, J.C.; Wang, H.L. Effect of 26 Years of Intensively Managed Carya cathayensis Stands on Soil Organic Carbon and Fertility. Sci. World J. 2014. [Google Scholar] [CrossRef]
  48. Chen, G.S.; Yang, Y.S.; Yang, Z.J.; Xie, J.S.; Guo, J.F.; Gao, R.; Yin, Y.F.; Robinson, D. Accelerated soil carbon turnover under tree plantations limits soil carbon storage. Sci. Rep. 2016, 6, 19693. [Google Scholar] [CrossRef] [PubMed] [Green Version]
  49. Wu, J.S.; Jiang, P.K.; Chang, S.X.; Xu, Q.F.; Lin, Y. Dissolved soil organic carbon and nitrogen were affected by conversion of native forests to plantations in subtropical China. Can. J. Soil Sci. 2010, 90, 27–36. [Google Scholar] [CrossRef] [Green Version]
  50. Ussira, D.A.N.; Johnson, C.E. Characterization organic mater in a northern hardwood forest soil by 13C NMR spectroscopy and chemical methods. Geoderma 2003, 111, 123–149. [Google Scholar] [CrossRef]
  51. Spaccini, R.; Mbagwu, J.S.C.; Conte, P.; Piccolo, A. Changes of humic substances characteristics from forested to cultivated soils in Ethiopia. Geoderma 2006, 132, 9–19. [Google Scholar] [CrossRef]
  52. Spaccini, R.; Piccolo, A.; Haberhauer, G.; Gerzabek, M.H. Transformation of organic matter from maize residues into labile and humic fractions of three European soils as revealed by 13C distribution and CPMAS-NMR spectra. Eur. J. Soil Sci. 2000, 51, 583–594. [Google Scholar] [CrossRef]
  53. Garland, J.L. Analysis and interpretation of community-level physiological profiles in microbial ecology. Microb. Ecol. 1997, 24, 289–300. [Google Scholar] [CrossRef]
  54. Bending, G.D.; Putland, C.; Rayns, F. Changes in microbial community metabolism and labile organic matter fractions as early indicators of the impact of management on soil biological quality. Biol. Fertil. Soils 2000, 31, 78–84. [Google Scholar] [CrossRef]
  55. Kowalchuk, G.A.; Buma, D.S.; De Boer, W.; Kinkhamer, P.G.L.; Veen, J.A.V. Effects of above-ground plant species composition and diversity on the diversity of soil-borne microorganisms. Anton. Leeuw. 2002, 81, 509–520. [Google Scholar] [CrossRef]
  56. He, M.J.; Shen, H.R.; Li, Z.T.; Wang, L.; Wang, F.; Zhao, K.L.; Liu, X.M.; Wendroth, O.; Xu, J.M. Ten-year regional monitoring of soil-rice grain contamination by heavy metals with implications for target remediation and food safety. Environ. Pollut. 2019, 244, 431–439. [Google Scholar] [CrossRef]
  57. Yu, S.Y.; Chen, Z.L.; Zhao, K.L.; Ye, Z.Q.; Zhang, L.Y.; Dong, J.Q.; Shao, Y.F.; Zhang, C.S.; Fu, W.J. Spatial Patterns of Potentially Hazardous Metals in Soils of Lin’an City, Southeastern China. Int. J. Environ. Res. Public Health 2019, 16, 246. [Google Scholar] [CrossRef]
  58. Johal, G.S.; Huber, D.M. Glyphosate effects on diseases of plants. Eur. J. Agron. 2009, 31, 144–152. [Google Scholar] [CrossRef]
  59. Wang, L.; Li, J.; Yang, F.; E, Y.Y.; Raza, W.; Huang, Q.W.; Shen, Q.R. Application of bioorganic fertilizer significantly increased apple yields and shaped bacterial community structure in orchard soil. Microb. Ecol. 2017, 73, 404–416. [Google Scholar] [CrossRef]
Figure 1. Study area with the experimental plot layout. NMF: Chinese hickory–broad-leaved mixed forest; CH5, CH10, CH15, CH20: monospecific Chinese hickory stands with 5, 10, 15, and 20 years of intensive management, respectively.
Forests 10 00357 g001
Figure 2. Average well color development (AWCD) of soil microorganisms from natural broad-leaved forest (NMF) stands and Chinese hickory stands managed intensively for 5 (CH5), 10 (CH10), 15 (CH15), and 20 (CH20) years.
Forests 10 00357 g002
Figure 3. Principal component analysis of carbon source usage by soil microorganisms in Chinese hickory stands managed intensively for 5 (CH5), 10 (CH10), 15 (CH15), and 20 (CH20) years, and Chinese hickory–broad-leaved mixed forest (NMF) stands.
Forests 10 00357 g003
Table 1. Basic characteristics of experimental plots in Chinese hickory stands managed intensively for 5, 10, 15, and 20 years, and in Chinese hickory–broad-leaved mixed forest.
Stand TypesStand Density (tree ha−1)DBH (cm)Height (m)Canopy Density (%)Canopy StructureMain Tree Species
CH5450 ± 50 b6.0 ± 1.0 c5.0 ± 0.6 b30 ± 5 dTrees + herbsC. cathayensis
CH10450 ± 45 b8.0 ± 1.2 b6.0 ± 0.7 b50 ± 8 cTrees + herbsC. cathayensis
CH15450 ± 40 b10.0 ± 1.3 ab7.0 ± 0.6 ab70 ± 9 bTrees + herbsC. cathayensis
CH20435 ± 38 b12.0 ± 1.2 a8.0 ± 0.8 a80 ± 10 aTrees + herbsC. cathayensis
NMF1350 ± 120 a10.0 ± 2.5 ab8.0 ± 1.3 a80 ± 12 aTrees + shrubs + herbsC. cathayensis, Schima superb, Cyclobalanopsis glauca, Castanopsis sclerophylla
CH5, CH10, CH15, CH20: Chinese hickory under 5-, 10-, 15-, 20-year intensive management, respectively; NMF: natural Chinese hickory–broad-leaved mixed forest; DBH: diameter at breast height. Different letters in the same column indicate significant difference at p < 0.05 (n = 3).
Table 2. Physical and chemical properties of soils (0–20 cm) in Chinese hickory stands managed intensively for 5, 10, 15, and 20 years, and in Chinese hickory–broad-leaved mixed forest.
Stand TypespHAN
(mg kg−1)
AP
(mg kg−1)
AK
(mg kg−1)
Sand
(%)
Silt
(%)
Clay
(%)
Soil Texture ClassBD
(g cm−3)
CH55.7 ± 0.1 a 179.6 ± 13.4 a3.7 ± 0.4 c 120.8 ± 18.3 ab 26.5 ± 2.8 a52.3 ± 3.9 a21.2 ± 1.5 asilt loam1.05 ± 0.08 a
CH105.8 ± 0.3 a175.7 ± 15.3 a4.7 ± 0.8 b 125.0 ± 20.6 ab27.4 ± 3.6 a51.6 ± 2.8 a21.0 ± 3.2 asilt loam1.07 ± 0.10 a
CH155.8 ± 0.2 a 161.8 ± 10.6 ab4.9 ± 1.0 b 131.7 ± 17.6 a29.6 ± 2.8 a50.0 ± 1.6 a20.4 ± 1.8 asilt loam1.10 ± 0.11 a
CH205.6 ± 0.3 a145.1 ± 12.1 b6.7 ± 1.5 a 119.2 ± 10.3 b30.5 ± 4.5 a49.3 ± 1.5 a20.2 ± 2.0 aloam1.15 ± 0.12 a
NMF5.6 ± 0.2 a 150.6 ± 12.8 b3.5 ± 0.3 c 124.2 ± 18.9 ab 26.2 ± 2.4 a52.1 ± 3.4 a21.7 ± 2.3 asilt loam1.03 ± 0.06 a
CH5, CH10, Ch15, CH20: Chinese hickory under 5-, 10-, 15-, 20-year intensive management, respectively; NMF: natural Chinese hickory–broad-leaved mixed forest; AN: available nitrogen; AP: available phosphorus; AK: available potassium; BD: bulk density. Different letters in the same column indicate significant difference at p < 0.05 (n = 3).
Table 3. Soil organic carbon content in Chinese hickory stands managed intensively for 5, 10, 15, and 20 years, and in Chinese hickory–broad-leaved mixed forest stands.
Stand TypesTOC
(g kg−1)
MBC
(mg kg−1)
WSOC
(mg kg−1)
MBC/TOC
(%)
WSOC/TOC
(%)
CH520.17 ± 2.01 b148.83 ± 13.23 b117.62 ± 12.31 b0.7 ± 0.1 ab0.6 ± 0.1 b
CH1019.39 ± 3.01 b134.75 ± 14.42 b107.77 ± 12.42 b0.6 ± 0.0 b0.6 ± 0.1 b
CH1518.15 ± 0.91 b123.73 ± 13.25 b96.52 ± 10.35 b0.6 ± 0.0 b0.5 ± 0.1 b
CH2017.28 ± 2.34 b115.39 ± 12.37 b90.39 ± 11.87 b0.6 ± 0.0 b0.5 ± 0.0 b
NMF28.16 ± 1.91 a225.84 ± 23.75 a251.80 ± 24.25 a0.8 ± 0.1 a0.9 ± 0.1 a
CH5, CH10, Ch15, CH20: Chinese hickory under 5-, 10-, 15-, 20-year intensive management, respectively; NMF: natural Chinese hickory–broad-leaved mixed forest; TOC: total organic carbon; MBC: microbial biomass carbon; WSOC: water-soluble organic carbon. Different letters in the same column indicate significant difference at p < 0.05 (n = 3).
Table 4. Signal intensity distribution of different carbon fractions in the 13C NMR spectra of soil organic carbon from natural broad-leaved forest and Chinese hickory stands managed intensively for 5, 10, 15, and 20 years.
Stand TypesAlkyl C (%)N-Alkyl C (%)O-Alkyl C (%)Acetal C (%)Aromatic C (%)Phenolic C (%)Carbonyl C (%)Alkyl C/O-Alkyl CHydrophilic C/Hydrophobic CAliphatic C/Aromatic CAromaticity (%)
CH521.2 a14.5 b24.7 a12.8 a13.3 b5.9 b7.5 b0.54 b0.68 b2.74 a20.8 b
CH1023.1 a13.9 b24.1 a11.6 a12.5 bc6.2 ab8.7 a0.61 a0.72 ab2.65 ab20.5 b
CH1523.3 a13.9 b24.4 a10.6 a14.7 ab6.0 ab7.1 b0.61 a0.79 a2.59 ab22.3 ab
CH2022.9 a12.0 b23.8 a11.4 a15.4 a6.8 a7.7 b0.64 a0.82 a2.35 b24.1 a
NMF22.8 a16.0 a25.7 a11.1 a13.1 b5.4 b6.9 b0.55 b0.69 b2.99 a19.6 b
CH5, CH10, Ch15, CH20: Chinese hickory under 5-, 10-, 15-, 20-year intensive management, respectively; NMF: natural Chinese hickory–broad-leaved mixed forest. Different letters in the same column indicate significant difference at p < 0.05 (n = 3).
Table 5. Microbial carbon source usage diversity in Chinese hickory stands managed intensively for 5, 10, 15, and 20 years, and in Chinese hickory–broad-leaved mixed forest.
Stand TypesShannon IndexEvenness Index
CH53.59 ± 0.09 a0.97 ± 0.01 a
CH103.34 ± 0.09 ab0.97 ± 0.01 ab
CH153.03 ± 0.02 bc0.94 ± 0.00 bc
CH203.02 ± 0.07 bc0.94 ± 0.00 bc
NMF3.61 ± 0.06 a0.97 ± 0.00 a
CH5, CH10, Ch15, CH20: Chinese hickory under 5-, 10-, 15-, 20-year intensive management, respectively; NMF: natural Chinese hickory–broad-leaved mixed forest. Different letters in the same column indicate significant difference at p < 0.05 (n = 3).
Table 6. Correlation between microbial carbon source usage diversity and soil organic carbon contents in Chinese hickory stands managed intensively for 5, 10, 15, and 20 years, and in Chinese hickory–broad-leaved mixed forest stands.
Evenness IndexShannon Index
TOC0.39 *0.42 *
MBC0.36 *0.34 *
WSOC0.42 *0.59 **
* p < 0.05; ** p < 0.01.

