Article

Can Field Crews Telecommute? Varied Data Quality from Citizen Science Tree Inventories Conducted Using Street-Level Imagery

1
Department of Geography, Ball State University, 2000 W University Ave, Muncie, IN 47306, USA
2
US Forest Service, Northern Research Station, Philadelphia Field Station, 100 N. 20th St. Suite 205, Philadelphia, PA 19103, USA
3
Environmental Science and Studies Department, DePaul University, 1 E. Jackson Blvd., Chicago, IL 60601, USA
*
Author to whom correspondence should be addressed.
Forests 2019, 10(4), 349; https://doi.org/10.3390/f10040349
Submission received: 18 March 2019 / Revised: 12 April 2019 / Accepted: 18 April 2019 / Published: 20 April 2019

Abstract

:
Street tree inventories are a critical component of urban forest management. However, inventories conducted in the field by trained professionals are expensive and time-consuming. Inventories relying on citizen scientists or virtual surveys conducted remotely using street-level photographs may greatly reduce the costs of street tree inventories, but there are fundamental uncertainties regarding the level of data quality that can be expected from these emerging approaches to data collection. We asked 16 volunteers to inventory street trees in suburban Chicago using Google Street ViewTM imagery, and we assessed data quality by comparing their virtual survey data to field data from the same locations. We also compared virtual survey data quality according to self-rated expertise by measuring agreement within expert, intermediate, and novice analyst groups. Analyst agreement was very good for the number of trees on each street segment, and agreement was markedly lower for tree diameter class and tree identification at the genus and species levels, respectively. Interrater agreement varied by expertise, such that experts agreed with one another more often than novices for all four variables assessed. Compared to the field data, we observed substantial variability in analyst performance for diameter class estimation and tree identification, and some intermediate analysts performed as well as experts. Our findings suggest that virtual surveys may be useful for documenting the locations of street trees within a city more efficiently than field crews and with a high level of accuracy. However, tree diameter and species identification data were less reliable across all expertise groups, and especially novice analysts. Based on this analysis, virtual street tree inventories are best suited to collecting very basic information such as tree locations, or updating existing inventories to determine where trees have been planted or removed. We conclude with evidence-based recommendations for effective implementation of this type of approach.

1. Introduction

Street trees are trees growing in the public right-of-way along streets in cities, towns, and suburbs. Though street trees are a relatively small proportion of the overall urban forest in many cities [1], they are a highly visible component that constitute a major focus of public engagement by municipalities and nonprofit organizations [2,3,4]. Street trees generate a range of benefits such as increased property values, shade, stormwater capture, and aesthetics [5,6,7]. Street trees can be conceived of as common pool resources, in that they provide benefits to the general public, but it is often unclear who is responsible for the care and maintenance these trees need to ensure future benefits provision [8]. The public right-of-way in which street trees are located is directly adjacent to both private and public properties, and may include a sidewalk. Although many municipalities have long directly managed street trees through municipal laws, policies, and personnel [2,9], these trees exist under a multi-stakeholder governance regime [10], with residents, municipal agencies, nonprofit organizations, and developers impacting decision-making.
For municipalities, there are clear costs to, first, not clearly defining management responsibilities for street trees and, second, not adequately monitoring and maintaining the trees themselves. If trees are not well maintained, they will not provide maximal benefits to the general public and in the worst instances may experience increased tree failure and mortality rates [11]. Furthermore, street trees require maintenance over time, they pose hazards when limbs or entire trees fall, and managers must balance considerations like tree condition and likelihood of limb or tree failure with the availability of time, money, and expertise to monitor trees and perform maintenance. Again, these decisions are further complicated by the multiple stakeholders invested in and gaining from street tree benefits and maintenance [8].
Informed, strategic management of street tree populations requires current inventory data [12]. Tree risk management – assessing mature trees for structural defects and taking appropriate actions such as pruning or removal – and associated concerns for liability drive municipal arborists to create and update street tree inventories [13,14]. Beyond maintenance of large street trees, managers also use inventories to make decisions about tree planting, with consideration for taxonomic and size class diversity, urban hardiness, maintenance requirements, and available resources [15,16,17,18]. Unfortunately, street tree inventory data are difficult to generate and to keep up-to-date. Inventories are typically conducted in the field by trained professionals, which is costly in terms of both time and money [12]. These costs preclude many municipalities from conducting an inventory in the first place, and prevent many others from updating their inventory data as often as they would like [19,20]. Inventory data are needed to effectively respond to crises like pest outbreaks, and furthermore, current inventory data open the door to more proactive management regimes [19,21,22,23]. In light of the high costs associated with field inventories conducted by trained professionals and limited municipal resources, there has been increased interest in using alternative means of data collection to generate street tree inventory data. This includes both citizen science field data and virtual surveys using emerging digital resources like Google Street ViewTM (Google Inc., Mountain View, CA, USA), as described below. The potential involvement of actors beyond municipal arborists in generating street tree inventories is important, given the multiple stakeholders invested in (and potentially contributing to the management of) street tree populations in the public right-of-way.

1.1. Citizen Science Tree Inventories

Citizen science refers to public participation in authentic research [24,25]. Citizen science permits more extensive data collection than could be accomplished by professional researchers alone, and it simultaneously increases public engagement with societally relevant scientific issues [25,26,27]. Crowdsourcing, in particular, engages a large number of people in data collection, and the term crowdsourcing is often used in reference to online data collection [28]. Internet-based mapping applications have facilitated the collection of geographically referenced citizen science data [24], and emerging technologies will continue to open new possibilities for the user experience and data management within citizen science projects [29]. Despite major increases in the size and scope of crowdsourcing projects (see examples at https://www.zooniverse.org), a fundamental question of data quality persists because volunteers lack the training and experience of experts when making scientific observations [30,31]. The perception that citizen science projects produce lower quality data limits the use of citizen science data in both practical management and peer-reviewed science publications. Assessments of citizen science data quality have had mixed results, with some studies demonstrating that volunteers can produce data of comparable quality to experts [26,31]. Notably, citizen science data quality varies depending in part on the task complexity, which reflects both the subject matter knowledge and intricacy of the data collection technique [31,32,33]. Effective training strategies can overcome some of the barriers to producing accurate citizen science data [26,33].
In light of the simultaneous need for street tree inventory data and the lack of municipal resources to conduct inventories, many communities have enlisted citizen scientists to generate street tree data [34,35]. However, only a few studies have formally assessed the quality of urban tree data produced by volunteers [26,27,32,36]. These efforts have shown that volunteers can produce reasonably high quality data (i.e., data of comparable quality to data collected by experts, or data that is deemed acceptable for the intended application). In general, citizen scientists performed best at recording more basic variables that require less expertise to document accurately, and their performance was poorer for more detailed variables and for variables requiring more subjective assessment. For example, volunteer data for genus identification was in agreement with expert identification over 90% of the time in three studies, while average agreement rates were lower (64%–85%) at the species level [26,27,32]. Similarly, citizen scientists recorded diameter at breast height (DBH) within 2.54 cm of the expert measurement roughly 90% of the time [26], but performance declined when a more precise standard of agreement with expert data was imposed. Finally, multiple studies have reported that citizen scientists struggle to produce data that is consistent with expert data for more subjective variables such as maintenance needs and tree condition ratings [26,27,32,36]. Overall, if the volunteers are asked to collect data within their capabilities, citizen science approaches to street tree inventories can be an effective way to generate data at a competitive cost while building community engagement and social capital in urban forestry programs [27].

1.2. Virtual Surveys Using Street-Level Imagery

Remotely sensed imagery has long been used to generate information about urban tree canopy cover [37,38,39], but these products are traditionally limited to canopy abundance information that does not distinguish individual trees or provide details like species composition or size class distribution. More recently, researchers have advanced the use of remote sensing to monitor individual trees [40], and to identify tree species remotely [41]. At present, these approaches require substantial computing expertise and expensive imagery that is not available in all areas. Publicly available imagery sources hold potential for generating street tree data widely and at a relatively lower cost compared to proprietary imagery. For example, Google Street ViewTM (GSV) (https://www.google.com/streetview/) provides street-level panoramas for most of the USA, and GSV coverage has expanded in recent years to include dozens of other countries. Similarly, Tencent Maps street view (http://map.qq.com) offers street-level panoramas in hundreds of Chinese cities.
Street-level panoramic photos capture trees lining streets, so several studies have explored the possibilities for using such imagery to generate information about street trees and streetscape greenery. Li, et al. [42] outlined an automated procedure to quantify green pixels in GSV images, and Li, et al. [43] applied this technique to study relationships between the abundance of street-level greenery and neighborhood socioeconomic characteristics. Tencent imagery was used to compare street greenery in 245 Chinese cities, and the results showed that cities in western China generally had greener streets than other regions [44]. GSV has been used to quantify streetscape shade provision in Singapore [45] and Boston [46]. Seiferling, et al. [47] used GSV imagery and innovative computer vision techniques to automatically detect the locations of trees and predict tree canopy cover. Computer vision was also used in Pasadena, California, to detect street trees, identify their species, and monitor changes over time [48]. While this approach successfully detected only about 70% of street trees, it showed great promise for identifying trees, monitoring changes, and potentially extending to additional metrics such as trunk diameter [48]. It seems likely that this type of approach, rooted in machine learning and computer vision, will eventually become a popular means of generating street tree data, because it is more efficient than human data collectors and data quality will improve as methods are refined. On the other hand, these sophisticated techniques for automated tree data generation are currently inaccessible to all but a very few communities simply because of the advanced computing skills required to implement the techniques.
In this study, we chose to explore simpler approaches to street tree data collection that are broadly accessible because they can be implemented by less skilled computer users. One such approach is a so-called virtual survey in which analysts record tree data by manually interpreting photos as if they were walking down the street [49]. This approach is similar to windshield surveys, which involve rapid data collection by a crew driving a vehicle along streets and have a long history in urban forestry practice and research [50,51]. Berland and Lange [49] compared GSV virtual surveys to field data from the same locations, and found that the analyst documented 93% of the trees inventoried in the field, and produced genus identification data that agreed with the field data for 90% of trees. While species identifications and diameter class estimates agreed with the field data less often (66% and 67%, respectively), the authors concluded that this simple approach to virtual surveys in GSV showed promise for generating street tree data efficiently and with a reasonable degree of reliability for basic variables [49]. However, the analyst in that study had a college degree in field botany and work experience in urban forestry, and communities interested in applying this approach may not have analysts on hand with such expertise. As such, we present here an investigation of the level of data quality that can be generated using GSV virtual surveys employing analysts ranging from trained experts to novice volunteers.

1.3. Aims and Research Questions

We are aware of several municipalities interested in using citizen science and/or virtual survey techniques to generate street tree inventory data [34,52,53,54]. However, there are fundamental uncertainties about the level of data quality that can be generated using a pairing of volunteer-generated data and virtual survey techniques. In this study, we compared virtual survey data to field data from the same locations as a means of assessing virtual survey data quality. We also assessed the level of agreement among analysts at three different self-rated expertise levels (novice, intermediate, and expert). We posed the following research questions:
  • To what degree do virtual survey analysts in the same self-rated expertise category agree with one another? Does this level of agreement vary among expertise categories? For example, do experts agree with one another more often than novices agree with one another?
  • What is the level of agreement between virtual survey data and field data? How does this vary according to analyst expertise?
Based on prior citizen science field studies for both urban and rural forestry [26,27,32,34,36,52,53,55,56], we anticipated that novices would produce high quality data for simple variables such as tree counts, but experts would produce higher quality data for variables such as species identification that require more background knowledge. Our findings provide insights into the applicability of using virtual surveys to generate street tree inventory data, and point to practical recommendations that can be used by urban forest managers considering this approach to data collection in their communities.

2. Materials and Methods

2.1. Study Area

The study area is the Village of Dolton, IL, USA (41.64° N, 87.61° W), which lies immediately south of Chicago. Dolton covers a land area of 12.1 km2, and has approximately 111 km of local public roads. Dolton had a 2016 population of 23,091 [57]. The median household income was $44,075, and 27% of individuals lived below poverty level. 86% of residents had at least a high school degree, while 17% had a bachelor’s degree or higher. The population was 91% black or African American, 7% white, and 4% identified as Hispanic or Latino (of any race). Most homes (77%) were built between 1950 and 1979, 64% of residences were owner-occupied, and the median home value was $94,700 [57].
Urban forest management in Dolton is constrained by limited municipal resources. There is no formal urban forestry department or certified arborist in Dolton dedicated to managing street trees. Street trees in Dolton are under the jurisdiction of the Public Works Department, which maintains all public infrastructure including streets, sidewalks, and water/sewer lines [58]. However, there is little active street tree planning and management from municipal personnel. We chose to work in Dolton because the village had expressed interest in acquiring street tree data to our contacts at the Morton Arboretum, an organization that supports tree science and stewardship in the Chicago region. Along streets in Dolton, most trees appear to have been planted at or around the time of housing construction (estimated age 40–60 years old) or possibly planted later by a homeowner.

2.2. Field Data Collection

The field crew for data collection was composed of two senior undergraduate students majoring in Environmental Studies at DePaul University. The students had tree identification skills from applied ecology field work courses that were strengthened during three full days of urban forest inventory training with the coauthor supervising field work. Field data were collected during summer 2017. The field crew completed a random sample of street segments along Dolton’s local public roads. Forty-three street segments were used in the analysis described below to match virtual survey sampling effort. Field data were collected digitally using ESRI’s Survey123 (ESRI, Redlands, CA, USA). For each tree encountered, the field crew recorded location information including the street segment identifier, the street address, and a sequential number to differentiate between multiple trees at a given street address. They documented tree information including DBH to the nearest 0.25 cm (0.1 inches), mortality status (alive, standing dead, or stump), genus, species, special notes (e.g., description of the tree’s location when the street address was not evident), and a timestamp for the record. The field crew also took multiple photos of each tree including the entire tree, close-ups of the leaves and bark, and any defining characteristics to help with species identification. These photos were used by the authors to confirm species identification when the field crew was uncertain.

2.3. Google Street View Virtual Surveys

2.3.1. Recruitment and Training of Analysts

Virtual survey analysts were recruited via email. Potential analysts were identified using the Morton Arboretum’s contacts in greater Chicago and the professional networks of the authors. Individuals who were interested in participating were sent a link to a Google FormsTM survey that was used to obtain informed consent to participate and to collect self-rated expertise information (Supplementary Material S1). Respondents were asked about their previous experience in citizen science projects, experience and awareness regarding urban forestry management and field techniques (including tree measurement and identification), and experience and comfort using Google MapsTM and GSV. They were also asked background questions about their education, field of employment, and age. We sought a minimum of three analysts per expertise group, where experts were defined as those with substantial experience in urban forestry in their professional work, intermediate analysts were those with some experience collecting tree data in the field and moderate confidence in measuring and identifying trees, and novice users had very little or no experience collecting tree data in the field and low confidence in their ability to measure and identify trees.
Citizen science projects typically involve a training component to familiarize volunteers with field techniques [26,32,36]. Our study was not conducted face-to-face, so the virtual survey analysts received a set of digital training materials. Each analyst received a PDF document as an email attachment (Supplementary Material S2). This PDF document contained a project overview; illustrated definitions of key terms such as tree, street tree, public right-of-way, and street segment; instructions for collecting data; links to instructional YouTubeTM (YouTube LLC, San Bruno, CA, USA ) videos demonstrating data collection procedures; links to illustrated reference guides for estimating tree diameter and identifying species; and links to the analyst’s personalized data collection form. This training document also contained contact information for the primary investigator in case the analyst had questions or problems while collecting data.

2.3.2. Data Collection Procedure

Virtual survey analysts collected data along the same list of randomly drawn street segments in Dolton. Street segments were defined as the portion of a street between two intersections. To inventory a street segment, analysts clicked on a link to the segment in a PDF document that directed them to the beginning of that segment in GSV. The street segment list named the intersecting streets and the address range along that segment to clarify the precise extent of that segment. Analysts navigated down the left side of the street in GSV, noting details about any trees they encountered (see below), or recording that there were no trees present along the left side of the segment. Then they returned to the street segment list, clicked that same link again, and repeated the procedure along the right side of the street. This process of inventorying the left and right sides of the street separately reduced the likelihood of user error. It also helped the authors match trees across multiple users for analysis purposes because trees were inventoried in a clearly defined order.
When analysts encountered a tree, they recorded information about the tree in a personalized data collection form shared privately online between the analyst and the authors on Google SheetsTM. For each tree, the analyst noted the street segment number and side of the street (left or right), the street address number given in GSV, the estimated diameter class of the tree, the mortality status (alive, standing dead, or stump), genus, species, and identification confidence. Dropdown lists were used for street segment number, diameter class, mortality status, genus, species, and identification confidence to reduce data inconsistencies such as misspellings. The Google Sheet also contained a custom timestamp that automatically populated a start time when the analyst began recording information about the tree, and an end time when the analyst completed all the required fields for that tree. Diameter classes followed common bins used in urban forestry in the USA (0–7.6, 7.6–15.2, 15.2–30.5, 30.5–45.7, 45.7–61.0, 61.0–76.2, and >76.2 cm DBH). We did not ask analysts to estimate DBH with greater precision, because this proved difficult in a previous GSV study [49], and greater level of precision is not necessarily useful for most management purposes [32]. Analysts received a DBH reference guide that showed GSV images of trees within each diameter class, and links to those trees so the analyst could see what a tree of that size looked like in the native GSV imagery (Supplementary Material S3). The genus field contained a dropdown list of 51 common genera in the Chicago area drawn from an existing tree inventory [59], and analysts could select ‘other’ and type in a genus as appropriate. To aid in identification, analysts received a tree identification guide in PDF format that contained pictures and links to more information for approximately 60 common urban tree species from greater Chicago (Supplementary Material S4). Identification confidence was classified as high confidence, somewhat confident, or not confident.

2.4. Data Analysis

2.4.1. Time Comparison between Field and Virtual Surveys

We calculated the time taken to inventory trees in the field and in the virtual surveys. For the field data, we used timestamps from the tree records in Survey123 to break the field work into sampling blocks, where any gap between two trees greater than 30 minutes was considered a separate sampling block. This was designed to count short breaks during the field work, unique or difficult to identify trees that might take longer than average time to identify, and travel time between street segments, but not to count longer discontinuities such as lunch breaks against the total sampling time. After determining the length of each sampling block and the number of trees inventoried, we divided minutes by trees inventoried to get sampling time per tree. We did not include travel time to and from the study area in this calculation, because we are less interested in total time dedicated to field inventory activities than in per-tree comparison with virtual survey data collection. Time calculations for virtual survey data were based on Google Sheets timestamps. Again, we broke the data into sampling blocks defined by a gap less than 30 minutes between consecutive trees, and divided to calculate sampling time per tree.

2.4.2. Agreement within and among Analyst Expertise Groups

To assess the quality of data generated using virtual surveys, we compared virtual survey data among virtual survey analysts, and then separately compared virtual survey data to field data. When comparing virtual survey data among analysts, we assumed that higher agreement among analysts signaled higher data quality, particularly in terms of consistency or reliability. Of course, two analysts in agreement on a species identification could both be wrong, but we expected that agreement would more likely signal that both analysts arrived at the same accurate classification. Note that this is analogous to the standard means of assessing data quality in citizen science projects in the field, where the quality of citizen science data is judged against expert data, where the expert data are assumed to be correct even though they almost certainly contain some error [32].
Agreement among virtual survey analysts focused on the following four variables: tree count (the number of trees on each side of each street segment), diameter class, genus, and species. Analysts were instructed not to record species for Amelanchier Medik., Cornus L., Crataegus L., Malus Mill., and Prunus L., because these genera contain many hybrids and cultivars that can be difficult to distinguish [32]; for these genera, analysts were considered in agreement for species if they both selected the same genus. Together, these genera only comprised 1.5% of the total trees encountered, so this decision is likely to have a very minor impact on our results.
We tested agreement among all analysts by variable to determine which variables were collected more or less consistently among analysts. Raw percent agreement is biased by chance agreement, particularly when some classification categories are overrepresented. For example, in this study an analyst could have achieved 73% accuracy for genus identification by simply selecting maple (Acer L.) for every tree. Thus, we used Krippendorff’s alpha statistic to measure agreement while correcting for chance agreement. Krippendorff’s alpha ranges from 0 (no agreement) to 1 (perfect agreement). While there are no absolute benchmarks for satisfactory alpha values, scores >0.8 are typically considered to indicate good agreement, and scores >0.67 indicate acceptable agreement [60]. In this study, Krippendorff’s alpha was more appropriate than other interrater reliability statistics because it allows for more than two raters. Furthermore, the statistic accommodates nominal, ordinal, interval, and ratio data [61], whereas other metrics only accommodate nominal data.
We implemented Krippendorff’s alpha in R using the kripp.boot function [62]. We bootstrapped 95% confidence intervals using 10,000 iterations. Tree count was processed as interval data, DBH size class was processed as ordinal data, and genus and species were processed as nominal data. The implication of processing variables as ordinal or interval data is that raters are penalized more severely when ratings are in stronger disagreement. For genus and species identification, analysts were allowed to select ‘unknown’ when they felt unable to identify a tree. When calculating Krippendorff’s alpha, each instance of an ‘unknown’ record was converted to its own unique genus or species code. This penalized users for selecting the unknown option, and provides a more conservative estimate of interrater agreement than other strategies (e.g., omitting unknowns from the analysis). We used Krippendorff’s alpha (a) to examine differences among the four key tree variables for all users to evaluate which variables exhibited higher overall agreement, and (b) to compare within-group agreement across the three expertise groups for each of the four key variables to evaluate whether agreement levels varied among expertise groups. We interpreted non-overlapping confidence intervals as a conservative indicator of significant differences.

2.4.3. Agreement with Field Data

Next we compared data from each analyst to the field data using Krippendorff’s alpha. Field measurements of DBH were converted from cm to diameter classes for comparison. Relatively higher Krippendorff’s alpha scores indicated higher agreement between the analyst and the field data. We interpreted higher alpha scores as an indication of higher data quality, which assumes that the field data are correct. Notably, we could not account for tree plantings or removals between GSV imagery capture and field data collection. While field data were collected in summer 2017, virtual surveys were based on GSV imagery captured predominantly in 2012 and during summer months (Table 1).

3. Results

3.1. Overview of Virtual Survey Analysts and Tree Data

We recruited 16 analysts to participate in the virtual surveys. Their ages ranged from 22–72 years (median = 44.5 years). Nine had prior citizen science experience, and 15 of 16 analysts reported using Google Maps or Google EarthTM one or more times per week, but responses were more varied for Google Street View use. The analysts varied in their self-reported knowledge in urban forestry and confidence in their ability to complete tree identification and measurement tasks. Based on these responses, analysts were divided into expert, intermediate, and novice groups containing 3, 9, and 4 members, respectively.
The virtual survey analysts inventoried between 5–43 street segments (mean = 21.8 segments), and ranged from 53–357 trees (mean = 186.9 trees). The average time per tree was lowest for experts and highest for novices (Table 2). Nearly half of the analysts (7 of 16) averaged less time per tree than the field crew, but note that the analysts operated individually while the field crew consisted of two members. The data from the virtual surveys and the field survey can be found in Supplementary Material S5.

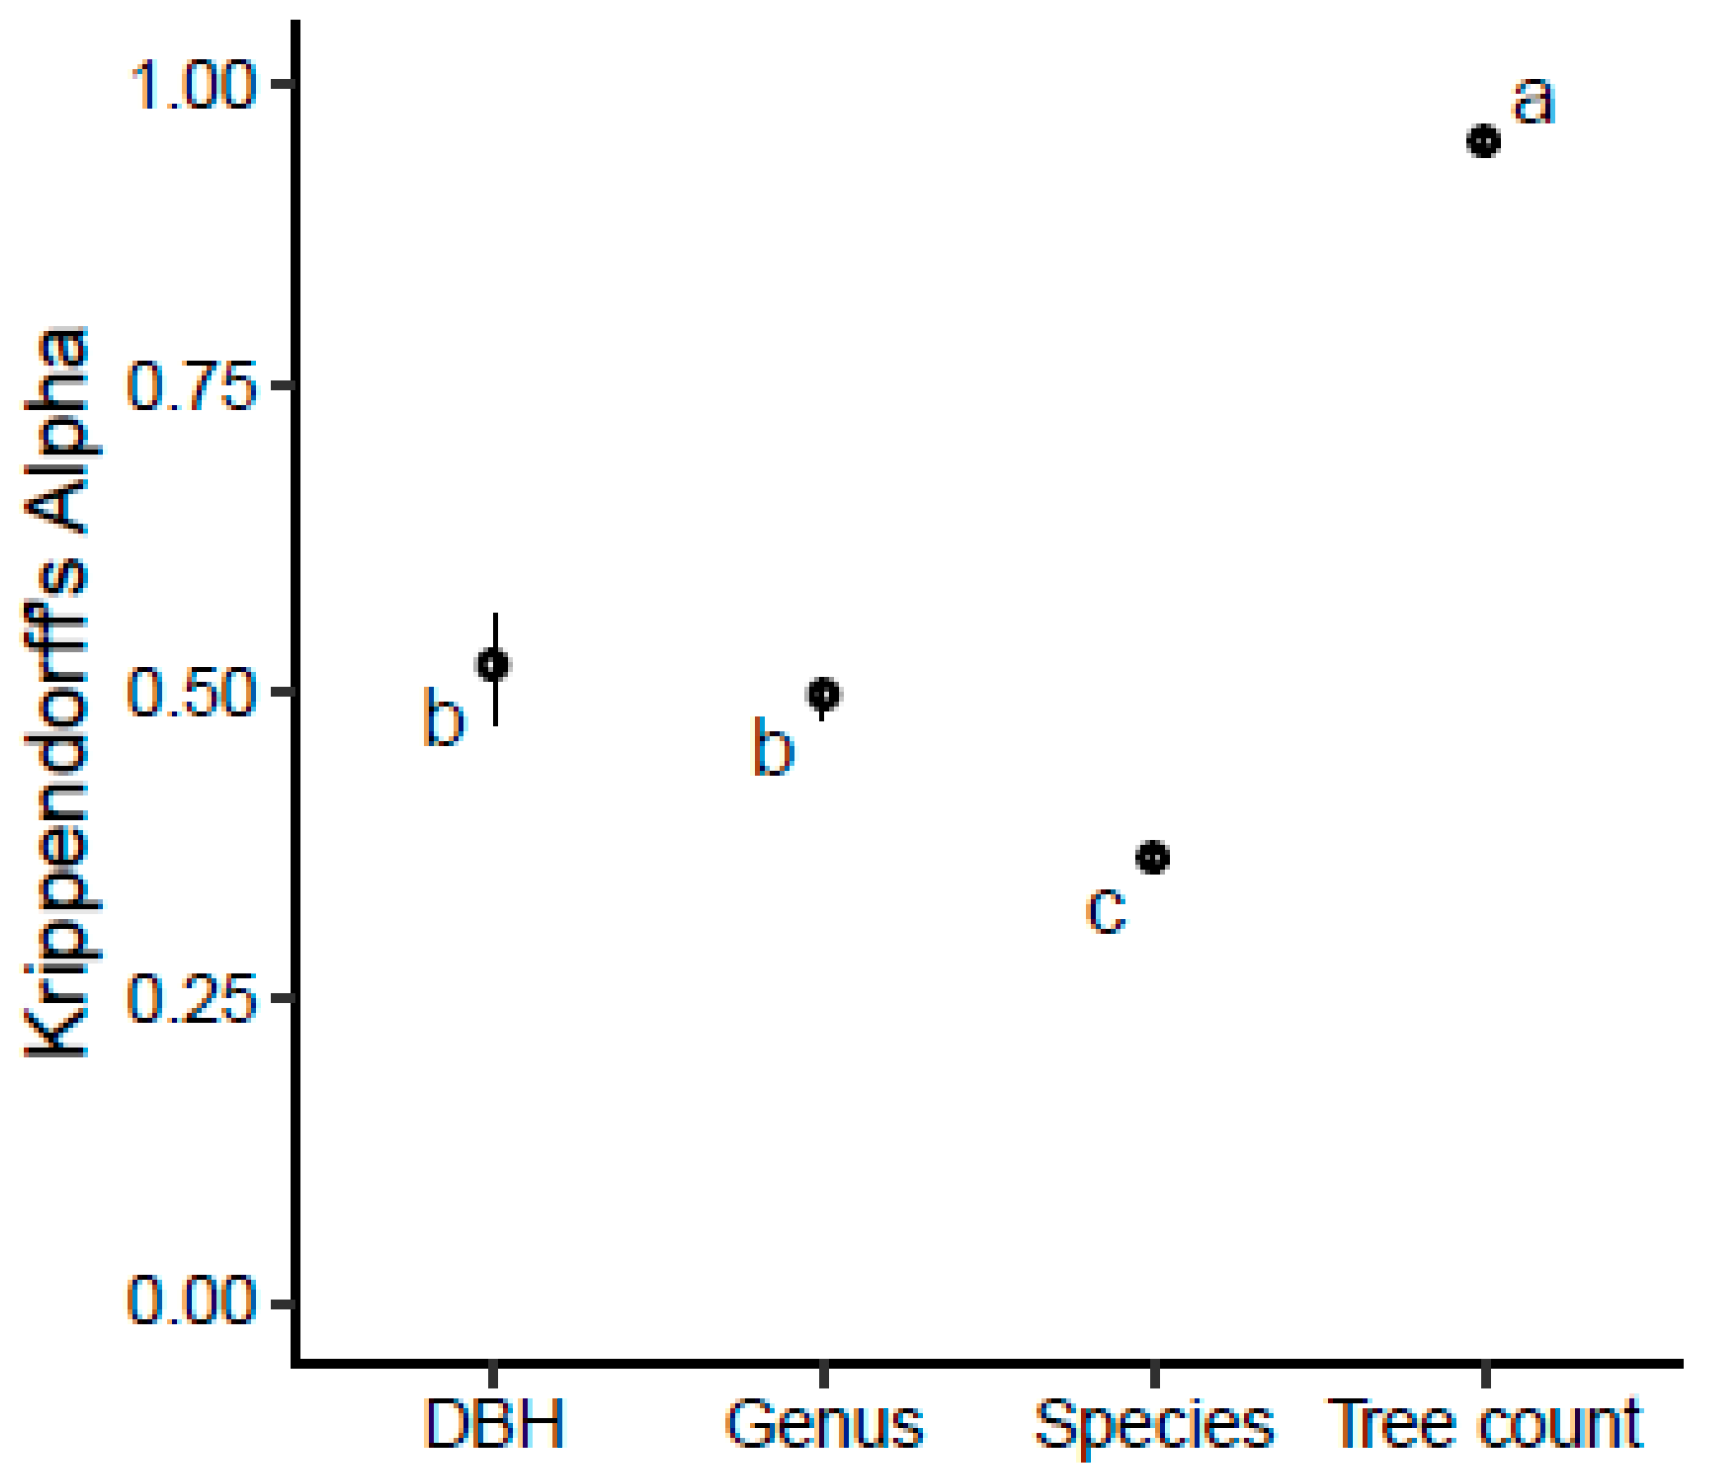
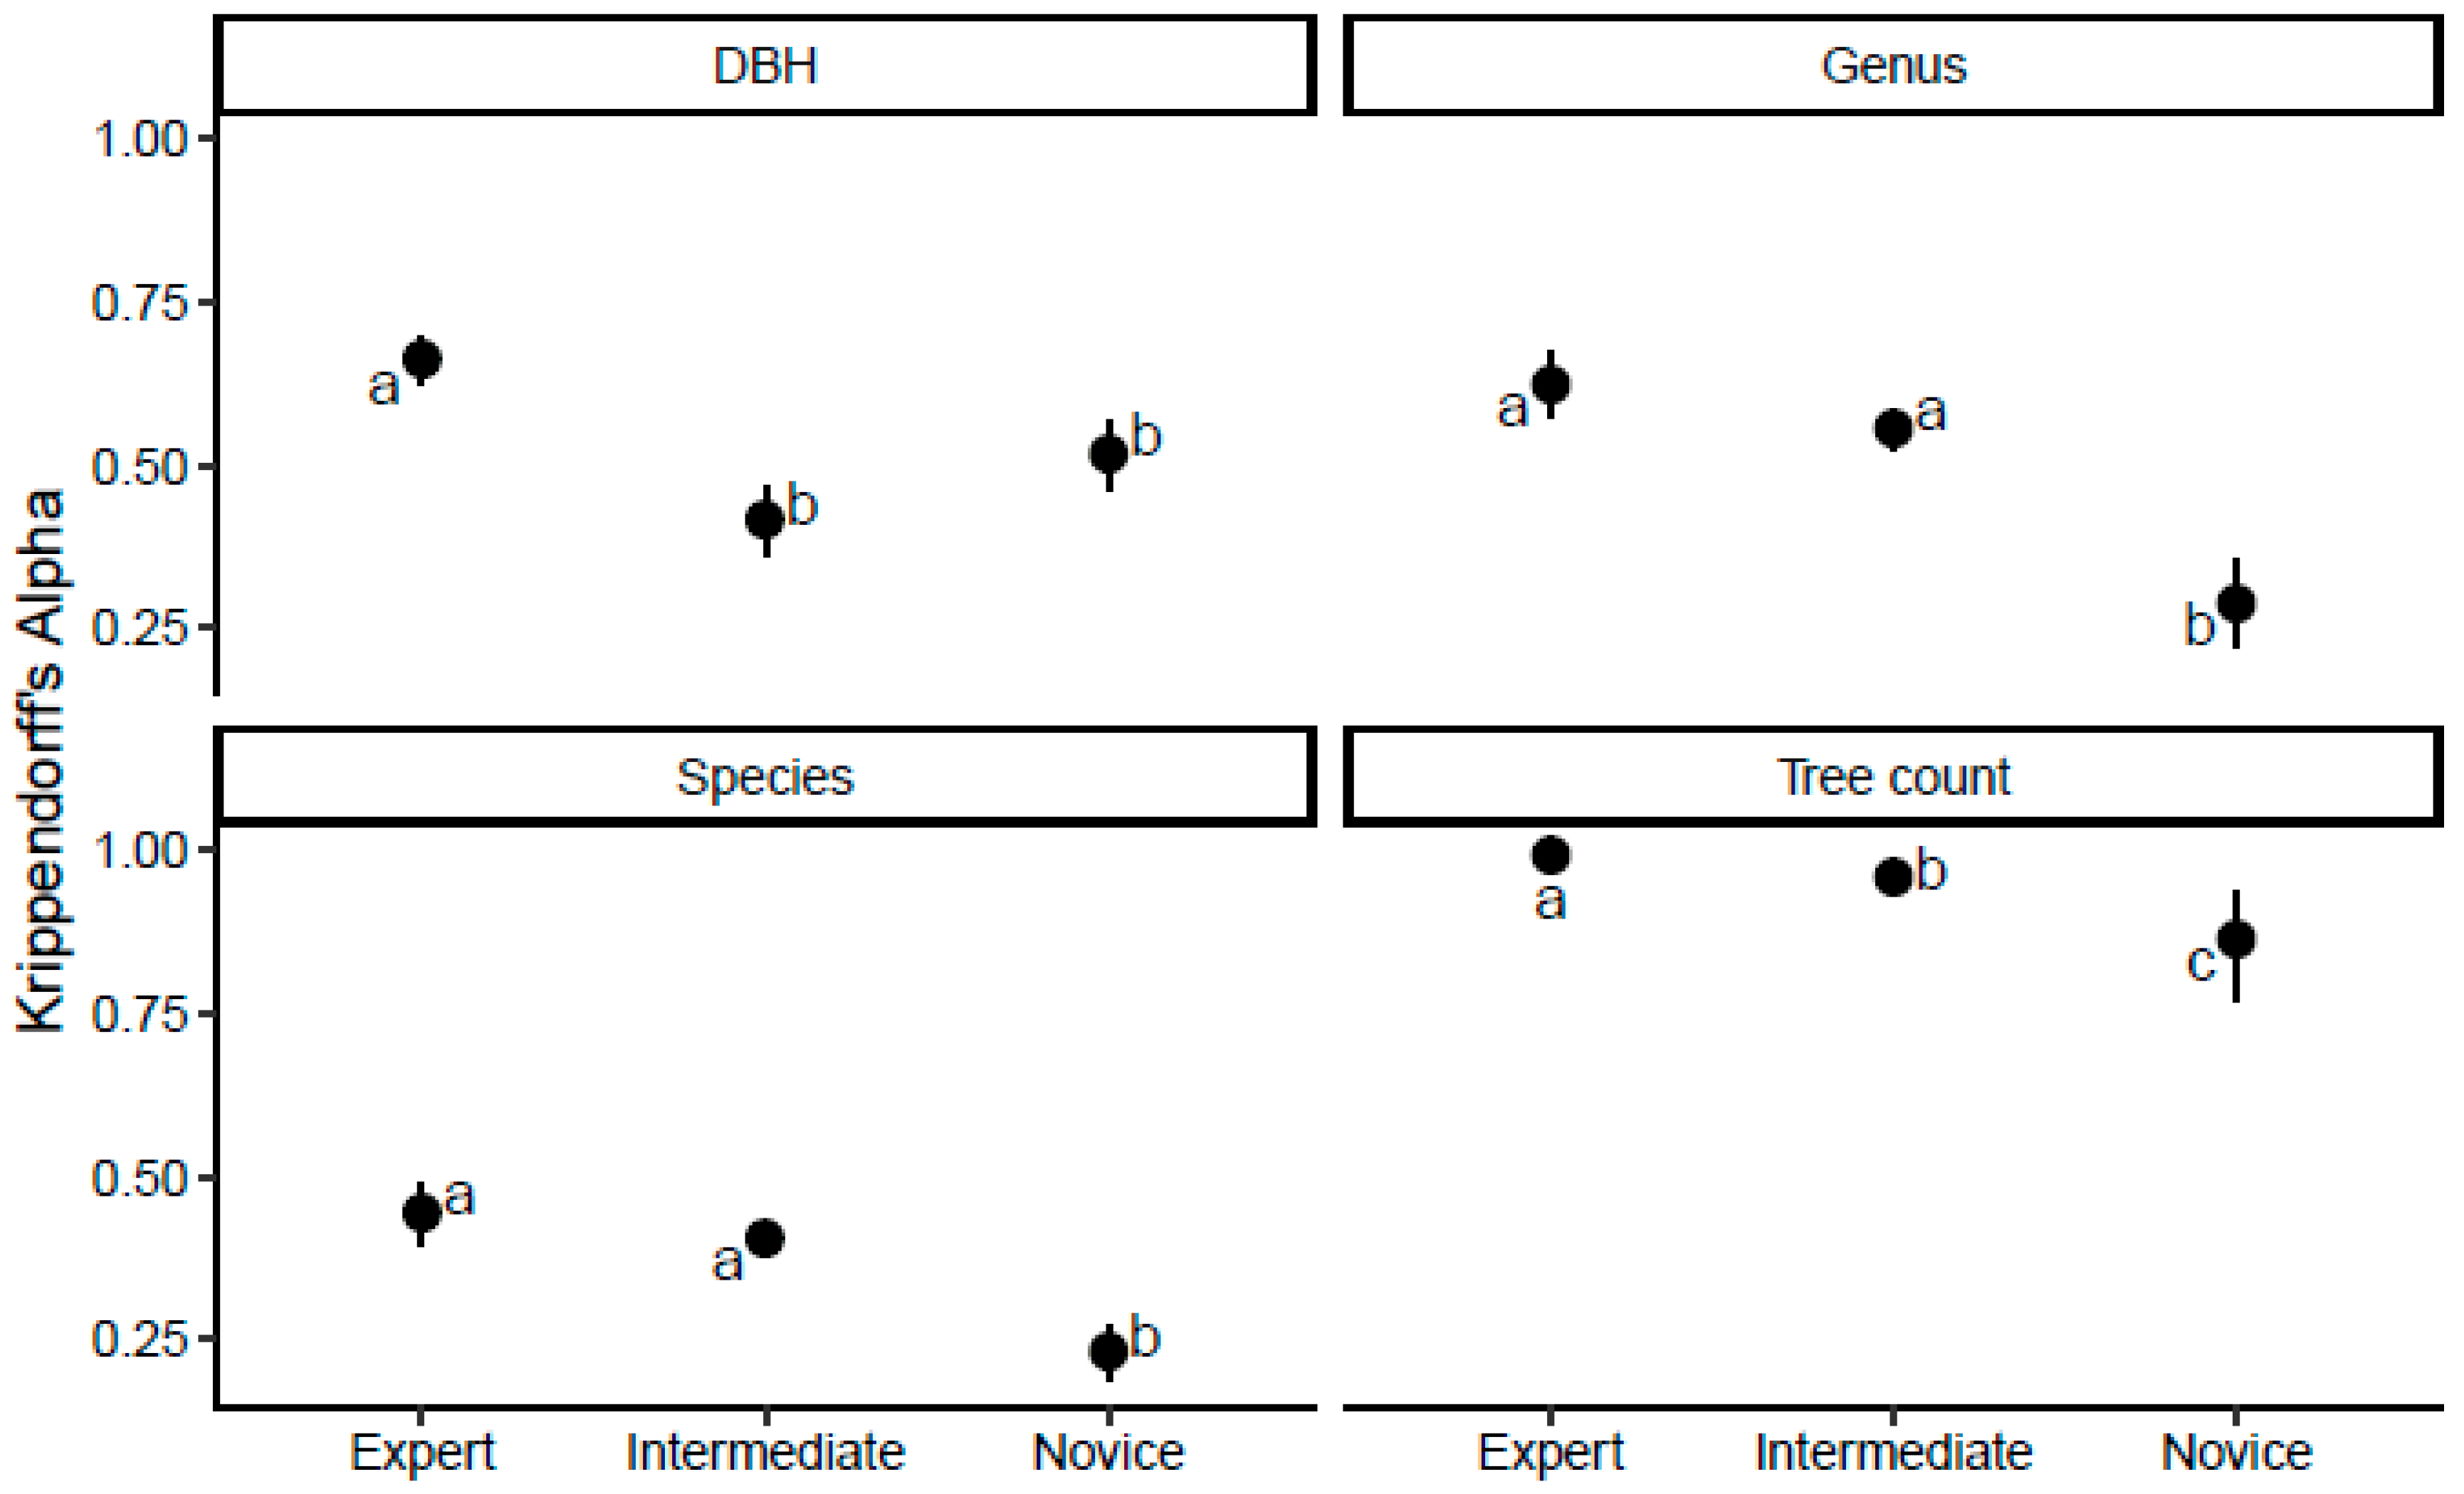
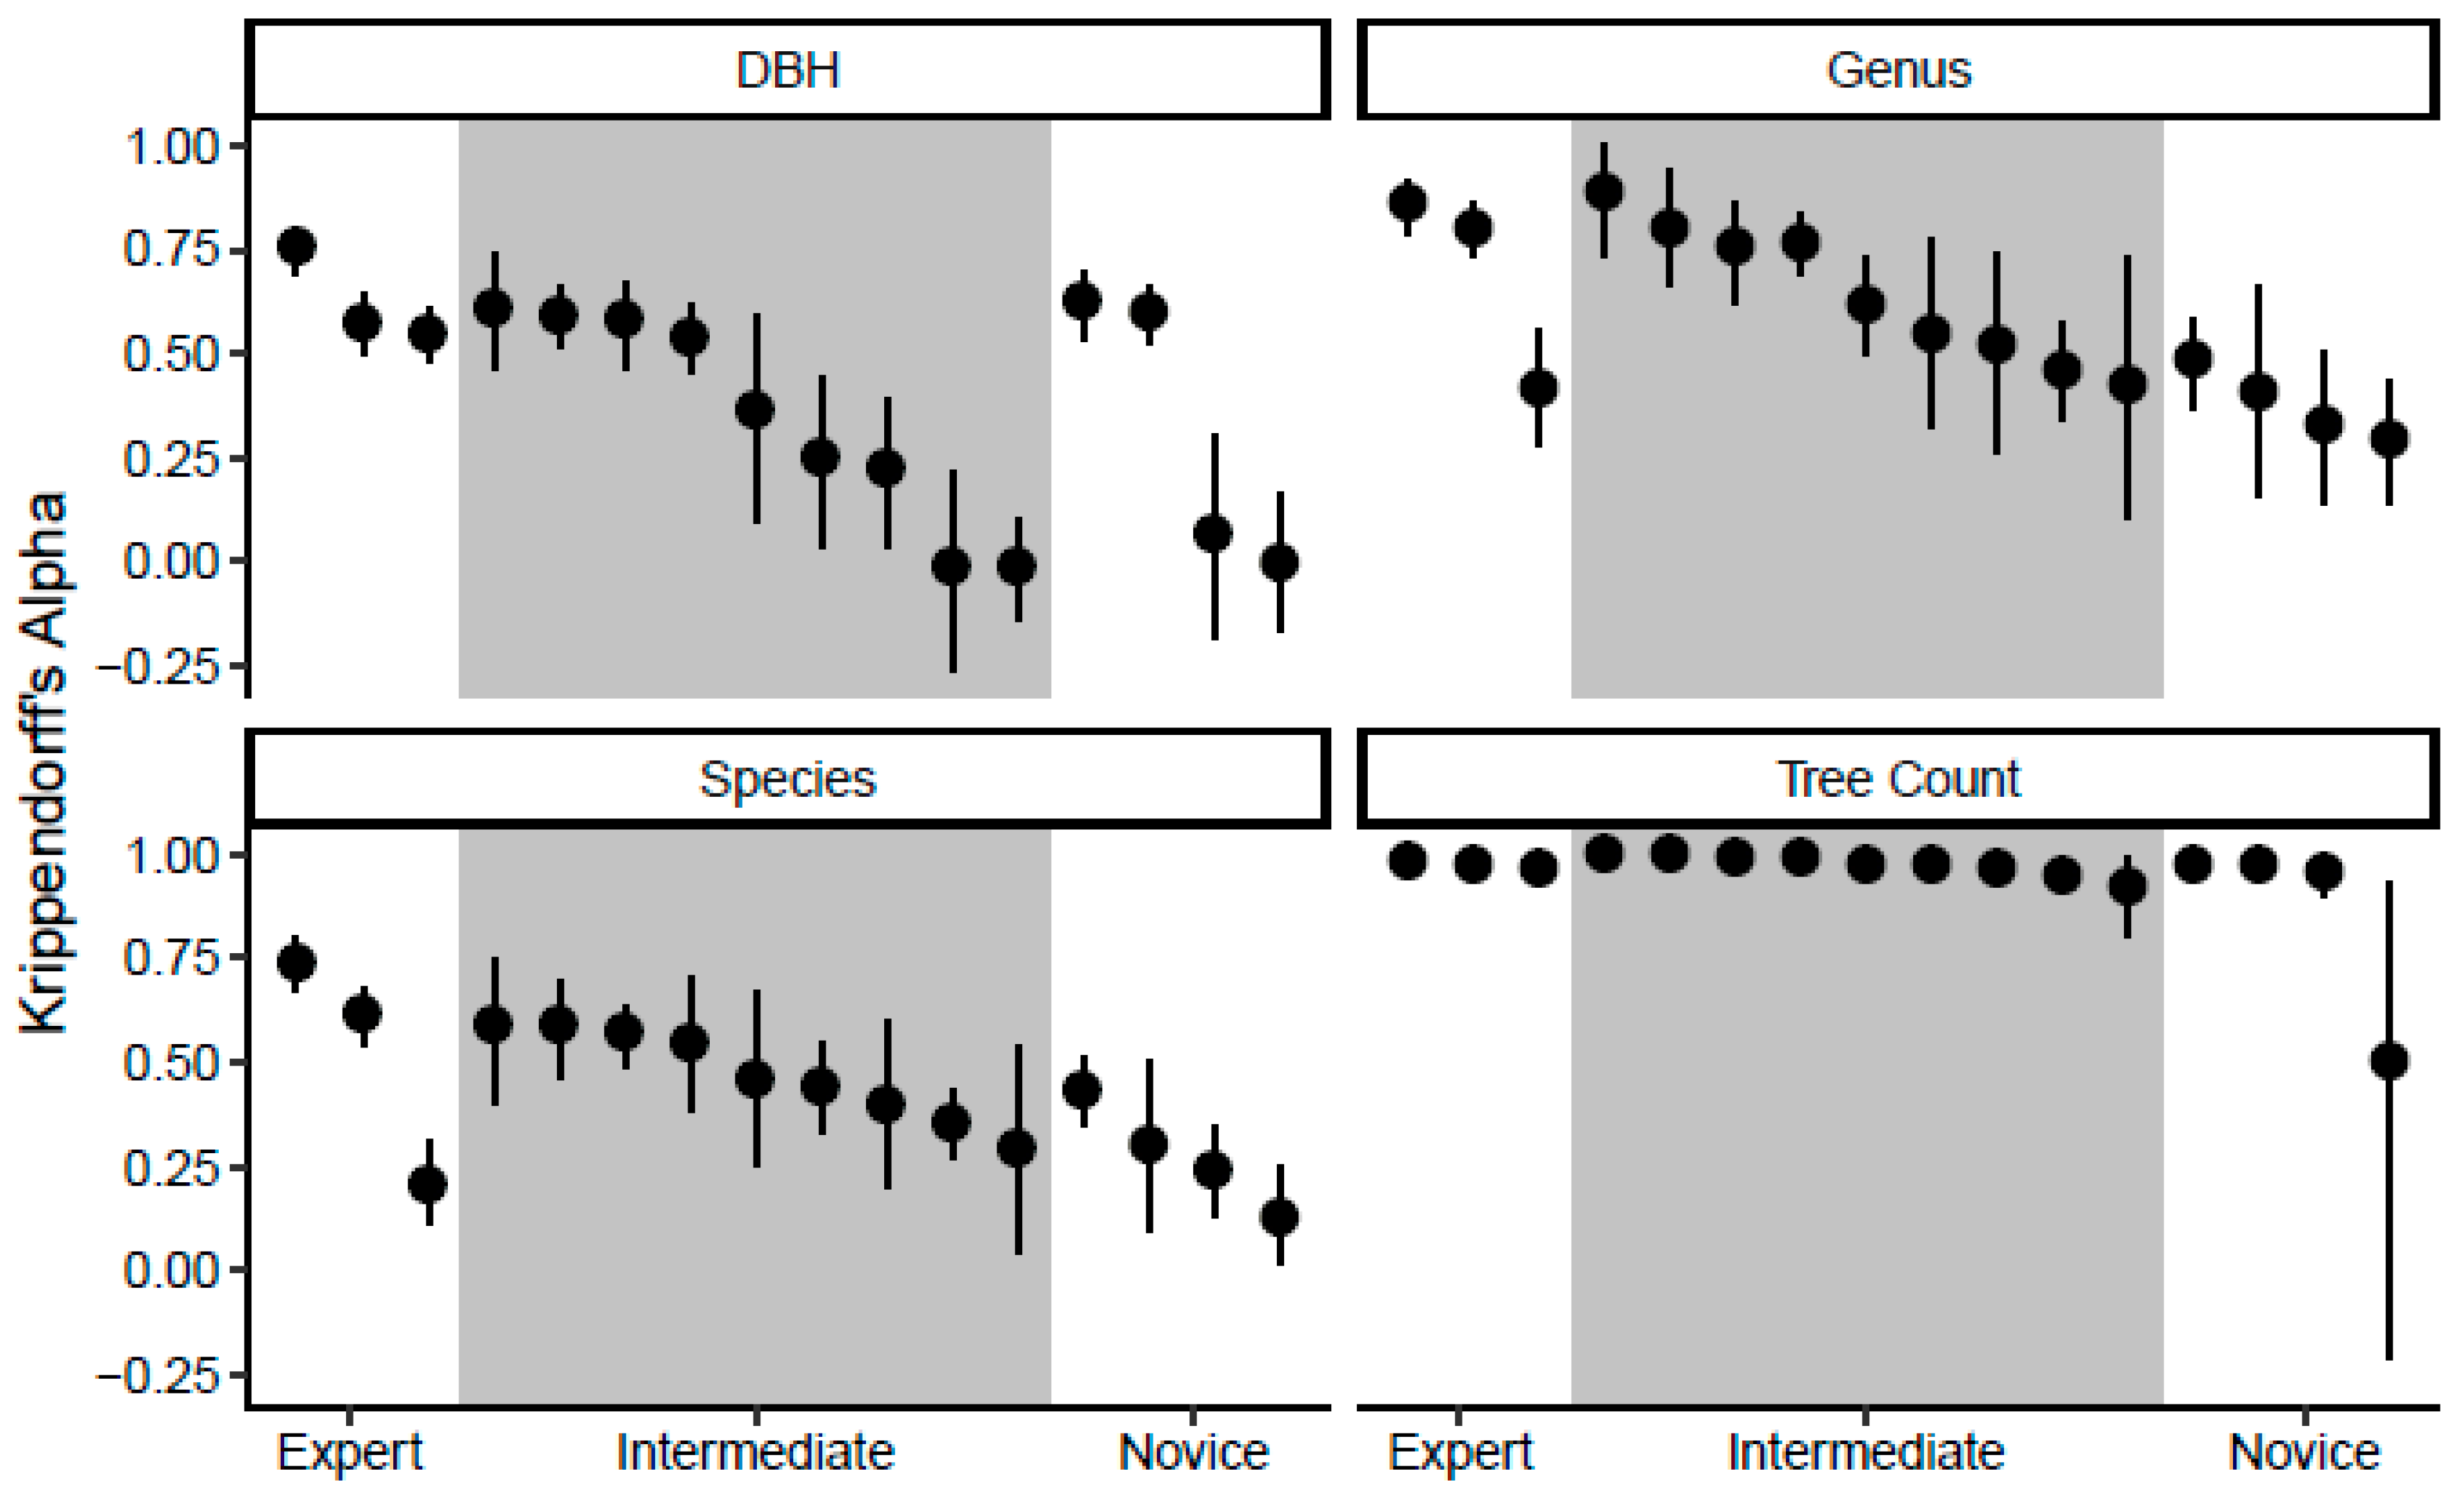
3.2. Agreement among Analysts

Interrater agreement among all virtual survey analysts was highest for tree count, followed by DBH class and genus, and species agreement was lowest (Figure 1). Only tree count had a Krippendorff’s alpha score above the heuristic threshold of 0.8 indicating good agreement [60]. Within expertise groups, experts had the highest level of agreement for DBH and tree count, and experts and intermediate analysts had higher agreement than novices for genus and species identification (Figure 2). Novices exhibited relatively high interrater variability on tree count, and this appeared to be caused by one analyst with a low sample size and low alpha score (see rightmost tree count data point in Figure 3). Novices had particularly low Krippendorff’s alpha scores for genus (0.29) and species identification (0.23).

3.3. Agreement between Field Data and Virtual Survey Data

Pairwise comparisons between virtual survey analysts and the field data show high agreement for 15 of 16 analysts for tree count (Figure 3). Two of the experts outperformed all of the novices for both genus and species identification; the third expert was penalized for selecting ‘unknown’ relatively frequently, resulting in a diminished alpha score for genus and species identification (Figure 3). We observed marked variability among intermediate and novice analysts for DBH, compared with relatively consistent performance among experts (Figure 3). DBH performance generally decreased with increasing tree sizes, and all analyst groups tended to underestimate the DBH of larger trees (Table 3). The top intermediate analysts performed on par with the experts across all variables (Figure 3).
Maples comprised 72.6% of the trees encountered in the field on the street segments analyzed here (Table 4), and genus agreement rates were high (88%–96%) for maples across all expertise groups. Identification performance was much poorer for other common genera including ash (Fraxinus L.), elm (Ulmus L.), and linden (Tilia L.) (Table 4). With respect to self-rated confidence in tree identification, analysts across all levels of expertise were more confident identifying to the genus level compared to the species level (Table 5). When the analysts were confident, overall agreement rates between virtual survey data and field data were high for both genus (94.5%) and species (89.6%) (Table 5). Experts were more likely to be in agreement with field data when they were confident, followed by intermediate and novice analysts. Agreement rates were substantially lower at both the genus and species levels when analysts rated their identifications as somewhat confident or not confident (Table 5).

4. Discussion

In this study, we used publicly available GSV imagery to generate street tree inventory data. We explored how data quality varied from analysts in three self-rated expertise groups. This work advances our understanding of data quality associated with two approaches to data collection – citizen science projects and virtual surveys using street-level panoramas – that have potential to become increasingly prominent for street tree inventories. Below we discuss our findings, describe limitations of our study, and offer recommendations for future application of this technique.

4.1. Data Quality from GSV Virtual Surveys

The 16 analysts in this study were diverse in age, educational background, and self-rated expertise related to urban forestry and tree inventory, yet the analysts were able to complete the project tasks using digital training materials and online data entry. Leveraging familiar, user-friendly digital platforms like GSV and Google Sheets reduced the time needed to train volunteers on new software or field equipment. This type of online data crowdsourcing may be useful in similar situations, because it would allow managers to solicit a substantial amount of data remotely without coordinating the schedules of volunteers for fieldwork activities. The rate of data collection for an individual analyst was competitive with that of field crews observed here (Table 2) and in other studies of citizen science tree inventories [27,32,36]. Slower data collection for novices was likely attributable to more time spent on tree identification. Analysts were able to participate on their own schedules, regardless of the weather, from any computer with an internet connection, and seasonal timing of the surveys was irrelevant because GSV imagery is primarily captured during the growing season (Table 1). On the other hand, by eliminating site visits and removing the teamwork aspect of field inventories, we may have missed out on some of the benefits of citizen science fieldwork including community building and enhanced public support for urban forestry initiatives [26,27].
Agreement among virtual survey analysts was high for the simplest variable, tree count (Figure 1), which is consistent with previous citizen science studies indicating that volunteers perform on par with experts for the most basic types of observations [26,27,32]. Even though we simplified data collection into DBH classes rather than requiring DBH estimation with greater precision, interrater agreement for DBH was relatively low (Figure 1), and most analysts were in low to marginal agreement with field data for DBH (Figure 3, Table 3). Likewise, we observed fairly poor agreement for tree identification at the genus and species levels (Figure 1, Figure 2 and Figure 3) after Krippendorff’s alpha accounted for the overabundance of maples in the study area (Table 4). The analyst’s level of confidence in their identification was a good indicator of data quality, particularly for expert and intermediate analysts (Table 5). Overall, the expert group had the highest interrater agreement across the four variables we tracked, but even expert performance only exceeded a Krippendorff’s alpha value of 0.8 for tree count (Figure 2). That said, experts also showed promise for identifying trees to the genus level; two expert analysts were in high agreement (alpha >0.8) for genus identification (Figure 3), while the third expert was frequently penalized for selecting ‘unknown’ for genus and species. Some intermediate analysts produced virtual survey data on par with experts across all four variables (Figure 3), indicating that this approach need not be used by experts alone. As suggested by Roman, et al. [32], volunteers could be evaluated for species identification accuracy at the beginning of a project, as high-performing individuals may not consistently identify themselves as such.

4.2. Limitations

Several limitations to our study warrant consideration. When comparing virtual survey data to field data, we used the term agreement rather than accurate to acknowledge that the field data likely contained some errors, albeit presumably minimal. We assumed that agreement with field data represented higher data quality, reflecting the idea that field data are the traditional standard for data collection. Updates to GSV imagery were beyond our control. Eighty-seven percent of the GSV imagery in this study was collected five or more years before the field data to which it was compared (Table 1). GSV imagery for Dolton was updated in summer 2018, but this update occurred after our analysts had completed the virtual surveys. Along with outdated imagery, we also encountered some blurry images and, less frequently, portions of streets such as dead ends that were not covered by GSV imagery. Where imagery was outdated, it is possible that some disagreement between the field crew and virtual survey analysts was attributable to analyst error or tree change (planting or removal).
The virtual survey analysts worked at their own pace as their schedules permitted. To avoid bias among analysts, we did not provide midstream feedback to help analysts confirm or recalibrate their estimates. Berland and Lange [49] found that this type of feedback can improve data quality as an analyst becomes more experienced. Moreover, Berland and Lange [49] had their analyst conduct a trial run by surveying a small selection of trees in GSV and then visiting them in the field to help the analyst calibrate his observations; this was not logistically possible in the present study.

4.3. Recommendations

Based on our findings, we present the following recommendations for those who may be interested in combining citizen science and virtual surveys to generate street tree inventory data. Our recommendations echo insights from citizen science and crowdsourcing studies for other environments and taxa.
  • Street tree inventories are used for a wide variety of purposes requiring varying levels of data accuracy and precision [32]. In deciding whether a citizen science virtual survey is appropriate for your purposes, consider how the data will be used and then evaluate whether virtual survey data can reasonably be expected to meet those needs. Our study indicates that virtual surveys may provide useful information for management purposes, but perhaps not for research applications requiring more accurate and detailed data, similar to the findings from field-based street tree volunteer inventories in Roman, et al. [32]. Kosmala, et al. [63] recommend that citizen science data should be of sufficient quality to address management applications or research questions, implying that some volunteer data may be “good enough” for specific uses [52].
  • Task complexity should be tailored to the expertise of the analyst. Novices may only be able to provide high quality data for basic variables like tree counts, street address, and broad size classes (e.g., small, medium, and large), while experts can produce more reliable data for more detailed tree attributes like genus [49]. When designing a study, familiarity with the potential pool of participants can help guide the level of task complexity to assign. An iterative process of study design and refinement should consider the data quality needed for the project objectives as well as the observed capabilities of volunteers [63].
  • For species identification, volunteers’ self-reported confidence level can be reported with each tree, or their overall identification skills can be evaluated with pre-tests. We observed substantially higher data quality when analysts were confident. Similarly, Roman, et al. [52] reported that crews had less confidence in the variables which showed the lowest consistency with experts. For virtual street tree surveys, it may be reasonable to accept the analyst’s tree identification when they are confident (particularly for experts and intermediate analysts). However, data quality results regarding the importance of prior knowledge and self-reported confidence levels have been mixed in other citizen science contexts [30].
  • Virtual surveys should not replace field inspections by qualified professionals for the purposes of identifying pest/pathogen problems (but see [64]). Similarly, virtual surveys are not appropriate for detailed assessments of tree risk because the analyst cannot examine the tree up close or from all angles, and because municipalities may want only certified arborists evaluating risk and pruning needs. However, for a very basic inventory that identifies standing dead trees in need of removal (as opposed to living trees that may be deemed structurally unstable or declining), virtual surveys may be appropriate [32,52,54].
  • Virtual surveys may not be suitable where in-person public engagement is a primary goal. While virtual survey analysts would engage with the city’s urban forestry program in the process of contributing data, virtual survey participants in general miss out on chances to engage with members of the public in the field [65], which occurs frequently as field crews inventory trees. For example, volunteers with a citizen science street tree inventory in New York City, NY were motivated by a desire to explore neighborhoods and meet new people [4]. However, virtual surveys may appeal to individuals who are physically disabled [66], and approaches such as gamification can deepen engagement and increase participation [67]. Future research about crowdsourcing in urban forestry could explore motivations for participation and the impacts of varied engagement approaches.
  • Consider how recent the imagery must be to meet management needs. Street-level imagery products such as GSV offer nearly complete coverage of cities in the USA and many other countries, but imagery updates are not guaranteed on a timeline that is compatible with your needs. If the management goal is to produce a baseline inventory of street trees, then outdated imagery may be acceptable. But if the goal is to update an existing inventory, newer imagery would likely be necessary to characterize changes since the previous inventory. For example, a virtual survey could potentially be used to monitor trees from a planting program to assess whether the trees are alive, standing dead, or removed, as long as the GSV images are recent. Urban forestry nonprofits sometimes use volunteers to do such monitoring in the field [13,52], but the potential for online data collection could generate more data about planting program performance across towns that do not have the institutional capacity for field work.
  • Implement a strategy to provide midstream feedback to analysts, as this can improve tree identification and estimation of DBH [49]. We provided analysts with illustrated examples of common tree species and GSV photos of trees in each DBH class, but analysts were not given feedback during the study to learn from their mistakes. Comparing their virtual survey data to field data for a subset of trees should help analysts refine the self-rated confidence and ultimately improve data quality. This strategy improved data quality in a previous study of virtual street tree surveys [49] and it aligns with feedback mechanisms designed to promote data quality and volunteer retention in other citizen science projects [63].
  • Rare taxa slow analysts down, so we recommend using virtual surveys to efficiently inventory common species and note the locations of unidentifiable trees, which could be identified later in the field. Alternatively, the analyst could save screen captures of trees that are difficult to identify, and then an expert could attempt to identify the trees based on the photos. Such expert validation is a well-established strategy employed in citizen science projects from other fields [63,68]. Rare species have been shown to have particularly low species identification quality for other projects and taxa [69,70].
  • Use this technique to update existing street tree inventories. In this study, analysts across all expertise groups excelled at documenting the locations of trees, but they struggled to identify trees to the species level and estimate DBH (Figure 2 and Figure 3). Existing inventories will already contain information on tree species and sizes, so the analysts can focus on documenting tree plantings and removals. We expect this simple assessment of tree presence/absence would offer significant time savings over both field surveys and the more detailed virtual surveys used in this study.

5. Conclusions

Virtual surveys using street-level imagery offer an alternative or complementary approach to field data collection for street tree inventories. Based on data generated by 16 volunteer analysts using Google Street ViewTM imagery, we assessed data quality by comparing agreement among analysts in three expertise groups, and by comparing analyst data to field data from the same locations. We found that self-identified experts generally produced higher-quality data than intermediate and novice analysts, but some individual intermediate analysts produced data of comparable quality to experts. Data quality was high across all expertise groups for the simplest variable (tree counts), and data quality decreased for more detailed variables like species identification. However, when analysts were confident in their genus and species identifications, their data typically agreed with the field data. In practical terms, these findings point to the possibility of using virtual surveys to efficiently collect high-quality tree location data using novice volunteers, and the possibility of collecting more detailed tree data using more skilled analysts. Additional research and practical application in the areas of citizen science and virtual tree surveys will continue to improve our understanding of data quality associated with these approaches. With increasing interest in volunteer-generated data [53] as well as street-level imagery in urban forestry research and management [42,43,44,48,49], it is important to determine appropriate use cases and best practices for citizen science virtual surveys.

Supplementary Materials

The following are available online at https://www.mdpi.com/1999-4907/10/4/349/s1, Document S1: Questionnaire to collect self-rated expertise information and participant background data, Document S2: Training materials for virtual street tree surveys in Google Street View, Document S3: Tree diameter reference guide, Document S4: Tree identification reference guide, Document S5: Study data.

Author Contributions

Conceptualization, A.B., L.A.R., and J.V; methodology, A.B., L.A.R., and J.V.; formal analysis, A.B.; investigation, A.B., L.A.R., and J.V.; data curation, A.B. and J.V.; writing—original draft preparation, A.B.; writing—review and editing, L.A.R., J.V., and A.B.; visualization, A.B.; funding acquisition, A.B., L.A.R., and J.V.

Funding

This research and the APC were funded by the Tree Research and Education Endowment Fund (TREE Fund), grant number #16-JD-01.

Acknowledgments

This research was supported by the TREE Fund’s John Z. Duling Grant (#16-JD-01). We are grateful to our volunteers for contributing virtual survey data, and to Kaitlyn Pike and Alli Preble for generating the field data. The Morton Arboretum guided us to select Dolton as a study area, and then helped us identify virtual survey participants.

Conflicts of Interest

The authors declare no conflict of interest. The funders had no role in the design of the study; in the collection, analyses, or interpretation of data; in the writing of the manuscript, or in the decision to publish the results.

References

  1. Nowak, D.J.; Noble, M.H.; Sisinni, S.M.; Dwyer, J.F. People and trees: Assessing the US urban forest resource. J. For. 2001, 99, 37–42. [Google Scholar] [CrossRef]
  2. Galenieks, A. Importance of urban street tree policies: A comparison of neighbouring Southern California cities. Urban For. Urban Green. 2017, 22, 105–110. [Google Scholar] [CrossRef]
  3. Roy, S. Anomalies in Australian municipal tree managers’ street-tree planting and species selection principles. Urban For. Urban Green. 2017, 24, 125–133. [Google Scholar] [CrossRef]
  4. Johnson, M.L.; Campbell, L.K.; Svendsen, E.S.; Silva, P. Why count trees? Volunteer motivations and experiences with tree monitoring in New York City. Arboric. Urban For. 2018, 44, 59–72. [Google Scholar]
  5. McPherson, G.; Simpson, J.R.; Peper, P.J.; Maco, S.E.; Xiao, Q. Municipal forest benefits and costs in five US cities. J. For. 2005, 103, 411–416. [Google Scholar]
  6. Mullaney, J.; Lucke, T.; Trueman, S.J. A review of benefits and challenges in growing street trees in paved urban environments. Landsc. Urban Plan. 2015, 134, 157–166. [Google Scholar] [CrossRef]
  7. Soares, A.L.; Rego, F.C.; McPherson, E.G.; Simpson, J.R.; Peper, P.J.; Xiao, Q. Benefits and costs of street trees in Lisbon, Portugal. Urban For. Urban Green. 2011, 10, 69–78. [Google Scholar] [CrossRef]
  8. Fischer, B.C.; Steed, B.C. Street trees—A misunderstood common-pool resource. In Proceedings of the 84th International Society of Arboriculture Annual Conference, St. Louis, MO, USA, 8 October 2008; p. 19. [Google Scholar]
  9. Ricard, R.M. Shade trees and tree wardens: Revising the history of urban forestry. J. For. 2005, 103, 230–233. [Google Scholar] [CrossRef]
  10. Mincey, S.K.; Hutten, M.; Fischer, B.C.; Evans, T.P.; Stewart, S.I.; Vogt, J.M. Structuring institutional analysis for urban ecosystems: A key to sustainable urban forest management. Urban Ecosyst. 2013, 16, 553–571. [Google Scholar] [CrossRef]
  11. Vogt, J.; Hauer, R.J.; Fischer, B.C. The costs of maintaining and not maintaining the urban forest: A review of the urban forestry and arboriculture literature. Arboric. Urban For. 2015, 41, 293–323. [Google Scholar]
  12. Östberg, J.; Delshammar, T.; Wiström, B.; Nielsen, A.B. Grading of parameters for urban tree inventories by city officials, arborists, and academics using the delphi method. Environ. Manag. 2013, 51, 694–708. [Google Scholar] [CrossRef] [PubMed]
  13. Roman, L.A.; McPherson, E.G.; Scharenbroch, B.C.; Bartens, J. Identifying common practices and challenges for local urban tree monitoring programs across the United States. Arboric. Urban For. 2013, 39, 292–299. [Google Scholar]
  14. Koeser, A.K.; Hauer, R.J.; Miesbauer, J.W.; Peterson, W. Municipal tree risk assessment in the United States: Findings from a comprehensive survey of urban forest management. Arboric. J. 2016, 38, 218–229. [Google Scholar] [CrossRef]
  15. Bond, J. Best Management Practices—Tree inventories; International Society of Arboriculture: Champaign, IL, USA, 2013; p. 35. [Google Scholar]
  16. Harris, R.; Clark, J.; Matheny, N. Arboriculture: Integrated Management of Landscape Trees, Shrubs, and Vines, 4th ed.; Prentice Hall: Upper Saddle River, NJ, USA, 2004; p. 592. [Google Scholar]
  17. McPherson, E.G.; Kotow, L. A municipal forest report card: Results for California, USA. Urban For. Urban Green. 2013, 12, 134–143. [Google Scholar] [CrossRef]
  18. Sjöman, H.; Östberg, J.; Bühler, O. Diversity and distribution of the urban tree population in ten major Nordic cities. Urban For. Urban Green. 2012, 11, 31–39. [Google Scholar] [CrossRef] [Green Version]
  19. Cowett, F.D.; Bassuk, N.L. Statewide assessment of street trees in New York State, USA. Urban For. Urban Green. 2014, 13, 213–220. [Google Scholar] [CrossRef]
  20. Maco, S.E.; McPherson, E.G. A practical approach to assessing structure, function, and value of street tree populations in small communities. J. Arboric. 2003, 29, 84–97. [Google Scholar]
  21. Ordóñez, C.; Duinker, P.N. An analysis of urban forest management plans in Canada: Implications for urban forest management. Landsc. Urban Plan. 2013, 116, 36–47. [Google Scholar] [CrossRef]
  22. Stobbart, M.; Johnston, M. A Survey of Urban Tree Management in New Zealand. Arboric. Urban For. 2012, 38, 247–254. [Google Scholar]
  23. Kenney, W.A.; van Wassenaer, P.J.E.; Satel, A.L. Criteria and indicators for strategic urban forest planning and management. Arboric. Urban For. 2011, 37, 108–117. [Google Scholar]
  24. Dickinson, J.L.; Shirk, J.; Bonter, D.; Bonney, R.; Crain, R.L.; Martin, J.; Phillips, T.; Purcell, K. The current state of citizen science as a tool for ecological research and public engagement. Front. Ecol. Environ. 2012, 10, 291–297. [Google Scholar] [CrossRef] [Green Version]
  25. Conrad, C.C.; Hilchey, K.G. A review of citizen science and community-based environmental monitoring: Issues and opportunities. Environ. Monit. Assess. 2011, 176, 273–291. [Google Scholar] [CrossRef] [PubMed]
  26. Bancks, N.; North, E.A.; Johnson, G.R. An analysis of agreement between volunteer- and researcher-collected urban tree inventory data. Arboric. Urban For. 2018, 44, 73–86. [Google Scholar]
  27. Bloniarz, D.V.; Ryan, H. The use of volunteer initiatives in conducting urban forest resource inventories. J. Arboric. 1996, 22, 75–82. [Google Scholar]
  28. Estellés-Arolas, E.; Navarro-Giner, R.; González-Ladrón-de-Guevara, F. Crowdsourcing fundamentals: Definition and typology. In Advances in Crowdsourcing; Garrigos-Simon, F., Gil-Pechuán, I., Estelles-Miguel, S., Eds.; Springer: Cham, Switzerland, 2015; pp. 33–48. [Google Scholar]
  29. Newman, G.; Wiggins, A.; Crall, A.; Graham, E.; Newman, S.; Crowston, K. The future of citizen science: Emerging technologies and shifting paradigms. Front. Ecol. Environ. 2012, 10, 298–304. [Google Scholar] [CrossRef]
  30. Lewandowski, E.; Specht, H. Influence of volunteer and project characteristics on data quality of biological surveys. Conserv. Biol. 2015, 29, 713–723. [Google Scholar] [CrossRef]
  31. Gillett, D.J.; Pondella, D.J.; Freiwald, J.; Schiff, K.C.; Caselle, J.E.; Shuman, C.; Weisberg, S.B. Comparing volunteer and professionally collected monitoring data from the rocky subtidal reefs of Southern California, USA. Environ. Monit. Assess. 2012, 184, 3239–3257. [Google Scholar] [CrossRef] [PubMed]
  32. Roman, L.A.; Scharenbroch, B.C.; Östberg, J.P.A.; Mueller, L.S.; Henning, J.G.; Koeser, A.K.; Sanders, J.R.; Betz, D.R.; Jordan, R.C. Data quality in citizen science urban tree inventories. Urban For. Urban Green. 2017, 22, 124–135. [Google Scholar] [CrossRef]
  33. Brandon, A.; Spyreas, G.; Molano-Flores, B.; Carroll, C.; Ellis, J. Can volunteers provide reliable data for forest vegetation surveys? Nat. Areas J. 2003, 23, 254–262. [Google Scholar]
  34. Crown, C.A.; Greer, B.Z.; Gift, D.M.; Watt, F.S. Every Tree Counts: Reflections on NYC’s Third Volunteer Street Tree Inventory. Arboric. Urban For. 2018, 44, 49–58. [Google Scholar]
  35. Hauer, R.; Peterson, W. Municipal Tree Care and Management in the United States: A 2014 Urban & Community Forestry Census of Tree Activities; College of Natural Resources, University of Wisconsin-Stevens Point: Stevens Point, WI, USA, 2016; p. 71. [Google Scholar]
  36. Cozad, S.; McPherson, E.G.; Harding, J.A. STRATUM Case Study Evaluation in Minneapolis, Minnesota; Center for Urban Forest Research, USDA Forest Service, Pacific Southwest Research Station: Davis, CA, USA, 2005.
  37. Nowak, D.J.; Rowntree, R.A.; McPherson, E.G.; Sisinni, S.M.; Kerkmann, E.R.; Stevens, J.C. Measuring and analyzing urban tree cover. Landsc. Urban Plan. 1996, 36, 49–57. [Google Scholar] [CrossRef] [Green Version]
  38. Rowntree, R.A. Forest canopy cover and land use in four Eastern United States cities. Urban Ecol. 1984, 8, 55–67. [Google Scholar] [CrossRef]
  39. Zhang, Y. Texture-integrated classification of urban treed areas in high-resolution color-infrared imagery. Photogramm. Eng. Remote Sens. 2001, 67, 1359–1365. [Google Scholar]
  40. Ossola, A.; Hopton, M.E. Measuring urban tree loss dynamics across residential landscapes. Sci. Total Environ. 2018, 612, 940–949. [Google Scholar] [CrossRef] [PubMed]
  41. Alonzo, M.; Bookhagen, B.; Roberts, D.A. Urban tree species mapping using hyperspectral and lidar data fusion. Remote Sens. Environ. 2014, 148, 70–83. [Google Scholar] [CrossRef]
  42. Li, X.; Zhang, C.; Li, W.; Ricard, R.; Meng, Q.; Zhang, W. Assessing street-level urban greenery using Google Street View and a modified green view index. Urban For. Urban Green. 2015, 14, 675–685. [Google Scholar] [CrossRef]
  43. Li, X.; Zhang, C.; Li, W.; Kuzovkina, Y.A.; Weiner, D. Who lives in greener neighborhoods? The distribution of street greenery and its association with residents’ socioeconomic conditions in Hartford, Connecticut, USA. Urban For. Urban Green. 2015, 14, 751–759. [Google Scholar] [CrossRef]
  44. Long, Y.; Liu, L. How green are the streets? An analysis for central areas of Chinese cities using Tencent Street View. PLoS ONE 2017, 12, e0171110. [Google Scholar] [CrossRef] [PubMed]
  45. Richards, D.R.; Edwards, P.J. Quantifying street tree regulating ecosystem services using Google Street View. Ecol. Indic. 2017, 77, 31–40. [Google Scholar] [CrossRef]
  46. Li, X.; Ratti, C.; Seiferling, I. Quantifying the shade provision of street trees in urban landscape: A case study in Boston, USA, using Google Street View. Landsc. Urban Plan. 2018, 169, 81–91. [Google Scholar] [CrossRef]
  47. Seiferling, I.; Naik, N.; Ratti, C.; Proulx, R. Green streets—Quantifying and mapping urban trees with street-level imagery and computer vision. Landsc. Urban Plan. 2017, 165, 93–101. [Google Scholar] [CrossRef]
  48. Branson, S.; Wegner, J.D.; Hall, D.; Lang, N.; Schindler, K.; Perona, P. From Google Maps to a fine-grained catalog of street trees. ISPRS J. Photogramm. Remote Sens. 2018, 135, 13–30. [Google Scholar] [CrossRef]
  49. Berland, A.; Lange, D.A. Google Street View shows promise for virtual street tree surveys. Urban For. Urban Green. 2017, 21, 11–15. [Google Scholar] [CrossRef]
  50. Bassuk, N.L. Street tree diversity—Making better choices for the urban landscape. In Proceedings of the 7th Conference of the Metropolitan Tree Improvement Alliance, Lisle, IL, USA, 11–12 June 1990; pp. 71–78. [Google Scholar]
  51. Rooney, C.J.; Ryan, H.D.P.; Bloniarz, D.V.; Kane, B.C.P. The reliability of a windshield survey to locate hazards in roadside trees. J. Arboric. 2005, 31, 89–94. [Google Scholar]
  52. Roman, L.A.; Smith, B.C.; Dentice, D.; Maslin, M.; Abrams, G. Monitoring young tree survival with citizen scientists: The evolving Tree Checkers Program in Philadelphia, PA. Arboric. Urban For. 2018, 44, 255–265. [Google Scholar]
  53. Roman, L.A.; Campbell, L.K.; Jordan, R.C. Civic science in urban forestry: An introduction. Arboric. Urban For. 2018, 44, 41–48. [Google Scholar]
  54. Maldonado, S. Philly mapped street trees for smarter maintenance. PlanPhilly, 29 July 2016. [Google Scholar]
  55. Butt, N.; Slade, E.; Thompson, J.; Malhi, Y.; Riutta, T. Quantifying the sampling error in tree census measurements by volunteers and its effect on carbon stock estimates. Ecol. Appl. 2013, 23, 936–943. [Google Scholar] [CrossRef] [PubMed] [Green Version]
  56. Harrison, B.; Martin, T.E.; Mustari, A.H. The accuracy of volunteer surveyors for obtaining tree measurements in tropical forests. Ambio 2019, 1–9. [Google Scholar] [CrossRef]
  57. US Census Bureau. American FactFinder. Available online: http://factfinder.census.gov/ (accessed on 13 March 2019).
  58. Village of Dolton. Public Works. Available online: https://vodolton.org/departments/public-works/ (accessed on 13 March 2019).
  59. Nowak, D.J.; Hoehn, R.; Bodine, A.R.; Crane, D.E.; Dwyer, J.F.; Bonnewell, V.; Watson, G. Urban Trees and Forests of the Chicago Region; Resource Bulletin NRS-84; USDA Forest Service Northern Research Station: Newtown Square, PA, USA, 2013.
  60. Krippendorff, K. Reliability in content analysis. Hum. Commun. Res. 2004, 30, 411–433. [Google Scholar] [CrossRef]
  61. Hayes, A.F.; Krippendorff, K. Answering the call for a standard reliability measure for coding data. Commun. Methods Meas. 2007, 1, 77–89. [Google Scholar] [CrossRef]
  62. Proutskova, P.; Gruszczynski, M. kripp.boot: Bootstrap Krippendorff’s alpha Intercoder Relability Statistic, R package, version 1.0.0; 2017; Available online: https://github.com/MikeGruz/kripp.boot (accessed on 19 April 2019).
  63. Kosmala, M.; Wiggins, A.; Swanson, A.; Simmons, B. Assessing data quality in citizen science. Front. Ecol. Environ. 2016, 14, 551–560. [Google Scholar] [CrossRef]
  64. Rousselet, J.; Imbert, C.-E.; Dekri, A.; Garcia, J.; Goussard, F.; Vincent, B.; Denux, O.; Robinet, C.; Dorkeld, F.; Roques, A.; et al. Assessing species distribution using Google Street View: A pilot study with the pine processionary moth. PLoS ONE 2013, 8, e74918. [Google Scholar] [CrossRef]
  65. Mooney, S.J.; Bader, M.D.M.; Lovasi, G.S.; Teitler, J.O.; Koenen, K.C.; Aiello, A.E.; Galea, S.; Goldmann, E.; Sheehan, D.M.; Rundle, A.G. Street audits to measure neighborhood disorder: Virtual or in-person? Am. J. Epidemiol. 2017, 186, 265–273. [Google Scholar] [CrossRef]
  66. Baruch, A.; May, A.; Yu, D. The motivations, enablers and barriers for voluntary participation in an online crowdsourcing platform. Comput. Hum. Behav. 2016, 64, 923–931. [Google Scholar] [CrossRef] [Green Version]
  67. Morschheuser, B.; Hamari, J.; Koivisto, J.; Maedche, A. Gamified crowdsourcing: Conceptualization, literature review, and future agenda. Int. J. Hum. Comput. Stud. 2017, 106, 26–43. [Google Scholar] [CrossRef]
  68. Wiggins, A.; Newman, G.; Stevenson, R.; Crowston, K. Mechanisms for data quality and validation in citizen science. In Proceedings of the 2011 IEEE Seventh International Conference on e-Science Workshops, Stockholm, Sweden, 5–8 December 2011; 2011; pp. 14–19. [Google Scholar]
  69. Gardiner, M.M.; Allee, L.L.; Brown, P.M.; Losey, J.E.; Roy, H.E.; Smyth, R.R. Lessons from lady beetles: Accuracy of monitoring data from US and UK citizen-science programs. Front. Ecol. Environ. 2012, 10, 471–476. [Google Scholar] [CrossRef]
  70. Swanson, A.; Kosmala, M.; Lintott, C.; Packer, C. A generalized approach for producing, quantifying, and validating citizen science data from wildlife images. Conserv. Biol. 2016, 30, 520–531. [Google Scholar] [CrossRef] [Green Version]
Figure 1. Krippendorff’s alpha scores summarizing interrater agreement among all analysts for all variables, with 95% confidence intervals. Different letters indicate significantly different analyst agreement.
Forests 10 00349 g001
Figure 2. Krippendorff’s alpha scores summarizing interrater agreement within analyst expertise groups by tree variable, with 95% confidence intervals. For each variable, different letters indicate significantly different analyst agreement across expertise groups.
Forests 10 00349 g002
Figure 3. Krippendorff’s alpha scores with 95% confidence intervals characterizing agreement between individual analysts and the field data.
Forests 10 00349 g003
Table 1. Year and month of Google Street View imagery availability for the street segments included in the virtual survey.
Year% of TotalMonth% of Total
20093June< 1
201133July38
201251August55
20141September2
20157November5
20161
20175
Table 2. Comparison of time spent per tree during data collection. Group ranges are in parentheses for virtual survey analysts.
Analyst GroupMinutes Per Tree
All virtual survey analysts3.01 (1.07–8.75)
Expert1.45 (1.07–1.90)
Intermediate3.41 (1.45–8.75)
Novice4.23 (2.99–7.16)
Field crew 13.14
1 Field crew times do not include travel time to and from the study area or organization of equipment. The field crew included two people, whereas the virtual survey analysts worked alone.
Table 3. Diameter at breast height (DBH) classification outcomes by percent, summarized by diameter class and analyst expertise. Agree indicates agreement with the field measurement, Under indicates the percent of observations for which the virtual survey analyst underestimated DBH relative to the field measurement, and Over indicates the percent of observations for which the virtual survey analyst overestimated DBH relative to the field measurement.
AllExpertIntermediateNovice
DBH classUnderAgreeOverUnderAgreeOverUnderAgreeOverUnderAgreeOver
0–7.6 cm
(n = 1)
--0100--0100--0100--0100
7.6–15.2 cm
(n = 4)
33551220701048485185527
15.2–30.5 cm
(n = 14)
414614404713483913285616
30.5–45.7 cm
(n = 64)
34491740481233422527659
45.7–61.0 cm
(n = 103)
563595437954341366332
61.0–76.2 cm
(n = 84)
73234613377522385141
76.2 + cm
(n = 61)
8020--7426--8416--8020--
All trees
(n = 331)
603285637861291064324
Table 4. Genus identification summarized by analyst expertise. NA indicates the genus was not encountered by an analyst from that group.
GenusField Relative
Frequency (%)
Percent Agreement with Field Identification
AllExpertIntermediateNovice
Apple (Malus Mill.)0.6757510025
Ash (Fraxinus L.)5.555785810
Cedar (Thuja L.)0.360100500
Cherry (Prunus L.)0.6605050100
Dogwood (Cornus L.)0.3135000
Elm (Ulmus L.)9.245684020
Ginkgo (Ginkgo L.)0.643670100
Hackberry (Celtis L.)0.33367250
Honeylocust (Gleditsia L.)2.868779021
Linden (Tilia L.)2.253576032
Magnolia (Magnolia L.)0.6501000NA
Maple (Acer L.)72.694959688
Mulberry (Morus L.)0.3000NA
Oak (Quercus L.)0.99310083100
Redbud (Cercis L.)0.3100100100NA
Spruce (Picea A. Dietr.)0.3881008975
Sweetgum (Liquidambar L.)0.6100100100NA
Sycamore (Platanus L.)0.95671690
Tuliptree (Liriodendron L.)0.9721005083
All trees100.084898774
Table 5. Percent of total ratings and percent agreement with field data by confidence level and expertise level for genus and species identification.
ConfidentSomewhat ConfidentNot Confident
Expertise% of Ratings% Agreement% of Ratings% Agreement% of Ratings% Agreement
Genus
All analysts75.994.513.466.310.736.4
Expert77.098.710.877.012.238.8
Intermediate80.894.110.466.18.846.3
Novice64.888.922.859.912.419.5
Species
All analysts50.289.639.650.010.223.3
Expert47.596.040.959.611.626.1
Intermediate57.789.833.846.58.428.4
Novice38.978.749.444.711.712.5

