Article

Robinia pseudoacacia L. in Short Rotation Coppice: Seed and Stump Shoot Reproduction as well as UAS-based Spreading Analysis

1
Forest Growth and Yield Science, School of Life Sciences Weihenstephan, Technische Universität München, Hans-Carl-von-Carlowitz-Platz 2, 85354 Freising, Germany
2
Forestry and Ecosystem Management, University of Applied Sciences Erfurt, Leipziger Strasse 77, 99085 Erfurt, Germany
3
Institute of Landscape Ecology, University of Muenster, Heisenbergstrasse 2, 48149 Muenster, Germany
*
Author to whom correspondence should be addressed.
Forests 2019, 10(3), 235; https://doi.org/10.3390/f10030235
Submission received: 23 January 2019 / Revised: 11 February 2019 / Accepted: 28 February 2019 / Published: 6 March 2019
(This article belongs to the Special Issue Forestry Applications of Unmanned Aerial Vehicles (UAVs) 2019)

Abstract

:
Varying reproduction strategies are an important trait that tree species need in order both to survive and to spread. Black locust is able to reproduce via seeds, stump shoots, and root suckers. However, little research has been conducted on the reproduction and spreading of black locust in short rotation coppices. This research study focused on seed germination, stump shoot resprout, and spreading by root suckering of black locust in ten short rotation coppices in Germany. Seed experiments and sample plots were analyzed for the study. Spreading was detected and measured with unmanned aerial system (UAS)-based images and classification technology—object-based image analysis (OBIA). Additionally, the classification of single UAS images was tested by applying a convolutional neural network (CNN), a deep learning model. The analyses showed that seed germination increases with increasing warm-cold variety and scarification. Moreover, it was found that the number of shoots per stump decreases as shoot age increases. Furthermore, spreading increases with greater light availability and decreasing tillage. The OBIA and CNN image analysis technologies achieved 97% and 99.5% accuracy for black locust classification in UAS images. All in all, the three reproduction strategies of black locust in short rotation coppices differ with regards to initialization, intensity, and growth performance, but all play a role in the survival and spreading of black locust.

Graphical Abstract

1. Introduction

The spreading of tree species is influenced by overcoming barriers (e.g., geographical) as well as survival and reproduction strategies. Trees are able to reproduce generatively via seeds, and vegetatively as well, for example via stump shoots or root suckers. Nevertheless, little research has been conducted on the reproduction and spreading strategies of black locust in short rotation coppices. However, examining the details within a holistic perspective of reproduction strategies for tree species may improve the estimation of spreading and survival potential, especially of non-native or invasive tree species.
Black locust (Robinia pseudoacacia L.) originated in the eastern part of North America, particularly in the Appalachian regions [1,2]. By the early 17th century, black locust had been introduced to Europe [3,4,5,6]. Today, black locust appears in many European countries, especially in Hungary, Northern Germany, Western Poland, Czech Republic, Southern Slovakia, and Eastern Austria [6]. In Germany, a change in energy policies aimed towards a reduction in the use of fossil fuels and greater utilization of renewable energy since 2004 [7] marked an increase in fast-growing tree production, including black locust in short rotation coppices (harvested every 2–20 years) [8,9]. Nevertheless, some studies have declared black locust to be an invasive non-native tree species in Europe [6,10,11,12]. However, other studies consider black locust to be an alternative tree species, for example for European ash (Fraxinus excelsior) [13,14], whose high dieback is caused by the fungal pathogen Hymenoscyphus fraxineus [14].
Black locust possesses many growth characteristics that makes it ideal for short-rotation biomass production such as: rapid growth, high drought tolerance, and nitrogen-fixation [15,16], as well as the ability to reproduce via stump shoots in response to harvest. Black locust starts flowering at the age of six years [17]. Many insects benefit from this characteristic, including honeybees [18]. Moreover, the production of black locust honey is very common and economically important, especially in Hungary [17]. A maximum of 15,559 flowers per tree were counted in an eight-year-old black locust plantation [18], and 12,000 seeds/m2 were identified in a monodominant stand [6,19]; black locust thus produces an abundance of seeds. As black locust belongs to the Fabaceae family, the seed coat is hard and impermeable [20,21]. Hence, seeds require scarification for successful germination [21,22,23] and priming of seeds is favorable [21,24,25]. Seeds prefer mineral-rich sandy and loamy-sandy soil [17,26,27]. Additionally, seeds are dormant [28] and Voss and Edward [29] observed germination of black locust seeds 88 years after the seeds were collected. Moreover, increasing germination and seedling density was observed in the year immediately following a fire event; it is likely that some seeds survive fire and benefit from the light availability [30,31,32]. Nevertheless, scarification intensity has not been researched much, particularly in seeds from an eight-year-old short rotation coppice.
Vegetative reproduction strategies of black locust include re-sprouting stump shoots and root suckers. Stump shoot sprouting occurs in many broad-leafed trees in response to harvest or damage and is a characteristic feature of the special forest management practice known as (short rotation) coppicing. Stump shoots typically grow in densely populated stands and often have several shoots per stump. The biomass production differs compared to non-harvested trees, especially for black locust [33]. To account for this, specific yield tables and growth models for coppices of different broad-leafing tree species were developed [34,35,36,37,38,39,40,41,42,43,44,45,46]. Moreover, in nutrient-poor and sandy forest stands, a decreasing number of black locust stump shoots with increasing shoot age and a wide variety of stump shoots depending on the stump distance and stump age was observed [47,48]. However, the sprouting intensity and dieback of black locust shoots with increasing shoot age in densely populated short rotation coppices have not been a focus of research up to now.
The spreading of black locust short rotation coppice seems to take place primarily via root suckering [49]. Root suckers are shoots which grow from adventitious buds in roots of trees or shrubs. Crosti et al. [50] observed decreasing spreading intensity of black locust in orchards and nearby forests in Italy. Furthermore, Vítková et al. [6] published an overview of the distribution of black locust in central and eastern Europe on a landscape scale based on inventory data. However, there is a lack of knowledge about the spreading potential of black locust on a small scale, particularly with respect to short rotation coppice. Thereby, tree species detection and spreading could be analyzed via field measurements [50], satellite data [51,52], airplanes, or unmanned aerial systems (UAS) [53,54,55,56,57,58,59,60,61,62,63]. Field measurements are usually time consuming. Satellite data can be used to detect ecosystem structures and changes for large areas [64,65,66,67,68]. However, fine-scale field maps are difficult to generate from satellite or airplane data because they have a low spatial and temporal resolution and are generally expensive. Therefore, UAS allow the detection of ecosystem structures and changes offering a higher spatial resolution of small, specific, and detailed vegetation structures [18,69]. Additionally, UAS have quick turnaround times, are very cost-efficient and are useful supplements to data from satellites, airplanes, terrestrial manual, and other data analyses. Invasiveness analysis using UAS was demonstrated by Lehmann et al. [70] for invasive Acacia mangium management in Brazil. Müllerová et al. [71] conclude that the near-infrared (NIR) spectrum is very important for detecting black locust via satellite and UAS. Common approaches to analyzing UAS images are pixel-based analysis [18] and object-based image analysis (OBIA) [70], primarily including structure from motion (SfM) point clouds [53,54,55,57,58,60]. Nevertheless, OBIA has not yet been used to analyze the spreading of black locust in short rotation coppices.
Furthermore, there is an increasing interest in machine learning algorithms for data and image analysis, such as the application of the random forest model [52,72,73,74,75,76], support vector machine [73,74,75,76], and deep learning algorithms, especially convolutional neural networks (CNNs) [62,73,75,77,78,79]. However, CNNs were not previously utilized for the classification of black locust in short rotation coppices under varying conditions in single images.
The main purpose of this study is to estimate and monitor the invasiveness potential of black locust. Therefore, in the current study, we analyze the seed germination, stump shoot survival, and spreading of black locust planted in short rotation coppices. We investigate the seed germination of 3000 seeds, focusing on six different seed experiments. After the treatment, the seeds were seeded in planting boxes and watered. Moreover, we estimate black locust stump shoot sprouting and dieback with the aid of sample plots in seven different sample areas, including 5244 stump shoots. For this purpose, the relationship of the planted trees and the current shoots per stump were calculated. Additionally, spreading was estimated in short rotation coppices at a length of 2124 m based on UAS images by using OBIA. Furthermore, a deep learning algorithm was tested to classify black locust under varying light conditions, flying altitudes, UAS, and cameras in single images. This study deals with the following research questions:
(1)
What is the average germination of black locust seeds after six different seed treatments?
(2)
How many stump shoots survive in short rotation coppices depending on shoot age?
(3)
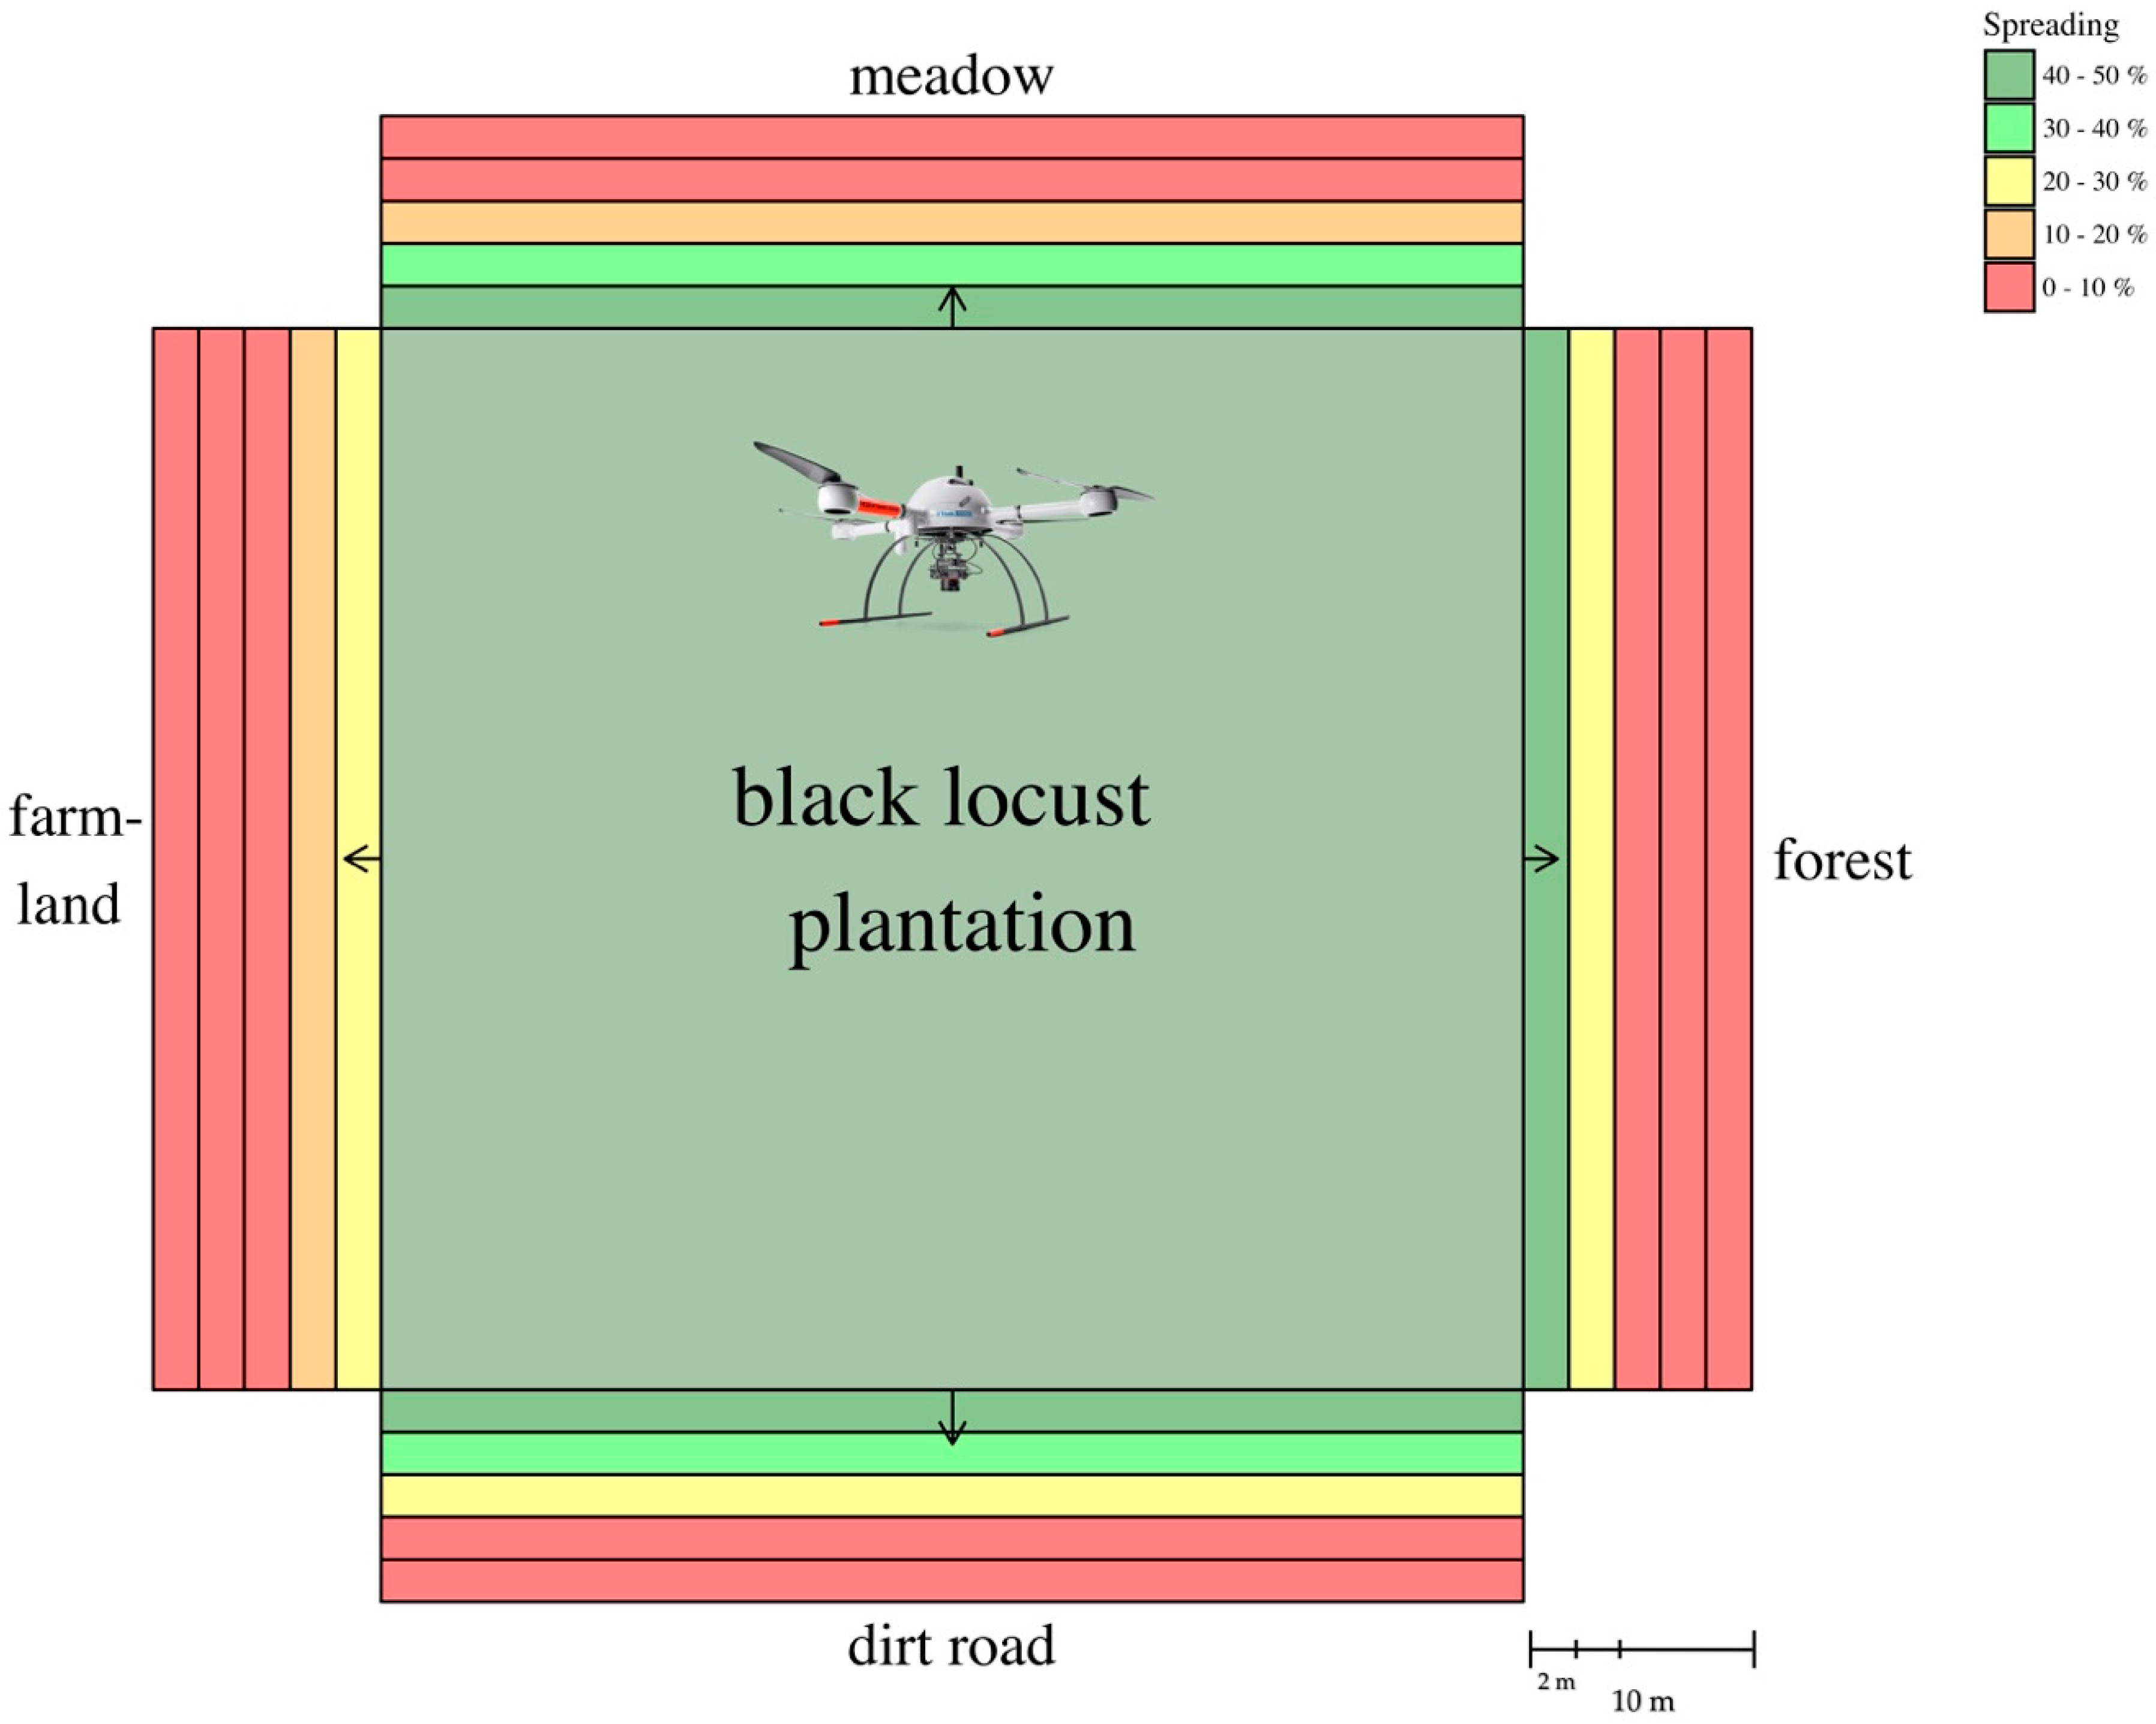
What is the average sprouting distance of black locust, depending on neighboring forest, meadow, farmland, and along a dirt road analyzed via OBIA in UAS images?
(4)
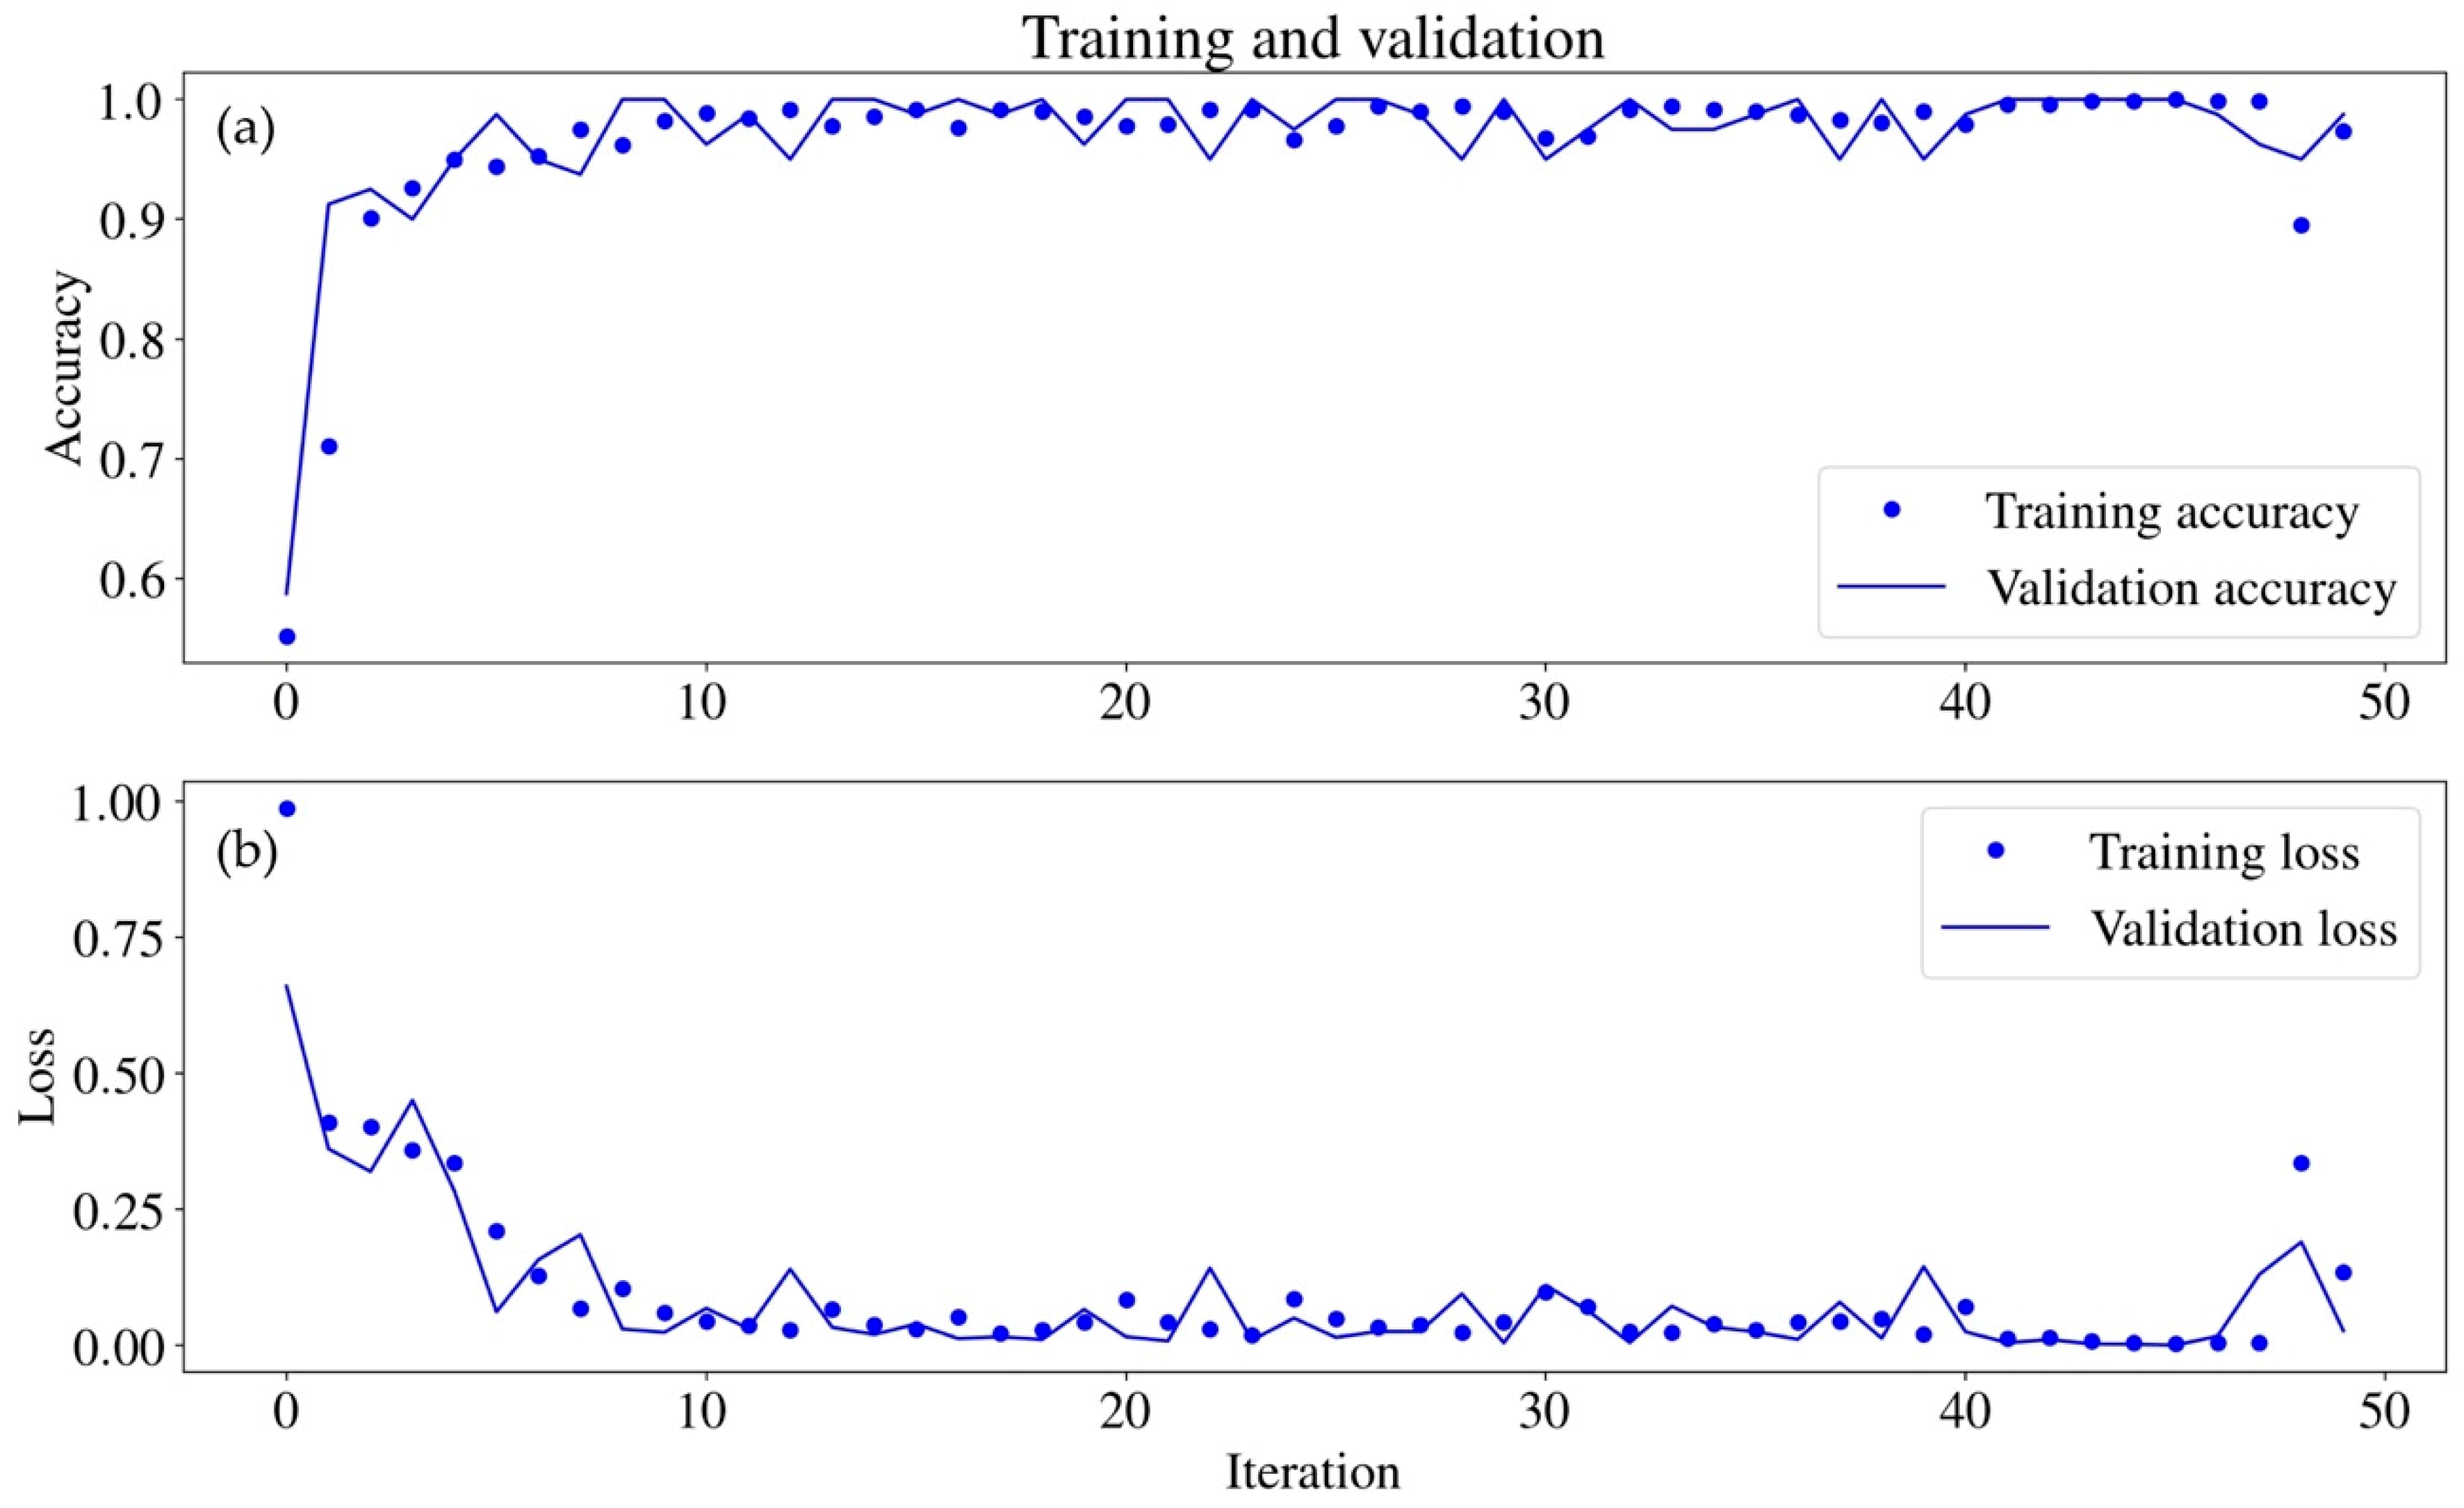
What is the accuracy and loss of black locust classification in single UAS images under varying conditions by using a CNN?

2. Materials and Methods

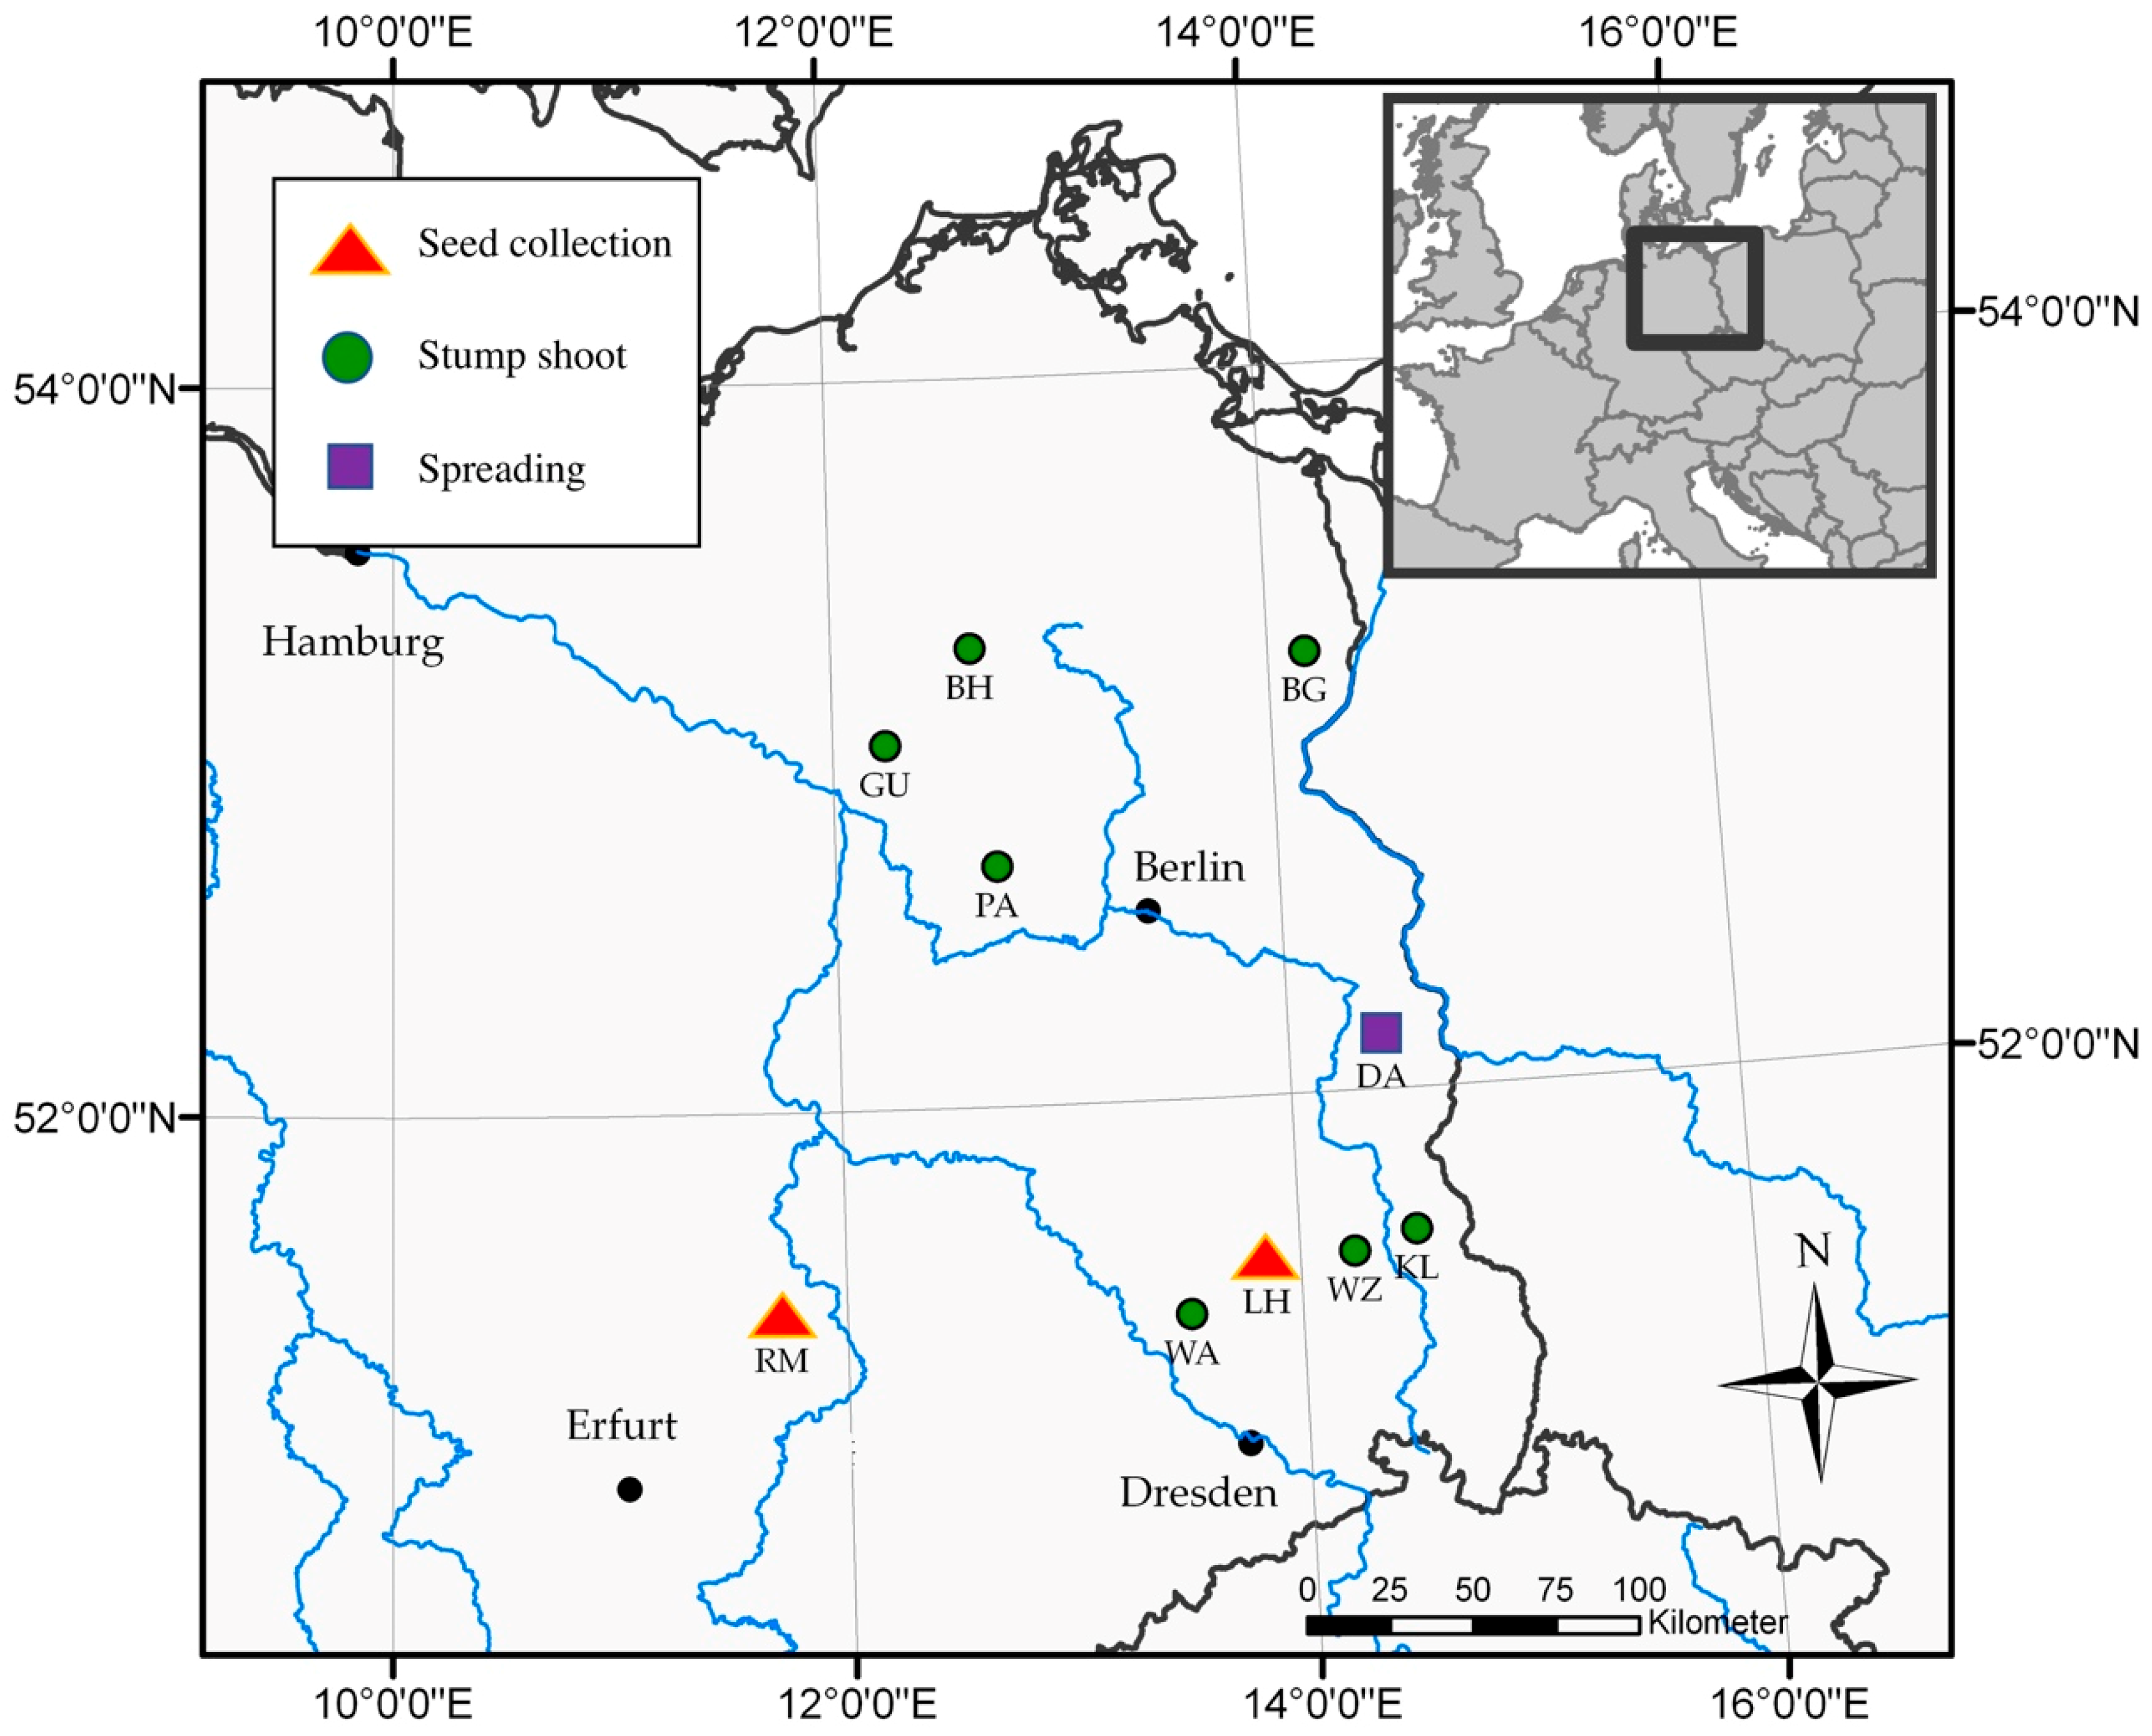
2.1. Site Description

The ten analyzed study sites were located in northeastern Germany (Table 1, Figure 1). The annual precipitation ranges between 495 mm and 671 mm and the mean annual temperature ranges between 7.4 °C and 9.4 °C [80]. The elevation above sea level is 22 to 149 m. Seeds were collected in winter 2016 in two eight-year-old R. pseudoacacia short rotation plantations in Germany (Lauchhammer and Röblingen). Thereafter, the seeds were stored in a seed bank (Thuringia, Germany). Stump shoot sample plots in seven study sites were analyzed between November 2016 and March 2017. The UAS images and field data for the spreading analysis were collected in May 2018 in Grunow-Dammendorf (Germany).

2.2. Reproduction Analysis

The analysis was divided into three parts (Figure 2) to estimate the reproduction and spreading of black locust: seed, stump shoot, and root suckering analysis. Seed germination was undertaken to determine differences in seed treatments. Sample plots were used for the stump shoot analysis, which was conducted to analyze the number of shoots per stump depending on the shoot age. Spreading was analyzed by using an UAS and image analysis to observe the spreading from a bird’s-eye view.

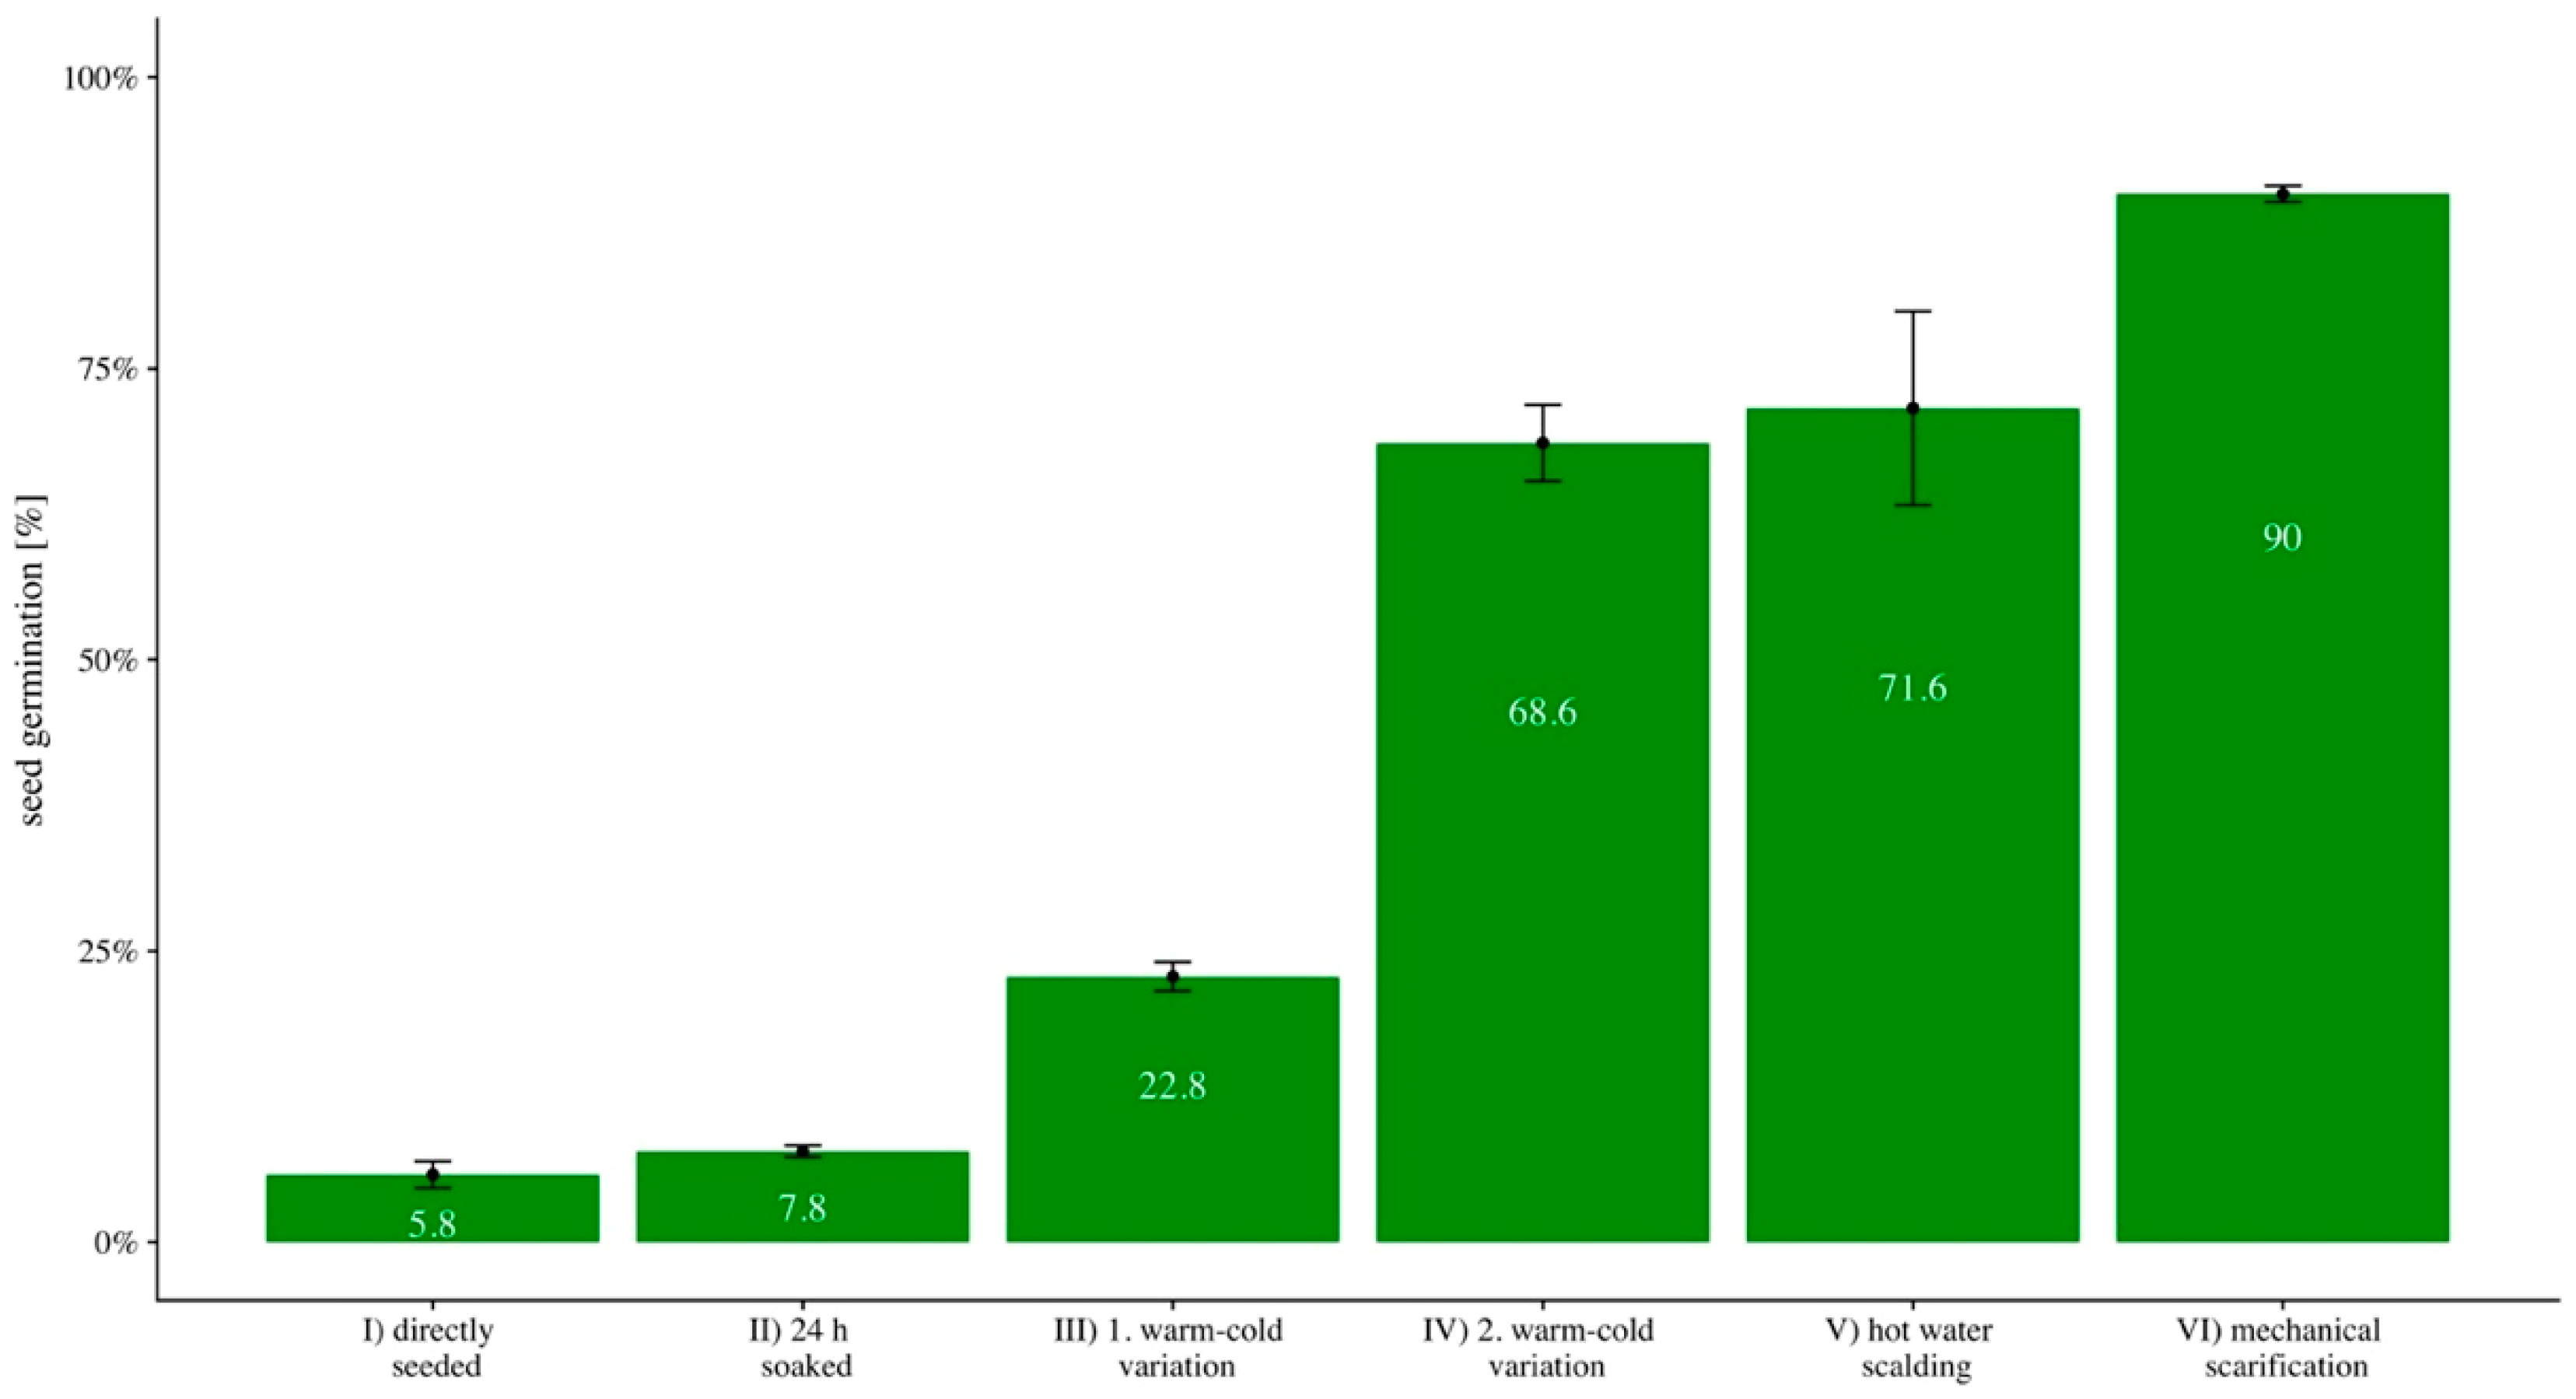
2.3. Seed Germination

The analysis of the seeds started in March 2018 and finished in July 2018. The seeds were seeded in sandy mineral soil in planting boxes. We tested 100 seeds in five iterations for six treatments (3000 seeds):
(I)
seeds were seeded and watered,
(II)
seeds were soaked for 24 h in water at a water temperature of 18 °C (64.4 °F) and then seeded and watered,
(III)
seeds were stored at an air temperature of 45 °C (113 °F) for two hours, and thereafter stored at an air temperature of −20 °C (−4 °F) for a further two hours and then seeded and watered,
(IV)
seeds were stored at an air temperature of 60 °C (140 °F) for two hours and thereafter stored for two hours at an air temperature of −20 °C (−4 °F) and then seeded and watered,
(V)
seeds were scalded with hot water, seeded and watered, and
(VI)
seeds were mechanically scarified, seeded and watered.
We calculated the average seed germination, standard deviation (SD) and standard error of the mean (SE) for each seed treatment. Furthermore, we performed an analysis of variance (ANOVA) with the software R [83]. Seed data were (1) variance heterogeneous and (2) normally distributed. Therefore, we applied a one-way analysis of means and pairwise t-test for pairwise comparisons [83,84].

2.4. Stump Shoot Analysis

In total, 5244 black locust stump shoots were investigated, measuring leafless stump shoots in 33 sample plots. Sample plots sizes ranged from 4 to 6 m radius and contained a minimum of 150 stump shoots. All stump shoots in the sample plot were counted. Furthermore, the planting distance was listed by the land manager and checked on the study sites. The measured number of stump shoots per sample plot was divided by the number of established/planted black locust trees to calculate the average number of shoots per stump, per site, and per age class. Moreover, we calculated SD, SE, confidence interval (CI) with a default of 95% for each age class and performed an ANOVA [83]. Stump shoot data were (1) variance homogeneous and (2) normally distributed. Hence, we applied an ANOVA as global test and Tukey test for pairwise comparisons [83,84].

2.5. Root Suckering (Spreading)

Two quadrocopters were used as a UAS platform: Microdrones MD4-1000 [82] and dji Mavic Pro [85]. The Microdrones MD4-1000 was equipped with two camera systems synchronously for the image collection: a multispectral MAPIR Survey 3 (red, green, NIR) camera [86] with an image size of 4000 × 3000 and a red-green-blue (RGB) SONY-ILCE-5100 [87] camera with a picture size of 6000 × 4000. Furthermore, the dji Mavic Pro took images with the aid of the RGB camera DJI FC220 (picture size of 4000 × 3000) [85]. Weather conditions were calm, and the lighting conditions varied between sunny and cloudy.

2.5.1. Object-Based Analysis (OBIA)

The analyzed total length was 2124 m, whereby the neighboring areas were comprised of meadow (726 m), farmland (565 m), dirt road (293 m), and pine forest (540 m). For georeferencing purposes, 13 white ground control points were randomly placed. In addition, planting lines were calibrated by using a mobile differential global positioning system [88]. The altitude above ground level was set at 30 m. To create 3D point cloud surface models, the image side and forward overlap were set to 80% [89]. RGB and NIR image data were orthorectified and mosaicked using Pix4D mapper software [90] to create a high-resolution orthoimagery. An SfM approach was used to calculate the digital surface models.
In eCognition Developer software [91], the classification procedure via OBIA consisted of two major steps: (A) segmentation and (B) classification. The multiresolution segmentation was used to aggregate neighboring pixels into segments based on homogeneity criteria (shape, texture, color, compactness, smoothness) and a scale factor (scale parameter) [92]. For the R. pseudoacacia classification, the subsequent OBIA was performed using class-specific features. This involved spectral information such as the mean green value, as black locust leaves have a specific light green. Furthermore, the vegetation height (digital surface model–digital terrain model) has the advantage of classifying distinctions of vegetation height for grass as well as trees in plantations and pine forests. To capture black locust trees in the shade neighbor-related pixel values as a contrast to neighboring pixels are important. The resulting classification of R. pseudoacacia were exported as shape files into Quantum GIS (QGIS) [93]. Furthermore, during the field survey, marked points of the last planting lines were connected. Starting from this last planting line, five zones from 0 to 10 m were generated with the QGIS software. For each zone, we intercepted and measured the R. pseudoacacia cover. To calculate the average distance of spreading (b), the covered area of black locust 0–10 m (A) was divided by the length of the last planting line (a), as shown in Equation (1).
b = A a
The accuracy of classification was evaluated by selecting random samples. These randomly selected samples were then manually classified via a visual on-screen interpretation of the available image information together with additional field data. Therefore, 150–200 points were randomly distributed. The object classification was verified among R. pseudoacacia and non-R. pseudoacacia. Based on the samples, a confusion matrix was produced to evaluate the accuracy of the final classifications, including overall, user’s, and producer’s classification accuracies and the Kappa Index of Agreement (KIA) [94,95].

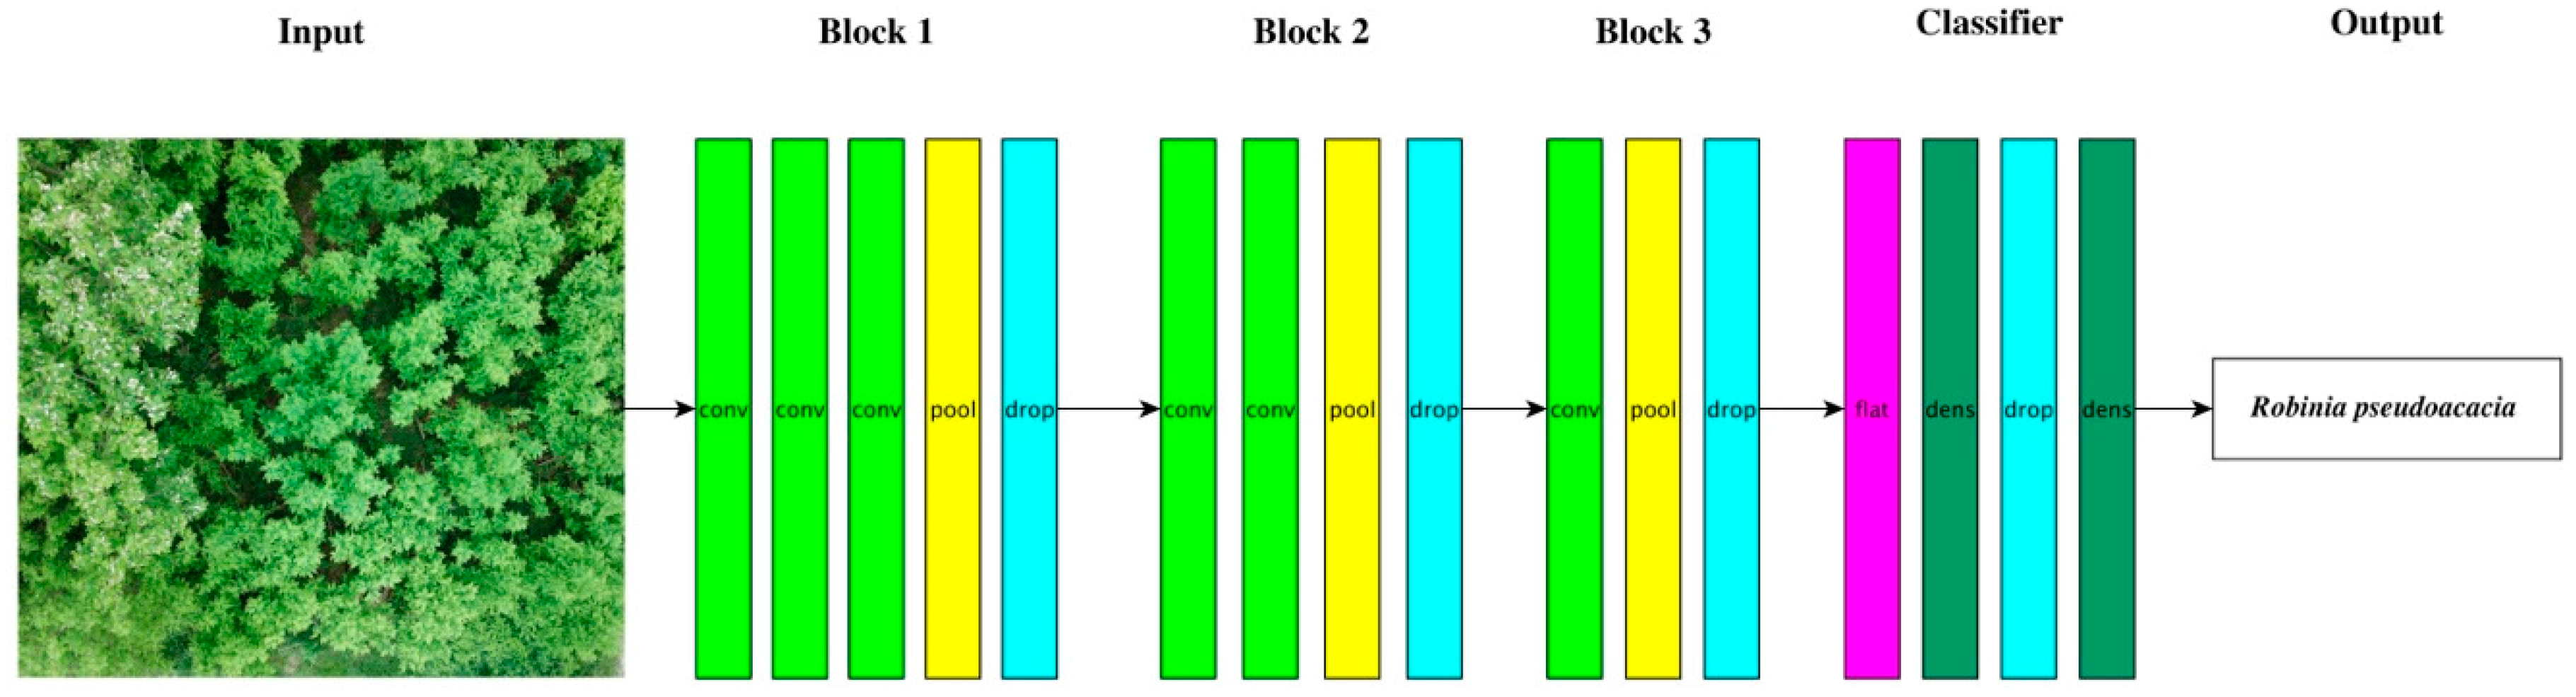
2.5.2. Classification via Deep Learning–CNN

A deep learning algorithm on single UAS images was applied to classify black locust and non-black locust. Therefore, 1000 RGB images were selected. Black locust was detected with varying light conditions (sunny and cloudy), flying altitudes (15 m, 30 m, and 100 m), UAS, and cameras (listed in Section 2.5), and thus different structures and colors. In Python [96] via Jupyter Notebook [97] the tensorflow [98] and keras [99], as well as matplotlib [100], numpy [101], pandas [102], and sklearn [103] libraries were applied for the construction and calculation of the CNN [104,105]. The images were therefore split into train (80%) and test data (20%). The applied CNN structure is presented in Figure 3. In each block, there are convolutional layers and a sub-sampling by max-pooling. In the convolutional layer in the first block, 64 filters with a size of 3 × 3 were used. In the second block 128 feature channels were integrated, and in the third block 256 feature channels were integrated. The activation function was the rectified linear unit (relu)-function [106]. As an optimization algorithm, we used “Adam” (adaptive moment estimation) [107]. Adam integrates moment and the adaptive learning rate. Furthermore, to avoid overfitting and to allow generalization, we integrated dropouts [106] after each max-pooling and fully connected-layer. The total number of trainable parameters is 4,787,330 per image. We tested our CNN architecture without and with dropout layers: (A) including 6 convolutional layers, 3 max-pooling layers, 1 flatten layer, and 2 fully connected layers; (B) including 6 convolutional layers, 3 max-pooling layers, 1 flatten layer, 2 fully connected layers, and 4 dropout layers (Figure 3). To evaluate the applied CNNs, the loss and the accuracy of the train and test data were computed.

3. Results

3.1. Seed Germination
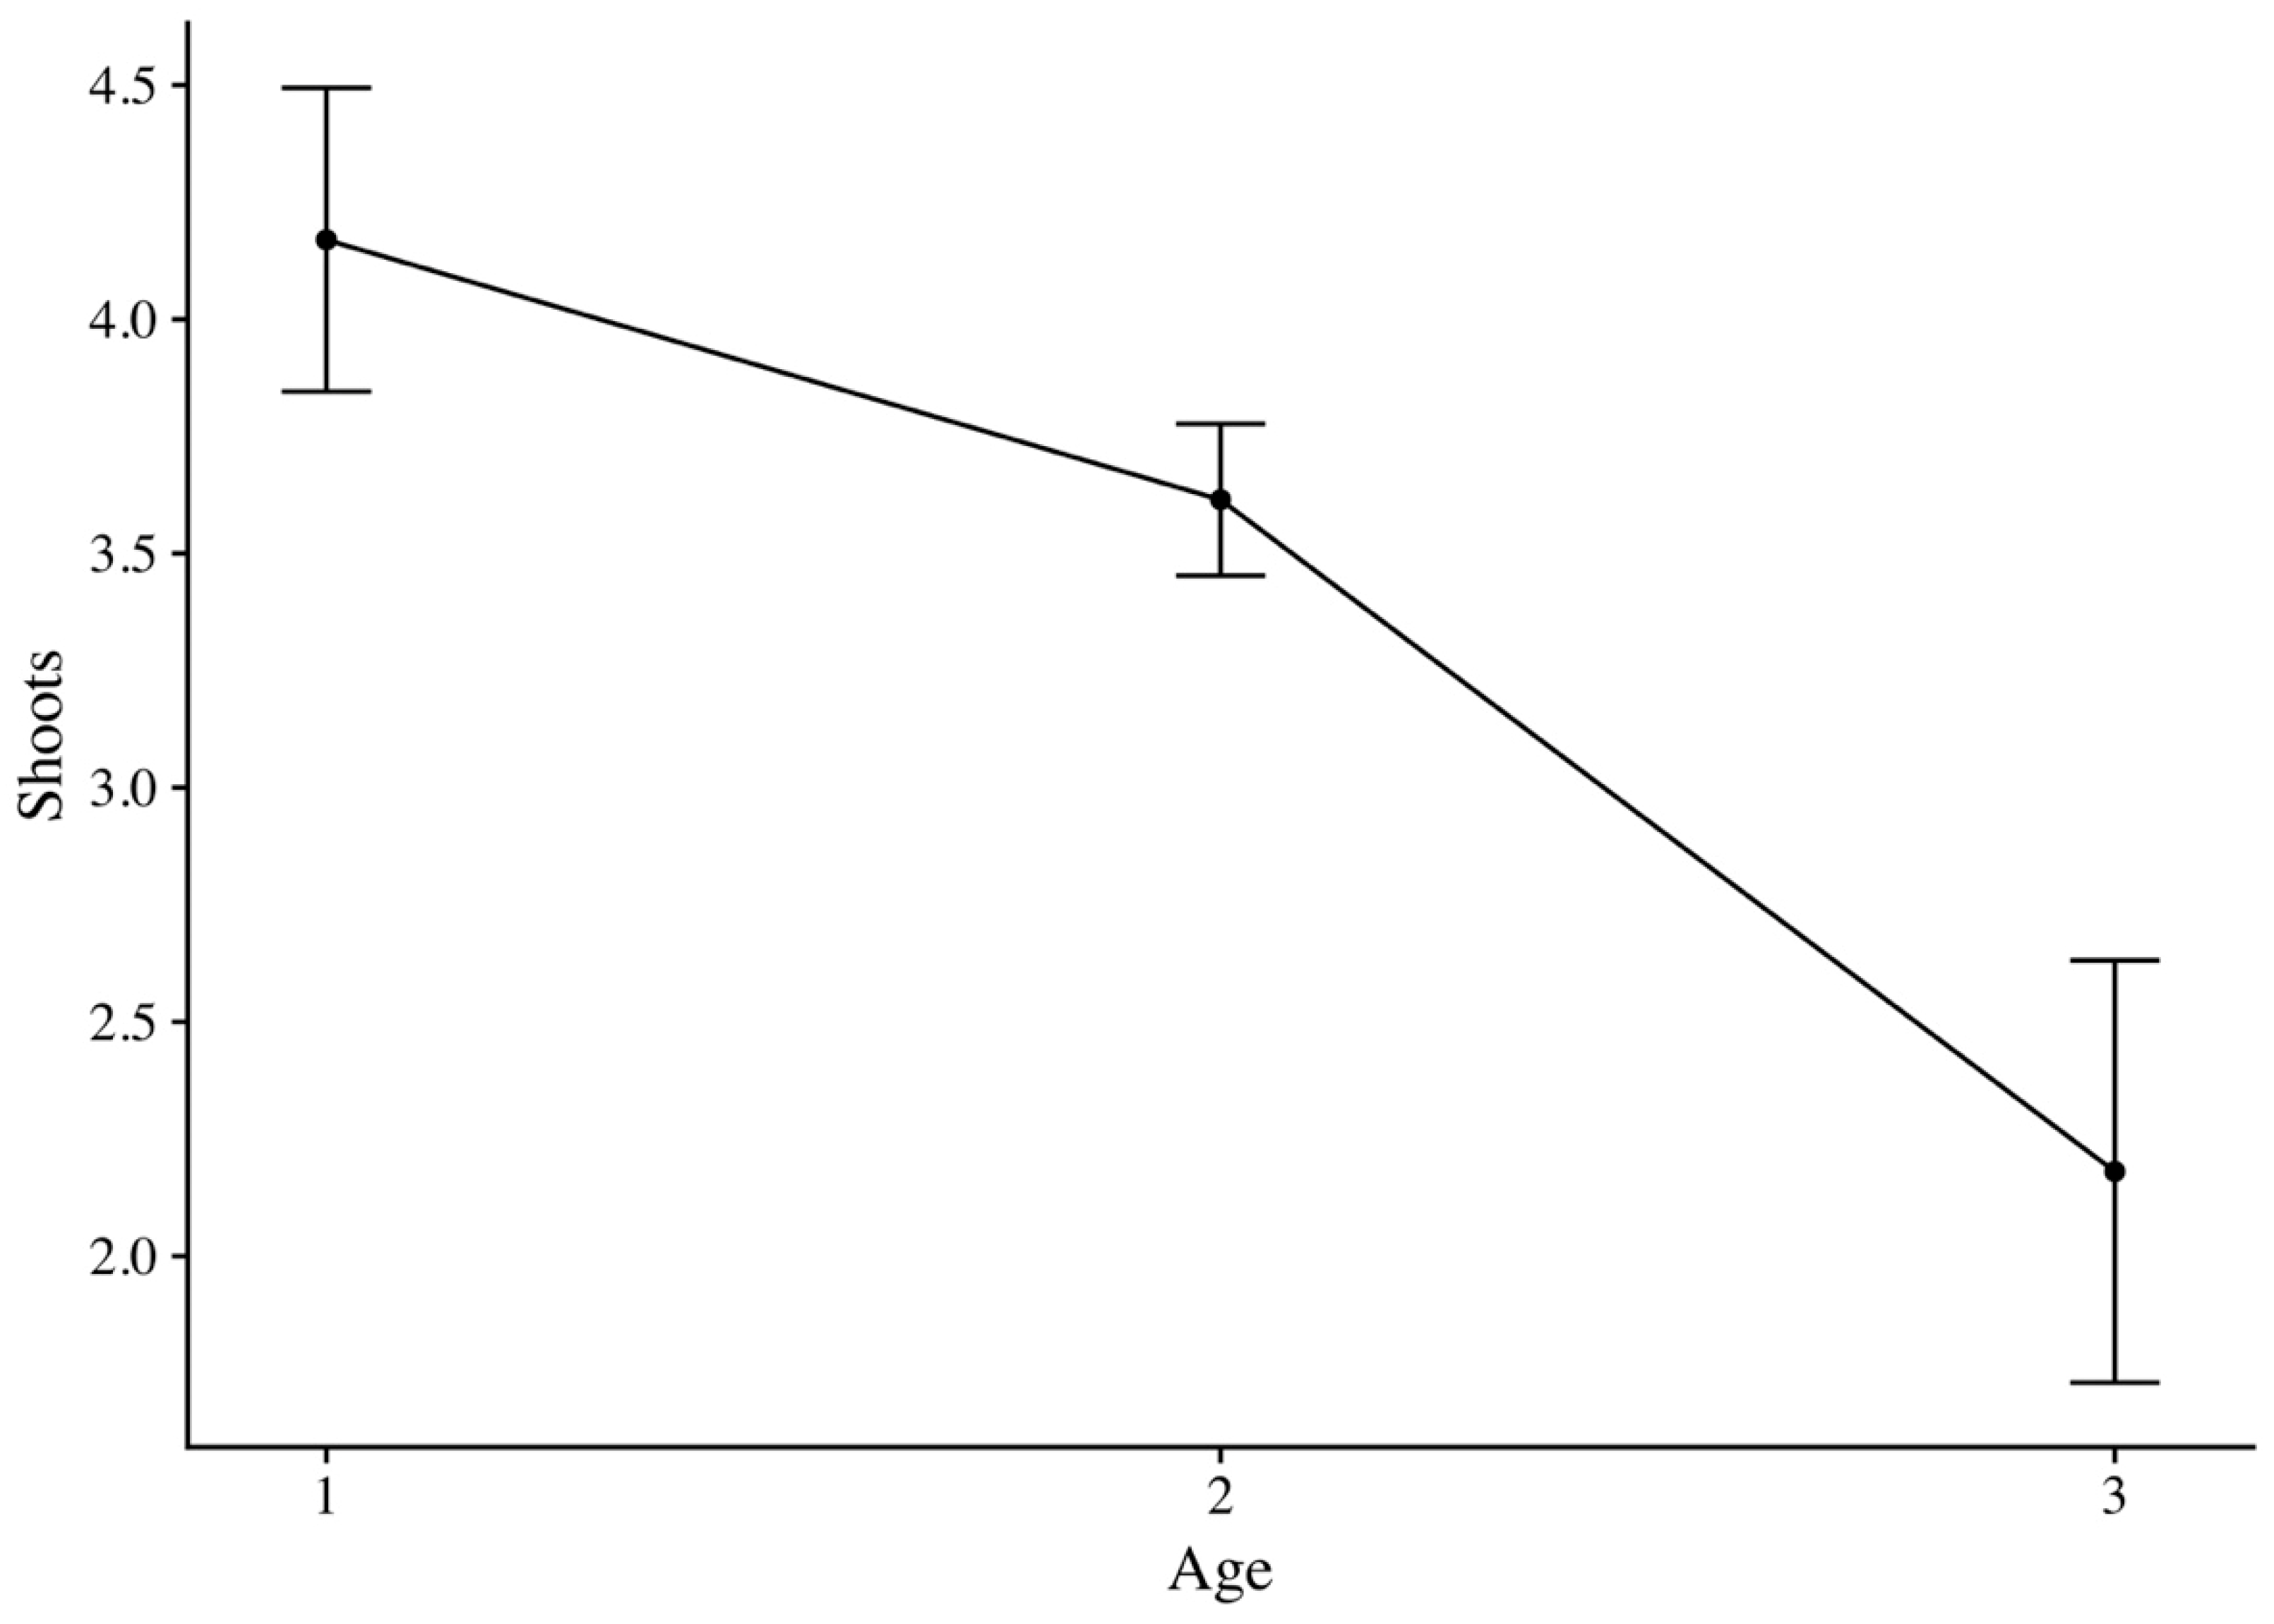
Black locust seed germination after seeding on sandy mineral soils is presented in Figure 4. Seed germination increased with increasing scarification. Hence, seeds directly sown and watered reached 6% germination. By soaking the seeds for 24 h, 8% of the seeds sprouted. By warming the seeds for two hours at 45 °C/60 °C (113 °F/140 °F) and for two hours at −20 °C (−4 °F) as warm-cold variation, the germination reached 23%/69%. Scalding with hot water attained germination of 72% and mechanical scarification resulted in 90% of the seeds sprouting. Moreover, scalding of seeds achieved the highest standard error of the mean (Figure 4). The variance differs significantly (p-value < 0.05) by comparing all applied seed treatments. Nevertheless, the differences were non-significant (p-value > 0.05) between treatments I and II, IV and V, as well as V and VI (Table 2).

3.2. Stump Shoot

The average number of shoots per stump decreases with increasing age (Table 3 and Figure 5). Thereby, the average number of shoots per stump is 4.17 one year after the last harvest, shoots aged 1 year. Two years after the last harvest, an average of 3.61 shoots per stump are alive. In the third year after harvest, the value decreased to 2.18 shoots per stump. The values of the SD, SE, and CI are largest in the 3-year age class and smallest in the 2-year age class. Furthermore, there was a statistically significant difference between age classes as determined by ANOVA (Table 3). Nevertheless, the differences were non-significant between age classes 1 and 2 (p-value 0.313), but significant between age classes 1 and 3 (p-value <0.001) and between age classes 2 and 3 (p-value 0.008).

3.3. Root Suckering (Spreading) via OBIA

In Table 4 and Figure 6, the proportion of black locust classified by OBIA in the five zones is shown in percentage depending on the surrounding area: meadow, farmland, dirt road, and pine forest. Furthermore, the average distance is presented in the last row. The further away from the last planting line, the lower the proportion of black locust. Average spreading is highest to dirt road and meadow.
At 43.99%, the highest value in the 0–2 m zone is reached if the surrounding area is meadow, and the smallest, 27.45%, if the surrounding area is farmland. In the following four zones 2–10 m, the highest black locust quantity is measured if the surrounding area is a dirt road. Generally, the spreading in the first 2 m from the last planting line to the neighboring area is between 40%–50% if the neighboring area is meadow, dirt road, and forest. In the zone from 4–10 m, the proportion is around 0%–10% if the neighboring area is forest or farmland, and in the zone from 6–10 m, the proportion is 0%–10% if the neighboring area is meadow or dirt road. Furthermore, the highest average distance, 2.26 m, is reached if the surrounding area is a dirt road (arrow in Figure 6). At 1.89 m, the second highest average distance is measured if the surrounding area is meadow. In the case of the forest as the surrounding area, the average distance is 1.49 m. The smallest average distance, 1.16 m, is reached if the surrounding area is farmland. The overall accuracy of the OBIA analysis is 0.97 and the overall KIA is 0.93 (Table 5). The producer and user accuracy ranged between 0.96 and 0.98.

3.4. Classification via CNN

The CNN architecture without dropout layers (A) reached a 90% test accuracy and a 99.7% train accuracy. The test loss was 0.395 and the train loss achieved 0.009. The model of the CNN (B) used for classifying R. pseudoacacia and Non-R. pseudoacacia is presented in Table 6. On the left-hand side are image examples of test data of R. pseudoacacia (1) classifications with varying flying altitudes, light conditions, UAS, and cameras. On the right-hand side are examples of test data of Non-R. pseudoacacia (0) category. The CNN’s (B) accuracy (Figure 7) in classifying R. pseudoacacia (1) and Non-R. pseudoacacia (0) increased quickly. After a small number of iterations, the accuracy of the training and validation dataset increased by over 90%, ranging between 90 and 100% from iteration 5 to 50. The training accuracy reached 99.7% and the test accuracy 99.5%. The training and validation loss reduced from 0.7 to a range between 0 and 0.2. Finally, the training loss was 0.009 and the test loss 0.027. The time for fitting the model was 24.2 min, with 3.83 billion training parameters included.

4. Discussion

Reproduction strategies of tree species are an important basis for the survival in spatially and temporally varied ecosystems. However, the reproduction and spreading of black locust in short rotation coppices in Germany have not been analyzed until now. In this study, by applying seed experiments, stump shoot analysis, and spreading measurements, we create an overview of the invasiveness potential of black locust in short rotation coppices in a temperate climate zone. Black locust reproduces generatively via seeds and vegetatively via stump shoots and root suckers. These three reproduction strategies improve the survival of black locust in many ecosystems globally [6,17,108,109,110,111,112,113,114]. Thereby, the reproduction and spreading increases with greater damage to the seed coat and the harvest of black locust trees. Further favorable conditions are sandy soil and high light availability.
Reproduction via seeds is a successful strategy for plants globally. Black locust seeds have a hard and impermeable seed coat [20,21]. In the present study, we observed that seed germination increased with increasing mechanical scarification. This is in line with Vines [22] and Redei et al. [23]. Moreover, the seed experiment shows that germination increases when the warm-cold variation is increased. It might be possible that when the warm-cold variation increases, micro-cracks appear, water enters, and light stimuli facilitates the growth processes. During mechanical scarification, the seed’s coat is directly damaged and the seedling’s development can start. Tompa and Szent-Istvany [115] conclude that hot water treatment was less effective for black locust seed germination. In our study, seeds soaked for 24 h had a 2% higher germination compared to the directly seeded category, with a 6% germination. However, there was no statistically significant difference between seed treatments I) directly seeded and II) soaked in water (18 °C/64.4 °F) for 24 h. However, scalding with hot water yielded the second highest average germination value, with germination above 70%, as well as the highest standard error of the mean. The reason could be the appearance of microcracks in some seed coats and for others the scalding stimulus might be too weak, as the seed coat permeability varied. The applicability of scalding for increasing germination is in line with Velkov [25], as well as with Bogoroditskii and Sholokhov [24]. All in all, it is important to crack and open the seed coat for successful germination. We have to stress that seeds were collected in winter 2016 and only from two former mining areas, as the black locust trees were non-harvested, aged 8 years, and abundant seeds were collectable. It might be possible that the seed quality and germination from different former types of utilization, sites, stand ages, and years vary, as it is described by Redei et al. [17]. Therefore, depending on the seed samples, the absolute results may differ. However, the relative results might be similar. It is important to note, that flowering and reproduction via seed usually starts at the age of six years [17]. For younger short rotation coppices, the reproduction via seeds might be neglectable. Further research could focus on additional seeds selected at different sites, such as urban sites, pure and mixed forests, and on varying age, years, etc. The seed experiments could be planned as field experiments to analyze the influence of fire [31], landscape destruction [31,49], dryness, insects, diseases [116], storms, landslides [32], etc.
Building stump shoots after being damaged or harvested is a survival strategy of many broad-leafing tree species. As black locust is able to build stump shoots, grows fast, and can grow on nutrient-poor sites, this species was planted in short rotation coppices in Germany [33]. In this study, we estimate that the number of shoots per stump decreases with increasing shoot age, which differs significantly by comparing shoot age classes 1 and 3 as well as 2 and 3. This age–shoot relationship has already been observed for black locust stump shoots in forest stands [47,48]. Zeckel [47] counted 13 shoots on average, and Ertle et al. [48] observed seven shoots per stump one year after harvest, six stump shoots in the second year after harvest [47,48], and four shoots per stump in the third and fourth years after harvest [48]. Those values are higher compared with the stump shoot analysis of the present study. In short rotation coppices, we observed on average 4.2 shoots per stump one year after harvest, 3.6 shoots per stump two years after harvest, and 2.2 shoots per stump three years after harvest. One reason for the difference in the number of shoots per stump in forests compared with short rotation coppices might be the planting distance and the number of trees per hectare. Forests were planted with 2000–3000 trees per hectare, and short rotation coppices typically with 8000–10,000 trees per hectare [9]. This fact corresponds with further observations that black locust mortality increases in plantation and reclamation projects with higher density planting [117,118]. Furthermore, the range in number of shoots per stump widens as stump age and dieback of stumps increases [47,48]. Additionally, significant differences were recorded among black locust biomass production of trees (non-harvested) and stump shoots (harvested) [33] in short rotation coppices. This study is a further step in understanding the relationships of the average shoot sprout and dieback with increasing shoot age. The intensity of dieback and growth partitioning might also depend on the aboveground and belowground resources. As belowground resources, water and phosphorus were described as key drivers for competition among black locust trees and stump shoots [119]. Accordingly, by increasing water and phosphorus availability, the competition among stump shoots and the dieback of shoots increases. Additionally, the fact that the increasing shoot age correlates with a decrease in the number of shoots per stump is important for managers of short rotation coppices, as the wood biomass (quality) increases, but the shoots per stump (quantity) decreases. It could be interpreted that it might be effective to plant black locust at greater planting distances, as more shoots will survive in the first years after harvest. However, this feature could be also interpreted as a risk-minimizing and quality-improving aspect. The slenderness is reduced and the risk of breaking due to wind or weight (for example, abundant seeds) is decreased. The wood quality of the surviving shoots increases as the relative bark proportion decreases and the relative wood proportion per shoot increases. Furthermore, black locust wood differs among juvenile and adult wood [120,121,122,123]. Hence, as the black locust tree or shoot becomes older, the wood quality could improve for energy use and construction timber. Further studies might focus on the best planting distances for black locust to improve the target biomass and wood production.
As a third reproduction strategy, black locust is able to spread via root suckering. We observed that the spreading increases with increasing light availability and reduced tillage. The proportion and average spreading distance are highest if the surrounding area is a dirt road or meadow. The proportion and distance were lower if the neighboring area is a forest or farmland. The lower spreading distance to the farmland could be due to tillage by the land owner and the resulting destruction of the spreading black locust roots. The reason for lesser spreading in the neighboring area if it is a forest could be the light limitation due to the higher pine trees. As a light-demanding tree species, black locust growth is reduced if the light availability is low [124]. This is in line with previous findings discussed in Crosti et al. [50], who found that the density of black locust regeneration in Mediterranean ecosystems is strongly affected by the land cover. Accordingly, abandoned agricultural land is most prone to black locust colonization. The spread was lowest in a zone with orchards. This zone was described as very effective for controlling black locust invasion [50]. Moreover, our study shows that independent of the neighboring area, the proportion of black locust cover and spreading decreases, the longer the distance is to the plantation. Therefore, it seems that the spreading is a step-by step-process. Nevertheless, it has been found that black locust is able to spread locally up to 1 m per year [125]. Huntley [2] and Grese [126] describe that root sprouting usually begins when plants are 4 years old and increases rapidly in full sun, open areas, and particularly in sandy soil [126]. As with stump shoots, sprouting is a response to disturbance, and sprouts need sufficient light to survive [32]. Moreover, as black locust belongs to the family Fabaceae, it is able to fix atmospheric nitrogen via rhizobia [15,16], which results in an increasing nitrogen concentration and a change in the chemical compositions in the soil [127,128,129]. In Europe, particularly in Germany, nature conservation areas are often open areas, such as dry and semi-dry grasslands, which belongs to the most species-rich and endangered types of habitats [130]. To protect such areas and avoid a black locust spreading, it is important to avoid planting black locust close or next to protected areas. Long-term investigations might provide answers regarding further ecosystem modifications of black locust. Moreover, on a global scale, the spreading of atmospheric nitrogen fixing tree species is increasing [6,70,131]. This might be due to anthropogenic influences such as an increased CO2 and nitrogen concentration in the atmosphere [132,133]. Additionally, the nitrogen concentration often increases locally due to the usage of fertilizer on farmlands [134]. The increasing spreading of atmospheric nitrogen fixing tree and shrub species that results in ecosystem-changing processes by enriching the soil with nitrogen, seems to be a manmade issue. Moreover, increasing temperature, reduced frost [2,135,136], and the dieback of tree species, such as European ash [13,14], could result in a further increase in black locust and additional non-native tree species. It is important to stress that the analyzed length to the neighboring areas varies and that mother stumps are missing in a few planting lines, which might influence the results. Therefore, to validate the results further, black locust stands with other neighboring ecosystems could be investigated.
The approach of combining UAS images with OBIA, as described in the present study, could be the foundation to create a database to appraise the spreading and ecosystem changes caused by R. pseudoacacia and could be further applied to non-native and native tree species. To this end, UAS allows monitoring with a higher spatial resolution of small, specific, and detailed vegetation structures [18,69,137] and avoids environmental damage. Another advantage of UAS images is the possibility to generate 3D surface models [69]. The 3D surface models in this study were important for the classification of the vegetation height of R. pseudoacacia, grass, and forest pine trees. The height of the black locust trees in the analyzed plantation ranged between 0.2 and 3.0 m. This height classification approach is common for tree analysis [53,54,55,57,58,60]. However, a limitation of current UAS images is that depending on stand density only the top of the tree or stump shoot is detectable [138]. Solutions could be the integration of high-resolution light detection and ranging (LiDAR) systems to an UAS [139] or UAS flying below the canopy as a possibility for future technology. Both could detect the deeper canopy and stand layers [139]. Along with the vegetation height, the neighbor-related pixel values and contrast were important for detecting black locust trees in shade caused by higher vegetation or cloud cover. Furthermore, the mean green values were considerable, as R. pseudoacacia leaves have a specific light green. The advantage of OBIA compared to pixel-based analysis is the avoidance of misclassification of single pixels [140,141]. OBIA includes geometric properties such as dimension and texture of the target tree species and creates additional options as compared to pixel-based analysis [92,142]. Nevertheless, the OBIA approach as applied in the present study relies on a labor-intensive survey, which needs expertise in image converting. This is generally time consuming and expensive [143,144]. Furthermore, mistakes due to human operation are possible [145].
In addition, machine learning algorithms are increasingly being used for data and image analysis [52,62,72,73,74,75,76,77,78,79]. The CNN applied in the current study was tested to classify single black locust images under varying conditions and attained a high test accuracy of 99.5%. However, disadvantages of CNN algorithms are that a high number of labeled training images should be available [146], as well as the difficult traceability of the used classification features [105]. Nevertheless, studies [73,145,146] have shown that when the training sample size was high, CNN tended to show better results and accuracies compared to random forest, support vector machine, and fully convolutional networks. Therefore, Liu and Abd-Elrahman [146] used 400 UAS images per object, Diegues et al. [147] applied about 700 underwater images, Abrams et al. [148] operated with 700 canopy and 800 understory images per habitat class as well as Li et al. [73] used 5,000 satellite images per category. In the present study 1000 UAS images were selected to classify black locust and non-black locust. Moreover, varying CNN architectures are existing and being further developed. We evaluate the classification accuracy of two widely used CNN architectures: (A) including 6 convolutional layers, 3 max-pooling layers, 1 flatten layer, and 2 fully connected layers as simplified VGG architecture [104]; (B) including 6 convolutional layers, 3 max-pooling layers, 1 flatten layer, 2 fully connected layers, and 4 dropout layers, which is similar to AlexNet architecture [106]. Our proposed approach (B), which includes dropout layers, achieved a higher test accuracy at 99.5% compared with the applied VGG architecture without dropout layers, which achieved a 90% test accuracy. Both CNN architectures achieved a 99.7% training accuracy. Therefore, the applied VGG architecture tend to overfit the model. Nevertheless, the applied dropout layers [106] in the applied AlexNet architecture avoided overfitting and allowed generalization with a 99.5% accuracy by modelling 1,000 images. This is in line with previous findings discussed in Li et al. [73], who found that the AlexNet architecture achieved the highest accuracy in oil palm tree detection (satellite images) compared to LeNet [149] and VGG-19 architecture. Single image classification of black locust, as applied in the present study, could be advanced in further studies by applying CNN architectures for segmentation (e.g., semantic or pedestrian segmentation) [62,145,150,151,152]. It is important to stress that the described CNN architectures were tested on images of black locust in a short-rotation coppice at one site in a variation of flying altitudes (15 m, 30 m, and 100 m), light conditions (sunny and cloudy), UAS (Microdrones MD4-1000 [82] and dji Mavic Pro [85]), and cameras (SONY-ILCE-5100 [87] and DJI FC220 [85]). For a comprehensive training and the applicability to different sites, further images of black locust from different age classes, health conditions, seasonal change of leaf colors (e.g., spring and autumn in Central Europe), tree heights, stand densities, competition [119], multiple mixed stands, environments, drones, etc., are needed, but this methodology offers a new possibility for faster and automatic detection of black locust and other tree species.
This study focuses on the reproduction of black locust in short rotation coppices in Germany in order to improve the estimation of the spreading and survival potential. The analysis of generative and vegetative reproduction shows that scarification increases germination, the numbers of shoots per stump decrease with time, and sprouting is influenced by light availability. Our research study gives an overview of the invasiveness potential and reproduction strategies of black locust in short rotation coppices, which is important for managing black locust effectively, for example for biomass production and nature conservation.

5. Conclusions

This study provides an overview of the reproduction strategies of black locust by analyzing the reproduction and spreading in ten short rotation coppices in Germany. The seed experiments focus on six different treatments in five iterations and show that seed germination increases with increasing warm-cold variation (23%–69%), hot water scalding (72%), and mechanical scarification (90%) of the hard and impermeable seed coat. Furthermore, after scalding with hot water, the seed germination reached the highest standard error of the mean. Moreover, the findings showed that the seed germination is less than 10% when seeds were directly seeded or soaked in water (18 °C/64.4 °F) for 24 h. Stump shoots were counted in sample plots in varying age classes (1–3 years). The numbers of shoots per stump decrease as shoot age increases, which differs significantly by comparing age classes 1 and 3, as well as 2 and 3. Spreading of root suckers was analyzed with the aid of UAS platforms and image analysis via OBIA. The spreading distance increases with increasing light availability and is decreases with tillage. Thereby, the proportion and average spreading distance are highest if the surrounding area is a dirt road or meadow. The proportion and distance were lower if the neighboring area is a forest or farmland. Furthermore, we tested a CNN model to classify black locust under varying conditions in single images (1000 images) and achieved a high accuracy of 99.5% by including 6 convolutional layers, 3 max-pooling layers, 1 flatten layer, 2 fully connected layers, and 4 dropout layers. The methodology and results presented herein provide local managers, foresters, and scientists with the opportunity to estimate reproduction and spreading of black locust and other tree species.

Author Contributions

Conceptualization, C.C., J.R.K.L., D.L. and H.P.; Investigation, C.C. and J.R.K.L.; Methodology, C.C. and J.R.K.L.; Project administration, C.C.; Software, C.C. and J.R.K.L.; Supervision, D.L. and H.P.; Validation, C.C. and J.R.K.L.; Visualization, C.C.; Writing—Original draft, C.C.; Writing—Review & editing, J.R.K.L., D.L. and H.P.

Funding

This research was supported by the University of Applied Science Erfurt (FHE), the Technical University of Munich (TUM), and the Westfälische Wilhelms University of Münster. This work was also supported by the German Research Foundation (DFG) and the Technical University of Munich (TUM) in the framework of the Open Access Publishing Program.

Acknowledgments

We would like to thank the Vattenfall-Energy Crops company, Hartmut Petrick, the Brandenburg University of Technology Cottbus-Senftenberg (BTU) for their support with analyzing the study areas. The authors would also like to thank Jan Zimmermanns for his assistance during all seed experiments and field measurements. Many thanks to Christian Rösner and Martin Rogge for their knowledge and information on black locust seeds. Moreover, we want to thank Pia Pickenbrock for her flying skills as our second pilot. We are grateful to Daniela and Cindy Carl for proofreading the article. Furthermore, many thanks to Oliver Zeigermann for his support with machine learning, especially deep learning algorithms.

Conflicts of Interest

The authors declare no conflict of interest.

Abbreviations

The following abbreviations are used in this manuscript:
AdamAdaptive moment estimation
ANOVAAnalysis of Variance
CIConfidence Interval
CNNConvolutional Neural Network(s)
hHours
KIAKappa Index of Agreement
LiDARLight Detection and Ranging
NIRNear-InfraRed
OBIAObject-Based Image Analysis
QGISQuantum GIS
RGBRed-Green-Blue
SDStandard Deviation
SEStandard Error of the Mean
SfMStructure from Motion
UASUnmanned Aerial System(s)

References

  1. Little, E.L. Atlas of United States Trees; Conifers and Important Hardwoods, US Department of Agriculture, Forest Service: Washington, DC, USA, 1971. [Google Scholar]
  2. Huntley, J.C. Robinia pseudoacacia L. In Silvics of North America, Vol. 2, Hardwoods; Burns, R.M., Honkala, B.H., Eds.; USDA Foreign Agricultural Service Handbook 654: Washington, DC, USA, 1990; pp. 755–761. [Google Scholar]
  3. Vadas, E. Das Lehrrevier und der botanische Garten der königl. ung. forstl. Hochschule als Versuchsfeld; Joerges: Selmecbánya, Slovakia, 1914; pp. 1–25. [Google Scholar]
  4. Ernyey, J. Die Wanderwege der Robinie und ihre Ansiedlung in Ungarn. Magy. Botan. Lapok 1927, 25, 161–191. [Google Scholar]
  5. Kolbek, J.; Vítková, M.; Vetvicka, V. Z historie stredoevropsky’ ch akátin a jejich spolecenstev. From history of Central European Robinia growths and its communities. Zpr. Ces. Bot. Spolec. 2004, 39, 287–298. [Google Scholar]
  6. Vítková, M.; Müllerová, J.; Sádlo, J.; Pergl, J.; Pyšek, P. Black locust (Robinia pseudoacacia) beloved and despised: A story of an invasive tree in Central Europe. For. Ecol. Manag. 2017, 384, 287–302. [Google Scholar] [CrossRef] [PubMed]
  7. Wüstenhagen, R.; Bilharz, M. Green energy market development in Germany: Effective public policy and emerging customer demand. Energy Policy 2006, 34, 1681–1696. [Google Scholar] [CrossRef]
  8. Bielefeldt, J.; Bolte, A.; Busch, G.; Dohrenbusch, A.; Kroiher, F.; Lamersdorf, N.; Schulz, U.; Stoll, B. Energieholzproduktion in der Landwirtschaft. Chancen und Risiken aus Sicht der Natur-und Umweltschutzes; NABU Bundesverb, 2008; pp. 17–19. Available online: https://www.nabu.de/imperia/md/content/nabude/energie/biomasse/nabu-studie_energieholz.pdf (accessed on 12 January 2017).
  9. Bemmann, A.; Butler Manning, D. Energieholzplantagen in der Landwirtschaft; Agrimedia: Hannover, Germany, 2013; ISBN 978-3-86263-081-3. [Google Scholar]
  10. Richardson, D.M.; Rejmánek, M. Trees and shrubs as invasive alien species—A global review. Divers. Distrib. 2011, 17, 788–809. [Google Scholar] [CrossRef]
  11. Staska, B.; Essl, F.; Samimi, C. Density and age of invasive Robinia pseudoacacia modulate its impact on floodplain forests. Basic Appl. Ecol. 2014, 15, 551–558. [Google Scholar] [CrossRef]
  12. Vor, T.; Bolte, A.; Spellmann, H.; Ammer, C. Potenziale und Risiken eingeführter Baumarten—Baumartenportraits mit naturschutzfachlicher Bewertung; Universitätsverlag Göttingen: Göttingen, Germany, 2015; pp. 277–292. ISBN 978-3-86395-240-2. [Google Scholar]
  13. Willoughby, I.; Stokes, V.; Poole, J.; White, J.E.; Hodge, S.J. The potential of 44 native and non-native tree species for woodland creation on a range of contrasting sites in lowland Britain. Forestry 2007, 80, 531–553. [Google Scholar] [CrossRef] [Green Version]
  14. Skovsgaard, J.P.; Wilhelm, G.J.; Thomsen, I.M.; Metzler, B.; Kirisits, T.; Havrdová, L.; Enderle, R.; Dobrowolska, D.; Cleary, M.; Clark, J. Silvicultural strategies for Fraxinus excelsior in response to dieback caused by Hymenoscyphus fraxineus. Forestry 2017, 90, 455–472. [Google Scholar] [CrossRef]
  15. Hoffmann, G. Die Stickstoffbindung der Robinie (Robinia pseudoacacia L.). Archiv für Forstwesen 1961, 10, 627–632. [Google Scholar]
  16. Hoffmann, G. Effektivität und Wirtsspezifität der Knöllchenbakterien von Robinia pseudoacacia L. Archiv für Forstwesen 1964, 13, 563–574. [Google Scholar]
  17. Rédei, K. Black Locust (Robinia pseudoacacia L.) Growing in Hungary; Hungarian Forest Research Institute: Sarvar, Hungary, 2013. [Google Scholar]
  18. Carl, C.; Landgraf, D.; van der Maaten-Theunissen, M.; Biber, P.; Pretzsch, H. Robinia pseudoacacia L. Flower Analyzed by Using Unmanned Aerial Vehicle (UAV). Remote Sens. 2017, 9, 1091. [Google Scholar] [CrossRef]
  19. Marjai, Z. Az akác-magbank. Erdészeti Lapok 1995, 130, 311–313. [Google Scholar]
  20. Farrar, J.L. Trees of the Northern United States and Canada; Blackwell Publishing: Ames, IA, USA, 1995; p. 502. [Google Scholar]
  21. Schubert, J. Lagerung und Vorbehandlung von Saatgut wichtiger Baum-und Straucharten; LÖBF: Eberswalde-Finow, Germany, 1998. [Google Scholar]
  22. Vines, R.A. Trees, Shrubs, and Woody Vines of the Southwest; University of Texas Press: Austin, TX, USA, 1960; Volume 1104, p. 7707. [Google Scholar]
  23. Rédei, K.; Csiha, I.; Keseru, Z.; Gál, J. Influence of regeneration method on the yield and stem quality of Black locust (Robinia pseudoacacia L.) stands: A case study. Acta Silv. Lign. Hung. 2012, 8, 103–112. [Google Scholar] [CrossRef]
  24. Bogoroditskii, I.I.; Sholokhov, L.V. German: Feuchtigkeitsregime von Robinia pseudoacacia Samen, vorbereitet für die Saat durch Vakuum-Wasser-Sättigungsmethode und durch Brühen in kochendem Wasser. Tr. Novocherkas. Inzh.-Melior. Inta 1975, 16, 115–118, (Original in Russian). [Google Scholar]
  25. Velkov, D. Influence of high temperatures on the water regime and viability of black locust (Robinia pseudoacacia L.) seeds. In Proceedings of the International Symposium on Seed Physiology of Woody Plants at Kornik, Panstwowe, Wydawnictwo Naukowe, Warszawa-Poznan, Poland, 3–8 September 1968; pp. 111–119. [Google Scholar]
  26. Hull, J.C.; Scott, R.C. Plant Succession on Debris Avalanches of Nelson County, Virginia. Castanea 1982, 47, 158–176. [Google Scholar]
  27. Martin, W.H. The Role and History of Fire in the Daniel Boone National Forest; Final Report; U.S. Department of Agriculture, Forest Service, Daniel Boone National Forest: Winchester, KY, USA, 1990; p. 131. [Google Scholar]
  28. Keresztesi, B. The Black Locust; Akadémiai Kiadó: Budapest, Hungary, 1988. [Google Scholar]
  29. Voss, E.G. Michigan Flora. Part II. Dicots (Saururaceae–Cornaceae); Bull. 59; Cranbrook Institute of Science: Bloomfield Hills, MI, USA; University of Michigan Herbarium: Ann Arbor, MI, USA, 1985; p. 724. [Google Scholar]
  30. Harrod, J.C.; Harmon, M.E.; White, P.S. Post-fire succession and 20th century reduction in fire frequency on xeric southern Appalachian sites. J. Veg. Sci. 2000, 11, 465–472. [Google Scholar] [CrossRef]
  31. Elliott, K.J.; Vose, J.M.; Clinton, B.D.; Knoepp, J.D. Effects of understory burning in a mesic mixed-oak forest of the southern Appalachians. In Fire in Temperate, Boreal, and Montane Ecosystems: Proceedings of the 22nd Tall Timbers Fire Ecology Conference: An International Symposium, Kananaskis Village, AB, Canada, 15–18 October 2001; Tall Timbers Research: Tallahassee, FL, USA, 2004; pp. 272–283. [Google Scholar]
  32. Stone, K.R. Robinia pseudoacacia. In Fire Effects Information System; U.S. Department of Agriculture, Forest Service, Rocky Mountain Research Station, Fire Sciences Laboratory (Producer), 2009; Available online: https://www.fs.fed.us/database/feis/plants/tree/robpse/all.html (accessed on 11 December 2018).
  33. Carl, C.; Biber, P.; Landgraf, D.; Buras, A.; Pretzsch, H. Allometric Models to Predict Aboveground Woody Biomass of Black Locust (Robinia pseudoacacia L.) in Short Rotation Coppice in Previous Mining and Agricultural Areas in Germany. Forests 2017, 8, 328. [Google Scholar] [CrossRef]
  34. Bernetti, G. Macchia coppices with prevalent Quercus ilex in Tuscany. In L’auxometria dei boschi cedui Italiani; Forestale e Montane: Tuscany, Italy, 1990; Volume 35, pp. 1–24. [Google Scholar]
  35. Reich, P.B.; Teskey, R.O.; Johnson, P.S.; Hinckley, T.M. Periodic root and shoot growth in oak. For. Sci. 1980, 26, 590–598. [Google Scholar] [CrossRef]
  36. Cobb, S.W.; Miller, A.E.; Zahner, R. Recurrent shoot flushes in scarlet oak stump sprouts. For. Sci. 1985, 31, 725–730. [Google Scholar] [CrossRef]
  37. Dimitrov, E.P.; Stiptsov, V. Yield table for coppice stands of Quercus cerris in Bulgaria. Gorsko Stopanstvo 1991, 47, 13–14. [Google Scholar]
  38. Beky, A. Yield of sessile oak coppice stands (Quercus petraea). Erdeszeti-Kutatasok 1991, 82–83, 176–192. [Google Scholar]
  39. Tatoni, T.; Roche, P. Comparison of old-field and forest revegetation dynamics in Provence. J. Veg. Sci. 1994, 5, 295–302. [Google Scholar] [CrossRef]
  40. Cañellas, I.; Montero, G.; Bachiller, A. Transformation of quejigo oak (Quercus faginea Lam.) coppice forest into high forest by thinning. Ann. Ist. Sper. Selvic. 1996, 27, 143–147. [Google Scholar]
  41. Cinnirella, S.; Iovino, F.; Porto, P.; Ferro, V. Anti-erosive effectiveness of Eucalyptus coppices through the cover management factor estimate. Hydrol. Process 1998, 12, 635–649. [Google Scholar] [CrossRef]
  42. Chatziphilippidis, G.; Spyroglou, G. Modelling the Growth of Quercus frainetto in Greece. In Sustainable Forest Management–Growth Models for Europe; Springer: Berlin/Heidelberg, Germany, 2006; pp. 373–393. [Google Scholar]
  43. Fonti, P.; Cherubini, P.; Rigling, A.; Weber, P.; Biging, G. Tree rings show competition dynamics in abandoned Castanea sativa coppices after land-use changes. J. Veg. Sci. 2006, 17, 103–112. [Google Scholar] [CrossRef]
  44. Salazar-García, S.; Cossio-Vargas, L.E.; Lovatt, C.J.; González-Durán, I.J.; Pérez-Barraza, M.H. Crop Load Affects Vegetative Growth Flushes and Shoot Age Influences Irreversible Commitment to Flowering of ‘Hass’ Avocado. HortScience 2006, 41, 1541–1546. [Google Scholar]
  45. Kneifl, M.; Kadavý, J.; Knott, R. Gross value yield potential of coppice, high forest and model conversion of high forest to coppice on best sites. J. For. Sci. 2011, 57, 536–546. [Google Scholar] [CrossRef] [Green Version]
  46. Razakamanarivo, R.H.; Razakavololona, A.; Razafindrakoto, M.A.; Vieilledent, G.; Albrecht, A. Below-ground biomass production and allometric relationships of eucalyptus coppice plantation in the central highlands of Madagascar. Biomass Bioenergy 2012, 45, 1–10. [Google Scholar] [CrossRef]
  47. Zeckel, C. Betrachtung des Ertragspotenzials von Stockausschlägen der Robinie (Robinia pseudoacacia L.) von verschiedenen Waldstandorten geogenen und anthorpogenen Ausgangssubstrates in der Niederlausitz unter Berücksichtigung ihrer energetischen Nutzung. Diploma Thesis, Brandenburg University of Technology, Senftenberg, Germany, 2007; pp. 38–39. [Google Scholar]
  48. Ertle, C.; Böcker, L.; Landgraf, D. Wuchspotenzial von Stockausschlägen der Robinie. AFZ-Der Wald 2008, 63, 994–995. [Google Scholar]
  49. Dooley, T. Lessons learned from eleven years of prescribed fire at the Albany Pine Bush Preserve. In Using Fire to Control Invasive Plants: What’s New, What Works in the Northeast?—2003 Workshop Proceedings; University of New Hampshire, Cooperative Extension: Portsmouth, NH, USA; Durham, NH, USA, 2003; pp. 7–10. Available online: http://extension.unh.edu/resources/files/Resource000412_Rep434.pdf (accessed on 10 June 2016).
  50. Crosti, R.; Agrillo, E.; Ciccarese, L.; Guarino, R.; Paris, P.; Testi, A. Assessing escapes from short rotation plantations of the invasive tree species Robinia pseudoacacia L. in Mediterranean ecosystems: A study in central Italy. IFOREST 2016, e1–e8. [Google Scholar] [CrossRef]
  51. Ustin, S.L.; DiPietro, D.; Olmstead, K.; Underwood, E.; Scheer, G.J. Hyperspectral remote sensing for invasive species detection and mapping. In Proceedings of the 2002 IEEE International Geoscience and Remote Sensing Symposium, IGARSS’02, Toronto, ON, Canada, 24–28 June 2002; Volume 3, pp. 1658–1660. [Google Scholar]
  52. Zhao, Q.; Wang, F.; Zhao, J.; Zhou, J.; Yu, S.; Zhao, Z. Estimating Forest Canopy Cover in Black Locust (Robinia pseudoacacia L.) Plantations on the Loess Plateau Using Random Forest. Forests 2018, 9, 623. [Google Scholar] [CrossRef]
  53. Wallace, L.; Lucieer, A.; Malenovský, Z.; Turner, D.; Vopěnka, P. Assessment of forest structure using two UAV techniques: A comparison of airborne laser scanning and structure from motion (SfM) point clouds. Forests 2016, 7, 62. [Google Scholar] [CrossRef]
  54. Ota, T.; Ogawa, M.; Mizoue, N.; Fukumoto, K.; Yoshida, S. Forest Structure Estimation from a UAV-Based Photogrammetric Point Cloud in Managed Temperate Coniferous Forests. Forests 2017, 8, 343. [Google Scholar] [CrossRef]
  55. Mlambo, R.; Woodhouse, I.H.; Gerard, F.; Anderson, K. Structure from Motion (SfM) photogrammetry with drone data: A low cost method for monitoring greenhouse gas emissions from forests in developing countries. Forests 2017, 8, 68. [Google Scholar] [CrossRef]
  56. Mohan, M.; Silva, C.A.; Klauberg, C.; Jat, P.; Catts, G.; Cardil, A.; Hudak, A.T.; Dia, M. Individual tree detection from unmanned aerial vehicle (UAV) derived canopy height model in an open canopy mixed conifer forest. Forests 2017, 8, 340. [Google Scholar] [CrossRef]
  57. Guerra-Hernández, J.; González-Ferreiro, E.; Monleón, V.J.; Faias, S.P.; Tomé, M.; Díaz-Varela, R.A. Use of Multi-Temporal UAV-Derived Imagery for Estimating Individual Tree Growth in Pinus pinea Stands. Forests 2017, 8, 300. [Google Scholar] [CrossRef]
  58. Dempewolf, J.; Nagol, J.; Hein, S.; Thiel, C.; Zimmermann, R. Measurement of within-season tree height growth in a mixed forest stand using UAV imagery. Forests 2017, 8, 231. [Google Scholar] [CrossRef]
  59. Qiu, Z.; Feng, Z.K.; Wang, M.; Li, Z.; Lu, C. Application of UAV Photogrammetric System for Monitoring Ancient Tree Communities in Beijing. Forests 2018, 9, 735. [Google Scholar] [CrossRef]
  60. Alonzo, M.; Andersen, H.E.; Morton, D.C.; Cook, B.D. Quantifying Boreal Forest Structure and Composition Using UAV Structure from Motion. Forests 2018, 9, 119. [Google Scholar] [CrossRef]
  61. Feduck, C.; McDermid, G.; Castilla, G. Detection of coniferous seedlings in UAV imagery. Forests 2018, 9, 432. [Google Scholar] [CrossRef]
  62. Morales, G.; Kemper, G.; Sevillano, G.; Arteaga, D.; Ortega, I.; Telles, J. Automatic Segmentation of Mauritia flexuosa in Unmanned Aerial Vehicle (UAV) Imagery Using Deep Learning. Forests 2018, 9, 736. [Google Scholar] [CrossRef]
  63. Fraser, B.; Congalton, R. Evaluating the Effectiveness of Unmanned Aerial Systems (UAS) for Collecting Thematic Map Accuracy Assessment Reference Data in New England Forests. Forests 2019, 10, 24. [Google Scholar] [CrossRef]
  64. Knipling, E.B. Physical and physiological basis for the reflectance of visible and near-infrared radiation from vegetation. Remote Sens. Environ. 1970, 1, 155–159. [Google Scholar] [CrossRef]
  65. Tucker, C.J. Red and photographic infrared linear combinations for monitoring vegetation. Remote Sens. Environ. 1979, 8, 127–150. [Google Scholar] [CrossRef] [Green Version]
  66. Qi, J.; Chehbouni, A.; Huete, A.R.; Kerr, Y.H.; Sorooshian, S. A modified soil adjusted vegetation index. Remote Sens. Environ. 1994, 48, 119–126. [Google Scholar] [CrossRef]
  67. Rogan, J.; Franklin, J.; Roberts, D.A. A comparison of methods for monitoring multitemporal vegetation change using Thematic Mapper imagery. Remote Sens. Environ. 2002, 80, 143–156. [Google Scholar] [CrossRef] [Green Version]
  68. Gitelson, A.A.; Kaufman, Y.J.; Stark, R.; Rundquist, D. Novel algorithms for remote estimation of vegetation fraction. Remote Sens. Environ. 2002, 80, 76–87. [Google Scholar] [CrossRef] [Green Version]
  69. Tang, L.; Shao, G. Drone remote sensing for forestry research and practices. J. For. Res. 2015, 26, 791–797. [Google Scholar] [CrossRef]
  70. Lehmann, J.R.; Prinz, T.; Ziller, S.R.; Thiele, J.; Heringer, G.; Meira-Neto, J.A.; Buttschardt, T.K. Open-source processing and analysis of aerial imagery acquired with a low-cost unmanned aerial system to support invasive plant management. Front. Environ. Sci. 2017, 5, 44. [Google Scholar] [CrossRef]
  71. Müllerová, J.; Bartaloš, T.; Brůna, J.; Dvořák, P.; Vítková, M. Unmanned aircraft in nature conservation: An example from plant invasions. Int. J. Remote Sens. 2017, 38, 2177–2198. [Google Scholar] [CrossRef]
  72. Daliakopoulos, I.N.; Katsanevakis, S.; Moustakas, A. Spatial downscaling of alien species presences using machine learning. Front. Earth Sci. 2017, 5, 60. [Google Scholar] [CrossRef]
  73. Li, W.; Dong, R.; Fu, H. Large-Scale Oil Palm Tree Detection from High-Resolution Satellite Images Using Two-Stage Convolutional Neural Networks. Remote Sens. 2019, 11, 11. [Google Scholar] [CrossRef]
  74. Denize, J.; Hubert-Moy, L.; Betbeder, J.; Corgne, S.; Baudry, J.; Pottier, E. Evaluation of Using Sentinel-1 and-2 Time-Series to Identify Winter Land Use in Agricultural Landscapes. Remote Sens. 2019, 11, 37. [Google Scholar] [CrossRef]
  75. Zhou, K.; Lindenbergh, R.; Gorte, B. Automatic Shadow Detection in Urban Very-High-Resolution Images Using Existing 3D Models for Free Training. Remote Sens. 2019, 11, 72. [Google Scholar] [CrossRef]
  76. Wei, S.; Zhang, H.; Wang, C.; Wang, Y.; Xu, L. Multi-Temporal SAR Data Large-Scale Crop Mapping Based on U-Net Model. Remote Sens. 2019, 11, 68. [Google Scholar] [CrossRef]
  77. Duarte-Carvajalino, J.; Alzate, D.; Ramirez, A.; Santa-Sepulveda, J.; Fajardo-Rojas, A.; Soto-Suárez, M. Evaluating Late Blight Severity in Potato Crops Using Unmanned Aerial Vehicles and Machine Learning Algorithms. Remote Sens. 2018, 10, 1513. [Google Scholar] [CrossRef]
  78. Duarte, D.; Nex, F.; Kerle, N.; Vosselman, G. Multi-Resolution Feature Fusion for Image Classification of Building Damages with Convolutional Neural Networks. Remote Sens. 2018, 10, 1636. [Google Scholar] [CrossRef]
  79. Lu, T.; Ming, D.; Lin, X.; Hong, Z.; Bai, X.; Fang, J. Detecting building edges from high spatial resolution remote sensing imagery using richer convolution features network. Remote Sens. 2018, 10, 1496. [Google Scholar] [CrossRef]
  80. DWD. Deutscher Wetterdienst Archiv Monats- und Tageswerte. 2018. Available online: http://www.dwd.de (accessed on 10 June 2018).
  81. ESRI. ArcGIS 9.2. © Environmental Systems Research Institute. 2007. Available online: http://www.esri.com/software/arcgis/eval-help/arcgis-92 (accessed on 19 March 2017).
  82. Microdrones. MD4-1000. 2018. Available online: https://www.microdrones.com/de/integrated-systems/mdmapper1000dg/ (accessed on 1 October 2018).
  83. R Core Team. R: A Language and Environment for Statistical Computing—Version R 3.3.2 GUI 1.68. Available online: https://www.R-project.org/ (accessed on 2 November 2016).
  84. Hain, J. Statistik mit R: Grundlagen der Datenanalyse; RRZN-Handbook, Regionales Rechenzentrum für Niedersachsen/Leipnitz Universität Hannover/Lehrstuhl für Mathematik VIII (Statistik) der Universität Würzburg: Würzburg/Hannover, Germany, 2011; pp. 176–187. [Google Scholar]
  85. SZ DJI Technology Co., Ltd. DJI MAVIC Pro. 2018. Available online: https://www.dji.com/de/mavic (accessed on 10 October 2018).
  86. Mapir Camera. Mapir Survey 3 Camera. 2018. Available online: https://www.mapir.camera/collections/survey3 (accessed on 12 June 2018).
  87. Sony Europe Limited. SONY-ILCE-5100. 2018. Available online: https://www.sony.de/electronics/wechselobjektivkameras/ilce-5100-body-kit (accessed on 12 August 2018).
  88. Trimble. DGPS—Trimble. 2018. Available online: https://www.trimble.com/gps_tutorial/dgps.aspx (accessed on 10 June 2018).
  89. Dandois, J.P.; Olano, M.; Ellis, E.C. Optimal altitude, overlap, and weather conditions for computer vision UAV estimates of forest structure. Remote Sens. 2015, 7, 13895–13920. [Google Scholar] [CrossRef]
  90. Pix4D S.A. Pix4D Mapper. 2018. Available online: https://cloud.pix4d.com/store/?=&solution=pro#solution_pro (accessed on 1 October 2018).
  91. Trimble. eCognition Developer Software. 2018. Available online: http://www.ecognition.com/suite/ecognition-developer (accessed on 1 May 2018).
  92. Blaschke, T. Object based image analysis for remote sensing. ISPRS 2010, 65, 2–16. [Google Scholar] [CrossRef] [Green Version]
  93. QGIS Development Team. QGIS Geographic Information System. Open Source Geospatial Foundation 2018. Available online: http://qgis.osgeo.org (accessed on 8 May 2018).
  94. Congalton, R.G.; Green, K. Assessing the Accuracy of Remotely Sensed Data—Principles and Practices, 2nd ed.; CRC Press, Taylor & Francis Group: Boca Raton, FL, USA, 2009. [Google Scholar]
  95. Landis, J.R.; Koch, G.G. The measurement of observer agreement for categorical data. Biometrics 1977, 33, 159–174. [Google Scholar] [CrossRef] [PubMed]
  96. Python Software Foundation. Python Language Reference, Version 3.7.1. 2018. Available online: http://www.python.org (accessed on 10 August 2018).
  97. Kluyver, T.; Ragan-Kelley, B.; Pérez, F.; Granger, B.E.; Bussonnier, M.; Frederic, J.; Kelly, K.; Hamrick, J.; Grout, J.; Corlay, S.; et al. Jupyter Development Team. Jupyter Notebooks—A publishing format for reproducible computational workflows. ELPUB 2016, 87–90. [Google Scholar] [CrossRef]
  98. Abadi, M.; Agarwal, A.; Barham, P.; Brevdo, E.; Chen, Z.; Citro, C.; Corrado, G.S.; Davis, A.; Dean, J.; Devin, M.; et al. TensorFlow: Large-scale Machine Learning on Heterogeneous Systems. 2015. Available online: Tensorflow.org (accessed on 10 August 2018).
  99. Chollet, F. Keras: The Python Deep Learning Library. 2015. Available online: https://keras.io (accessed on 10 August 2018).
  100. Hunter, J.D. Matplotlib: A 2D graphics environment. Comput. Sci. Eng. 2007, 9, 90–95. [Google Scholar] [CrossRef]
  101. Oliphant, T.E. A Guide to NumPy; Trelgol Publishing: Spanish Fork, UT, USA, 2006; Volume 1, p. 85. [Google Scholar]
  102. McKinney, W. Data structures for statistical computing in python. In Proceedings of the 9th Python in Science Conference, Austin, TX, USA, 28 June–3 July 2010; Volume 445, pp. 51–56. [Google Scholar]
  103. Pedregosa, F.; Varoquaux, G.; Gramfort, A.; Michel, V.; Thirion, B.; Grisel, O.; Blondel, M.; Prettenhofer, P.; Weiss, R.; Dubourg, V.; et al. Scikit-learn: Machine Learning in Python. J. Mach. Learn. Res. 2011, 12, 2825–2830. [Google Scholar]
  104. Simonyan, K.; Zisserman, A. Very deep convolutional networks for large-scale image recognition. arXiv, 2014; arXiv:1409.1556. [Google Scholar]
  105. Nguyen, C.N.; Zeigermann, O. Machine Learning, kurz und gut; O’Reillys Taschenbibliothek: Heidelberg, Germany, 2018; ISBN 978-3-96009-052-6. [Google Scholar]
  106. Krizhevsky, A.; Sutskever, I.; Hinton, G.E. Imagenet classification with deep convolutional neural networks. In Proceedings of the Advances in Neural Information Processing Systems, Lake Tahoe, NV, USA, 3–6 December 2012; pp. 1097–1105. [Google Scholar]
  107. Kingma, D.P.; Ba, J. Adam: A method for stochastic optimization. arXiv, 2014; arXiv:1412.6980. [Google Scholar]
  108. Makkar, H.P.S.; Becker, K. Do tannins in leaves of trees and shrubs from African and Himalayan regions differ in level and activity? Agrofor. Syst. 1998, 40, 59–68. [Google Scholar] [CrossRef]
  109. Auld, B.; Morita, H.; Nishida, T.; Ito, M.; Michael, P. Shared exotica: Plant invasions of Japan and south eastern Australia. Cunninghamia 2003, 8, 147–152. [Google Scholar]
  110. Fuentes, N.; Ugarte, E.; Kühn, I.; Klotz, S. Alien plants in southern South America. A framework for evaluation and management of mutual risk of invasion between Chile and Argentina. Biol. Invas. 2010, 12, 3227–3236. [Google Scholar] [CrossRef]
  111. Cierjacks, A.; Kowarik, I.; Joshi, J.; Hempel, S.; Ristow, M.; Lippe, M.; Weber, E. Biological flora of the British Isles: Robinia pseudoacacia. J. Ecol. 2013, 101, 1623–1640. [Google Scholar] [CrossRef]
  112. Li, T.; Liu, G. Age-related changes of carbon accumulation and allocation in plants and soil of black locust forest on Loess Plateau in Ansai County, Shaanxi Province of China. Chin. Geogr. Sci. 2014, 24, 414–422. [Google Scholar] [CrossRef]
  113. Akatov, V.V.; Akatova, T.V.; Shadzhe, A.E. Robinia pseudoacacia L. in the Western Caucasus. Russ. J. Biol. Invas. 2016, 7, 105–118. [Google Scholar] [CrossRef]
  114. Lei, J.; Nan, L.; Bojie, F.; Guangyao, G.; Shuai, W.; Tiantian, J.; Liwei, Z.; Jianbo, L.; Di, Z. Comparison of transpiration between different aged black locust (Robinia pseudoacacia) trees on the semi-arid Loess Plateau, China. J. Arid. Land. 2016, 8, 604–617. [Google Scholar] [CrossRef]
  115. Tompa, K.; Szent-Istvany, A. German: Die Vorbereitung der Robiniensamen zur Saat mit Hilfe des Scheiben-Skarifikators; Erdömernöki Föiskola, Erdötelepites-Es Fasitastani Tanszek, Sopron, Sonderdr. O. J.: Sopron, Hungary, 1963; pp. 105–121. [Google Scholar]
  116. Czarapata, E.J. Invasive Plants of the Upper Midwest: An Illustrated Guide to Their Identification and Control; The University of Wisconsin Press: Madison, WI, USA, 2005; p. 215. [Google Scholar]
  117. Clark, F.B. Forest Planting on Strip-Mined Land; Technical Paper No. 141; U.S. Department of Agriculture, Forest Service, Central States Forest Experiment Station: Columbus, OH, USA, 1954; p. 33. [Google Scholar]
  118. Geyer, W.A. Biomass yield potential of short-rotation hardwoods in the Great Plains. Biomass 1989, 20, 167–175. [Google Scholar] [CrossRef]
  119. Carl, C.; Biber, P.; Veste, M.; Landgraf, D.; Pretzsch, H. Key drivers of competition and growth partitioning among Robinia pseudoacacia L. trees. For. Ecol. Manag. 2018, 430, 86–93. [Google Scholar] [CrossRef]
  120. Dünisch, O.; Koch, G.; Dreiner, K. Verunsicherung uber die Eigenschaften von Robinienholz. Holz-Zentralblatt 2007, 39, 1061–1062. [Google Scholar]
  121. Koch, G.; Dünisch, O. Juvenile wood in Robinie—Qualität von Robinienholz (Ro-binia pseudoacacia L.) und Folgerungen für Holzbearbeitung und Produktqualität; Abschlussbericht für das DGfH/AIF-Forschungsvorhaben, Fraunhofer IRB Verl.: Stuttgart, Germany, 2008. [Google Scholar]
  122. Dünisch, O.; Richter, H.-G.; Koch, G. Wood properties of juvenile and mature heartwood in Robinia pseudoacacia L. Wood Sci. Technol. 2010, 44, 301–313. [Google Scholar] [CrossRef]
  123. Latorraca, J.V.F.; Dünisch, O.; Koch, G. Chemical composition and natural durability of juvenile and mature heartwood of Robinia pseudoacacia L. Anais da Academia Brasileira de Ciências 2011, 83, 1059–1068. [Google Scholar] [CrossRef] [PubMed]
  124. Xu, F.; Guo, W.; Wang, R.; Xu, W.; Du, N.; Wang, Y. Leaf movement and photosynthetic plasticity of black locust (Robinia pseudoacacia) alleviate stress under different light and water conditions. Acta Physiol. Plant 2009, 31, 553–563. [Google Scholar] [CrossRef]
  125. Kowarik, I. Funktionen klonalen Wachstums von Bäumen bei der Brachflächen-Sukzession unter besonderer Beachtung von Robinia pseudoacacia. Verh. Ges. Ökologie 1996, 26, 173–181. [Google Scholar]
  126. Grese, R. The landscape architect and problem exotic plants. In Proceedings of the American Society of Landscape Architects’ Open Committee on Reclamation: Reclamation Diversity, San Diego, CA, USA, 29 October 1991; Burley, J.B., Ed.; American Society of Landscape Architects: Washington, DC, USA, 1991; pp. 7–15. [Google Scholar]
  127. Van Miegroet, H.; Cole, D.W. The impact of nitrification on soil acidification and cation leaching in a red alder ecosystem. J. Environ. Qual. 1984, 13, 586–590. [Google Scholar] [CrossRef]
  128. Montagnini, F.; Haines, B.; Swank, W.T. Soil-solution chemistry in black locust, pine mixed-hardwoods and oak hickory forest stands in the Southern Appalachians, USA. For. Ecol. Manag. 1991, 40, 199–208. [Google Scholar] [CrossRef]
  129. Malcolm, G.M.; Bush, D.S.; Rice, S.K. Soil nitrogen conditions approach preinvasion levels following restoration of nitrogen-fixing black locust (Robinia pseudoacacia) stands in a pine-oak ecosystem. Restor. Ecol. 2008, 16, 70–78. [Google Scholar] [CrossRef]
  130. Fischer, M.; Stöcklin, J. Local extinctions of plants in remnants of extensively used calcareous grasslands 1950–1985. Conserv. Biol. 1997, 11, 727–737. [Google Scholar] [CrossRef]
  131. de Sá, N.C.; Castro, P.; Carvalho, S.; Marchante, E.; López-Núñez, F.A.; Marchante, H. Mapping the Flowering of an Invasive Plant Using Unmanned Aerial Vehicles: Is There Potential for Biocontrol Monitoring? Front. Plant Sci. 2018, 9, 293. [Google Scholar] [CrossRef] [PubMed]
  132. Pachauri, R.K.; Allen, M.R.; Barros, V.R.; Broome, J.; Cramer, W.; Christ, R.; Dubash, N.K. Climate Change 2014: Synthesis Report. Contribution of Working Groups I, II and III to the Fifth Assessment Report of the Intergovernmental Panel on Climate Change; IPCC: Geneva, Switzerland, 2014. [Google Scholar]
  133. Oblack, R. Nitrogen—Gases in the Atmosphere. ThoughtCo. 22 June 2018. Available online: Thoughtco.com/nitrogen-in-the-atmosphere-3444094 (accessed on 9 August 2018).
  134. Gordon, N.; Holland, E. Nitrogen in the Earth System—Background on the Science, People, and Issues Involved in Nitrogen Cycle Research. 2015. Available online: https://www2.ucar.edu/news/backgrounders/nitrogen-earth-system (accessed on 9 August 2018).
  135. Strode, D.D. Black locust/Robinia pseudoacacia L. In Woody Plants as Wildlife Food Species. SO-16; U.S. Department of Agriculture, Forest Service, Southern Forest Experiment Station: Atlanta, GA, USA, 1977; pp. 215–216. [Google Scholar]
  136. Bartha, D.; Csiszár, Á.; Zsigmond, V. Black locust (Robinia pseudoacacia L.). In The Most Invasive Plants in Hungary; Botta-Dukát, Z., Balogh, L., Eds.; Institute of Ecology and Botany, Hungarian Academy of Sciences: Vácrátót, Hungary, 2008; pp. 63–76. [Google Scholar]
  137. Anderson, K.; Gaston, K.J. Lightweight unmanned aerial vehicles will revolutionize spatial ecology. Front. Ecol. Environ. 2013, 11, 138–146. [Google Scholar] [CrossRef] [Green Version]
  138. Nevalainen, O.; Honkavaara, E.; Tuominen, S.; Viljanen, N.; Hakala, T.; Yu, X.; Hyyppä, J.; Heikki, S.; Pölönen, I.; Imai, N.N.; et al. Individual tree detection and classification with UAV-based photogrammetric point clouds and hyperspectral imaging. Remote Sens. 2017, 9, 185. [Google Scholar] [CrossRef]
  139. Wallace, L.; Lucieer, A.; Watson, C.; Turner, D. Development of a UAV-LiDAR system with application to forest inventory. Remote Sens. 2012, 4, 1519–1543. [Google Scholar] [CrossRef]
  140. Yan, G.; Mas, J.F.; Maathuis, B.H.P.; Xiangmin, Z.; Van Dijk, P.M. Comparison of pixel-based and object-oriented image classification approaches—A case study in a coal fire area, Wuda, Inner Mongolia, China. Int. J. Remote Sens. 2006, 27, 4039–4055. [Google Scholar] [CrossRef]
  141. Weih, R.C.; Riggan, N.D. Object-based classification vs. pixel-based classification: Comparative importance of multi-resolution imagery. The International Archives of the Photogrammetry. Remote Sens. Spat. Inf. Sci. 2010, 38, C7. [Google Scholar]
  142. Lehmann, J.R.; Münchberger, W.; Knoth, C.; Blodau, C.; Nieberding, F.; Prinz, T.; Pancotto, V.A.; Kleinebecker, T. High-resolution Classification of South Patagonian Peat Bog Microforms Reveals Potential Gaps in Up-scaled CH4 Fluxes by use of Unmanned Aerial System (UAS) and CIR Imagery. Remote Sens. 2016, 8, 173. [Google Scholar] [CrossRef]
  143. Ammour, N.; Alhichri, H.; Bazi, Y.; Benjdira, B.; Alajlan, N.; Zuair, M. Deep learning approach for car detection in UAV imagery. Remote Sens. 2017, 9, 312. [Google Scholar] [CrossRef]
  144. Cao, R.; Zhu, J.; Tu, W.; Li, Q.; Cao, J.; Liu, B.; Zhang, Q.; Qiu, G. Integrating Aerial and Street View Images for Urban Land Use Classification. Remote Sens. 2018, 10, 1553. [Google Scholar] [CrossRef]
  145. Xu, Y.; Xie, Z.; Feng, Y.; Chen, Z. Road Extraction from High-Resolution Remote Sensing Imagery Using Deep Learning. Remote Sens. 2018, 10, 1461. [Google Scholar] [CrossRef]
  146. Liu, T.; Abd-Elrahman, A. An Object-Based Image Analysis Method for Enhancing Classification of Land Covers Using Fully Convolutional Networks and Multi-View Images of Small Unmanned Aerial System. Remote Sens. 2018, 10, 457. [Google Scholar] [CrossRef]
  147. Diegues, A.; Pinto, J.; Ribeiro, P. Automatic Habitat Mapping using Convolutional Neural Networks. IEEE OES AUV 2018. Available online: https://www.researchgate.net/profile/Jose_Pinto17/publication/330449471_Automatic_Habitat_Mapping_using_Convolutional_Neural_Networks/links/5c408fc9458515a4c72d24b7/Automatic-Habitat-Mapping-using-Convolutional-Neural-Networks.pdf (accessed on 12 August 2018).
  148. Abrams, J.F.; Vashishtha, A.; Wong, S.T.; Nguyen, A.; Mohamed, A.; Wieser, S.; Kuijper, A.; Wilting, A.; Mukhopadhyay, A. Habitat-Net: Segmentation of habitat images using deep learning. bioRxiv 2018, 483222. [Google Scholar] [CrossRef]
  149. LeCun, Y.; Bottou, L.; Bengio, Y.; Haffner, P. Gradient-based learning applied to document recognition. Proc. IEEE 1998, 86, 2278–2324. [Google Scholar] [CrossRef] [Green Version]
  150. Paszke, A.; Chaurasia, A.; Kim, S.; Culurciello, E. Enet: A deep neural network architecture for real-time semantic segmentation. arXiv, 2016; arXiv:1606.02147. [Google Scholar]
  151. Garcia-Garcia, A.; Orts-Escolano, S.; Oprea, S.; Villena-Martinez, V.; Garcia-Rodriguez, J. A review on deep learning techniques applied to semantic segmentation. arXiv, 2017; arXiv:1704.06857. [Google Scholar]
  152. Flohr, F.; Gavrila, D. PedCut: An iterative framework for pedestrian segmentation combining shape models and multiple data cues. BMVC 2013. [Google Scholar] [CrossRef]
Figure 1. Map of the study area in Europe, indicating the ten R. pseudoacacia sampling sites in Germany [81]. Red triangles are sites visited for seed collection, green dots are the sites where sample plots for the stump shoot analysis were measured, and the purple square is the study site of the UAS image analysis, which was applied for the spreading detection. For an overview of site abbreviations, see Table 1.
Forests 10 00235 g001
Figure 2. Flow chart showing the reproduction and spreading analysis: seed germination (a), stump shoot analysis (b), and root suckering (spreading) analysis (c). Seeds were seeded in planting boxes, and watered. Stump shoots were analyzed in sample plots. Spreading was estimated with the aid of UAS-images [82].
Forests 10 00235 g002
Figure 3. Convolutional neural network (CNN) structure as applied deep learning algorithm. Conv–convolutional layer (light green), pool–max-pooling layer (yellow), drop–dropout layer (blue), flat–flatten layer (pink), dens–fully connected layer (dark green).
Forests 10 00235 g003
Figure 4. Black locust seed germination (%) by (I) directly sowing, (II) 24 h soaking, (III) warm-cold treatment for two hours at 45 °C and two hours at −20 °C, (IV) warm-cold treatment of two hours at 60 °C and two hours at −20 °C, (V) hot water scalding, and (VI) mechanical scarification. The error bars show the standard error of the mean per seed treatment. Database = 3000 seeds.
Forests 10 00235 g004
Figure 5. Average number of shoots per stump in relation to the shoot age and the standard error of the mean (data = 5244 shoots). Detailed values are presented in Table 3.
Forests 10 00235 g005
Figure 6. Spreading: outline average values of the areas; 0–2 m, 2–4 m, 4–6 m, 6–8 m, 8–10 m depending on the surrounding areas: meadow, farmland, dirt road, and pine forest. The spreading depends on the proportion of black locust; dark green stands for 40%–50%, light green indicates 30%–40%, yellow is 20%–30%, orange 10%–20% and red 0%–10%. The arrows show the average spreading distance of black locust. For an overview of the results, see Table 4. Database = 2124 m [82].
Forests 10 00235 g006
Figure 7. Accuracy (a) and loss (b) of the training and validation (=testing) data for classification of R. pseudoacacia and Non-R. pseudoacacia, depending on the iterations. Dataset = 1000 images; 80% for training and 20% for testing.
Forests 10 00235 g007
Table 1. Site description including location, longitude (long), latitude (lat), tree/shoot age, and analysis methodology.
Site AbbreviationLocationLong (°E)Lat (°N)Tree/Shoot AgeAnalysis
BGBlumberg14°10′24″53°12′25″3Stump shoot
BHBuchholz12°38′9″53°15′34″2Stump shoot
DAGrunow-Dammendorf14°25′5″52°8′26″4Spreading
GUGumtow12°14′11″52°59′46″2Stump shoot
KLKlein Loitz14°30′57″51°36′35″3Stump shoot
LHLauchhammer13°50′57″51°32′20″8Seed collection
PAPaulinenaue12°43′52″52°39′44″3Stump shoot
RMRöblingen11°42′42″51°25′57″8Seed collection
WAWainsdorf13°29′4″51°24′50″1Stump shoot
WZWelzow14°14′7″51°33′32″1Stump shoot
Table 2. Pairwise t-tests of the black locust seed germination by (I) directly sowing, (II) 24 h soaking, (III) warm-cold treatment for two hours at 45 °C and two hours at −20 °C, (IV) warm-cold treatment of two hours at 60 °C and two hours at −20 °C, (V) hot water scalding, and (VI) mechanical scarification.
TreatmentIIIIIIIVV
II0.3365
III<0.001<0.001
IV<0.001<0.001<0.001
V0.00860.0090.0150.750
VI<0.001<0.001<0.0010.0110.274
Table 3. Average number of shoots per stump and per age class as well as the plot and shoot database.
Site AbbreviationShoot AgePlotsDataAverage ShootsShoots Per AgeSDSECIp-Value
WA146802.874.171.120.320.71<0.001
WZ813314.82
BH2610003.983.610.610.160.35
GU813143.34
BG334411.562.181.190.451.10
KL34783.38
PA11670.44
SD: standard deviation; SE: standard error of the mean; CI: confidence interval (default 95%).
Table 4. Zones 0–2 m, 2–4 m, 4–6 m, 6–8 m, 8–10 m and the average distance as spreading of black locust depending on the surrounding area: meadow, farmland, dirt road, and forest.
Zone0–2 m (%)2–4 m (%)4–6 m (%)6–8 m (%)8–10 m (%)Average Distance (m)
Meadow43.9932.3714.863.000.331.89
Farmland27.4519.609.780.910.071.16
Dirt road41.9637.8126.076.380.582.26
Forest40.2325.427.791.140.0021.49
Table 5. Confusion matrix of the classification R. pseudoacacia and non-R. pseudoacacia via object-based image analysis (OBIA). KIA stands for Kappa Index of Agreement.
Actual
R. pseudoacaciaNon-R. pseudoacacia
PredictedR. pseudoacacia1777
Non-R. pseudoacacia5174
Producer Accuracy0.9750.962
User Accuracy0.9630.972
KIA Class0.9420.928
Overall Accuracy0.966
KIA Overall0.932
Table 6. Classification examples of the test data set; R. pseudoacacia ((a), category 1) and Non-R. pseudoacacia ((b) category 0): meadow, dirt road, pine forest, and farmland. Pred is the abbreviation for Prediction. True and the green color of the labels show that the prediction (output in Figure 3) and the class (input in Figure 3) are equal.
(a) Robinia pseudoacacia L.(b) Non Robinia pseudoacacia L.
Forests 10 00235 i0011 True
1 Pred
Forests 10 00235 i0020 True
0 Pred
Forests 10 00235 i0031 True
1 Pred
Forests 10 00235 i0040 True
0 Pred
Forests 10 00235 i0051 True
1 Pred
Forests 10 00235 i0060 True
0 Pred
Forests 10 00235 i0071 True
1 Pred
Forests 10 00235 i0080 True
0 Pred

