Article

Aboveground Biomass Allocation and Additive Allometric Models for Natural Larix gmelinii in the Western Daxing’anling Mountains, Northeastern China

1
College of Forestry, Beijing Forestry University, Beijing 100083, China
2
Qianyanzhou Ecological Research Station, Key Laboratory of Ecosystem Network Observation and Modeling, Institute of Geographic Sciences and Natural Resources Research, Chinese Academy of Sciences, Beijing 100101, China
3
Institute of Forest Medicinal Herb and Food, Jiangxi Academy of Forestry, Nanchang 330032, China
*
Author to whom correspondence should be addressed.
Forests 2019, 10(2), 150; https://doi.org/10.3390/f10020150
Submission received: 3 December 2018 / Revised: 1 February 2019 / Accepted: 4 February 2019 / Published: 11 February 2019
(This article belongs to the Section Forest Ecology and Management)

Abstract

:
Accurate estimates of tree component and aboveground biomass strongly depend on robust and precise allometric equations. However, site-specific and suitable biomass equations are currently scarce for natural Larix gmelinii forests in the western Daxing’anling Mountains, northeastern China. This study aimed to evaluate the biomass allocation patterns within tree components and develop additive allometric biomass equations for species of L. gmelinii. A total of 58 trees were destructively sampled and measured for wood (inside bark), bark, branch and leaf biomass. For each component, we assessed the share of biomass allocated to different components by computing its ratio; we also tested two allometric equations based on diameter at breast height (dbh) alone, and dbh fitted with height (h) as independent variables. Seemingly unrelated regression methodology was used to fit an additive system of biomass allometric equations. We performed an independent dataset to evaluate the predictive ability of the best model system. The results revealed that wood biomass accounted for approximately 60% of the aboveground biomass. Wood and branch biomass ratios increased with increasing dbh, while a reverse trend was observed for bark and leaf biomass ratios. All models showed good fitting results with Adj.R2 = 0.958–0.995. Tree dbh provided the lowest estimation errors in the regressions associated with branches and leaves, while dbh2 × h generated the most precise models for stems (wood and bark). We conclude that these allometric equations will accurately predict biomass for Larix trees in the western Daxing’anling Mountains.

1. Introduction

The boreal forest, the world’s second largest forest biome, covers around 15% of the earth’s land surface and contains approximately 50% of the carbon in the atmosphere, playing an important role in the global carbon dynamics [1,2,3]. Some studies suggest that mid- and high-latitude forest ecosystems, such as the boreal forests, act as a significant carbon sink [4,5,6]. The boreal forests in China are mainly distributed in Daxing’anling mountains encompassing Heilongjiang Province (eastern part) and Inner Mongolia (western part), forming the southern boundary of the boreal forests. The dominant species is the deciduous conifer Larix gmelinii, which is well known for its economic benefits of timber production. The natural L. gmelinii forests are regarded as a southeastern extension of the Siberian Taiga forests, making the study of carbon stocks and fluxes a key issue.
Biomass estimates are a prerequisite for precisely quantifying forest carbon stocks and their dynamics [7,8], and accurate quantification of forest biomass is therefore of great importance. Estimating tree and forest biomass is also essential for informing greenhouse gas mitigation [9,10], and forest ecosystem services such as wildlife habitat and timber [11,12]. Furthermore, it is fundamental to analyze matter and energy flows in forest ecosystems [13,14].
The most accurate and direct method to determine tree-level biomass is to harvest the whole tree, further dividing it into separate components. Then, each component needs to be weighed to obtain the actual fresh weight and dry weight using the relevant moisture content of different component [15,16]. However, destructive biomass sampling is labor-intensive. In addition, the use of destructive sampling methods is limited to small trees or small sample size; it is also not recommended in nature reserves and for endangered tree species [17]. To avoid these limitations, allometric biomass equations, which are regressions linking the biomass to some predictor variables, are considered a better and still reliable approach to assess tree dry mass [18,19,20]. In the initial stage, an extensive destructive sampling is required when fitting allometric equations. But then the developed equations can serve as a non-destructive method to estimate biomass [21].
To date, various model forms have been proposed for developing biomass equations [7,22,23,24,25], and the most common and widely used form is power function [26,27,28]. The logarithmic transformation of the power function has been generally used to accommodate for the heteroscedasticity [29,30,31]. However, the logarithmic form of the allometric equation produces a systematic bias when converting predicted logarithmic values back to their original untransformed scale [32]. Several correction factors for the anti-logarithm transformation have been suggested during the past decades [33,34,35,36].
In general, allometric biomass models relate total and component dry mass to dendrometric variables of trees; most published studies used diameter at breast height (dbh) alone as an independent variable to predict biomass [18,20], with many studies also using height (h) as an additional predictor [25,26,37,38]. Also tree age, crown area, crown length, and wood density have been used as predictors in uni- or multivariate biomass models [31,39,40].
For each sampled tree, the sum of separate component biomass produces the total biomass. When fitting biomass models separately, the inherent correlations among different components may be ignored, so that the sum of the predicted values from the separate biomass models of components may not equal the predicted value from the biomass model for the whole tree [41]. Therefore, the additive property between the whole tree and its components should be taken into account during model fitting [41,42,43,44]. To achieve additivity in a set of equations, several methods have been proposed, such as adjustment in proportion and nonlinear joint estimate [45], the generalized method of moments (GMM), and seemingly unrelated regression (SUR) [43]. In particular, SUR has been considered more general and flexible [41,46], giving an appreciable improvement in estimation accuracy [47]. Although each component’s equation derived from the additive equation system is not necessarily the best, SUR considers the existence of intrinsic correlations among components’ equation errors and ensures high efficiency of additivity, thus resulting in more efficient parameter estimates and lower overall variance [47,48].
So far, several studies have developed allometric biomass equations for L. gmelinii, mainly conducted in Heilongjiang, Jilin, and Liaoning Province [18,49,50,51]. However, there are few validated additive allometric biomass equations for estimating aboveground biomass specifically for the studied species in the western Daxing’anling Mountains. The lack of reliable or site-specific regression equations may lead to overestimate or underestimate carbon sequestration [17]. In addition, tree biomass allocation among different components may also differ according to forest origin, site conditions, and other management treatments.
In this study, we performed destructive sampling and collected dendrometric data of live and natural L. gmelinii trees in the western Daxing’anling Mountains, aiming to evaluate biomass allocation patterns within tree components and develop additive allometric biomass equations for the species. The specific aims were to (1) assess the biomass allocation patterns and component biomass proportions variation with tree diameter; (2) construct an additive systems of biomass equations using SUR and determine the best predictor variables; (3) validate the newly developed allometric equations with previous biomass equations published in the literature.

2. Materials and Methods
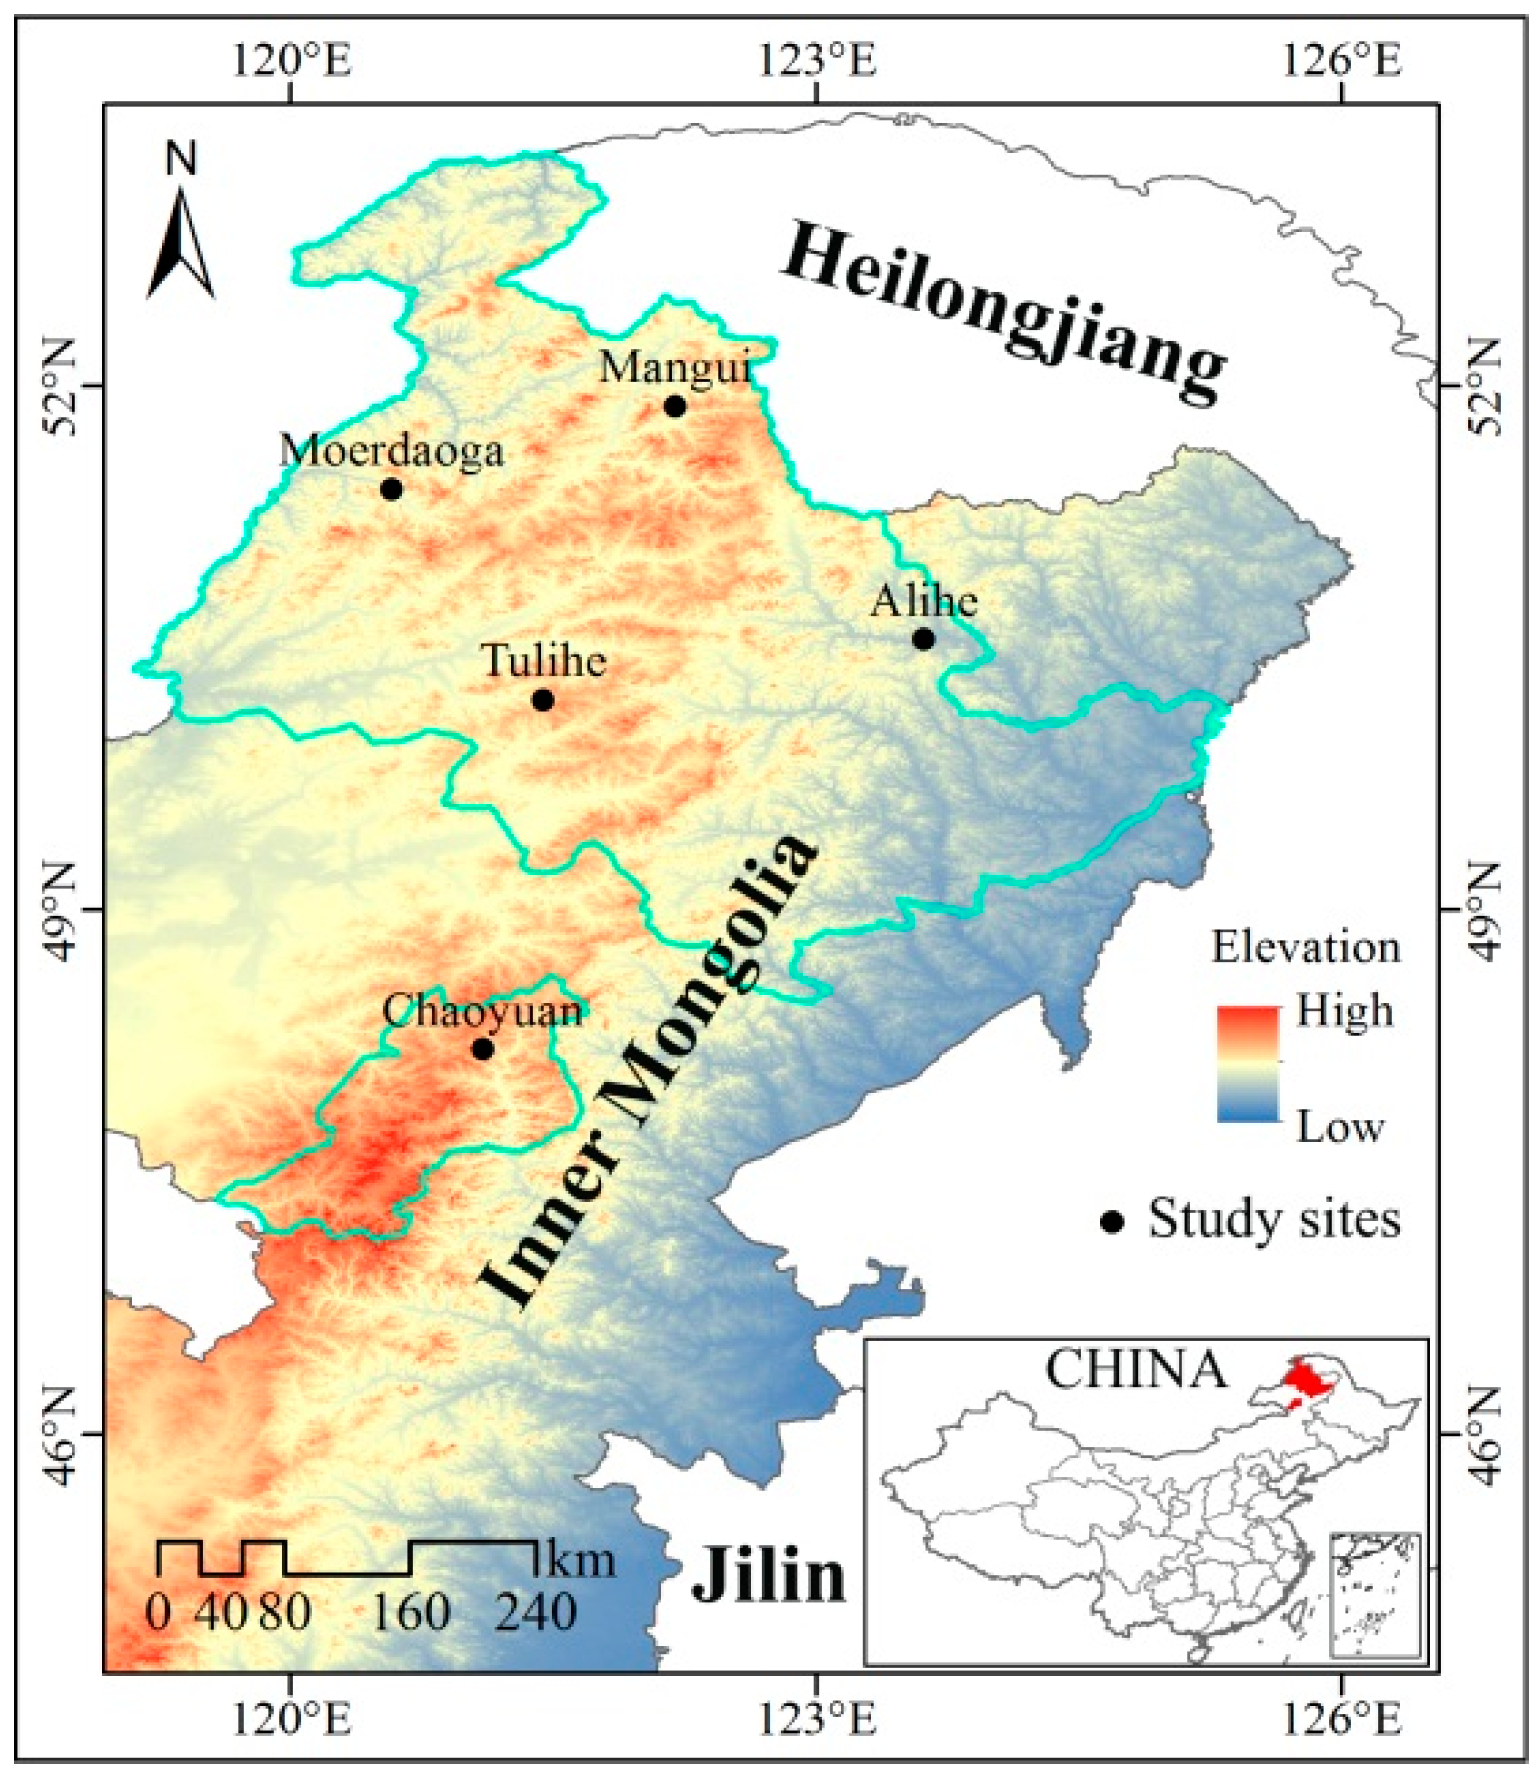
2.1. Study Area

We conducted this study in the western Daxing’anling Mountains, Inner Mongolia (47°3′40″–53°20′35″ N, 119°36′20″–125°19′50″ E), northeastern China (Figure 1). The area has a distinct cold temperate continental monsoon climate; the mean annual temperature is −3.2 °C, with extreme minimum and maximum temperatures of −52 °C and 40 °C, respectively. The annual precipitation ranges from 350 mm to 500 mm and is mainly distributed from May to October. The total area is around 11 million hectares and the elevation varies between 425 m and 1760 m above sea level. The substrate is predominantly brown coniferous forest soil. L. gmelinii is the dominant tree species. Besides, Betula platyphylla, Populus davidiana, B. dahurica, and Pinus sylvestris var. mongolica, among others, are common tree species. The shrub layer mainly includes Vaccinium vitis-idaea, Rhododendron simsii Planch and Ledum palustre, among others.

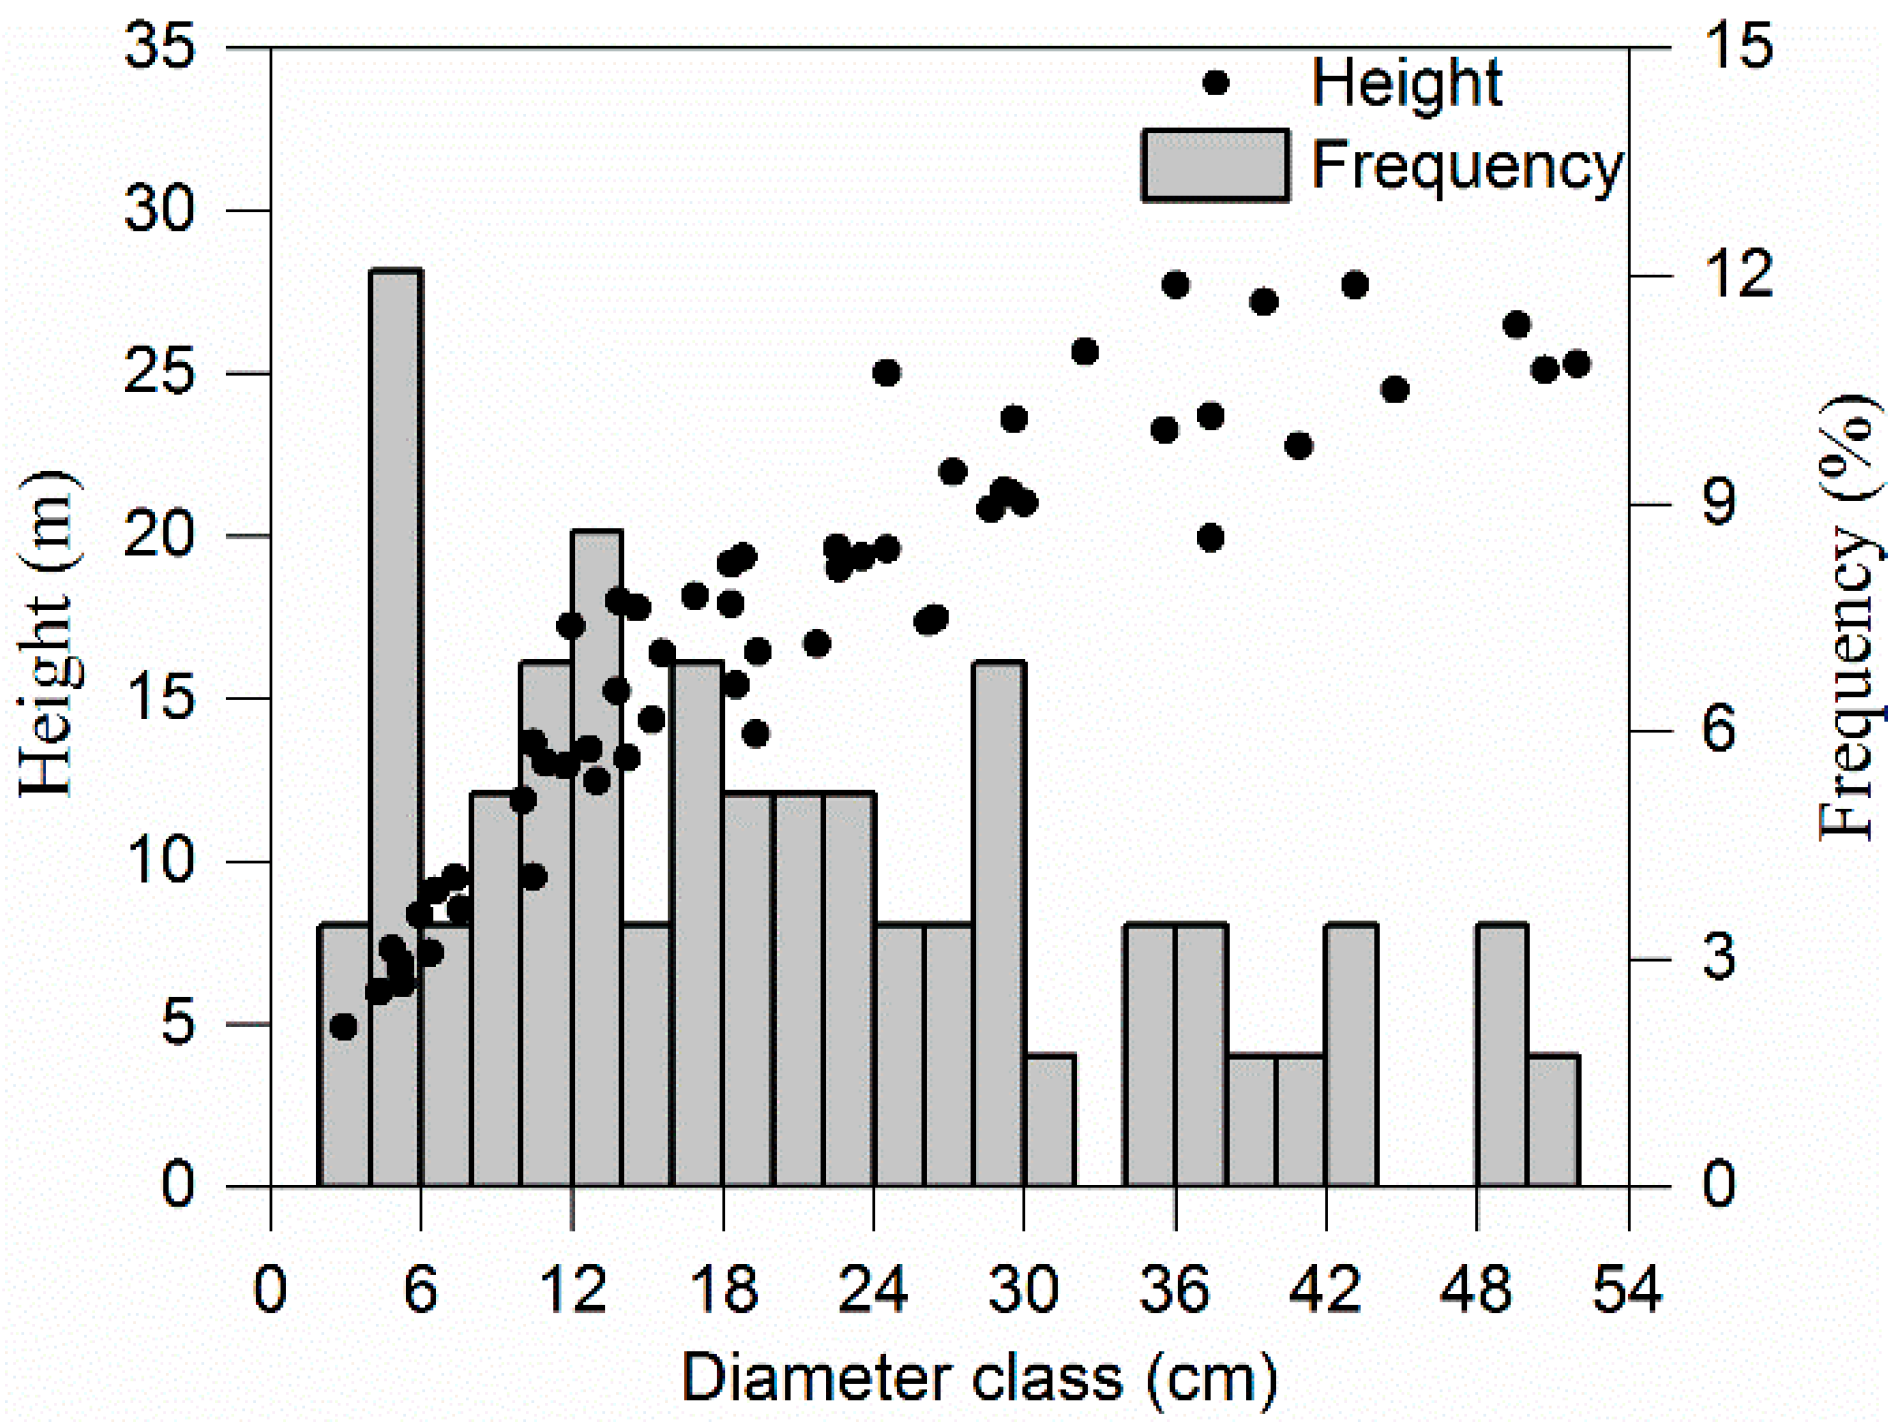
2.2. Tree Biomass Data

A destructive method with direct field measurements was applied to collect biomass data of wood, bark, branch and leaf components separately. A total of 58 trees were randomly selected across all occurring diameter classes (2-cm intervals) from five forest bureaus (Figure 1). Since many large trees were harvested in the last few decades, the sample trees basically represent the whole diameter range of larch at Daxing’anling Mountains. Dbh and total h were measured after felling (Figure 2).
The basal diameters of all branches directly protruding from the tree stem were measured. The volume of branches and the number of leaves were determined according to a nested regression method [52,53] that regards tree crowns as a deducible branch system. Subsequently, the stem was cut into sections at the position of 1, 3, 5 m, …, from base to treetop, and we took discs from the stem at each cut. Diameter outside and inside bark of each disc were measured with a tape. The stem volume was determined by adopting the sectional method with a section length of 2 m, for which the top log was considered as a small cone. Volume was calculated by the following function:
V = l i = 1 m g i + 1 3 g l
where gi is the central area of section i, l is the section length, m is the number of sections, g′ is the basal area of the top log, and l′ is the length of the top log. Bark volume was then calculated by subtracting the volume inside bark from the over-bark volume.
Sub-samples of wood, bark, branch, and leaf were collected and taken to the laboratory for basic attributes measurement. Three thin discs, including bark, were taken from the breast height, middle and end sections of the stem. Similarly, three discs were collected from the branches at the base, middle, and end. Leaf fascicles were randomly collected from different branches, up to a total of 1000. In the laboratory, fresh volumes of wood, bark, and branch were initially determined by water displacement. Dry weight of each sample was measured after oven-drying at 75 °C. Basic density, the ratio of dry weight to fresh volume, was then used to convert volume to dry mass for wood, bark, and branches [54,55]. The total dry mass of leaves for individual trees was calculated based on the average dry mass per leaf fascicle.
Four biomass compartments were recognized: wood (inside bark), bark, branch, and leaf. For each sampled tree, the sum of these separate compartments produced the total aboveground biomass (Table 1).

2.3. Data Analysis

Aboveground biomass allocation to wood, bark, branch, and leaf was assessed by computing the proportion of each component to aboveground biomass. Allometric models relating aboveground component biomass (Wi) against dbh and h were generated based on two models (Equations (2) and (3)).
ln W i = ln α + β · ln ( d b h )
ln W i = ln α + β · ln ( d b h 2 × h )
Tree dbh and h were combined as a compound predictor to solve the problem of collinearity and account for within-species variarion of h for a given dbh [17,56]. SUR takes into account the cross-equation constraints on the structural parameters and cross-equation error correlations for aboveground biomass and its separate components [57]. The total, subtotal, and component biomass are simultaneously fitted, ensuring additivity [41,43,44]. In addition, SUR considers the intrinsic correlation among biomass components, and no individual component model is developed separately from the total [50]. Following the model structure specified by [43], the additive systems of allometric equations for separate biomass components and their aggregate were established based on log-transformed Equations (2) and (3) respectively, as specified in the following forms. The two systems of equations were estimated by use of the PROC MODEL procedure of SAS 9.3 (SAS Institute Inc, Cary, NC, USA).
ln W w d = ln α w d + β w d · ln ( d b h ) ln W b k = ln α b k + β b k · ln ( d b h ) ln W b r = ln α b r + β b r · ln ( d b h ) ln W l f = ln α l f + β l f · ln ( d b h ) ln W c w = ln ( α b r · d b h β b r + α l f · d b h β l f ) ln W a g = ln ( α w d · d b h β w d + α b k · d b h β b k + α b r · d b h β b r + α l f · d b h β l f )
ln W w d = ln α w d + β w d · ln ( d b h 2 × h ) ln W b k = ln α b k + β b k · ln ( d b h 2 × h ) ln W b r = ln α b r + β b r · ln ( d b h 2 × h ) ln W l f = ln α l f + β l f · ln ( d b h 2 × h ) ln W c w = ln ( α b r · ( d b h 2 × h ) β b r + α l f · ( d b h 2 × h ) β l f ) ln W a g = ln ( α w d · ( d b h 2 × h ) β w d + α b k · ( d b h 2 × h ) β b k + α b r · ( d b h 2 × h ) β b r + α l f · ( d b h 2 × h ) β l f )
where Wwd, Wbk, Wbr, Wlf, Wcw, and Wag represent the wood, bark, branch, leaf, crown and aboveground biomass (in kg), respectively; αi and βi are coefficients.

2.4. Model Evaluation and Reconstruction

The two candidate additive systems of biomass equations were fitted to the entire dataset. The model fitting was evaluated by three goodness-of-fit statistics: root mean square error (RMSE), mean absolute error (MAE), and adjusted coefficient of determination (Adj.R2). The most appropriate equation was the one with the lowest RMSE and MAE, and with the highest Adj.R2. The mathematical expressions for calculating these statistics were as follows:
Root   mean   squared   error   RMSE = i = 1 n ( y i y ^ i ) 2 n k
Adjusted   coefficient   of   determination   Adj . R 2 = 1 ( 1 i = 1 n ( y i y ^ i ) 2 i = 1 n ( y i y ¯ ) 2 ) n 1 n k
Mean   absolute   error   MAE = i = 1 n | y i y ^ i | n
where yi is the i-th log-transformed observed biomass value; y ^ i is the i-th log value predicted by the model; y ¯ is the mean of the log-transformed observed value; n is the total number of observations used for model fitting; k represents the number of parameters included in the model.
The total and component biomass equations may have different optimum predictor variables. After fitting Equations (4) and (5), the best model for each biomass component was selected according to the three mentioned statistics. Then, we reconstructed the best additive system of biomass equations using variables extracted from the selected models.

2.5. Model Validation

A dataset of ten individual tree biomass measurements (Table 2) compiled from a study [58] conducted in Tahe forest bureau (north of Daxing’anling Mountains) was used to validate the additive model system. Tree biomass was separated into two components, stems and crowns, and weighed the fresh weights directly in the field. Dry biomass was transformed through water content. Graphical analyses of predicted versus observed components biomass were plotted. Validation was carried out by statistically comparing fitted values against independent biomass observations (t-test).

2.6. Antilogarithm Transformation Correction

Using the log-transformed allometric biomass equations may produce systematic bias when converting predicted logarithmic values back to original arithmetic units. To correct this bias, a multiplicative correction factor (CF) based on the standard error of the estimates [33,34] was usually applied to each regression equation as follows:
CF = exp ( RMSE 2 2 )

2.7. Evaluation of Existing Biomass Equations

The performance of an independent set of existing biomass equations [18,49,50,51] was evaluated and compared using the mensuration data of 58 sampled trees in this study. For each equation, we determined the percent relative error (RE) between observed and predicted values (Table 3). We emphasized that these equations are only valid over the range of the independent variables.
RE = 1 n i = 1 n ( W ^ i W i W i ) × 100 %
where W ^ i and Wi are the i-th tree predicted and observed biomass, respectively.

3. Results

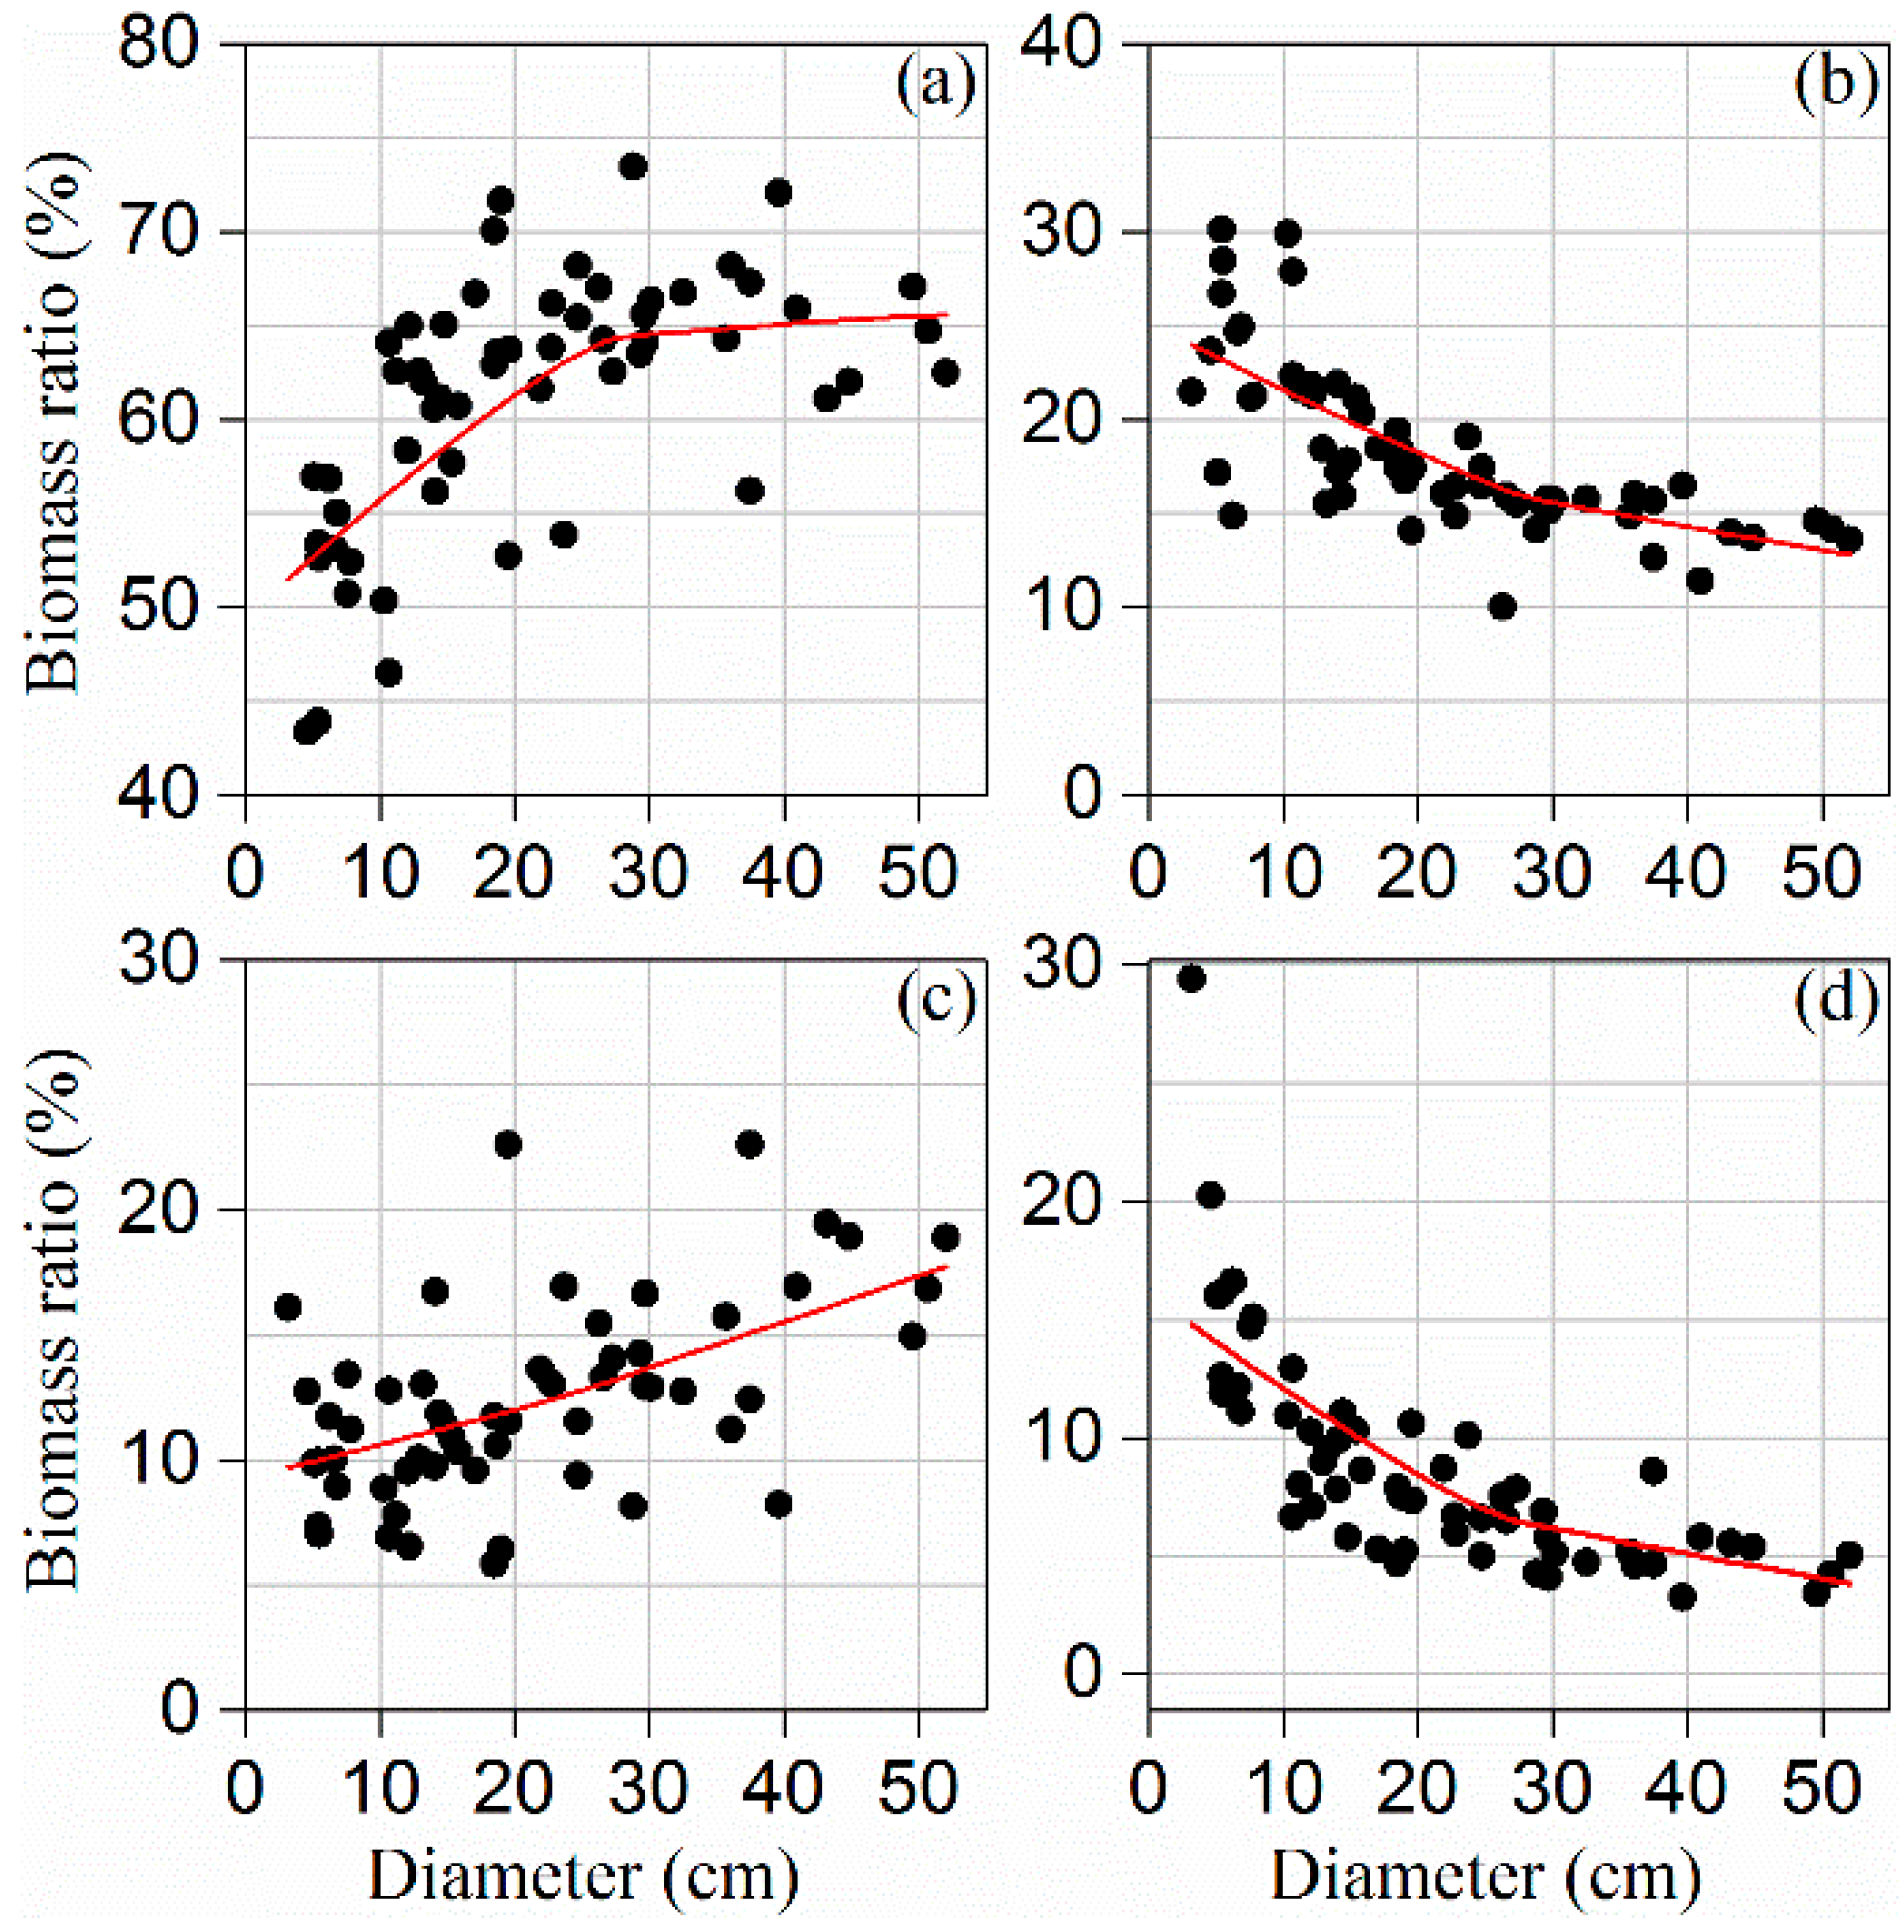
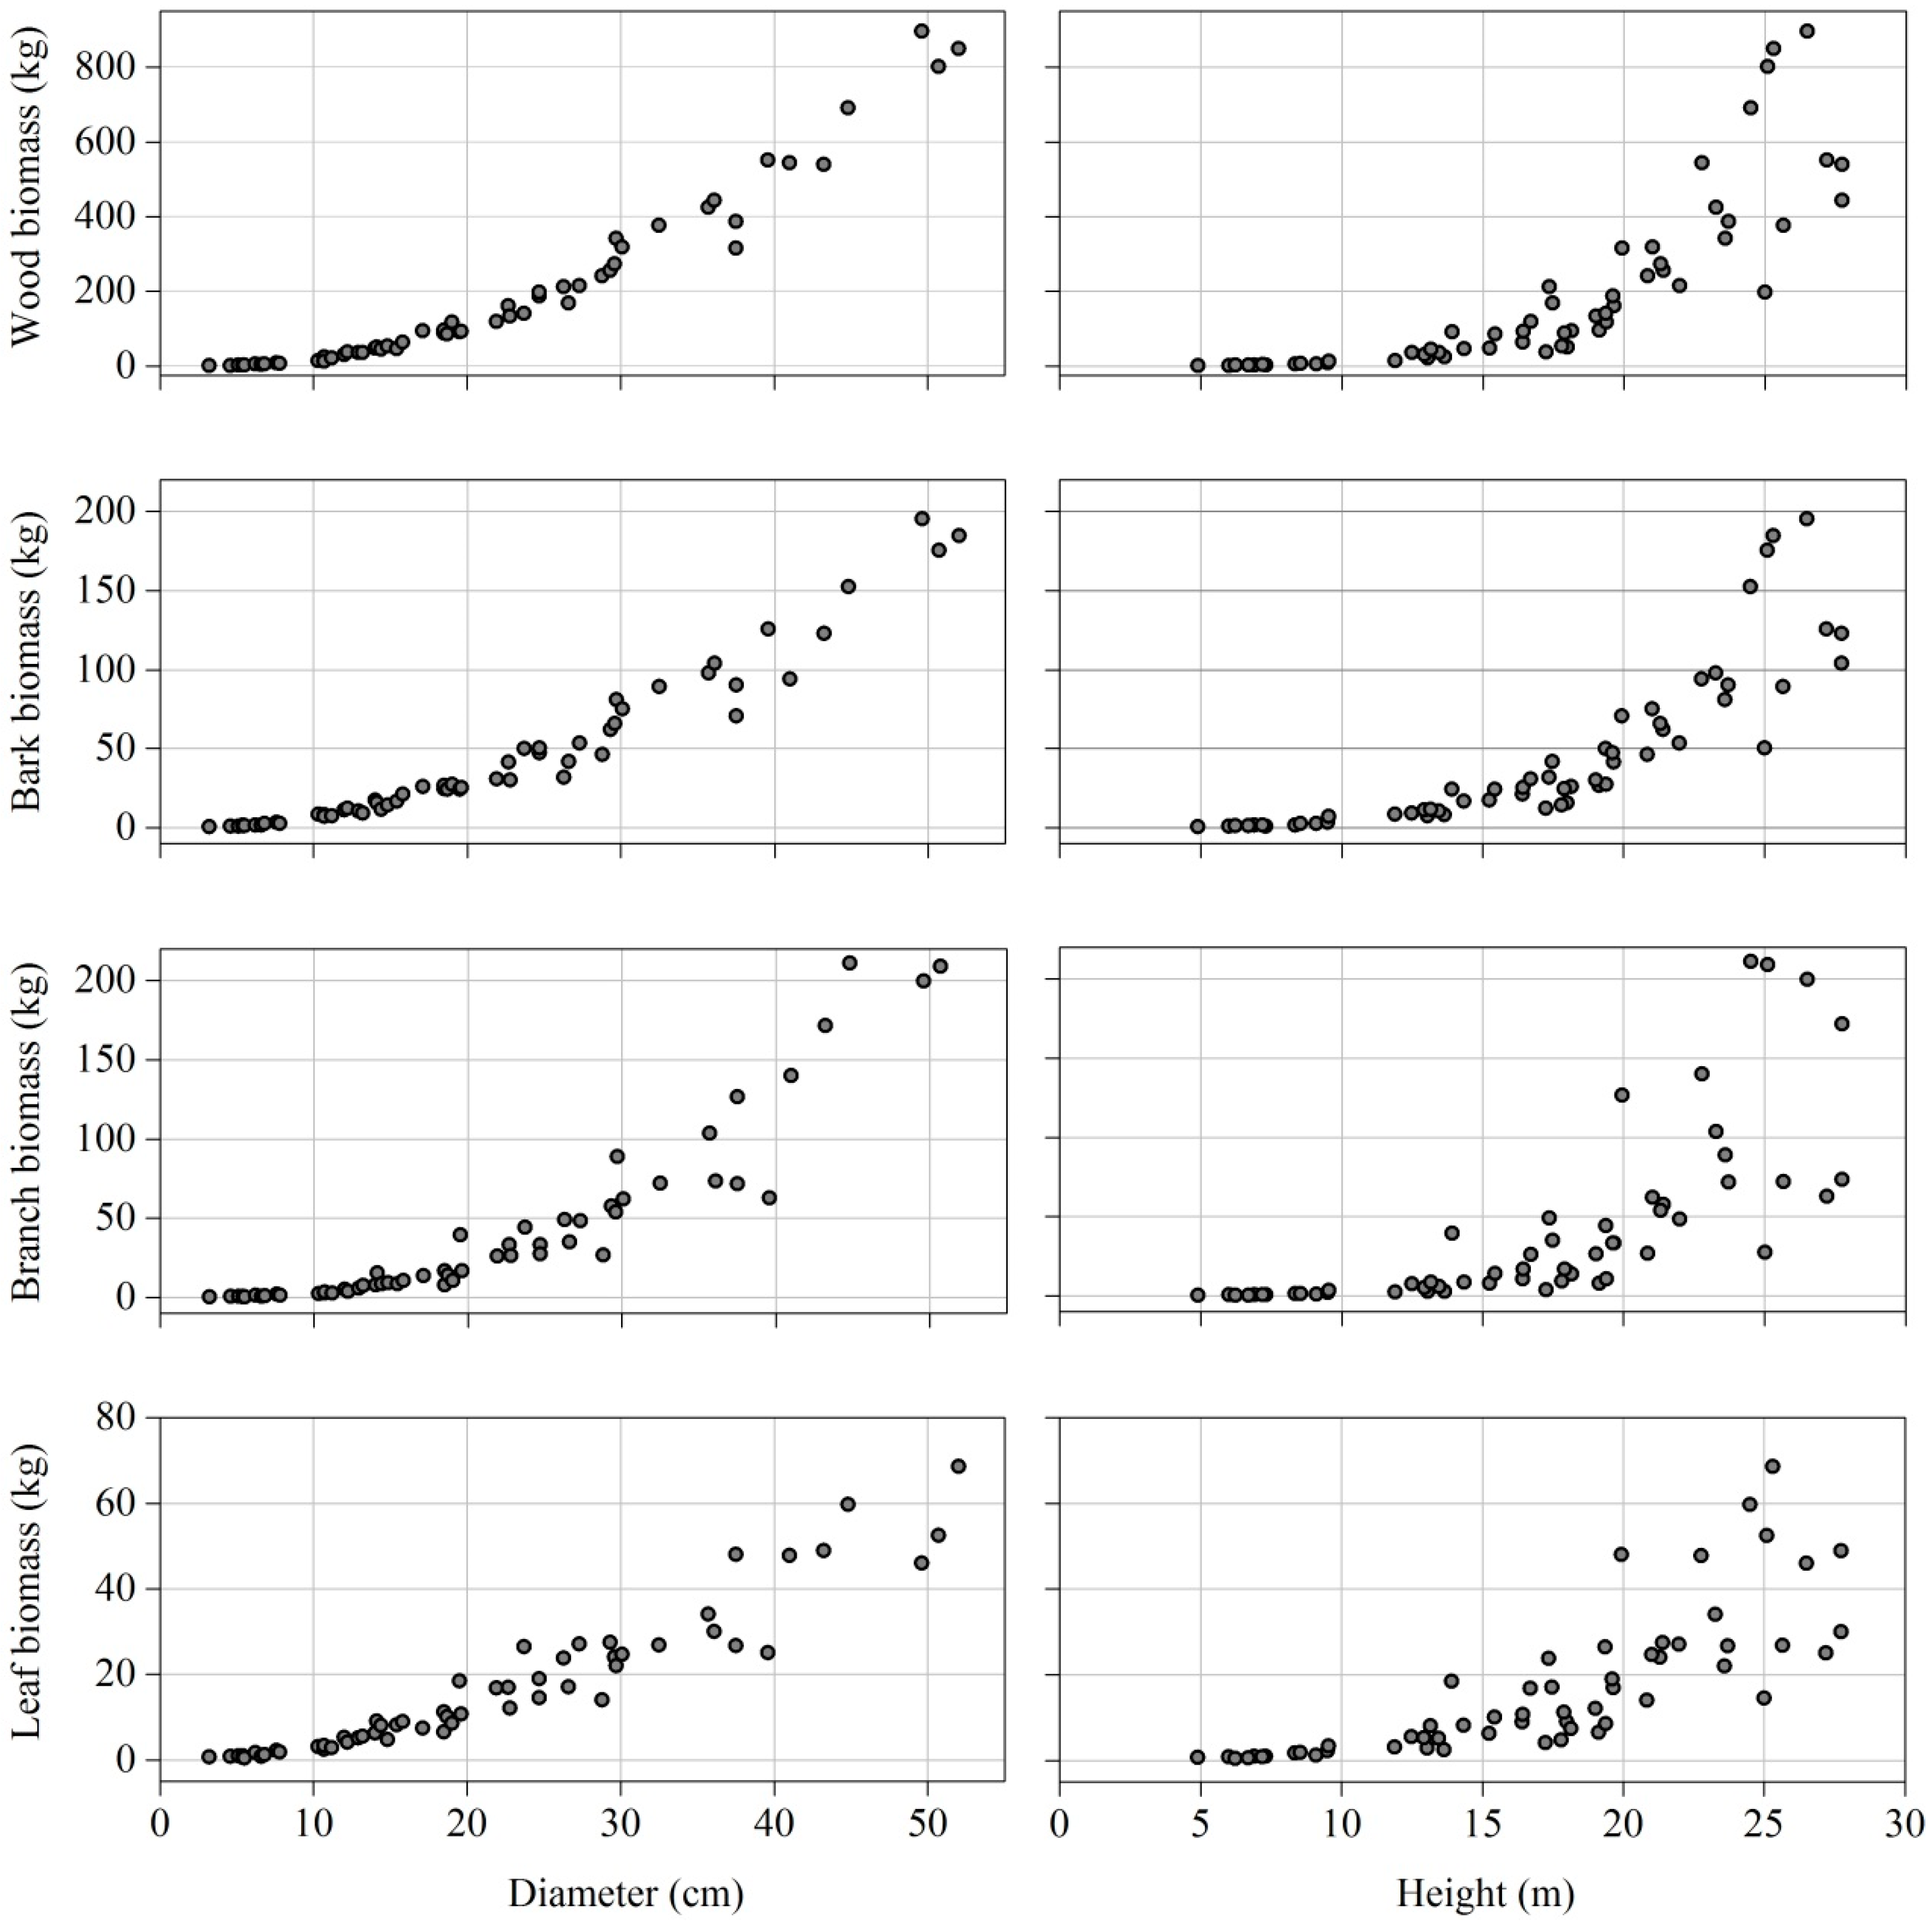
3.1. Biomass Allocation

The contribution of different components to the aboveground biomass varied greatly for the studied species. Stem accounted for most of the aboveground biomass (approximately 79%), with wood and bark contributing 61% and 18% to aboveground biomass, respectively. In contrast, crown biomass represented a small proportion of aboveground biomass, with a mean value of 12% and 9% for branch and leaf, respectively. In general, the proportion of bark and leaf biomass decreased with increasing dbh, while a reverse trend (increasing biomass ratio-dbh lines) was observed for the wood and branch fraction (Figure 3).

3.2. Allometric Models

The non-linear trend in observed values of wood, bark, branch, and leaf biomass as a function of dbh and h is displayed in Figure 4. All model regression coefficients were statistically highly significant (p < 0.001), and the biomass equation for each component performed well, with RMSE and MAE ranging from 0.130 to 0.373 and from 0.104 to 0.287 kg, respectively, while and Adj.R2 ranged from 0.950 to 0.995. Wood and bark biomass models had better fitting results (Adj.R2 > 0.987). In addition, the wood component biomass was better predicted when using dbh2 × h as an independent variable, yielding higher Adj.R2 (0.995) and lower RMSE (0.130 kg) and MAE (0.104 kg). Similarly, stem bark biomass was better predicted from dbh2 × h, which produced a higher Adj.R2 (0.991). On the contrary, branch and leaf biomass showed smaller estimation errors when dbh was used, compared to equations using both dbh and h; the corresponding Adj.R2, RMSE, and MAE for branch and leaf components were 0.968 and 0.958, 0.334 and 0.273 kg, 0.244 and 0.212 kg, respectively (Table 4).
Additive biomass equations were reconstructed by combining the best-fitting component equations (Table 5). The fit of branch and leaf models showed a slight improvement, while there was no obvious change for wood and bark. Correction factors for all equations (Table 5) were small, meaning that little variation could arise from the conversion of logarithmic values to original units, especially for wood, bark, and aboveground biomass equations (CF < 1.02). For branch, leaf, and crown biomass, the CFs presented relatively larger values (CF < 1.06).

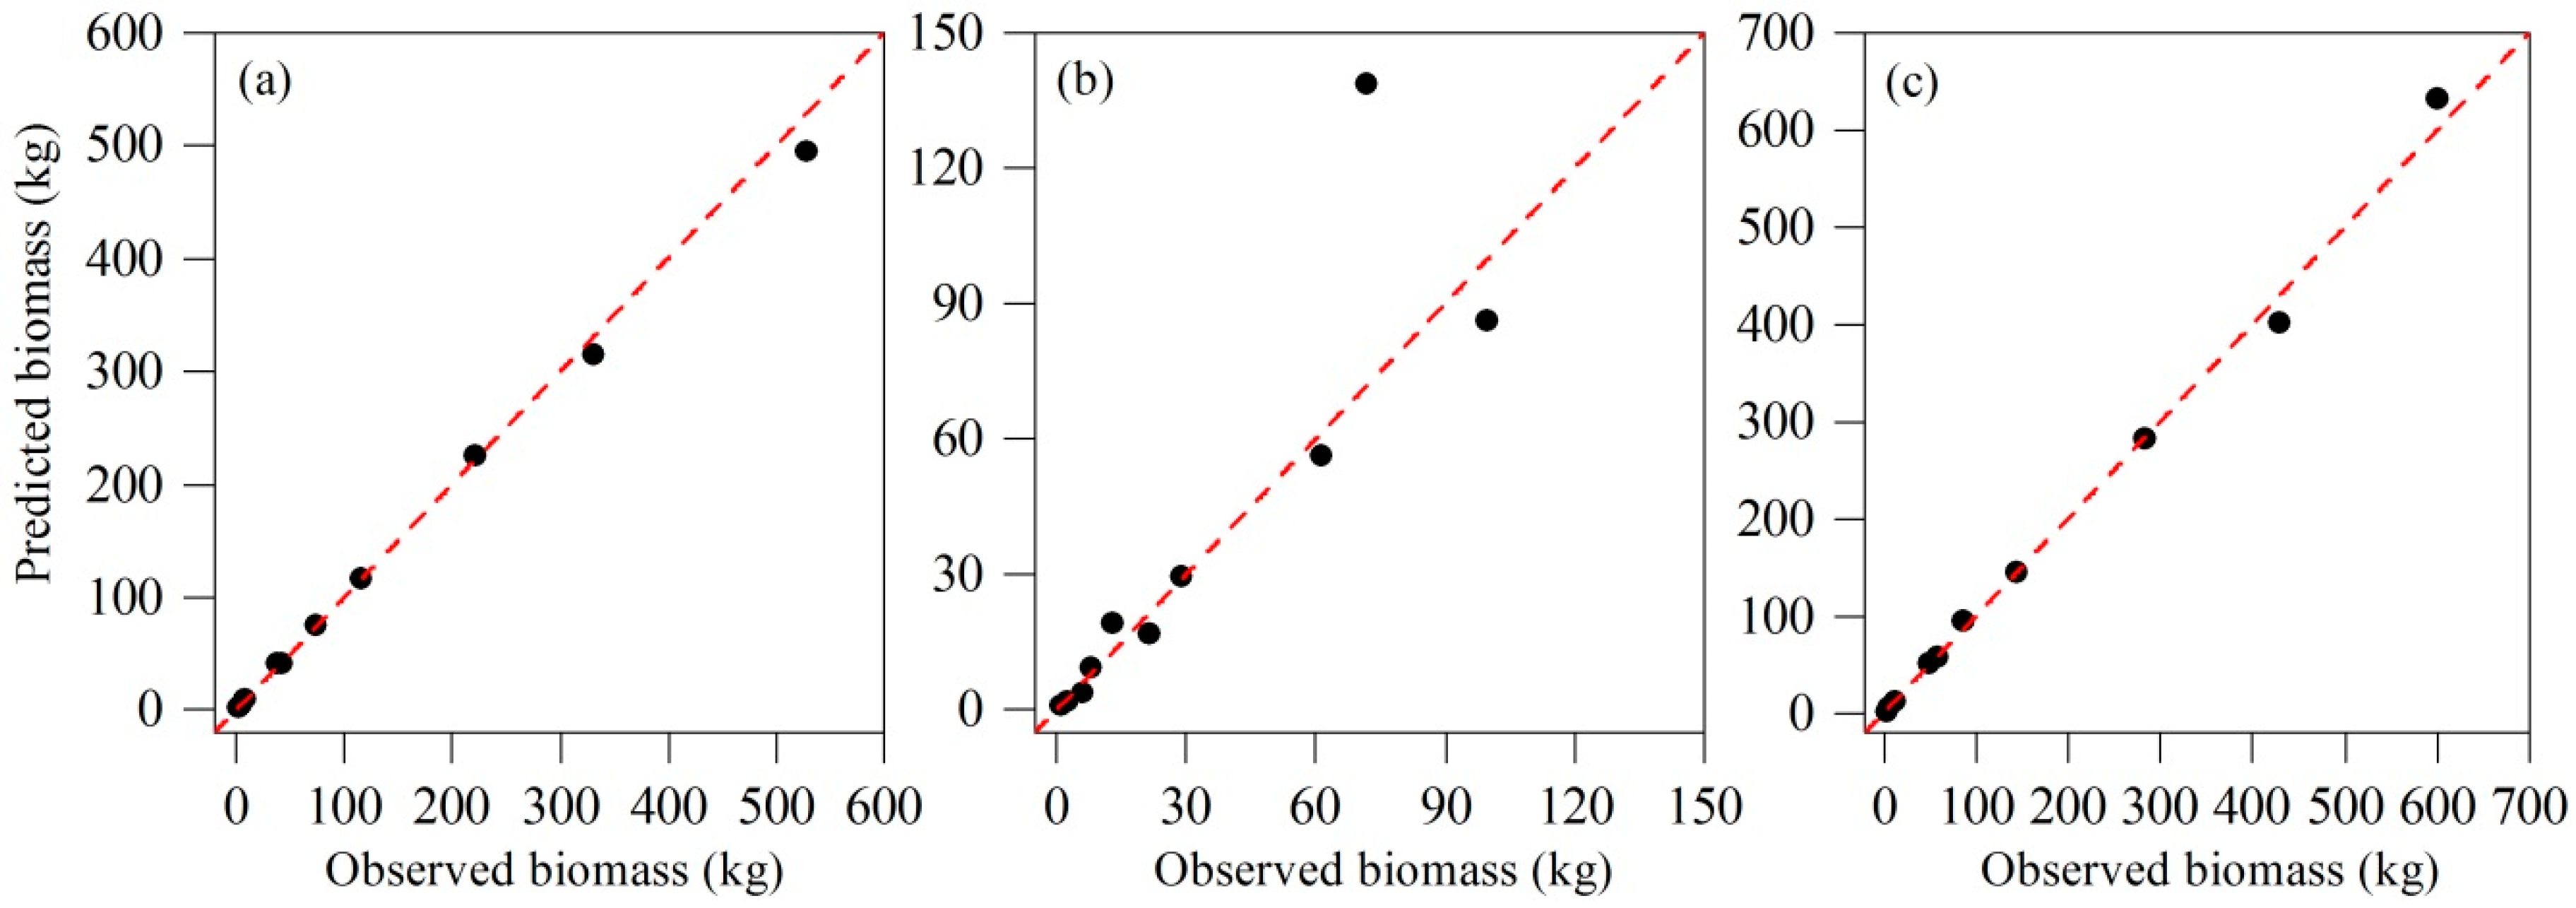
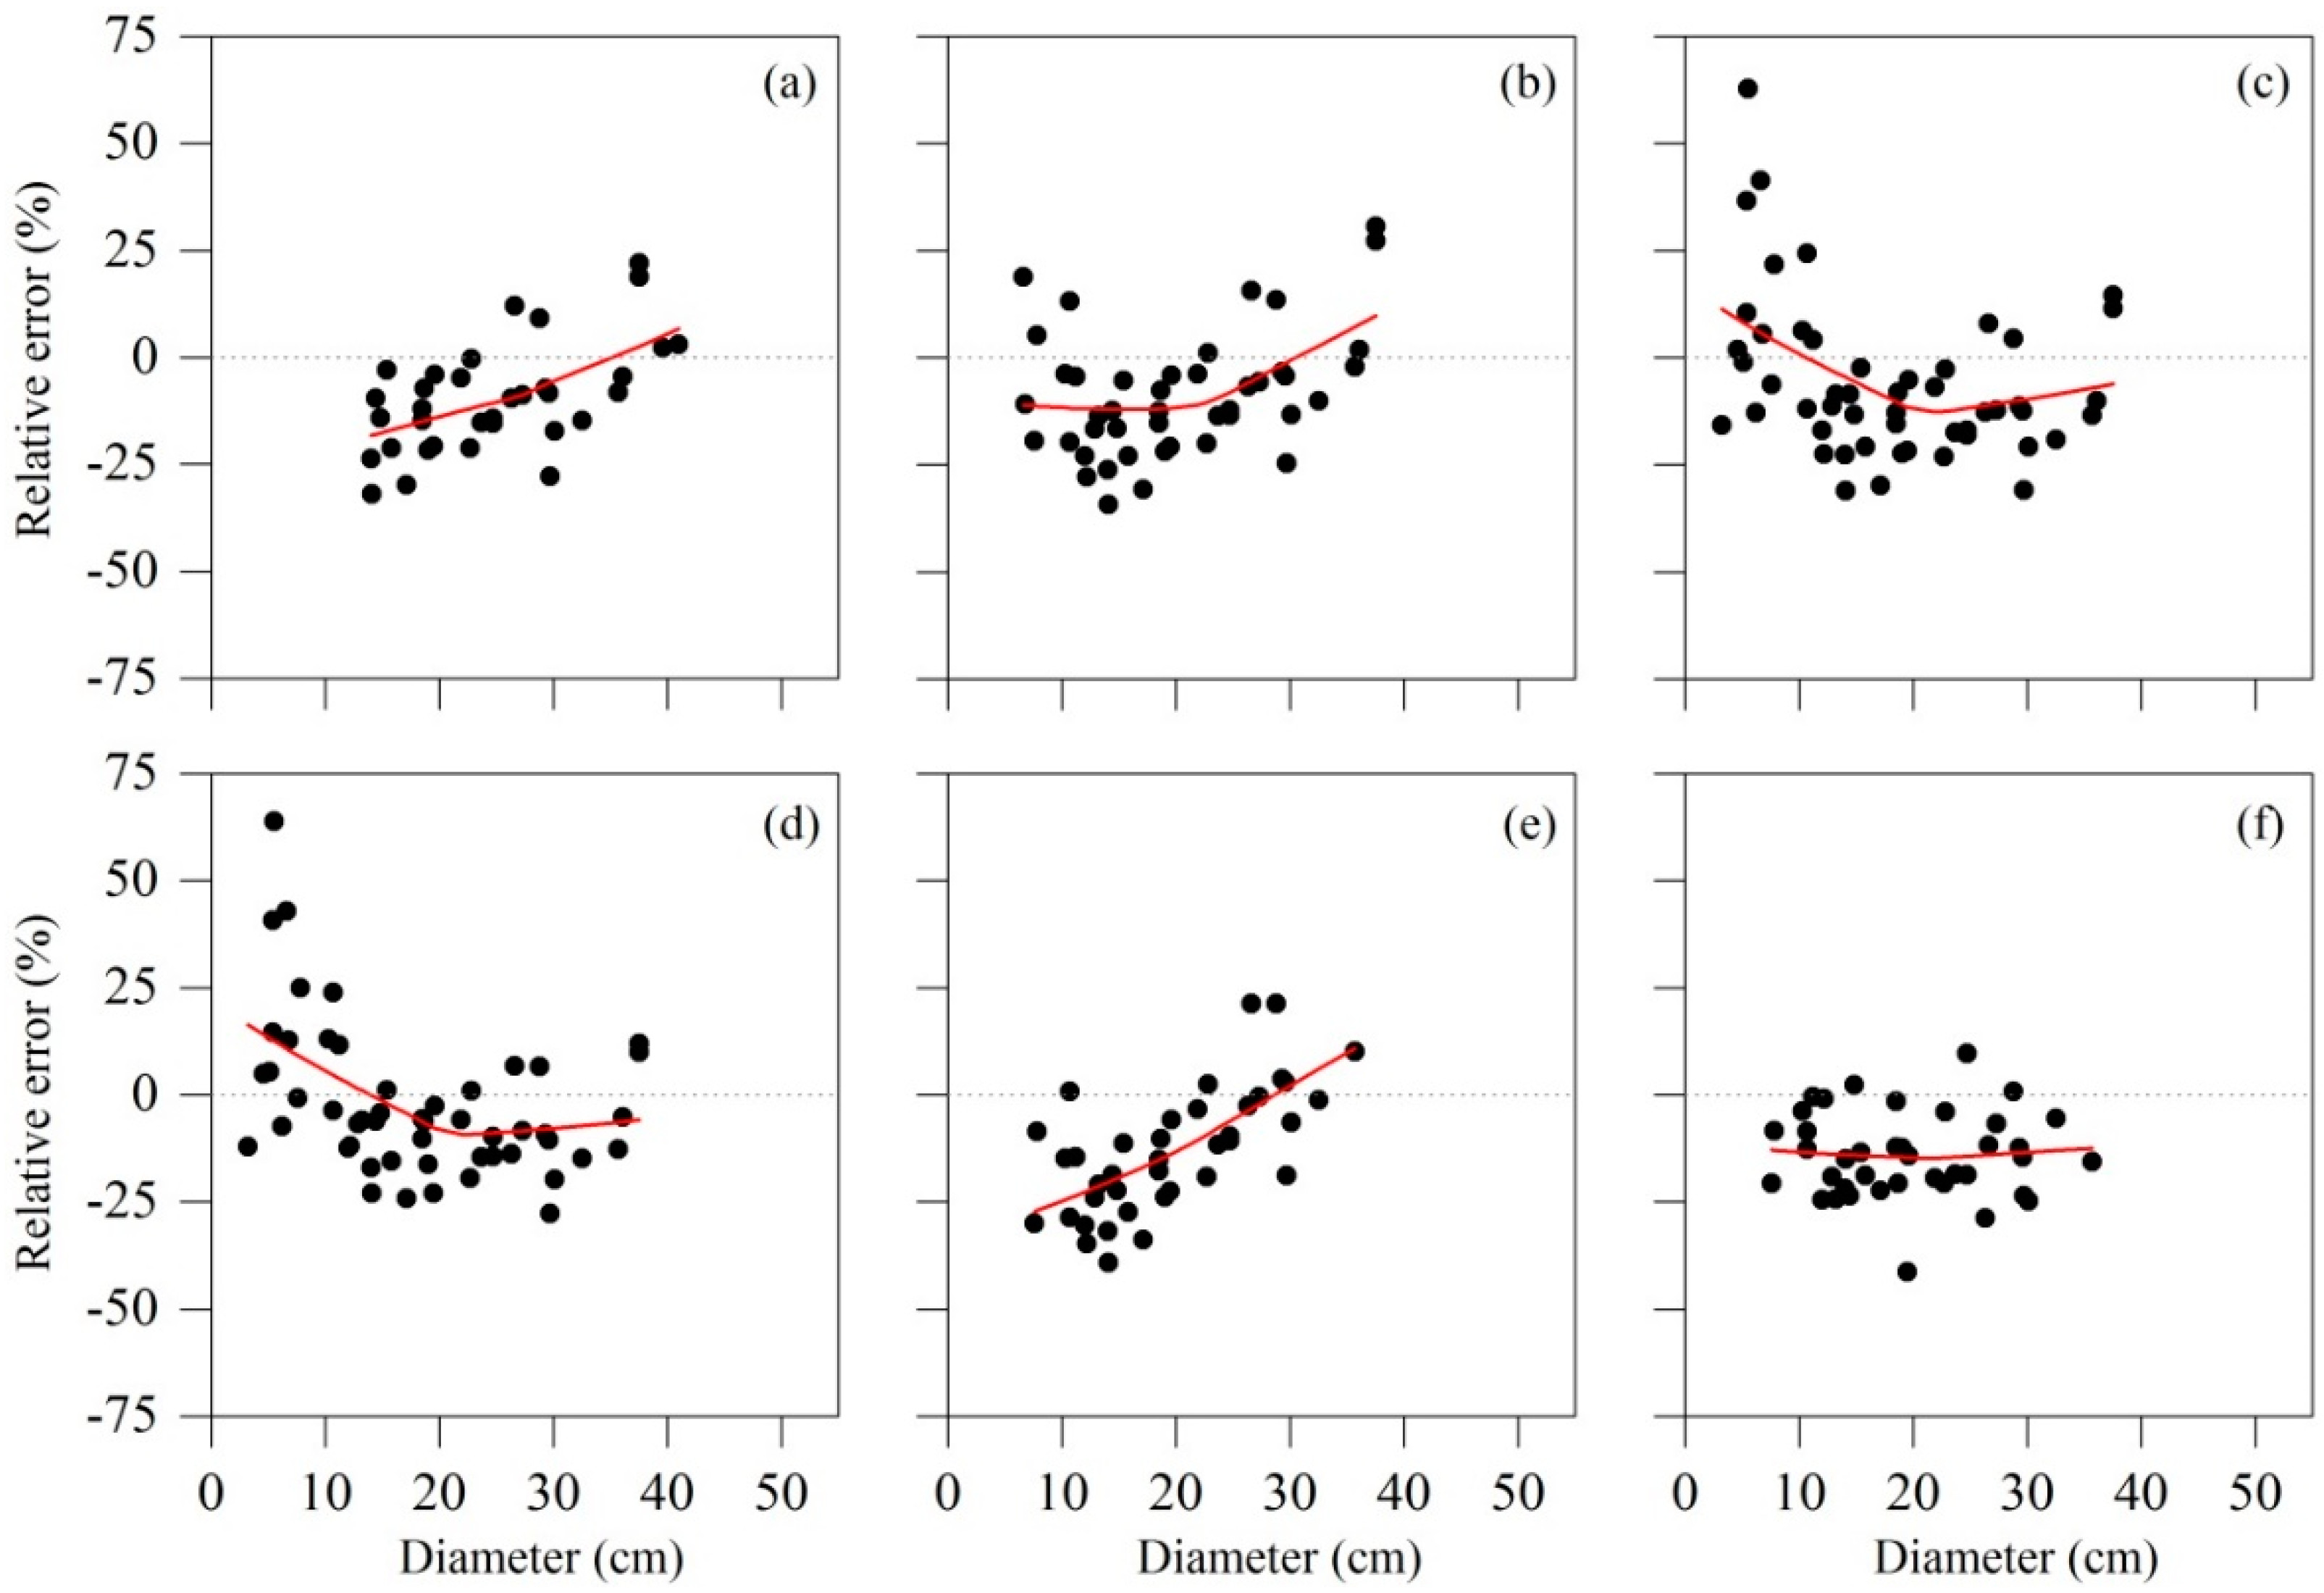
3.3. Model Validation for the Best Model System

The validity of the best system of log-transformed additive biomass equations was assessed against an independent dataset (Figure 5). Stem (wood plus bark) and total aboveground biomass equations produced small prediction errors (the scatters were close to the 1:1 line), whereas relatively larger errors were generated for the crown model, especially for the largest tree with a relatively small canopy (see Table 2). We found no significant differences between the predicted values and observed values of stem (t = 0.89, p-value = 0.40), crown (t = −0.70, p-value = 0.50), and aboveground (t = −0.36, p-value = 0.73) biomass.

4. Discussion

Accurate biomass models are key for estimating forest carbon stocks from forest inventories and provide comparable and verifiable information to policymakers and stakeholders [59,60].
The share of components on the aboveground biomass varies across species [61,62]. The results in this study showed that wood biomass had the largest contribution to aboveground biomass, and tree stem (wood plus bark) contributed for approximately 80%, whereas leaf represented the smallest portion, which is consistent with several published studies related to larch [50,63]. As the trees grow larger, the relative contribution of the stem and branch to the aboveground biomass increases, while that of leaf and bark decreases. This pattern is consistent with previously published studies showing that woody biomass usually accumulates at the expense of leaf biomass [62,64]. Allocating more resources to wood and branch as the size increases is aimed to promote height and crown growth to increase the competitiveness for light relative to neighbor trees. Leaf biomass proportion decreased with increasing dbh, which could be explained by the fact that leaves are grown on younger branches rather than on older ones, which imply that leaf mass per unit branch mass decreases as trees get larger [17].
There is general agreement that biomass additivity is a desirable characteristic when estimating tree components and total biomass through a system of equations [17,43,46], since it reduces uncertainties between the sum of the predictions for the tree components obtained from allometric equations and the prediction for the whole tree [42,44]. However, many biomass models in previous studies were non-additive as they were developed using ordinary least-squares regression [18,61]. The use of SUR improves biomass models by setting constraints on the regression coefficients during the fitting process, guaranteeing the additive property [65]. Furthermore, an additive system of biomass equations that takes into account the inherent correlation among the tree biomass components has higher statistical efficiency than separately fitted equations for individual biomass components, and reduces the confidence and prediction intervals for biomass estimates [41,43].
Dependent and independent variables were transformed by taking the natural logarithm since dendrometric measurements usually exhibit non-constant variance [61]. As expected, the log-transformed equation is simple and accurate for estimating biomass of aboveground and individual components. The relationships between components biomass and dendrometrics were highly significant. Tree dbh is the most prominent and commonly used predictor of biomass [31,66]. Some studies reported that the inclusion of h as an additional predictor significantly improved model fit [24,67]. In this study, the use of dbh alone as a predictor provided the best fit for branch and leaf models while including h as an additional predictor appeared to be the most suitable strategy for stem (wood plus bark) components, which is consistent with previous studies [38,68,69]. However, since dbh also provided satisfactory model fitting for wood and bark, if tree height is missing in some forest inventory data, then the additive system of biomass equations using dbh only should provide accurate predictions all the same.
The logarithmic CF is a simple and straightforward statistical tool for removing systematic bias produced by converting the estimated logarithmic value back to the original untransformed scale [33]. However, previous studies reported that the CF is usually small compared to the overall variation generated by biomass estimation and can, therefore, be omitted [34,70]. In the present study, the CF values for all components biomass equations were relatively small (<1.06), especially for wood, bark, and aboveground allometric equations (<1.02). Consequently, our results indicated that few errors were introduced when using logarithmic transformation to fit allometric equations to biomass data. Furthermore, if the CF was used, additivity among different biomass components would not occur.
Since the predictive ability of a model cannot be thoroughly reflected by fitting results, the use of a new independent dataset is the most preferred way to make an appropriate validation [71]. It must be pointed out that the new dataset is taken from a separate population, which is different from the model construction data [72]. However, in many studies, no independent dataset was available and alternative approaches were therefore commonly employed for this purpose, such as splitting the original dataset into two parts or the jackknifing technique [49,73], although, they do not provide any additional information about the authentic predictive ability [72]. Fortunately, we collected an independent dataset from a study and used it to validate the developed model in this study, yielding satisfactory predictive effects.
Other equations have been established for estimation of aboveground biomass of L. gmelinii in northeastern China (Table 3). Overall, the performance of independent models against observed data used in this study varied across different equations. Our study focused on the tree biomass in the western Daxing’anling Mountains, Inner Mongolia. However, only [51] collected some data here; others conducted their studies in Heilongjiang and Jilin Province. The six aboveground biomass models from previous studies all underestimated biomass, but four of them could keep the REs under −10%. Among all these models, the allometric equation developed by [51] performed better, and the best model had a RE less than −3% (Table 3, Figure 6c,d). The two biomass models developed by [50] produced a large error, both using a single predictor dbh and dbh plus h (Figure 6e,f). The biomass model developed by [18] also had a poor performance (Figure 6a), but it was calibrated on L. gmelinii plantations. The small sample sizes might also affect model performance [18]. In contrast, the biomass model developed by [49] was based on a relatively large number of samples, but was in Heilongjiang and Jilin Province, which could cause poor performance when evaluated in a different province (Figure 6b).
Since allometric relationships between biomass and dendrometric variables are not constant and can vary with forest type, size, and age, the use of the models outside their specific regions is not suggested [31,46]. Finally the reported equations were fitted on a relatively narrow dbh range, and larger prediction errors could be produced when applying these models to large trees outside of the modeling data range. Therefore, our site-specific biomass equations are more suitable for natural L. gmelinii forests dominated in the western Daxing’anling Mountains, Inner Mongolia.

5. Conclusions

L. gmelinii allocates more biomass in woody parts, especially in wood, possibly due to the mechanism that promotes individual competitiveness compared with other trees in the stand. Dbh alone is a good predictor for branch and leaf biomass estimation, while introducing h as an additional predictor can improve accuracies of wood and bark biomass models. SUR realizes the additivity property between tree components and total aboveground biomass. The antilog correction can be ignored due to the small CF values. Since the state government has established a comprehensive ban on harvesting natural forests, the allometric biomass models developed in this study can be readily and accurately applied to natural L. gmelinii forests in the western Daxing’anling mountains, primarily for carbon accounting purpose. The availability of different component biomass estimates can also provide references for formulating conservation strategies. The newly developed allometric models must be used with caution when estimating biomass of trees outside of their range of data and site conditions.

Author Contributions

Q.L. conceived and designed the experiments; S.M., Q.J., Q.L. and G.Z. performed the experiments; S.M. and J.Y. analyzed the data; H.W. contributed analysis tools; S.M. wrote the paper.

Funding

National hi-tech research and development plan: 2013AA122003.

Acknowledgments

The authors thank Meng Xiaoqing, Tao Lichao, Zhuang Huixia for their kind support in tree sampling and data collection. The local forestry bureau helped greatly with both logistics and personnel during fieldwork. This research was supported by National Hi-tech Research and Development Plan (2013AA122003).

Conflicts of Interest

The authors declare no conflict of interest.

References

  1. Wang, C.; Gower, S.T.; Wang, Y.; Zhao, H.; Yan, P.; Bond-Lamberty, B.P. The influence of fire on carbon distribution and net primary production of boreal Larix gmelinii forests in north-eastern China. Glob. Chang. Biol. 2001, 7, 719–730. [Google Scholar] [CrossRef]
  2. Gower, S.T.; Krankina, O.; Olson, R.J.; Apps, M.; Linder, S.; Wang, C. Net primary production and carbon allocation patterns of boreal forest ecosystems. Ecol. Appl. 2001, 11, 1395–1411. [Google Scholar] [CrossRef]
  3. Martin, J.L.; Gower, S.T.; Plaut, J.; Holmes, B. Carbon pools in a boreal mixedwood logging chronosequence. Glob. Chang. Biol. 2005, 11, 1883–1894. [Google Scholar] [CrossRef]
  4. Fang, J.; Chen, A.; Peng, C.; Zhao, S.; Ci, L. Changes in forest biomass carbon storage in China between 1949 and 1998. Science 2001, 292, 2320–2322. [Google Scholar] [CrossRef] [PubMed]
  5. Pacala, S.W.; Hurtt, G.C.; Baker, D.; Peylin, P.; Houghton, R.A.; Birdsey, R.A.; Heath, L.; Sundquist, E.T.; Stallard, R.F.; Ciais, P.; et al. Consistent land- and atmosphere-based U.S. carbon sink estimates. Science 2001, 292, 2316–2320. [Google Scholar] [CrossRef] [PubMed]
  6. Pan, Y.; Birdsey, R.A.; Fang, J.; Houghton, R.; Kauppi, P.E.; Kurz, W.A.; Phillips, O.L.; Shvidenko, A.; Lewis, S.L.; Canadell, J.G.; et al. A large and persistent carbon sink in the world’s forests. Science 2011, 333, 988–993. [Google Scholar] [CrossRef] [PubMed]
  7. Mugasha, W.A.; Eid, T.; Bollandsas, O.M.; Malimbwi, R.E.; Chamshama, S.A.O.; Zahabu, E.; Katani, J.Z. Allometric models for prediction of above- and belowground biomass of trees in the miombo woodlands of Tanzania. For. Ecol. Manag. 2013, 310, 87–101. [Google Scholar] [CrossRef]
  8. He, J.S. Carbon cycling of Chinese forests: From carbon storage, dynamics to models. Sci. China Life Sci. 2012, 55, 188–190. [Google Scholar] [CrossRef]
  9. Brown, S.L.; Schroeder, P.; Kern, J.S. Spatial distribution of biomass in forests of the eastern USA. For. Ecol. Manag. 1999, 123, 81–90. [Google Scholar] [CrossRef]
  10. Bayen, P.; Bognounou, F.; Lykke, A.M.; Ouedraogo, M.; Thiombiano, A. The use of biomass production and allometric models to estimate carbon sequestration of Jatropha curcas L. plantations in western Burkina Faso. Environ. Dev. Sustain. 2016, 18, 143–156. [Google Scholar] [CrossRef]
  11. Maccracken, J.G.; Ballenberghe, V.V. Mass-diameter regressions for moose browse on the Copper River Delta, Alaska. J. Range Manag. 1993, 46, 302–308. [Google Scholar] [CrossRef]
  12. Truax, B.; Gagnon, D.; Fortier, J.; Lambert, F. Biomass and volume yield in mature hybrid poplar plantations on temperate abandoned farmland. Forests 2014, 5, 3107–3130. [Google Scholar] [CrossRef]
  13. Kauppi, P.E.; Tomppo, E.; Ferm, A. C and N storage in living trees within Finland since 1950s. Plant Soil 1995, 168, 633–638. [Google Scholar] [CrossRef]
  14. Alongi, D.M.; Clough, B.F.; Dixon, P.; Tirendi, F. Nutrient partitioning and storage in arid-zone forests of the mangroves Rhizophora stylosa and Avicennia marina. Trees 2003, 17, 51–60. [Google Scholar] [CrossRef]
  15. Alvarez, E.; Duque, A.; Saldarriaga, J.; Cabrera, K.; Salas, G.D.; del Valle, I.; Lema, A.; Moreno, F.; Orrego, S.; Rodriguez, L. Tree above-ground biomass allometries for carbon stocks estimation in the natural forests of Colombia. For. Ecol. Manag. 2012, 267, 297–308. [Google Scholar] [CrossRef]
  16. Dong, L.; Zhang, L.; Li, F. Developing additive systems of biomass equations for nine hardwood species in Northeast China. Trees 2015, 29, 1149–1163. [Google Scholar] [CrossRef]
  17. Dimobe, K.; Mensah, S.; Goetze, D.; Ouédraogo, A.; Kuyah, S.; Porembski, S.; Thiombiano, A. Aboveground biomass partitioning and additive models for Combretum glutinosum and Terminalia laxiflora in West Africa. Biomass Bioenergy 2018, 115, 151–159. [Google Scholar] [CrossRef]
  18. Wang, C.K. Biomass allometric equations for 10 co-occurring tree species in Chinese temperate forests. For. Ecol. Manag. 2006, 222, 9–16. [Google Scholar] [CrossRef]
  19. Canga, E.; Dieguez-Aranda, I.; Afif-Khouri, E.; Camara-Obregon, A. Above-ground biomass equations for Pinus radiata D. Don in Asturias. For. Syst. 2013, 22, 408–415. [Google Scholar] [CrossRef]
  20. Mbow, C.; Verstraete, M.M.; Sambou, B.; Diaw, A.T.; Neufeldt, H. Allometric models for aboveground biomass in dry savanna trees of the Sudan and Sudan-Guinean ecosystems of Southern Senegal. J. For. Res. 2014, 19, 340–347. [Google Scholar] [CrossRef]
  21. Youkhana, A.H.; Ogoshi, R.M.; Kiniry, J.R.; Meki, M.N.; Nakahata, M.H.; Crow, S.E. Allometric models for predicting aboveground biomass and carbon stock of tropical perennial C4 grasses in Hawaii. Front. Plant Sci. 2017, 8. [Google Scholar] [CrossRef] [PubMed]
  22. Bi, H.Q.; Long, Y.; Turner, J.; Lei, Y.; Snowdon, P.; Li, Y.; Harper, R.; Zerihun, A.; Ximenes, F. Additive prediction of aboveground biomass for Pinus radiata (D. Don) plantations. For. Ecol. Manag. 2010, 259, 2301–2314. [Google Scholar] [CrossRef]
  23. MacFarlane, D.W. A generalized tree component biomass model derived from principles of variable allometry. For. Ecol. Manag. 2015, 354, 43–55. [Google Scholar] [CrossRef]
  24. Lima, A.J.N.; Suwa, R.; Ribeiro, G.H.P.M.; Kajimoto, T.; dos Santos, J.; da Silva, R.P.; de Souza, C.A.S.; de Barros, P.C.; Noguchi, H.; Ishizuka, M.; et al. Allometric models for estimating above- and below-ground biomass in Amazonian forests at Sao Gabriel da Cachoeira in the upper Rio Negro, Brazil. For. Ecol. Manag. 2012, 277, 163–172. [Google Scholar] [CrossRef]
  25. Muukkonen, P.; Makipaa, R. Biomass equations for European trees: Addendum. Silv. Fenn. 2006, 40, 763–773. [Google Scholar] [CrossRef]
  26. Ter-Mikaelian, M.T.; Korzukhin, M.D. Biomass equations for sixty-five North American tree species. For. Ecol. Manag. 1997, 97, 1–24. [Google Scholar] [CrossRef]
  27. Estrada, G.C.D.; Soares, M.L.G.; Santos, D.M.C.; Fernandez, V.; de Almeida, P.M.M.; Estevam, M.R.M.; Machado, M.R.O. Allometric models for aboveground biomass estimation of the mangrove Avicennia schaueriana. Hydrobiologia 2014, 734, 171–185. [Google Scholar] [CrossRef]
  28. Dickinson, Y.L.; Zenner, E.K. Allometric equations for the aboveground biomass of selected common eastern hardwood understory species. North J. Appl. For. 2010, 27, 160–165. [Google Scholar]
  29. Xiao, X.; White, E.P.; Hooten, M.B.; Durham, S.L. On the use of log-transformation vs. nonlinear regression for analyzing biological power laws. Ecology 2011, 92, 1887–1894. [Google Scholar] [CrossRef]
  30. Djomo, A.N.; Chimi, C.D. Tree allometric equations for estimation of above, below and total biomass in a tropical moist forest: Case study with application to remote sensing. For. Ecol. Manag. 2017, 391, 184–193. [Google Scholar] [CrossRef]
  31. Chave, J.; Andalo, C.; Brown, S.; Cairns, M.A.; Chambers, J.Q.; Eamus, D.; Folster, H.; Fromard, F.; Higuchi, N.; Kira, T.; et al. Tree allometry and improved estimation of carbon stocks and balance in tropical forests. Oecologia 2005, 145, 87–99. [Google Scholar] [CrossRef] [PubMed]
  32. Zianis, D.; Xanthopoulos, G.; Kalabokidis, K.; Kazakis, G.; Ghosn, D.; Roussou, O. Allometric equations for aboveground biomass estimation by size class for Pinus brutia Ten. trees growing in North and South Aegean Islands, Greece. Eur. J. For. Res. 2011, 130, 145–160. [Google Scholar] [CrossRef]
  33. Sprugel, D.G. Correcting for bias in log-transformed allometric equations. Ecology 1983, 64, 209–210. [Google Scholar] [CrossRef]
  34. Beauchamp, J.J.; Olson, J.S. Corrections for bias in regression estimates after logarithmic transformation. Ecology 1973, 54, 1403–1407. [Google Scholar] [CrossRef]
  35. Yandle, D.O.; Wiant, H.V., Jr. Estimation of plant biomass based on the allometric equation. Can. J. For. Res. 2011, 11, 833–834. [Google Scholar] [CrossRef]
  36. Clifford, D.; Cressie, N.; England, J.R.; Roxburgh, S.H.; Paul, K.I. Correction factors for unbiased, efficient estimation and prediction of biomass from log-log allometric models. For. Ecol. Manag. 2013, 310, 375–381. [Google Scholar] [CrossRef]
  37. Komiyama, A.; Poungparn, S.; Kato, S. Common allometric equations for estimating the tree weight of mangroves. J. Trop. Ecol. 2005, 21, 471–477. [Google Scholar] [CrossRef]
  38. Lambert, M.C.; Ung, C.H.; Raulier, F. Canadian national tree aboveground biomass equations. Can. J. For. Res. 2005, 35, 1996–2018. [Google Scholar] [CrossRef]
  39. Kuyah, S.; Sileshi, G.W.; Rosenstock, T.S. Allometric models based on bayesian frameworks give better estimates of aboveground biomass in the miombo woodlands. Forests 2016, 7, 13. [Google Scholar] [CrossRef]
  40. Xu, Y.; Zhang, J.; Franklin, S.B.; Liang, J.; Ding, P.; Luo, Y.; Lu, Z.; Bao, D.; Jiang, M. Improving allometry models to estimate the above- and belowground biomass of subtropical forest, China. Ecosphere 2015, 6. [Google Scholar] [CrossRef]
  41. Parresol, B.R. Assessing tree and stand biomass: A review with examples and critical comparisons. For. Sci. 1999, 45, 573–593. [Google Scholar]
  42. Kozak, A. Methods for ensuring additivity of biomass components by regression analysis. For. Chron. 1970, 46, 402–405. [Google Scholar] [CrossRef]
  43. Parresol, B.R. Additivity of nonlinear biomass equations. Can. J. For. Res. 2001, 31, 865–878. [Google Scholar] [CrossRef]
  44. Bi, H.Q.; Turner, J.; Lambert, M.J. Additive biomass equations for native eucalypt forest trees of temperate Australia. Trees 2004, 18, 467–479. [Google Scholar] [CrossRef]
  45. Tang, S.; Zhang, H.; Xu, H. Study on establish and estimate method of compatible biomass model. Sci. Silvae. Sin. 1999, 36, 19–27. [Google Scholar]
  46. Riofrio, J.; Herrero, C.; Grijalva, J.; Bravo, F. Aboveground tree additive biomass models in Ecuadorian highland agroforestry systems. Biomass Bioenergy 2015, 80, 252–259. [Google Scholar] [CrossRef]
  47. Carvalho, J.P.; Parresol, B.R. Additivity in tree biomass components of Pyrenean oak (Quercus pyrenaica Willd.). For. Ecol. Manag. 2003, 179, 269–276. [Google Scholar] [CrossRef]
  48. Menendez-Miguelez, M.; Canga, E.; Barrio-Anta, M.; Majada, J.; AlvarezAlvarez, P. A three level system for estimating the biomass of Castanea sativa Mill. coppice stands in north-west Spain. For. Ecol. Manag. 2013, 291, 417–426. [Google Scholar] [CrossRef]
  49. Dong, L.; Zhang, L.; Li, F. A compatible system of biomass equations for three conifer species in Northeast, China. For. Ecol. Manag. 2014, 329, 306–317. [Google Scholar] [CrossRef]
  50. Dong, L.; Zhang, L.; Li, F. Developing two additive biomass equations for three coniferous plantation species in northeast China. Forests 2016, 7, 136. [Google Scholar] [CrossRef]
  51. Zeng, W.S. Integrated individual tree biomass simultaneous equations for two larch species in northeastern and northern China. Scand. J. For. Res. 2015, 30, 594–604. [Google Scholar] [CrossRef]
  52. Liu, Q.J. Nested regression for establishing tree biomass equations. Chin. J. Plant Ecol. 2009, 33, 331–337. [Google Scholar]
  53. Jia, Q.Q.; Liu, Q.J.; Li, J.Q. Individual-based fine root biomass and its functional relationship with leaf for Pinus tabuliformis in northern China. Eur. J. For. Res. 2015, 134, 705–714. [Google Scholar] [CrossRef]
  54. Chen, A.F.; Li, R.Y.; Wang, H.L.; He, B. Quantitative assessment of human appropriation of aboveground net primary production in China. Ecol. Model. 2015, 312, 54–60. [Google Scholar] [CrossRef]
  55. Kajimoto, T. Aboveground net production and dry matter allocation of Pinus pumila forests in the Kiso mountain range, central Japan. Ecol. Res. 1994, 9, 193–204. [Google Scholar] [CrossRef]
  56. Mensah, S.; Veldtman, R.; Seifert, T. Allometric models for height and aboveground biomass of dominant tree species in South African Mistbelt forests. South. For. 2016, 79, 19–30. [Google Scholar] [CrossRef]
  57. Dong, L.; Zhang, L.; Li, F. Additive biomass equations based on different dendrometric variables for two dominant species (Larix gmelini Rupr. and Betula platyphylla Suk.) in natural forests in the eastern Daxing’an Mountains, Northeast China. Forests 2018, 9, 261. [Google Scholar] [CrossRef]
  58. Liu, J.G.; Liu, R.P. The primary research for the biomass of Larix gmelinii in Daxing’anling forest region. Inn. Mong. For. Investig. Des. 2015, 38, 17–18. [Google Scholar]
  59. Moore, J.R. Allometric equations to predict the total above-ground biomass of radiata pine trees. Ann. For. Sci. 2010, 67, 806. [Google Scholar] [CrossRef]
  60. Risio, L.; Herrero, C.; Bogino, S.M.; Bravo, F. Aboveground and belowground biomass allocation in native Prosopis caldenia Burkart secondaries woodlands in the semi-arid Argentinean pampas. Biomass Bioenergy 2014, 66, 249–260. [Google Scholar] [CrossRef]
  61. Blujdea, V.N.B.; Pilli, R.; Dutca, I.; Ciuvat, L.; Abrudan, I.V. Allometric biomass equations for young broadleaved trees in plantations in Romania. For. Ecol. Manag. 2012, 264, 172–184. [Google Scholar] [CrossRef]
  62. Mensah, S.; Kakaï, R.G.; Seifert, T. Patterns of biomass allocation between foliage and woody structure: The effects of tree size and specific functional traits. Ann. For. Res. 2016, 59, 1–12. [Google Scholar] [CrossRef]
  63. Jomura, M.; Wang, W.J.; Masyagina, O.V.; Homma, S.; Kanazawa, Y.; Zu, Y.G.; Koike, T. Permafrost Ecosystems; Springer: Dordrecht, The Netherlands, 2009; pp. 385–411. [Google Scholar]
  64. Pajtik, J.; Konopka, B.; Lukac, M. Individual biomass factors for beech, oak and pine in Slovakia: A comparative study in young naturally regenerated stands. Trees 2011, 25, 277–288. [Google Scholar] [CrossRef]
  65. Huff, S.; Ritchie, M.; Temesgen, H. Allometric equations for estimating aboveground biomass for common shrubs in northeastern California. For. Ecol. Manag. 2017, 398, 48–63. [Google Scholar] [CrossRef]
  66. Kalita, R.M.; Das, A.K.; Nath, A.J. Allometric equations for estimating above-and belowground biomass in Tea (Camellia sinensis (L.) O. Kuntze) agroforestry system of Barak Valley, Assam, northeast India. Biomass Bioenergy 2015, 83, 42–49. [Google Scholar] [CrossRef]
  67. Antonio, N.; Tome, M.; Tome, J.; Soares, P.; Fontes, L. Effect of tree, stand, and site variables on the allometry of Eucalyptus globulus tree biomass. Can. J. For. Res. 2007, 37, 895–906. [Google Scholar] [CrossRef]
  68. Wagner, R.G.; Ter-Mikaelian, M.T. Comparison of biomass component equations for four species of northern coniferous tree seedlings. Ann. For. Sci. 1999, 56, 193–199. [Google Scholar] [CrossRef]
  69. Xiang, W.; Zhou, J.; Ouyang, S.; Zhang, S.; Lei, P.; Li, J.; Deng, X.; Fang, X.; Forrester, D.I. Species-specific and general allometric equations for estimating tree biomass components of subtropical forests in southern China. Eur. J. For. Res. 2016, 135, 963–979. [Google Scholar] [CrossRef]
  70. Madgwick, H.A.I.; Satoo, T. On estimating the aboveground weights of tree stands. Ecology 1975, 56, 1446–1450. [Google Scholar] [CrossRef]
  71. Gonzalez-Garcia, M.; Hevia, A.; Majada, J.; Barrio-Anta, M. Above-ground biomass estimation at tree and stand level for short rotation plantations of Eucalyptus nitens (Deane & Maiden) Maiden in Northwest Spain. Biomass Bioenergy 2013, 54, 147–157. [Google Scholar]
  72. Kozak, A.; Kozak, R. Does cross validation provide additional information in the evaluation of regression models? Can. J. For. Res. 2003, 33, 976–987. [Google Scholar] [CrossRef]
  73. Quint, T.C.; Dech, J.P. Allometric models for predicting the aboveground biomass of Canada yew (Taxus canadensis Marsh.) from visual and digital cover estimates. Can. J. For. Res. 2010, 40, 2003–2014. [Google Scholar] [CrossRef]
Figure 1. The location of the study area and sampling sites in the western Daxing’anling Mountains, northeastern China.
Forests 10 00150 g001
Figure 2. Tree h against dbh for destructively sampled trees. The vertical bars represent the sample frequency across 2-cm diameter classes.
Forests 10 00150 g002
Figure 3. The fraction of aboveground biomass allocated in wood (a), bark (b), branch (c), and leaf (d) varied with dbh. Red solid lines are lowess smoothers.
Forests 10 00150 g003
Figure 4. The relationship between wood, bark, branch, and leaf biomass and dbh and h for sampled trees.
Forests 10 00150 g004
Figure 5. Scatterplots of the observed (x-axis) and the predicted (y-axis) values for the stem (wood plus bark) (a), crown (b) and aboveground (c) biomass of the selected additive systems of biomass equations. The dashed line in red color indicates the 1:1 equivalence.
Forests 10 00150 g005
Figure 6. Relative error in the prediction of total aboveground biomass versus dbh for trees with dbh belongs to the model application range measured in this study. Predictions errors were calculated for the six models displayed in Table 3: (a) equation by Wang [18], (b) equation by Dong et al. [49], (c) equation by Zeng [51] using only dbh as predictor, (d) equation by Zeng [51] using both dbh and h as predictor, (e) equation by Dong et al. [50] using only dbh as predictor, (f) equation by Dong et al. [50] using both dbh and h as predictor. Red solid lines are smoothed errors using a lowess method.
Forests 10 00150 g006
Table 1. Descriptive statistics of sampled trees for biomass equations development.
StatisticsMeanMinMaxSD
dbh (cm)21.53.252.012.98
h (m)16.964.9127.726.35
Basic density of branch (g/cm3)0.4560.3950.5150.049
Basic density of wood (g/cm3)0.4980.3930.5130.033
Basic density of stem bark (g/cm3)0.3720.3460.3890.012
average mass per leaf fascicle (g)0.02100.01630.02410.0027
average area per needle (cm2)0.1340.0660.1840.032
average mass per short shoot (g)0.00600.00350.00750.0021
Stem biomass (kg)189.950.73896.66228.98
Bark biomass (kg)44.470.47195.4049.33
Branch biomass (kg)40.430.15317.7163.11
Leaf biomass (kg)21.780.63108.4723.02
Aboveground biomass (kg)296.632.211360.47357.44
Min: minimum; Max: maximum; SD: standard deviation.
Table 2. Observed biomass data for model validation gathered from [58].
Biomass (kg)
dbh (cm)h (m)StemCrownAboveground
4.04.501.411.062.47
6.06.233.342.475.81
8.07.007.165.9613.12
12.015.7541.668.0749.73
15.69.0036.9821.5458.52
16.415.3073.5413.1786.71
19.816.45115.6828.93144.61
26.019.00221.4961.42282.91
31.218.70330.4999.74430.23
38.020.00527.7371.57599.30
Table 3. Comparison of some existing biomass equations for L. gmelinii distributed in northeastern China.
SourceSiteOrigindbh Range (cm)Sample SizePredictorRE (%)
This studyIMNatural3.2–52.058
Wang [18]HLJPlantation13.7–41.410dbh−9.46
Dong et al. [49]HLJ, JLNatural6.5–38.1122dbh−8.56
Zeng [51]HLJ, LN, IMNatural, plantation2.0–38.850dbh−5.84
dbh, h−2.07
Dong et al. [50]HLJPlantation7.6–35.790dbh−13.04
dbh, h−14.19
IM: Inner Mongolia autonomous region; HLJ: Heilongjiang Province; JL: Jilin Province; LN: Liaoning Province.
Table 4. Coefficients with standard error (SE) and goodness-of-fit statistics of the two systems of additive equations for the wood, bark, branch, and leaf components of the studied species through SUR methodology. α and β are model coefficients, while RMSE, MAE, and Adj.R2 are the root mean square error, mean absolute error, and adjusted coefficient of determination.
ModelPredictorComponentRegression CoefficientsFitting Statistics
lnα(SE)β(SE)RMSEMAEAdj.R2
4dbhWood−3.374 *** (0.099)2.644 *** (0.034)0.2080.1670.987
5dbh2 × hWood−4.262 *** (0.075)1.000 *** (0.009)0.1300.1040.995
4dbhBark−3.302 *** (0.105)2.188 *** (0.036)0.1970.1640.984
5dbh2 × hBark−4.031 *** (0.086)0.827 *** (0.010)0.1470.1170.991
4dbhBranch−4.770 *** (0.156)2.585 *** (0.053)0.3340.2440.968
5dbh2 × hBranch−5.623 *** (0.186)0.975 *** (0.022)0.3730.2870.960
4dbhLeaf−3.025 *** (0.141)1.819 *** (0.048)0.2730.2120.958
5dbh2 × hLeaf−3.611 *** (0.163)0.683 *** (0.019)0.2960.2350.950
*** Significance level: p < 0.001; The final selected models for each component are given in bold.
Table 5. Selected biomass equations simultaneously fitted through SUR methodology. CF is the correction factor.
ComponentBiomass EquationsRMSEMAEAdj.R2CF
WoodlnWwd = −4.270 + 1.001ln(dbh2 × h)0.1300.1040.9951.008
BarklnWbk = −4.016 + 0.825ln(dbh2 × h)0.1470.1170.9911.011
BranchlnWbr = −4.832 + 2.601ln(dbh)0.3310.2430.9691.056
LeaflnWlf = −3.080 + 1.833ln(dbh)0.2720.2110.9581.038
CrownlnWcw = ln(e−4.832dbh2.601 + e−3.080dbh1.833)0.2970.2210.9681.045
AbovegroundlnWag = ln(e−4.270(dbh2 × h)1.001 + e–4.016(dbh2 × h)0.825 + e−4.832dbh2.601 + e−3.080dbh1.833)0.1290.1010.9951.008

