Article

Where Did You Come From? Where Did You Go? Investigating the Origin of Invasive Leptocybe Species Using Distribution Modelling

by
Beryn A. Otieno
1,2,
Helen F. Nahrung
3 and
Martin J. Steinbauer
1,*
1
Department of Ecology, Environment and Evolution, La Trobe University, Melbourne, Victoria 3086, Australia
2
Kenya Forestry Research Institute, Nairobi, Kenya
3
Forest Industries Research Centre, University of the Sunshine Coast, Queensland 4558, Australia
*
Author to whom correspondence should be addressed.
Forests 2019, 10(2), 115; https://doi.org/10.3390/f10020115
Submission received: 12 December 2018 / Revised: 30 January 2019 / Accepted: 30 January 2019 / Published: 1 February 2019
(This article belongs to the Special Issue Exotic Forest Pest and Pathogen Risks)

Abstract

:
Research Highlights: We present the first attempts to model the distributions of the two cryptic and globally invasive species of Leptocybe invasa sensu lato (Fisher & LaSalle) (Hymenoptera: Eulophidae) in its purported country of origin, namely Australia. Background and Objectives: Leptocybe invasa is an invasive eucalypt-galling wasp that spread quickly all over the world in the early to mid-2000’s, achieving significant pest status through its severe impacts on the growth and productivity of extra-limital eucalypt plantations. Until its discovery in Europe and the Middle East, the genus was undescribed, and its native range remains unclear. Molecular studies indicate the globally invasive population comprises two cryptic species with variable modes of reproduction. Collection records from Australia, the purported origin, represent only one of the invasive lineages, restricted to subtropical and tropical Queensland and northern New South Wales. To date, the original invasive lineage has not been found in Australia, despite searches over the seventeen years that it has been spreading overseas. Materials and Methods: To understand the distributions of the invasive populations, and to infer Leptocybe spp. native ranges within Australia, we used correlative niche modelling in Maximum Entropy (MaxEnt) and multivariate analysis, and created a CLIMEX model based on development rates of an invasive population. Results: We used the environmental conditions in the extra-limital range to infer possible origins, with our findings supporting the possibility that the invasive populations may have originated from different populations in Australia. Conclusions: We highlight the need for better understanding of the distribution, genetic diversity, and reproductive mode of the species within Australia. The variety of climatic niches occupied by invasive lineages of the wasp potentially present new threats to eucalypts in previously uninfested habitats.

1. Introduction

Know from whence you came. If you know whence you came, there are absolutely no limitations to where you can go.”
—James Baldwin
Eucalypts are cultivated worldwide for their fast growth and suitability for a range of uses. The high diversity of Eucalyptus species within Australia is associated with an immense diversity of insect herbivores, some of which can be very damaging when their abundance is unusually high [1,2,3,4,5,6,7]. Some of these insects have become invasive pests of eucalypts where they are grown as exotic species, and are of particular concern to hardwood plantations globally [8,9,10,11,12].
In the early 2000s, an invasive gall wasp previously unknown to science was discovered on eucalypts in the Middle East and Europe. The wasp, known only from females, was described into a novel monotypic genus as Leptocybe invasa [13], by which time it had already spread to Asia and Africa [14,15]. It is believed to have originated in Australia [13], a supposition supported by its close phylogenetic relationship with endemic Australasian species [16], and because the only eucalypt-gall-inducing Chalcidoidea are endemic to Australia [17], and based on scenario modelling of populations [18]. Although it was initially reported from south-eastern and northern Queensland during searches for potential biocontrol agents [19], molecular studies [18] were unable to match any Australian Leptocybe specimens to L. invasa.
The invasive populations were shown to comprise two cryptic species {named “Western” (the lineage to which L. invasa belongs) and “Asian” (the novel lineage) in Nugnes et al. [14] and “Lineage A” and “Lineage B” in Dittrich-Schröder et al. [18], respectively}. None of several extensive collections, ranging from North Queensland to northern New South Wales, including those from which successful biocontrol agents of L. invasa were sourced [19,20], were L. invasa [18,21]. A third lineage (“C”) was reported from one site in Australia, but all other Australian populations reared from L. invasa-type galls [21] were identified as belonging to “Asian/Lineage B” [18]. The geographic origin, host range, endemic natural enemies and geographic range of L. invasa sensu stricto thus remain unknown. Additionally, the identification of two cryptic invasive Leptocybe spp. suggests that studies reporting on L. invasa conducted in regions where both occur in sympatry may have unknowingly used the second species or a mixture of both. The abundance of hosts, parthenogenetic reproduction and a lag in mortality from natural enemies might have contributed to the fast spread of L. invasa around the world [22], although it is now well-controlled by the parasitoid wasp Quadrastichus mendeli in several countries [15].
Of the many environmental factors influencing the distribution of living organisms, the altitude of occurrence of the host plant has been reported to restrict the occurrence of L. invasa galls in East Africa [23,24] and Turkey [25]. The influence of altitude is presumably mediated through effects on ambient temperature which can impact insects indirectly by altering biotic interactions or directly by modifying their metabolism, development time and ultimately their phenology [26,27]. Insects can survive low temperatures through freezing avoidance or thermal tolerance [28,29]; with supercooling ability [30,31], rapid cold hardening [32] and overwintering [33] all reported in L. invasa. Nevertheless, while low temperature is regarded as one of the most important factors influencing invasion and colonization by L. invasa [32] it is not known how temperature extremes impact its distribution.
Species-distribution modelling is often used to predict the potential invasive range of organisms where the native range is known [34], to predict pest distributions, biocontrol agent suitability, and assess exotic-endemic species interactions [35]. However, “reverse modelling” to determine the native range of species based on an established invasive range is less common. To infer the possible origins of overseas populations of L. invasa in Australia and the environmental variables which may delimit invasions, we used MaxEnt (Maximum Entropy) and CLIMEX modelling approaches, using environmental conditions in the invaded range, and developmental thresholds calculated in invasive range populations, respectively. We test the suggestion arising from genetic modelling that the two invasive lineages of the wasps originated from different locations in Australia [18] and compare results from the two distribution models. Identifying the geographic origin of L. invasa sensu stricto will aid in the search for biological control agents [15] and in understanding its invasion processes.

2. Materials and Methods

2.1. MaxEnt Modelling

Species occurrence data were obtained from a variety of sources. The distribution of L. invasa in invaded ecosystems was compiled from publications with georeferenced collection locations. Requests were sent to authors of non-georeferenced publications for the geographical locations of insect occurrence. Other collection records were obtained from the Centre for Agriculture and Bioscience International (CABI) Invasive Species Compendium (https://www.cabi.org/isc; last accessed 18 December 2017). We created databases separating the collection records into different populations based on the genetic groupings as described by [14,18]. The databases included Lineage A which comprises African, South American and Mediterranean-region populations, Lineage B (invasive) which included populations in Asia, and Lineage B (endemic) from Australian collections {Table S1 in Supplementary Material; for current distribution maps see [15,18]}. Since South Africa has a mixture of Lineages A and B but knowledge of their respective geographical distributions was unavailable, these records were omitted from the African database. Both lineages likewise co-occur in Thailand, Vietnam and Laos [18], but these countries represented less than 12% of our Asian records {with over half from China, where only Lineage B has been recorded [14]}, so all Asian records were treated as Lineage B. Environmental variables characterising climatic factors including precipitation, temperature, moisture index and radiation (Table S2), at 10-minute spatial resolution, were obtained from the CliMond dataset [36]. The 35 variables used represent climate in the period 1950–2000.

2.2. Niche Modelling

We carried out correlative niche modelling [37] using multivariate analysis and MaxEnt because our records were ‘presence only’ data [38]. MaxEnt estimates the probability of occurrence based on the suitability of environmental parameters [39] and has predictive power even with small datasets [40,41]. Indices of habitat suitability were predicted for each population using MaxEnt desktop version 3.3.3 k (http://biodiversityinformatics.amnh.org/open_source/maxent/) [38]. The environmental factors themselves that generated these models were compared for different populations. Since the climatic range of Eucalyptus does not extend to the polar region [42,43], our modelling excluded these regions. Background sampling was restricted by the rectangular extent of collection records [39,44,45,46]. Because MaxEnt is capable of selecting the appropriate feature for the number of samples used for a model [39,46], we used default features and default regularization parameters. After determining that some databases were expansive and included regions across several continents, we split them into regional population groups which improved the area under the curve (AUC).
The distributions of the known lineages in different regions was considered in the resulting prediction maps and the projected suitability to Australian climatic conditions compared to that of the Australian collection localities. The models were evaluated by observing the AUC of the receiver operating characteristic plot of the predictions.

2.3. Testing for Niche Shifts

To infer whether niche shifts might have occurred, environmental data corresponding to each collection location were extracted in ArcMap from Bioclim variables and used in Multivariate analysis. Principal components analysis (PCA) was used to project the distribution of the collection records under reduced dimensions [47,48]. Canonical variates analysis was carried out in Genstat to visualise grouping patterns of occurrence records [49]. Populations were grouped according to lineage. Groupings were tested by bootstrapping and observing reallocation errors and Mahalanobis distances in stepwise discriminant analysis.

2.4. Effects of Environmental Factors

To evaluate the contribution of the climatic variables to the MaxEnt models, a jack-knife test was used. Wilk’s lambda (λ) criterion in stepwise discriminant analysis was used to evaluate the importance of climatic variables in the distribution of the collection locations. The error of reallocation of data points to groupings was also considered.

2.5. CLIMEX Modelling
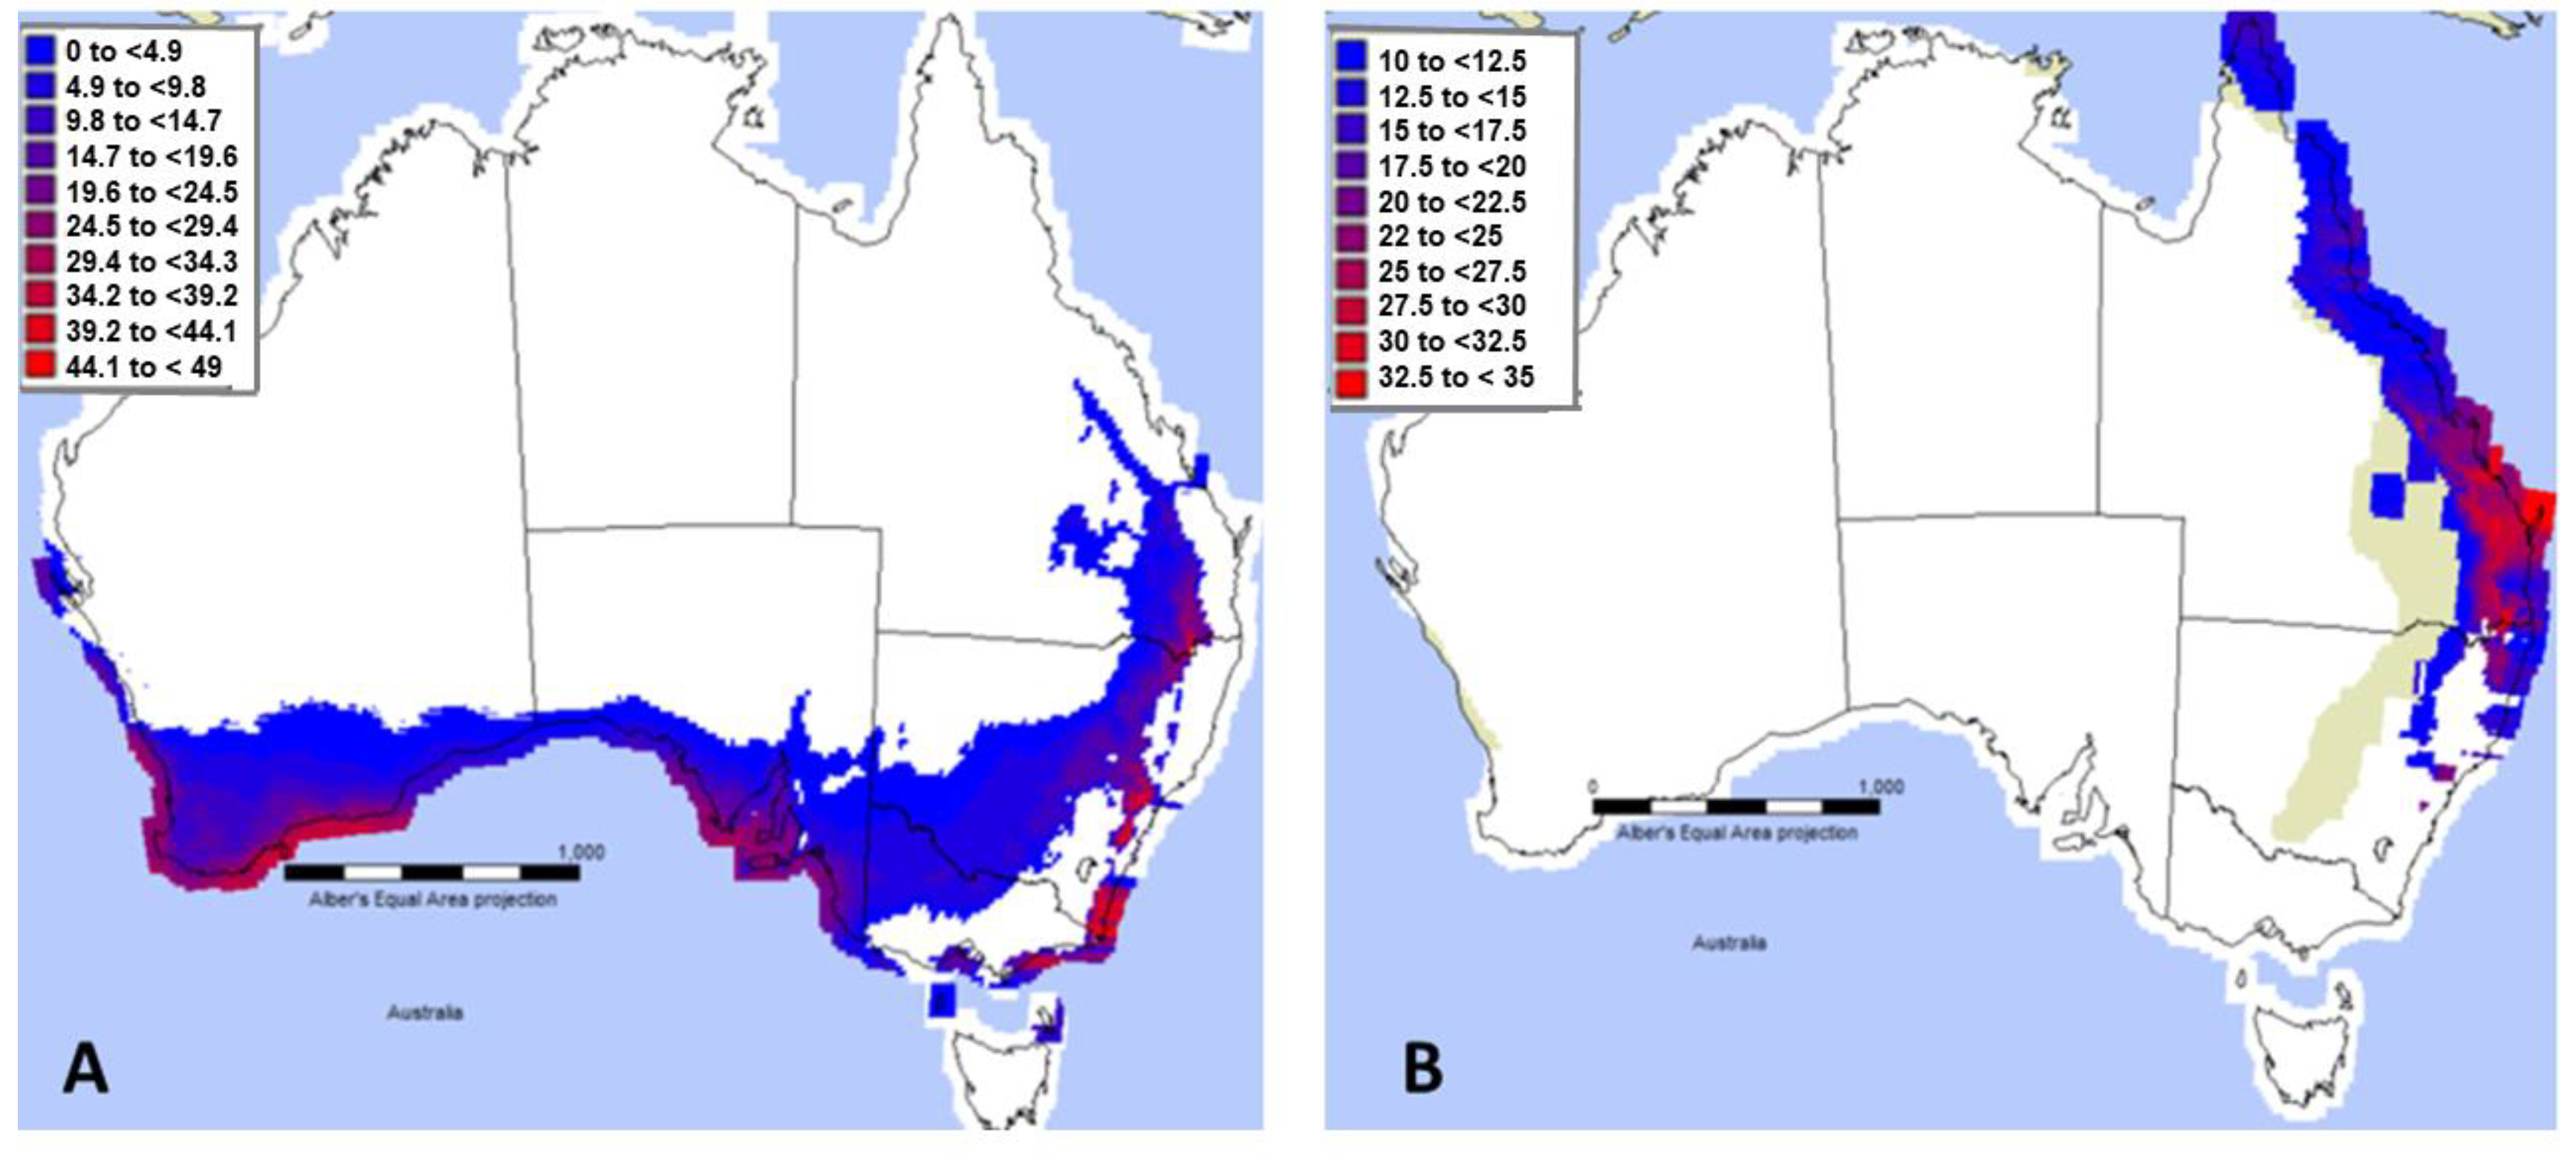
The Mediterranean CLIMEX default parameter file {Hearne Scientific CLIMEX v4 [50]} was used with the Match Locations function as the base model onto which the L. invasa developmental parameters reported in [33] were built (Table 1). The Mediterranean default file was chosen because that was the region where L. invasa was first reported, widely spread and comprises only Lineage A [15]. For the modified model, temperature thresholds and day degree requirements were from [33], while cold stress values reflected the reported lower temperature threshold (0 °C) of Qui et al. (2011) reported in [33]. The CLIMEX model represented a different modelling approach from MaxEnt as the distribution records was not used; rather the default Mediterranean climate parameter file was built upon to incorporate biological development data to predict climatic suitability {eco-climatic index (EI) score} within Australia and hence predict the potential geographic origin of L. invasa Lineage A.

3. Results

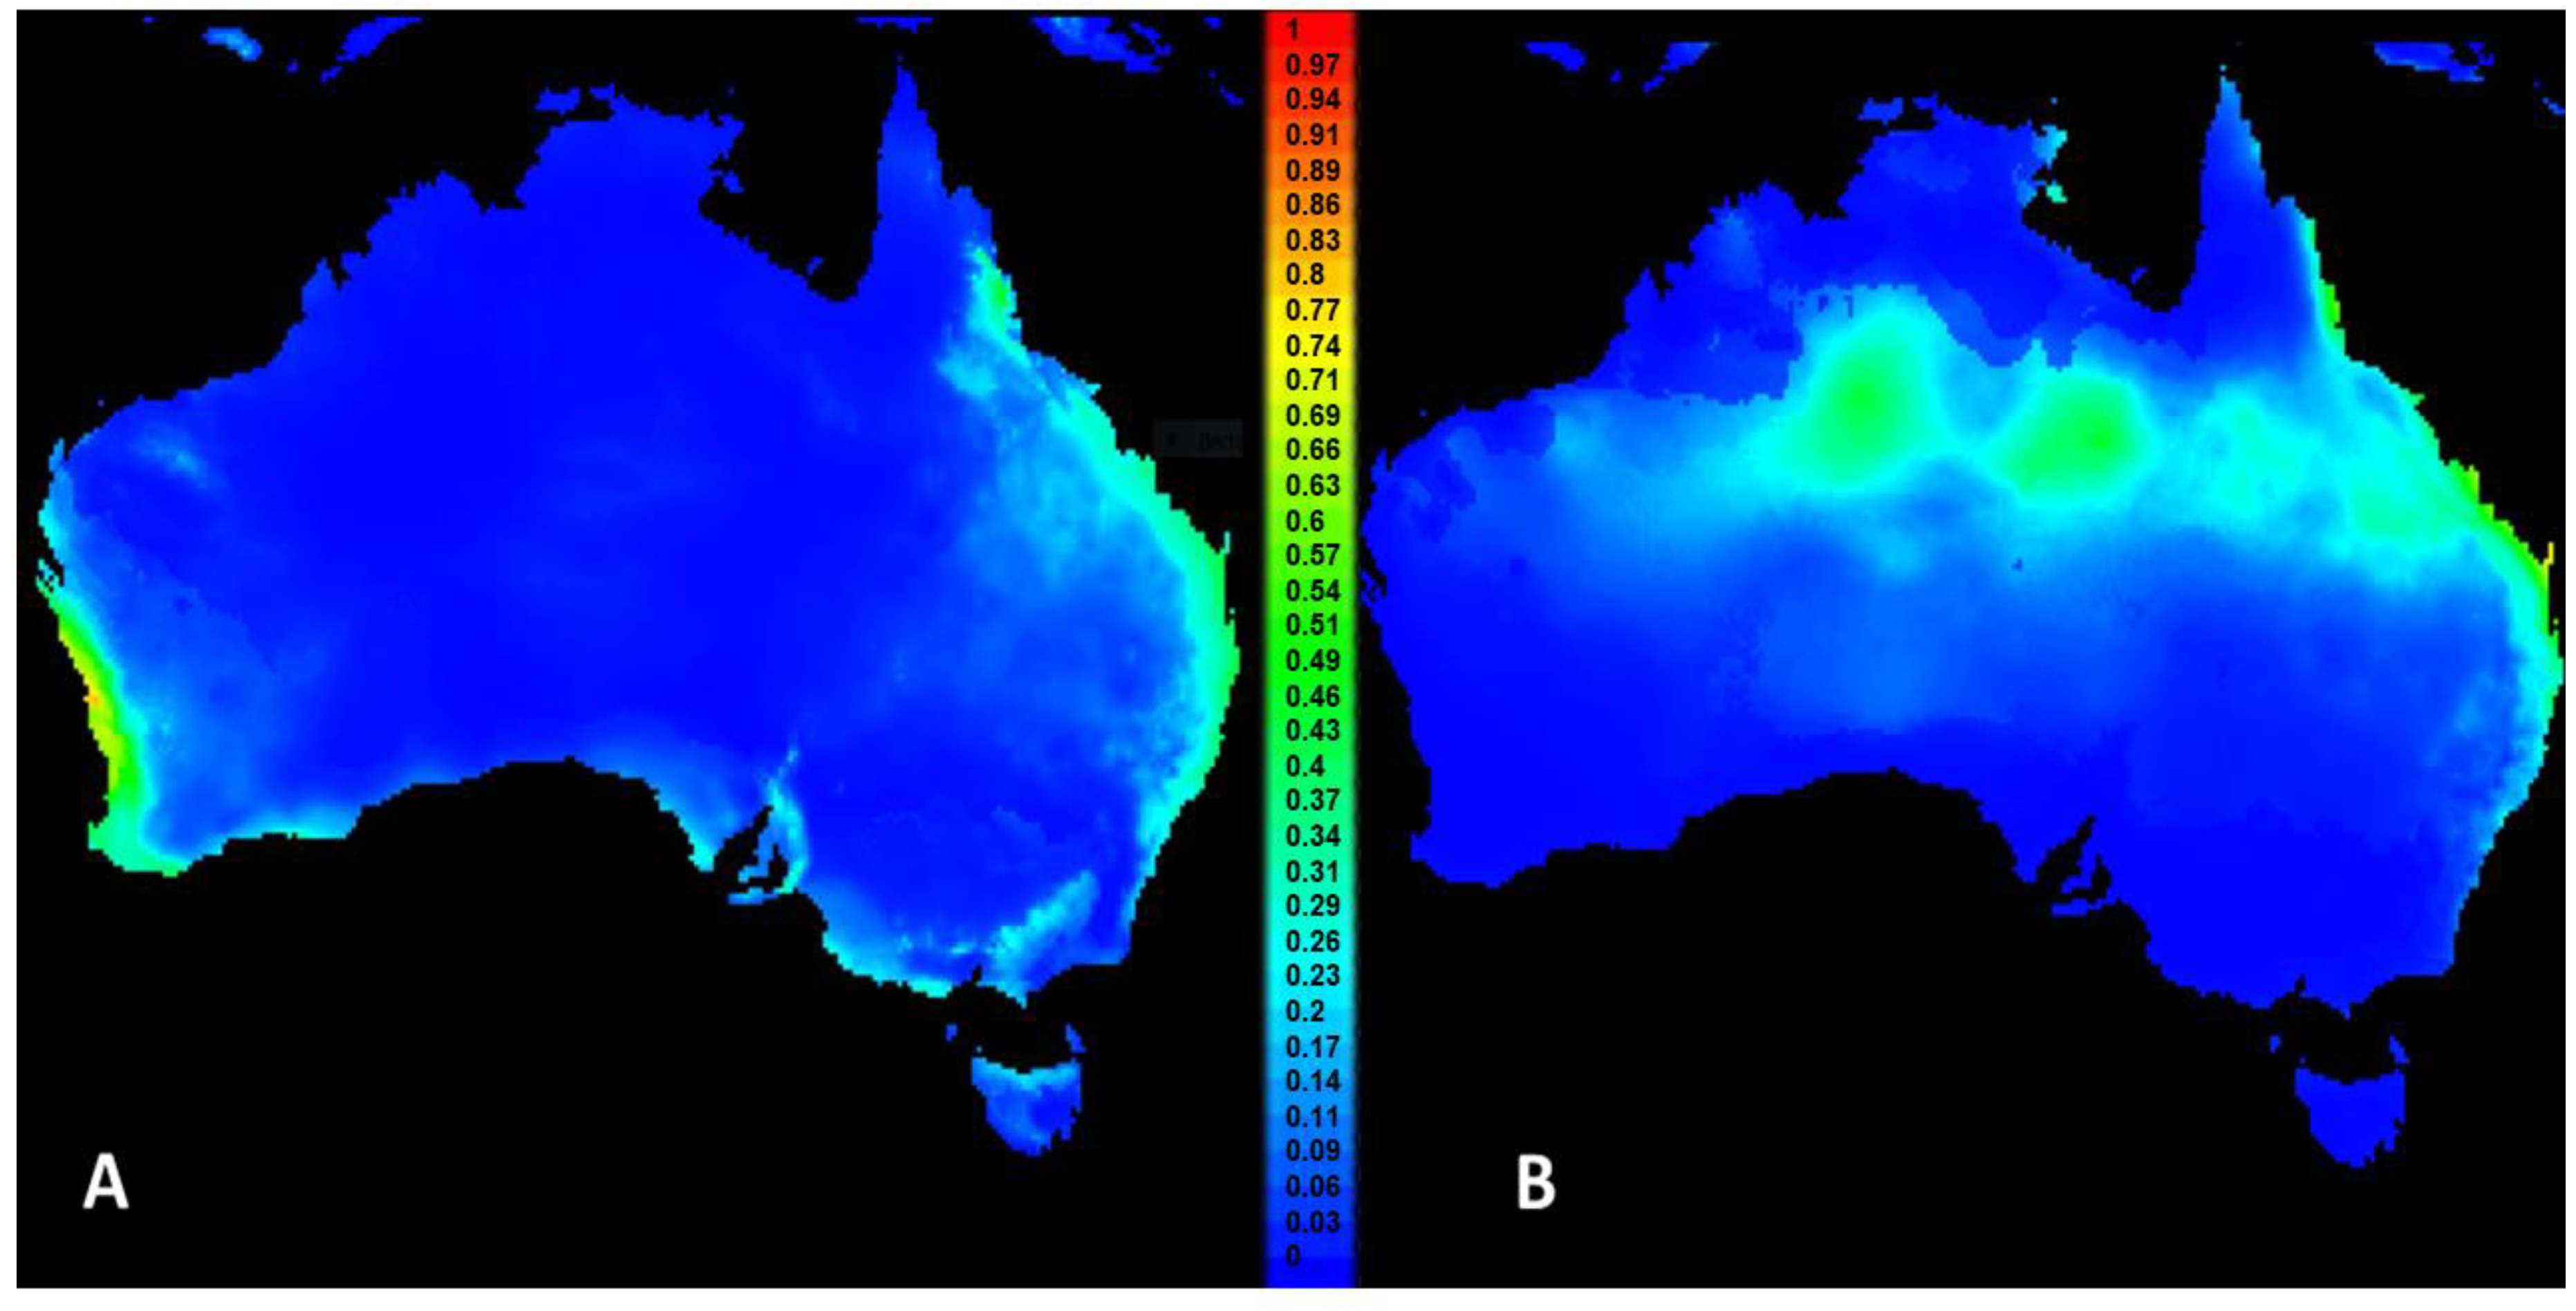
3.1. Niche Modelling and Projections in MaxEnt

The MaxEnt models had AUC values greater than 0.5 for all the populations: Lineage A 0.858; Lineage B invasive 0.909; Lineage B endemic 0.875. When collection records in invaded locations (invasive populations only; each lineage considered separately) were projected back to Australia, the models showed that the most suitable geographic regions for these populations differed, primarily with respect to southwest Western Australia and inland northern Australia (Figure 1).

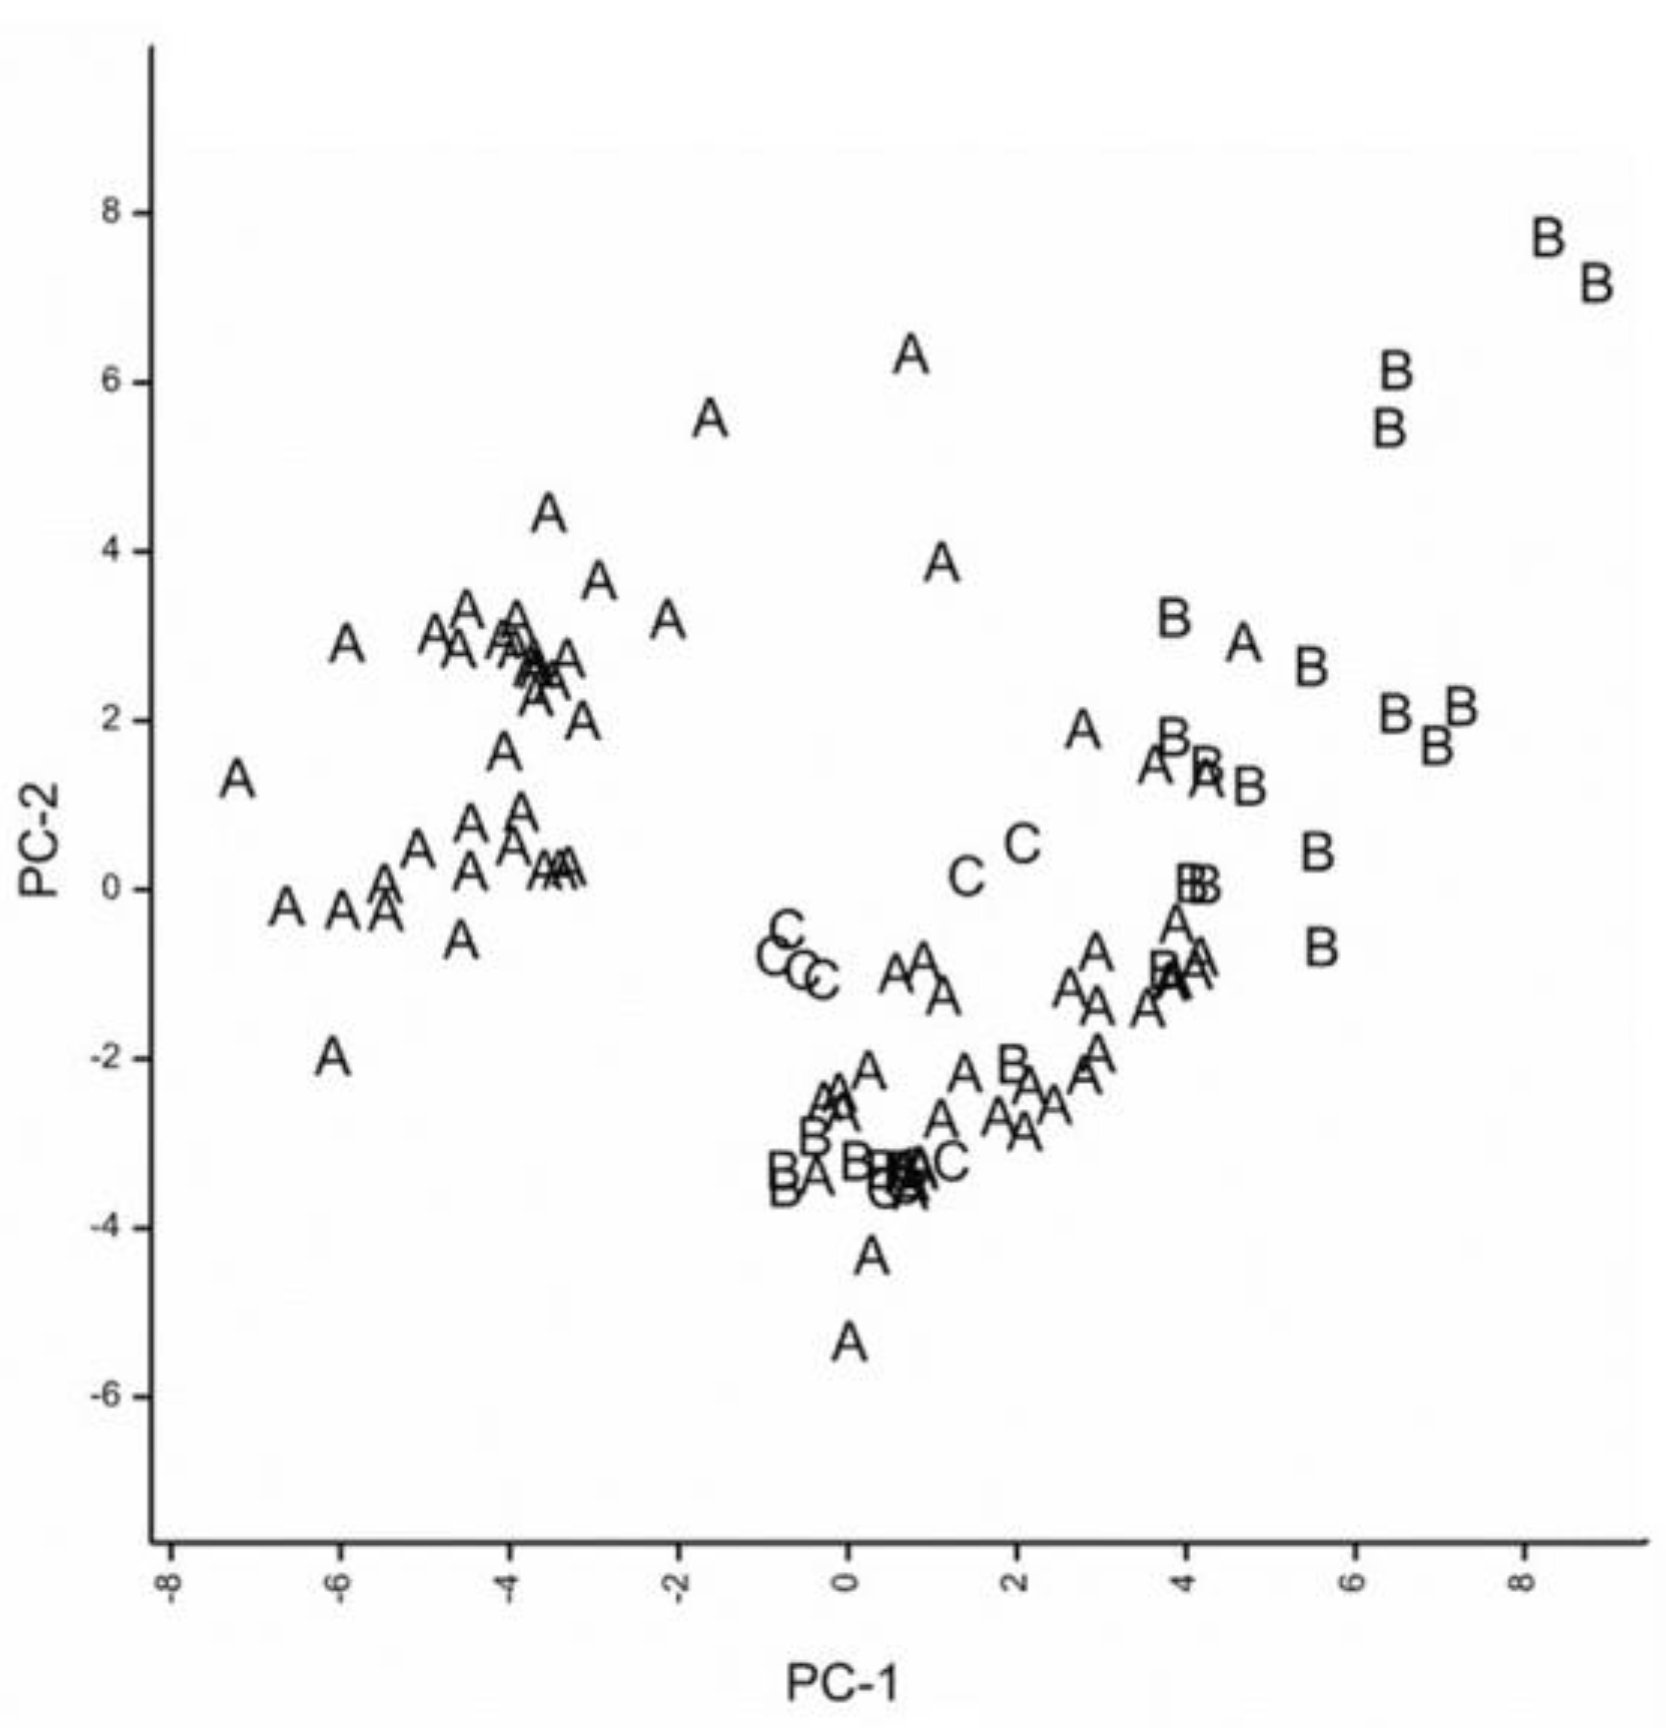
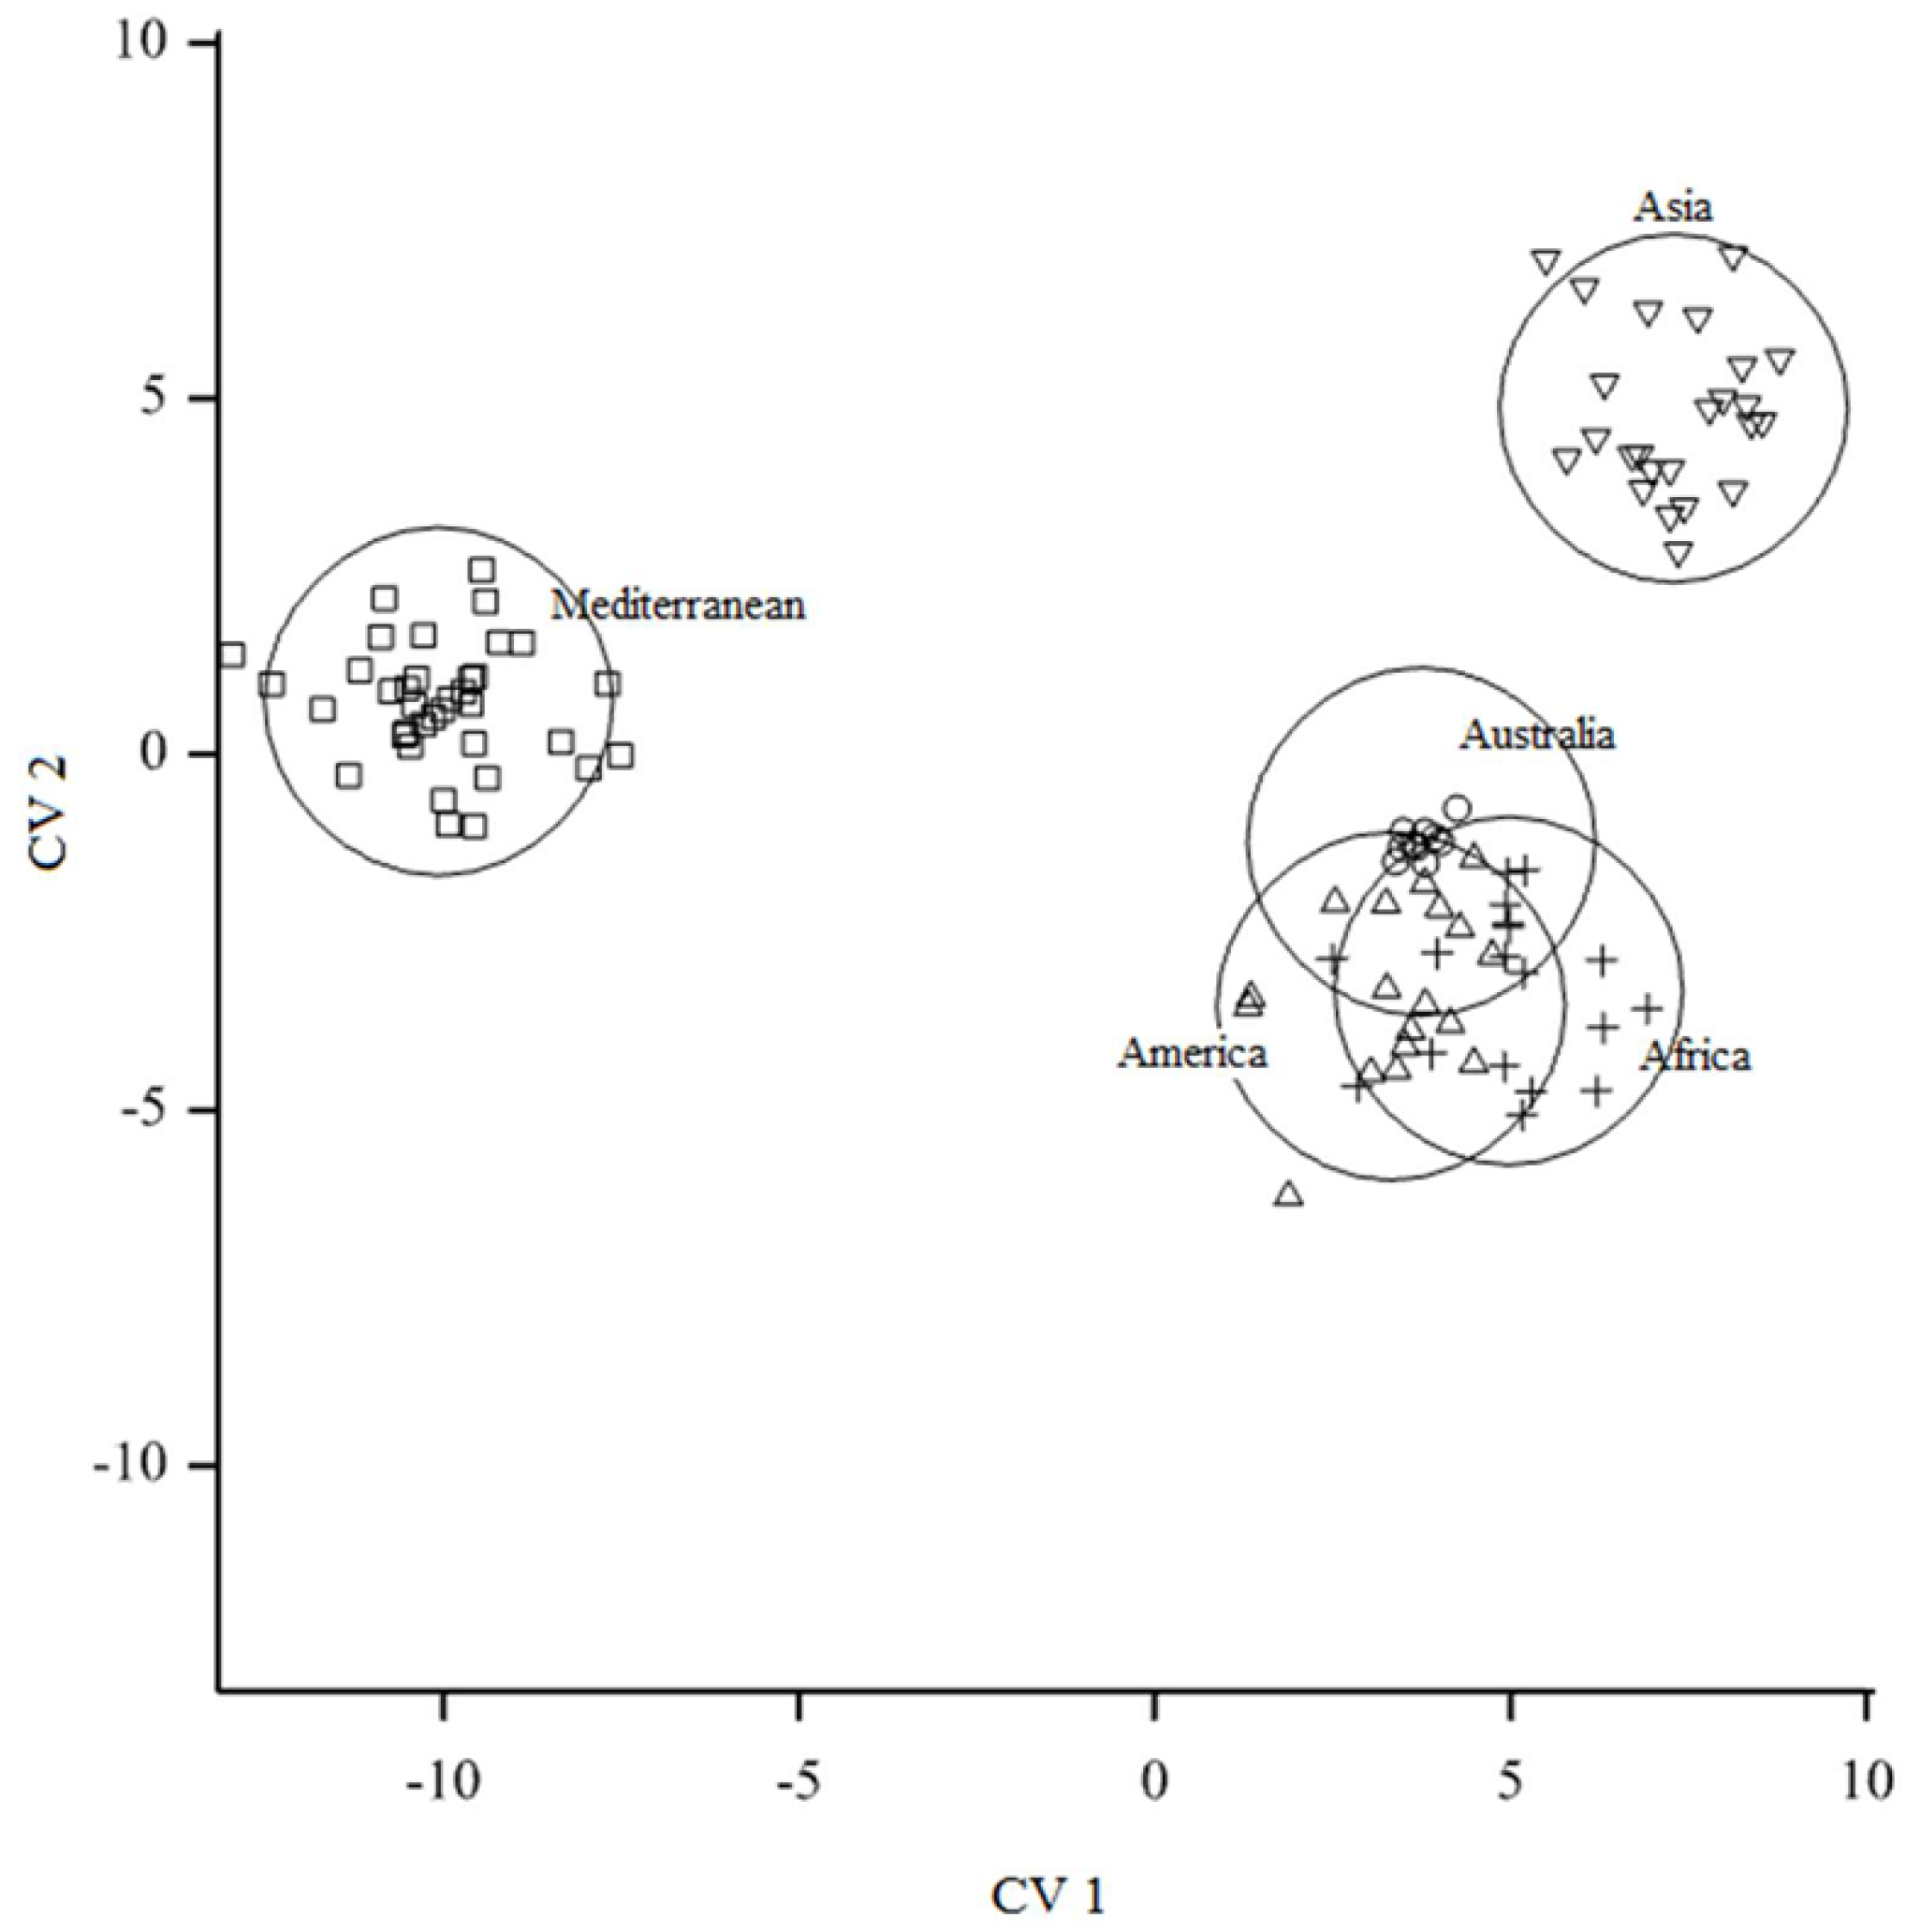
3.2. Testing for Niche Overlap

The suitability range for Lineage A when projected to Australia merges with part of the predicted endemic range of collections from Queensland to the southern region of Australia (Figure 1A). The projection of the Asian population (Lineage B) to Australia shows suitability in northern and eastern Australia, corresponding to regions of both moderate and high suitability from the Australian collection records model (Figure 1B), but also a reasonable match with the Australian collection records themselves in Figure 1A.
The PCA showed an aggregation of a population of Lineage A with both B lineages; another group comprised only Lineage A (Figure 2). This indicated that Lineage A was not a homogenous group and we therefore separated them into their regional populations, i.e. African, American and Mediterranean populations.
Canonical variate analysis separated the Mediterranean population from African and American populations of Lineage A (χ2246 = 160.32, p < 0.001). The African and American populations were however observed to pool together with Australian population (Figure 3). Bootstrapping in stepwise discriminant analysis reclassified the cases with an error rate of 12.7%.

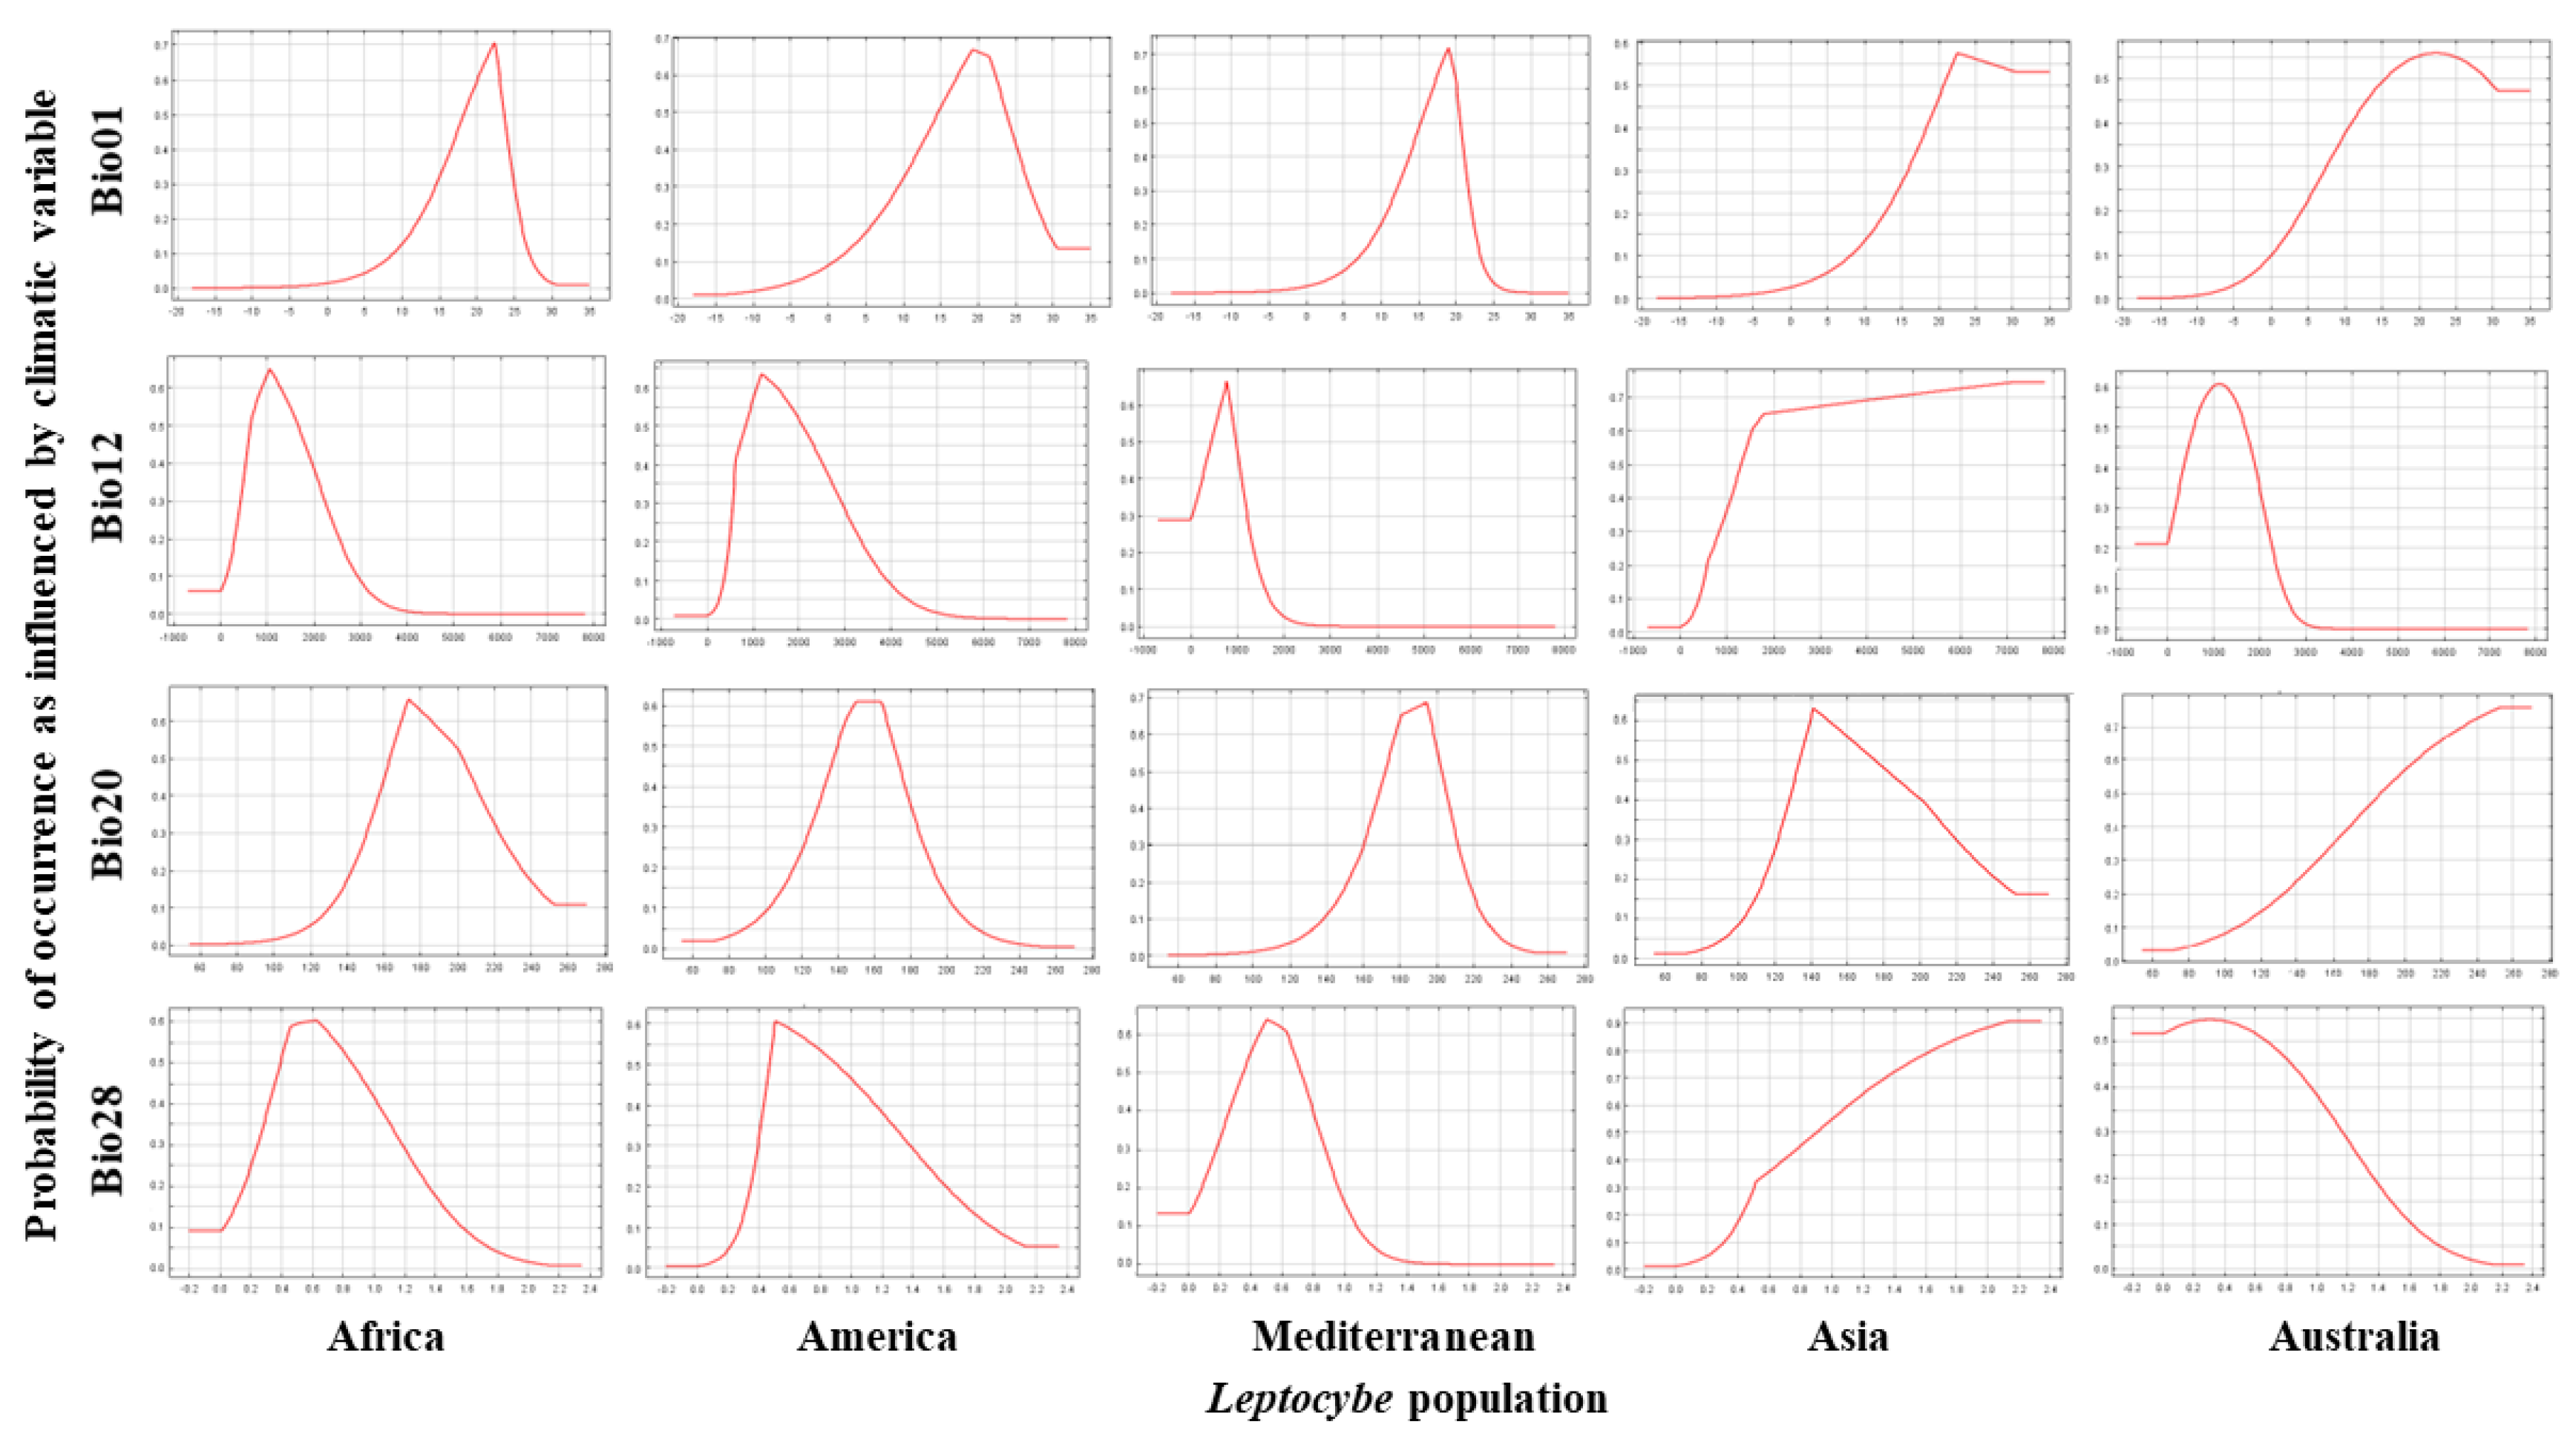
3.3. Contribution of Environmental Variables to the Probability of Occurrence of L. invasa

In MaxEnt, the different lineages were separable by the climatic variables derived from the major factors of temperature, precipitation, radiation and moisture index (Table S3). The probability of occurrence generally increased with increasing annual mean air temperature for all the invasive populations (Figure 4). Annual mean precipitation, radiation and moisture index showed the same effect but peaking around different ranges for the different populations. The Australian population showed a general decline with increase in annual mean temperature, precipitation and moisture index but an increase with increasing annual mean radiation (Figure 4). These effects were not evident, however, when other environmental factors were included in the models.
The first component of the PCA was explained by environmental variability (36.0%), mainly in precipitation and moisture index, while the second (20.5%) was explained by radiation and temperature (Tables S4 and S5). In stepwise discriminant analysis, the variables with the lowest Wilk’s lambda values were dominated by temperature-related variables though other factors also contributed (Tables S6 and S7).

3.4. CLIMEX Modelling

The Mediterranean default parameters used as an approximation of Lineage A showed a widespread climatic suitability (Figure 5A). The addition of the developmental data of Qui et al. (2011) {reported in [33]}, specifically a lower temperature threshold of 0 °C and degree-days of 1776, to the CLIMEX Mediterranean default in Australia did not change the geographic area of EI suitability beyond the Mediterranean projection, and was greater than the range predicted by MaxEnt modelling using distribution data that included the Mediterranean region. However, the CLIMEX model output using the much higher developmental temperature thresholds given in [33] (Figure 5B) followed more closely the reported endemic distribution of Lineage B [18], and the eastern MaxEnt model generated using invasive Lineage B distribution data (Figure 1B). This supports the inference that the Chinese lineage used in [33] was Lineage B, i.e. the lineage reported from China by [14], and by [18] from the projected Australian distribution. There is a small possibility that the Qui et al. (2011) development rates may have been calculated using Lineage A, since the MaxEnt and CLIMEX models overlap somewhat in their predictions, but this remains untested as Lineage A has not so far been reported from China, although populations with differing reproductive modes have [14].

4. Discussion

Our MaxEnt and CLIMEX models supported the widely held assumption that L. invasa originated in Australia, despite having never been recorded there, since both modelling methods showed climatic suitability for this lineage (Lineage A). The multivariate analysis showed climatic niche variability in the different populations, with the Mediterranean and Asian populations occupying niches different from all the other populations. It is therefore likely that variability occurs within the genus in Australia, and that the different lineages are from different origins, as suggested by genetic scenario modelling [18]. A small number of eucalypt species are endemic to New Guinea and Indonesia [51] and although little is known of their galling fauna, they have never been surveyed for Leptocybe and there remains a possibility that L. invasa may have originated there.
The aim of our study was to predict the geographic region of origin of L. invasa sensu stricto (Lineage A) using two modelling methods. The first, MaxEnt, used the current invasive distribution of each lineage to infer climatically-similar regions in Australia. The prediction for Lineage A overlapped with the known distribution of Lineage B in Queensland and northern New South Wales but showed suitability further south, and particularly in Western Australia. As for the CLIMEX model, MaxEnt predicted Lineage B across a more northerly distribution, with both modelled distributions overlapping the known range of Lineage B. CLIMEX, using a Mediterranean climate to represent the original and widespread exotic occurrence of Lineage A, predicted a large range that overlapped with the prediction generated by MaxEnt, and also a more southerly and western distribution than Lineage B has been found. Only Lineage B has been reported from China, where the development rate data used in the modified CLIMEX Mediterranean model was generated [33], and the model output fitted well with the known range of Lineage B in Australia. This model was a better fit with the known range of Lineage B than the MaxEnt model, which placed it further west than suitable hosts are likely to occur. Development rates, thermal thresholds and day-degree requirements for Lineage A (currently unavailable) might help to improve our predictive power for the endemic distribution of L. invasa using CLIMEX.
Potentially, phenotypic plasticity [52], along with asexual reproduction and concealed habit in galls, as well as anthropogenic distribution of suitable hosts adaptable to widely variable environmental conditions, probably aided range expansion by the wasps. Lineage B (Asian population) and the Mediterranean population of Lineage A occupy the most divergent climatic niches from specimens collected in Australia, suggesting a lack of niche conservatism since the Australian population is genetically closest to Lineage B invasive [18]. Males are more frequently observed in Lineage B [14] which could indicate sexual reproduction in these populations that could lead to future rapid genetic variability in the populations. Sexual reproduction has been suggested to be associated with improved fitness in populations utilising heterogeneous environments [53] and could be associated with climatic range expansion in the sexual populations of L. invasa. Empirical evidence supporting this hypothesis exists for rotifers [54] but a study using thrips did not support it [55]. Nevertheless, given the serious impact of this pest on planted eucalypts worldwide [15] the economic implications of its continued range expansion are clear.
Although temperature is thought to be the most restricting environmental factor affecting insect development [56,57], supercooling ability is exhibited in L. invasa populations in temperate climates [30]. However, none of our models singled out temperature or its derived variables to be the major factor separating the climatic niches but our study does not explain the observed negative effect of altitude, i.e., low temperatures on galling intensity [23,24].
Our models indicated that Lineage A could have a wider area of endemism than the existing collection locations in Australia, mostly to the south, and suggest that future collections of galls should target southern parts of Australia to locate populations of natural enemies associated with Lineage A, and with more climatic similarity to its possible endemic origin. All the parasitoid species introduced as biological control agents [15] were collected from within the endemic range of Lineage B. The Australian-origin eucalypt weevil Gonipterus scutellatus sensu lato (Coleoptera: Curculionidae), comprises an invasive cryptic species complex exhibiting variable biocontrol as a potential climatic and/or taxonomic mismatch between host and biocontrol agent [58]. Climatic variability and host-parasitoid mismatch between different lineages could similarly impact the performance of parasitoids used for the biological control of L. invasa in different parts of the world [19,59,60,61]. These findings also imply a risk of reintroduction of the invasive populations to Australia or local introductions to other parts of the world where they are currently not found, thereby impacting the performance of susceptible host plants.

5. Conclusions

Our findings {expanded from [62]} represent the first attempts to model the distributions of the two cryptic and globally invasive species of Leptocybe invasa sensu lato in its purported country of origin, namely Australia. Molecular and biological evidence for the existence of two species likely reflects adaptation of insects introduced overseas to climatically disparate regions in Australia. Surprisingly, neither temperature nor its derived variables were found to contribute strongly to the differentiation of the species’ climatic niches in the endemic range. Understanding the threats posed to extra-limital plantings of eucalypts as well as those in Australian ecosystems remains challenging in the absence of verified collection records from Australia and better information about the species’ genetic diversity and modes of reproduction.

Supplementary Materials

The following are available online at https://www.mdpi.com/1999-4907/10/2/115/s1, Table S1: Collection records used for modelling climatic suitability for Leptocybe species, Table S2: Key to Bioclim variables {from [36]}, Table S3: Contributions of Bioclim variables in MaxEnt logistic prediction of Leptocybe invasa suitability models of different populations, Table S4: Principal components loadings for all the collection records divided into Lineages A, B invasive and B endemic (latter denoted as C in Figure 2), Table S5: Principal components loadings for the populations of Lineage A, Table S6: Wilk’s lambda criterion values of the environmental variables used to predict the variability in climatic conditions of the different lineages of Leptocybe invasa, Table S7: Wilk’s lambda criterion values of the environmental variables used to predict the variability in climatic conditions of the different populations of Leptocybe invasa.

Author Contributions

All authors contributed to the formulation of the study. B.A.O. and H.F.N. compiled the insect collection records and environmental data. B.A.O. and M.J.S. conducted the MaxEnt modelling and H.F.N. conducted the CLIMEX modelling. B.A.O. and M.J.S. wrote a first draft of the MaxEnt component of this work {as Chapter 2 of [62]} and H.F.N. wrote the CLIMEX component of this work. M.J.S. and H.F.N. revised and formatted the final version of the manuscript.

Funding

B.A.O. was supported by an Australia Awards for Africa (AAA) PhD scholarship program which is an Australian Government, AusAID Initiative. Additional funding was provided by DEEE. HFN’s contribution was made under ACIAR project FST/2012/091.

Acknowledgments

We are grateful for availability of CABI and Climond datasets that we used in the models. We thank University College of London, Centre for Biodiversity and Environmental Research for the online course on ecological niche modelling by Richard Pearson. We are grateful to Jane Elith of University of Melbourne as well as Andrea Narvaez and Simon Watson of La Trobe University for advice on the use of MaxEnt. We appreciate the feedback of many researchers consulted to confirm infestation of Eucalyptus in their countries.

Conflicts of Interest

The authors declare no conflict of interest.

References

  1. Fox, L.R.; Morrow, P.A. Estimates of damage by herbivorous insects on Eucalyptus trees. Aust. J. Ecol. 1983, 8, 139–147. [Google Scholar] [CrossRef]
  2. Ohmart, C.P.; Edwards, P.B. Insect herbivory on Eucalyptus. Annu. Rev. Entomol. 1991, 36, 637–657. [Google Scholar] [CrossRef]
  3. Heatwole, H.; Lowman, M.D.; Abbott, K.L. Grazing on Australian eucalypt leaves by insects. Selbyana 1999, 20, 299–323. [Google Scholar]
  4. Semple, W.S.; Koen, T.B. Observations of insect damage to leaves of woodland eucalypts on the central western slopes of New South Wales: 1990 to 2004. Proc. Linn. Soc. N. S. W. 2007, 128, 99–110. [Google Scholar]
  5. Nahrung, H.F.; Loch, A.D.; Matsuki, M. Invasive insects in Mediterranean forest systems: Australia. In Insects and Diseases of Mediterranean Forest Systems; Paine, T.D., Lieutier, F., Eds.; Springer International Publishing: Cham, Switzerland, 2016; pp. 475–498. ISBN 978-3-319-24744-1. [Google Scholar]
  6. Steinbauer, M.J.; Nahrung, H.F. Native defoliators of Australian Mediterranean forest trees. In Insects and Diseases of Mediterranean Forest Systems; Paine, T.D., Lieutier, F., Eds.; Springer International Publishing: Cham, Switzerland, 2016; pp. 431–454. ISBN 978-3-319-24744-1. [Google Scholar]
  7. Steinbauer, M.J.; Salminen, J.-P.; Watson, S.J. Yellow, red, dead: the nutritional consequences for Cardiaspina densitexta (Hemiptera: Aphalaridae) nymphs of inducing senescence in old Eucalyptus fasciculosa leaves. Aust. Entomol. 2018, 57, 265–278. [Google Scholar] [CrossRef]
  8. Wingfield, M.J.; Slippers, B.; Hurley, B.P.; Coutinho, T.A.; Wingfield, B.D.; Roux, J. Eucalypt pests and diseases: Growing threats to plantation productivity. South. For. 2008, 70, 139–144. [Google Scholar] [CrossRef]
  9. Paine, T.D.; Steinbauer, M.J.; Lawson, S.A. Native and exotic pests of eucalyptus: A worldwide perspective. Annu. Rev. Entomol. 2011, 56, 181–201. [Google Scholar] [CrossRef] [PubMed]
  10. Nahrung, H.F.; Swain, A.J. Strangers in a strange land: Do life history traits differ for alien and native colonisers of novel environments? Biol. Invasions 2015, 17, 699–709. [Google Scholar] [CrossRef]
  11. Bush, S.J.; Slippers, B.; Neser, S.; Harney, M.; Dittrich-Schröder, G.; Hurley, B.P. Six recently recorded Australian insects associated with Eucalyptus in South Africa. Afr. Entomol. 2016, 24, 539–544. [Google Scholar] [CrossRef]
  12. Hurley, B.P.; Garnas, J.; Wingfield, M.J.; Branco, M.; Richardson, D.M.; Slippers, B. Increasing numbers and intercontinental spread of invasive insects on eucalypts. Biol. Invasions 2016, 18, 921–933. [Google Scholar] [CrossRef] [Green Version]
  13. Mendel, Z.; Protasov, A.; Fisher, N.; La Salle, J. Taxonomy and biology of Leptocybe invasa gen. & sp. n. (Hymenoptera: Eulophidae), an invasive gall inducer on Eucalyptus. Aust. J. Entomol. 2004, 43, 101–113. [Google Scholar] [CrossRef]
  14. Nugnes, F.; Gebiola, M.; Monti, M.M.; Gualtieri, L.; Giorgini, M.; Wang, J.G.; Bernardo, U. Genetic diversity of the invasive gall wasp Leptocybe invasa (Hymenoptera: Eulophidae) and of its Rickettsia endosymbiont, and associated sex-ratio differences. PLoS ONE 2015, 10, e0124660. [Google Scholar] [CrossRef] [PubMed]
  15. Le, N.H.; Nahrung, H.F.; Griffiths, M.; Lawson, S.A. Invasive Leptocybe spp. and their natural enemies: Global movement of an insect fauna on eucalypts. Biol. Control 2018, 125, 7–14. [Google Scholar] [CrossRef]
  16. Austin, A.D.; Yeates, D.K.; Cassis, G.; Fletcher, M.J.; La Salle, J.; Lawrence, J.F.; McQuillan, P.B.; Mound, L.A.; Bickel, D.J.; Gullan, P.J.; et al. Insects ‘Down Under’–diversity, endemism and evolution of the Australian insect fauna: Examples from select orders. Aust. Entomol. 2004, 43, 216–234. [Google Scholar] [CrossRef]
  17. Cranston, P.S. Biodiversity of Australasian insects. In Insect Biodiversity: Science and Society; Footitt, R.G., Adler, P.H., Eds.; Wiley-Blackwell: Chichester, UK, 2009; pp. 83–105. ISBN 9781405151429. [Google Scholar]
  18. Dittrich-Schröder, G.; Hoareau, T.B.; Hurley, B.P.; Wingfield, M.J.; Lawson, S.; Nahrung, H.F.; Slippers, B. Population genetic analyses of complex global insect invasions in managed landscapes: a Leptocybe invasa (Hymenoptera) case study. Biol. Invasions 2018, 20, 2395–2420. [Google Scholar] [CrossRef]
  19. Kim, I.-K.; Mendel, Z.; Protasov, A.; Blumberg, D.; La Salle, J. Taxonomy, biology, and efficacy of two Australian parasitoids of the eucalyptus gall wasp, Leptocybe invasa Fisher & La Salle (Hymenoptera: Eulophidae: Tetrastichinae). Zootaxa 2008, 1910, 1–20. [Google Scholar]
  20. Kelly, J.; La Salle, J.; Harney, M.; Dittrich-Schröder, G.; Hurley, B. Selitrichodes neseri n. sp., a new parasitoid of the eucalyptus gall wasp Leptocybe invasa Fisher & La Salle (Hymenoptera: Eulophidae: Tetrastichinae). Zootaxa 2012, 3333, 50–57. [Google Scholar]
  21. Kim, I.-K. Evolution of gall inducing Eulophidae (Hymenoptera: Chalcidoidea) on Myrtaceae in Australia. Ph.D. Thesis, The Australian National University, Canberra ACT, Australia, 2008. [Google Scholar]
  22. Zheng, X.L.; Li, J.; Yang, Z.D.; Xian, Z.H.; Wei, J.G.; Fei, C.L.; Wang, X.P.; Lu, W. A review of invasive biology, prevalence and management of Leptocybe invasa Fisher & La Salle (Hymenoptera: Eulophidae: Tetrastichinae). Afr. Entomol. 2014, 22, 68–79. [Google Scholar] [CrossRef]
  23. Nyeko, P.; Mutitu, K.E.; Otieno, B.O.; Ngae, G.N.; Day, R.K. Variations in Leptocybe invasa (Hymenoptera: Eulophidae) population intensity and infestation on eucalyptus germplasms in Uganda and Kenya. Int. J. Pest Manag. 2010, 56, 137–144. [Google Scholar] [CrossRef]
  24. Petro, R.; Madoffe, S.S.; Iddi, S. Infestation density of eucalyptus gall wasp, Leptocybe invasa Fisher and La Salle (Hymenoptera: Eulophidae) on five commercially grown Eucalyptus species in Tanzania. J. Sustain. For. 2014, 33, 276–297. [Google Scholar] [CrossRef]
  25. Aytar, F. Natural history, distribution and hosts of Eucalyptus gall wasps in Turkey. Presented at the VIIIth European Congress of Entomology, Izmir, Turkey, September 2006. [Google Scholar]
  26. Steinbauer, M.J.; Kriticos, D.J.; Lukacs, Z.; Clarke, A.R. Modelling a forest lepidopteran: Phenological plasticity determines voltinism which influences population dynamics. For. Ecol. Manag. 2004, 198, 117–1142. [Google Scholar] [CrossRef]
  27. Jaworski, T.; Hilszczański, J. The effect of temperature and humidity changes on insects development their impact on forest ecosystems in the expected climate change. Leśne Prace Badawcze (For. Res. Pap.) 2013, 74, 345–355. [Google Scholar] [CrossRef] [Green Version]
  28. Hoffmann, A.A.; Shirriffs, J.; Scott, M. Relative importance of plastic vs genetic factors in adaptive differentiation: geographical variation for stress resistance in Drosophila melanogaster from eastern Australia. Funct. Ecol. 2005, 19, 222–227. [Google Scholar] [CrossRef]
  29. Hill, M.P.; Chown, S.L.; Hoffmann, A.A. A predicted niche shift corresponds with increased thermal resistance in an invasive mite, Halotydeus destructor. Glob. Ecol. Biogeogr. 2013, 22, 942–951. [Google Scholar] [CrossRef]
  30. PengFei, H.; JianHui, W.; BaoLi, Q.; ShunXiang, R. Extreme low temperature tolerance of Leptocybe invasa. Chin. J. Appl. Entomol. 2012, 49, 1553–1558. [Google Scholar]
  31. Lu, T.C.; Zhang, Y.Z.; Huang, Z.H.; Huang, J. The effect on the longevity of Leptocybe invasa Fisher & LaSalle (Hymenoptera: Eulophidae) studied by microcalorimetry and traditional methods. J. Therm. Anal. Calorim. 2014, 116, 461–467. [Google Scholar] [CrossRef]
  32. Yang, Z.D.; Zhao, Y.Y.; Yu, S.Z.; Zheng, X.L.; Xu, L. Rapid cold-hardening response of adult Leptocybe invasa Fisher & La Salle (Hymenoptera: Eulophidae: Tetrastichinae). Afr. Entomol. 2015, 23, 139–146. [Google Scholar] [CrossRef]
  33. Zhu, F.L.; Ren, S.X.; Qiu, B.L.; Wu, J.H. Effect of temperature on life table parameters of Leptocybe invasa (Hymenoptera: Eulophidae). Aust. Entomol. 2015, 54, 71–78. [Google Scholar] [CrossRef]
  34. Broennimann, O.; Guisan, A. Predicting current and future biological invasions: Both native and invaded ranges matter. Biol. Lett. 2008, 4, 585–589. [Google Scholar] [CrossRef]
  35. Byeon, D.-H.; Jung, S.; Lee, W.-H. Review of CLIMEX and MaxEnt for studying species distribution in South Korea. J. Asia-Pac. Biodivers. 2018, 11, 325–333. [Google Scholar] [CrossRef]
  36. Kriticos, D.J.; Webber, B.L.; Leriche, A.; Ota, N.; Macadam, I.; Bathols, J.; Scott, J.K. CliMond: Global high-resolution historical and future scenario climate surfaces for bioclimatic modelling. Method. Ecol. Evol. 2012, 3, 53–64. [Google Scholar] [CrossRef]
  37. Soberon, J.; Peterson, A.T. Interpretation of models of fundamental ecological niches and species’ distributional areas. Biodivers. Inform. 2005, 2, 1–10. [Google Scholar] [CrossRef]
  38. Phillips, S.J.; Anderson, R.P.; Schapire, R.E. Maximum entropy modeling of species geographic distributions. Ecol. Model. 2006, 190, 231–259. [Google Scholar] [CrossRef]
  39. Elith, J.; Phillips, S.J.; Hastie, T.; Dudik, M.; Chee, Y.E.; Yates, C.J. A statistical explanation of MaxEnt for ecologists. Divers. Distrib. 2011, 17, 43–57. [Google Scholar] [CrossRef]
  40. Pearson, R.G.; Raxworthy, C.J.; Nakamura, M.; Peterson, A.T. Predicting species distributions from small numbers of occurrence records: A test case using cryptic geckos in Madagascar. J. Biogeogr. 2007, 34, 102–117. [Google Scholar] [CrossRef]
  41. Wisz, M.S.; Hijmans, R.J.; Li, J.; Peterson, A.T.; Graham, C.H.; Guisan, A.; NCEAS Predicting Species Distributions Working Group. Effects of sample size on the performance of species distribution models. Divers. Distrib. 2008, 14, 763–773. [Google Scholar] [CrossRef]
  42. Hunt, R.; Zobel, B. Frost-hardy Eucalyptus grow well in the southeast. South. J. Appl. For. 1978, 2, 6–10. [Google Scholar] [CrossRef]
  43. Kellison, R.; Lea, R.; Marsh, P. Introduction of Eucalyptus spp. into the United States with special emphasis on the southern United States. Int. J. For. Res. 2013, 189393. [Google Scholar] [CrossRef]
  44. Phillips, S.J.; Dudík, M.; Elith, J.; Graham, C.H.; Lehmann, A.; Leathwick, J.; Ferrier, S. Sample selection bias and presence-only distribution models: Implications for background and pseudo-absence data. Ecol. Appl. 2009, 19, 181–197. [Google Scholar] [CrossRef]
  45. VanDerWal, J.; Shoo, L.P.; Graham, C.; William, S.E. Selecting pseudo-absence data for presence-only distribution modeling: how far should you stray from what you know? Ecol. Model. 2009, 220, 589–594. [Google Scholar] [CrossRef]
  46. Merow, C.; Smith, M.J.; Silander, J.A. A practical guide to MaxEnt for modeling species’ distributions: what it does, and why inputs and settings matter. Ecography 2013, 36, 1058–1069. [Google Scholar] [CrossRef] [Green Version]
  47. Robertson, M.P.; Caithness, N.; Villet, M.H. A PCA-based modelling technique for predicting environmental suitability for organisms from presence records. Divers. Distrib. 2001, 7, 15–27. [Google Scholar] [CrossRef]
  48. Janžekovič, F.; Novak, T. PCA—A powerful method for analyze ecological niches. In Principal Component Analysis-Multidisciplinary Applications; Open access peer-reviewed Edited Volume; Sanguansat, P., Ed.; IntechOpen: Rijeka, Croatia, 2012; pp. 127–142. ISBN 978-953-51-0129-1. [Google Scholar]
  49. Anderson, M.J.; Willis, T.J. Canonical analysis of principal coordinates: A useful method of constrained ordination for ecology. Ecology 2003, 84, 511–525. [Google Scholar] [CrossRef]
  50. Kriticos, D.J.; Maywald, G.F.; Yonow, T.; Zurcher, E.J.; Herrmann, N.I.; Sutherst, R.W. CLIMEX. Version 4: Exploring the Effects of Climate on Plants, Animals and Diseases. CSIRO: Canberra, Australia, 2015; 184p. [Google Scholar]
  51. Hill, K.D.; Johnson, L.A.S. Systematic studies in the eucalypts. 10. New tropical and subtropical eucalypts from Australia and New Guinea (Eucalyptus, Myrtaceae). Telopea 2000, 8, 503–539. Available online: http://citeseerx.ist.psu.edu/viewdoc/download?doi=10.1.1.549.127&rep=rep1&type=pdf (accessed on 22 January 2019). [CrossRef]
  52. West-Eberhard, M.J. Phenotypic plasticity and the origins of diversity. Annu. Rev. Ecol. Syst. 1989, 20, 249–278. [Google Scholar] [CrossRef]
  53. Agrawal, A.F. Spatial heterogeneity and the evolution of sex in diploids. Am. Nat. 2009, 174, S54–S70. [Google Scholar] [CrossRef] [PubMed]
  54. Luijckx, P.; Ho, E.K.H.; Gasim, M.; Chen, S.; Stanic, A.; Yanchus, C.; Kim, Y.S.; Agrawal, A.F. Higher rates of sex evolve during adaptation to more complex environments. Proc. Nat. Acad. Sci. USA 2017, 114, 534–539. [Google Scholar] [CrossRef] [PubMed] [Green Version]
  55. Lavanchy, G.; Strehler, M.; Roman, M.N.L.; Lessard-Therrien, M.; Humbert, J.Y.; Dumas, Z.; Jalvingh, K.; Ghali, K.; Garćia-Cuenca, A.F.; Zijlstra, B.; et al. Habitat heterogeneity favors asexual reproduction in natural populations of grassthrips. Evolution 2016, 70, 1780–1790. [Google Scholar] [CrossRef] [PubMed]
  56. Damos, P.; Savopoulou-Soultani, M. Temperature-driven models for insect development and vital thermal requirements. Psyche: J. Entomol. 2011, 2012, 123405. [Google Scholar] [CrossRef]
  57. Padmavathi, C.; Katti, G.; Sailaja, V.; Padmakumari, A.P.; Jhansilakshmi, V.; Prabhakar, M.; Prasad, Y.G. Temperature thresholds and thermal requirements for the development of the rice leaf folder, Cnaphalocrocis medinalis. J. Insect Sci. 2013, 13, 1–14. [Google Scholar] [CrossRef]
  58. Mapondera, T.S.; Burgess, T.; Matsuki, M.; Oberprieler, R.G. Identification and molecular phylogenetics of the cryptic species of the Gonipterus scutellatus complex (Coleoptera: Curculionidae: Gonipterini). Aust. J. Entomol. 2012, 51, 175–188. [Google Scholar] [CrossRef]
  59. Protasov, A.; Doğanlar, M.; La Salle, J.; Mendel, Z. Occurrence of two local Megastigmus species parasitic on the Eucalyptus gall wasp Leptocybe invasa in Israel and Turkey. Phytoparasitica 2008, 36, 449–459. [Google Scholar] [CrossRef]
  60. Kulkarni, H.; Kumari, N.K.; Vastrad, A.; Basavanagoud, K. Release and recovery of parasitoids in eucalyptus against gall wasp, Leptocybe invasa (Hymenoptera: Eulophidae) under green house. Karnataka J. Agric. Sci. 2010, 23, 91–92. [Google Scholar]
  61. Sangtongpraow, B.; Charernsom, K. Evaluation of parasitism capacity of Megastigmus thitipornae Dogănlar & Hassan (Hymenoptera: Torymidae), the local parasitoid of Eucalyptus gall wasp, Leptocybe invasa Fisher & La Salle (Hymenoptera: Eulophidae). Kasetsart J. (Nat. Sci.) 2013, 47, 191–204. [Google Scholar]
  62. Otieno, B.A. Genetic and environmental influences on the utilization of Eucalyptus camaldulensis (Dehnh.) by Leptocybe invasa Fisher & LaSalle (Hymenoptera: Eulophidae). Ph.D. Thesis, La Trobe University, Melbourne, Austria, May 2017. Available online: http://hdl.handle.net/1959.9/563309 (accessed on 22 January 2019).
Figure 1. MaxEnt model predictions in Australia for Leptocybe spp. Lineage A (A) and Lineage B (B) based on their invasive global distributions. Colours illustrate climatic suitability (see scale in centre; 0 = lowest suitability and 1 = highest suitability).
Forests 10 00115 g001
Figure 2. Principal components of Leptocybe spp. collection records grouped according to lineage, i.e. A (Lineage A invasive), B (Lineage B invasive), and C (Lineage B endemic).
Forests 10 00115 g002
Figure 3. Canonical variates of climatic niches of Leptocybe spp. collection locations grouped as populations. Circles represent 95% confidence regions of the groups assuming normal distribution of data.
Forests 10 00115 g003
Figure 4. MaxEnt-predicted response curves for probability of occurrence of Leptocybe populations determined by Bioclim variables (Bio01= annual mean temperature (°C); Bio12 = annual precipitation (mm); Bio20 = annual mean radiation (W m−2); Bio28 = annual mean moisture index). The y-axes denote the probability of occurrence (range 0 to 0.5 or 0.7) while the x-axes denote the range of the variable (range Bio01: −20 to 35; range Bio12: −1000 to 8000; range Bio20: 60 to 280; range Bio28: −0.2 to 2.4).
Forests 10 00115 g004
Figure 5. CLIMEX model output of Match Locations function using the Mediterranean climate default parameter file (A), and the same file modified using Leptocybe development data reported in [33] (B).
Forests 10 00115 g005
Table 1. CLIMEX parameter values used to model Leptocybe spp. distributions.
ParametersCodeLineage A (Mediterranean Default) [50]Lineage B Modified Model [33]
Temperature (°C)
Lower temperature thresholdDV01019.1
Lower optimum temperatureDV11626
Upper optimum temperatureDV22429
Upper temperature thresholdDV32832
Soil moisture (SM)
Lower soil moisture thresholdSM00.10.1
Lower optimum soil moistureSM10.40.4
Upper optimum soil moistureSM20.70.7
Upper soil moisture thresholdSM31.51.5
Cold stress (CS)
CS temperature thresholdTTCS0−1
CS temperature rateTHCS−0.005−0.005
CS degree-day thresholdDTCS150
CS degree-day rateDHCS−0.0010
Heat stress (HS)
HS temperature threshold (°C)TTHS3032
HS temperature rateTHHS0.0020.002
HS degree-day thresholdDTHS00
HS degree-day rateDHHS00
Dry stress (DS)
DS thresholdSMDS0.020.02
DS rateHDS−0.05−0.05
Wet stress (WS)
WS thresholdSMWS1.61.6
WS rateHWS0.00150.0015
Cold-dry stress not usednot used
Cold-wet stress not usednot used
Hot-dry stress not usednot used
Hot-wet stress (HW)
Hot-wet stress thresholdTTHW2332
Hot-wet stress moisture thresholdMTHW0.51.5
Hot-wet stress ratePHW0.0750.075
Light index not usednot used
Diapause index not usednot used
Radiation index not usednot used
Physical substrate index not usednot used
Biotic substrate index not usednot used
Degree-day accumulationPDD600563

