Abstract
Roots can help to stabilise slopes against landslides and anchor trees against wind loading, but their mechanical contribution to the strength of soil is difficult to rapidly quantify under field conditions. A new field measurement method, quantifying the shear strength of rooted soil by measuring the resistance against extraction of soil cores using a large corkscrew device, was tested across three heterogeneous slopes (unforested, forested and clearfelled) in Scotland. The presence of roots significantly increased the measured shear strength in the surface layer of the Sitka spruce forested slope. Differences in strength between the three areas were however not significant. This could be attributed to the large variation in the soil component of the combined root–soil shear strength, which was strongly affected by variations in both soil density and gravel content. Measured strength on these natural slopes were much more variable compared to previously investigated sites. These results highlight the importance of investigating the variation in soil strength during root-reinforcement measurements, and furthermore demonstrate the need for a sufficiently large number of tests to address this variation. The corkscrew provides rapid estimation of root-reinforced soil shear strength on sites with difficult accessibility. Compared to the more conventional shear vane method, which yielded comparable soil strength results, the corkscrew proved more suitable in stony soil layers and has the additional benefit of simultaneously extracting small (rooted) soil samples that could be used for further root and soil analysis. It therefore proved a useful and effective field tool for use when a rapid estimation of root-reinforced soil shear strength is required.
1. Introduction
A reliable assessment of the strength of soil in forested areas is an important parameter when assessing the stability of slopes against landsliding (e.g., [1]). Furthermore, soil strength influences the anchorage of trees, which is important for example when quantifying the resistance of a tree stand against wind loading (e.g., [2]). The presence of roots affects the strength of the rooted soil through both hydrological and mechanical effects. Hydrological effects encompass changes in soil hydrological permeability and extraction of moisture from the soil by plants. The latter will increase soil matric suctions and therefore have a positive contribution to soil strength (e.g., [3]). In addition, during soil deformation roots will mobilise additional mechanical reinforcement through root tensile or bending action.
Root-reinforcement has a temporal component. The root architecture of a plant changes over time [4] with a corresponding development of overall strength and anchorage [5]. After a tree dies or is harvested, root mass and root strength will start to decay over time, resulting in gradual reduction of root-reinforcement [6,7,8]. The root systems of newly planted vegetation takes time to develop, resulting in a temporal ‘window’ of increased landslide risk corresponding with reduced root-reinforcements [8]. Root-reinforcement also shows spatial variability. Landslides will occur on slopes where the soil strength is low. Therefore, the spatial distribution of trees will have an effect on where landslides are likely to occur (e.g., [9]).
Hydrological effects can be measured readily in field conditions using established techniques, for example infiltrometers (permeability) or tensiometers (matric suctions). In contrast, mechanical reinforcement is difficult to quantify in the field due to the lack of suitable measuring equipment. To assess the stability of a rooted slope in situ, one has to consider that:
- Access to the site can be limited, e.g., due to a steep slope. Field equipment should therefore be portable by an operator on foot;
- Soil strength and root growth varies spatially and temporally. Therefore, it is important that sufficient measurements are taken across a site and at different points in time to assess which area might be most at risk. Measurements should therefore ideally be quick and easy to perform.
Various existing devices to measure the shear strength in situ all have notable drawbacks. Field shear vanes (for example as used by [10]), while portable, are optimised for use in soft cohesive soil (clay) and can cause significant soil disturbance during installation in rooted soil due to cutting of roots while pushing the device to the required depth, as previously observed in fibrous peats [11]. In contrast, field direct shear boxes require long test preparation times and the transport of heavy equipment onto sites [12,13,14,15]. Alternatively, mechanical root-reinforcement might be determined indirectly through measuring root quantities (for example by root sampling or root excavation (e.g., [9,16])) and the strength of individual roots. Interpretative models, such as those developed by Waldron [17] or Pollen and Simon [18] use this information to calculate an estimate for the root contribution to soil strength. In these, the increase in soil strength due to the mechanical action of roots is expressed as an additional soil cohesion term :
where is a factor accounting for the root orientation [14], a reduction factor accounting for sequential root mobilisation (often quantified using a fibre bundle model, e.g., [18,19]), is the tensile strength of a single root i, the cross-sectional area of root i, A the shear area of the soil, the average root tensile strength and the root area ratio, i.e., the fraction of a soil cross-section occupied by roots. Root sampling however is time-consuming, and because of the complicated mechanical interaction between soil and root such models often incorporate large assumptions, reducing their reliability.
Previously, Meijer et al. [20] proposed new, portable field investigation tools for root detection [21,22] and direct measurement of the rooted soil strength. One of these, the ‘corkscrew’, derives the shear strength of the rooted soil by measuring the resistance against pull-out extraction of the cylinder of soil caught within the screw (Figure 1c). Rotational installation ensures that soil and roots are disturbed minimally prior to extraction (Figure 1b). Peak soil shear strengths measured with the corkscrew were similar to those measured using a field shear vane in non-rooted sandy clayey silt field soil at test depths exceeding 200 mm [23]. In a similar soil rooted with blackcurrant shrubs (Ribes nigrum L.), as well as in a sandy silt soil rooted with mature Sitka spruce (Picea sitchensis (Bong.) Carr), positive correlations were observed between measured root-reinforced soil strength and root quantities in the surface layers where roots were abundant [24].
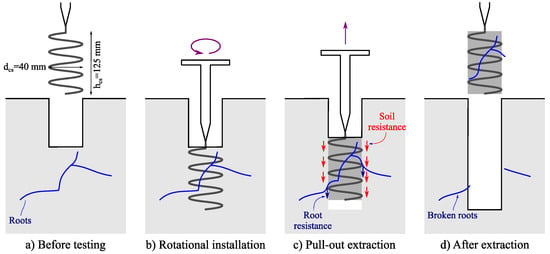
Figure 1.
Schematic view of corkscrew test approach.
These previous experiments were performed on relatively small areas (plots smaller than approximately 50 m) on flat or gently-sloping terrain. In this study, the corkscrew method was used on steep slopes covered with different types of vegetation, covering larger areas of land (plots of ≈1000 m), thus reflecting more realistic field conditions associated with slope stability field assessments. These experiments had the following objectives:
- To study whether different land uses (natural unforested slope, forested slope, clearfelled slope) influenced the soil shear strength;
- To test the performance of the corkscrew by comparing results with standard shear vane measurements to identify the potential merits of the newer technique;
- To assess the suitability of the corkscrew device on steep slopes.
2. Methods
2.1. Field Site and Soil Properties
Field experiments were performed at Loch Ard forest at the Queen Elizabeth Forest Park and neighbouring land at Comer Estate near Aberfoyle (UK) in April 2016 over the course of three days. The same 30 (approximately 1:2) south–south west facing slope of Gleann Dubh (561138.3 N 4334.2 W) was used in all testing. Measurements were taken at three different locations on this slope, all in close proximity (<2 km), reflecting different planting treatments:
- Natural, unplanted slope (henceforth indicated as ‘unplanted’ treatment), where no planted or natural forest was present. This site was overgrown with grass and bracken which had died back (Figure 2a), and some low native willow shrubs were scattered across the slope;
 Figure 2. Pictures of measurement locations: (a) natural ‘unplanted’ slope, (b) mature Sitka spruce ‘forested’ slope and (c) ‘clearfelled‘ site.
 - Mature Sitka spruce (Picea sitchensis) forest (‘forested’) nursed with Lodgepole pine (Pinus contorta Dougl. ex Loud.), planted in 1955. Trees were planted approximately 2 m apart. No significant understory vegetation was present (Figure 2b);
- ‘Clearfelled’ site, where a Sitka spruce crop was harvested between 2007 and 2009 (i.e., 7–9 years prior to testing), leaving large tree stumps and some brushwood, and since left untouched. This site was overgrown with grass, moss, patchy heather and/or some natural regeneration (Figure 2c).
Because treatments were all in close proximity and had a similar soil type, the soil was classified based on the particle size distribution of a mixed sample taken from 150–250 mm depth on the ‘unplanted’ and ‘clearfelled’ slope. The depth of the various soil horizons was established using extracted soil samples.
At three locations within every treatment, soil dry bulk density and gravimetric water content were determined along a vertical profile using 100 cm core samples extracted using a hand-operated soil core sampler. Samples were oven-dried at 105 C for 24 h in accordance to the British Standard (BS1377-2:1990).
At the same locations soil matric suction was measured at 250 mm depth using field tensiometers (2725ARL Jet Fill, Soilmoisture Equipment Corp.), which were left to equilibrate for at least 6 h after installation before readings were taken. On three occasions no reliable suctions were measured. This was attributed to poor contact between the tensiometers and the surrounding soil, and these measurements were therefore discarded.
2.2. Soil Shear Strength Measurements
At each treatment site, three cross-slope transects of five measurement locations were set out for measuring the shear strength of the soil using the corkscrew method. Transects and measurement locations were spaced approximately 7.5 m apart. All measurements were collected at similar altitudes (210–230 m a.s.l.) to exclude altitude effects and to maximise the chance that soil types were comparable between treatments (Figure 3). A 400 kV overhead power line runs across the slope towards the toe, such that the site is also representative of one where slope stability assessment for forestry activities may be necessary for ensuring the safety of, and access to, infrastructure (in this case, part of the national strategic power distribution network).
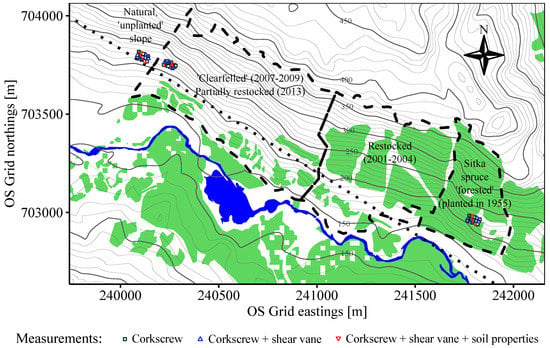
Figure 3.
Map of measurement locations, topography and vegetation. Coordinates are given in UK National Grid coordinates [25]. The dotted black line indicates an overhead 400 kV power line on large pylons. Dark blue areas indicate surface water (data from ‘OS Open Map—Local’, licensed under the Open Government Licence v3.0). Contour line data (altitudes in metres a.s.l.) from ‘OS Terrain 50’ data (licensed under the Open Government Licence v3.0). Green areas indicate current forest cover (Forestry Commission data, crown copyright). Soil properties measured are dry bulk density, water content, soil suction.
The corkscrew used is supplied as a garden corkscrew weeder (De Wit, Kornhorn, The Netherlands). The height of the screw was mm, the diameter mm, the diameter of the helix 6 mm and the helix pitch approximately 28 mm, similar to Meijer et al. [20], Meijer et al. [23], Meijer et al. [24].
To speed up measurements for a simple and practical test procedure, in contrast to previous corkscrew experiments [24] only the peak strength was recorded using a 500 kg load cell (DBBE-500kg-003-000, Applied Measurements Ltd., Aldermaston, UK) connected to a hand-held portable strain gauge indicator (TR150, supplied by Applied Measurements Ltd., UK). Corkscrews were installed by hand and extracted using a custom-made fulcrum and lever (Figure 4). The extraction rate was estimated as 0.75–1.50 m min, which lies within the range of typical landslide displacement rates [26].
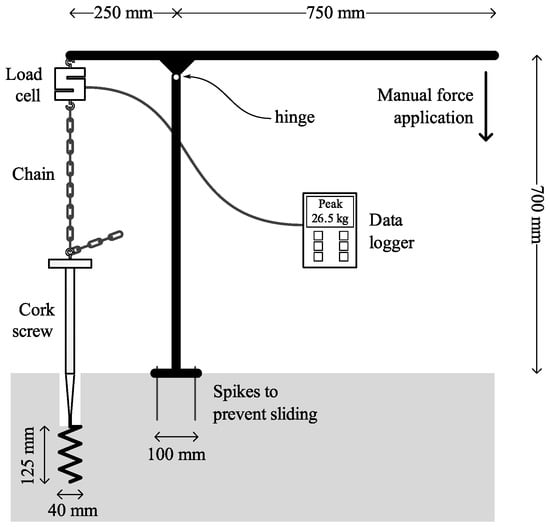
Figure 4.
Schematic corkscrew measurement setup.
The peak shear strength of the rooted soil was estimated by dividing the maximum measured corkscrew pull-out force () over the shear area:
At every measurement location corkscrew tests were performed at various depths (0–125, 125–250, 250–375, 375–500 and 500–625 mm depth when possible) with each test at increasing depth within the narrow hole left open by the previous test at shallower depth. If the target installation depth could not be reached, e.g., because of large stones, the actual installation depth was recorded and the shear strength compensated for the smaller area of the shear plane. If the difference between target installation and actual installation depth exceeded , the test and all subsequent tests at greater depths were abandoned. Corkscrews were installed vertically, rather than perpendicular to the slope, as this was thought to yield more consistent results as the slope gradient varied across the site. Perpendicular installation however is possible and might be more beneficial in some cases as this makes it easier to reach greater depths. One of the advantages of the corkscrew is that at the same time as measuring the soil shear strength, (disturbed) soil samples are extracted. All extracted corkscrew soil plugs were put in sealed plastic bags and stored in a fridge at 4 C for a maximum of 7 days.
At every other corkscrew measurement location (7 locations per treatment), standard field shear vane measurements were performed using a conventional vane fitted with 29 mm high and 19 mm wide cruciform blades (Edeco Pilcon). Three to eight measurements of peak and residual strength were made per location covering the depth range of corkscrew testing at those locations as well as practicable. The shear vane device used could provide measurements up to 515 mm depth. To enable comparison between vane and corkscrew readings, standard vane readings were classed as belonging to one of five depth ranges (0–125, 125–250, 250–375, 375–500 and 500–625 mm), equalling corkscrew depths.
2.3. Measurements of Root Volume and Gravel Fractions
Further, more detailed physical measurements were made for the two corkscrew samples yielding the highest shear strength and the two yielding the lowest strength per treatment and depth level. This was only done for treatments and depth levels where the number of successful corkscrew tests was four or higher. For the ‘forested’ site at 0–125 and 125–250 mm depth, the four strongest samples instead of the two strongest samples were analysed because of large observed variations in strength.
For each selected corkscrew sample, total mass, volume and gravimetric water contents were measured, which enabled the average dry density to be calculated. Subsequently, root material was collected by careful washing of the extracted soil plug on a 2 mm sieve. The root length per root diameter class was subsequently analysed using WinRhizo (Regent Instruments Inc., Québec, QC, Canada) using 0.1 mm wide root diameter classes. The root volume fraction was expressed as the volume of roots (WinRhizo) over the measured volume of the extracted core. The soil material retained on the sieve was oven dried at 105 for 24 h and the particle size mass fraction determined using 2, 4, 8 and 20 mm sieves. The gravel mass fraction was defined as the dry mass of gravel (particle size mm) divided by the dry mass of the extracted corkscrew soil plug.
2.4. Predicting Mechanical Root-Reinforcement
To make predictions for the root-reinforcement (using Equation (1)), both the root area ratio and the root tensile strength are required. Assuming a uniform distribution of root orientations, following Bengough et al. [27] can be estimated based on the measured root volume fraction :
The tensile strength of Sitka spruce roots was experimentally determined. Sitka spruce roots were sampled from the same locations as soil suction measurements in the mature forest (see Figure 3) and stored in sealed plastic bags in a fridge (4 C) for a maximum of 4 days before testing. A total of 32 roots with a length of 100 mm were tested for tensile strength and stiffness properties using a universal testing machine (Instron 5966, Instron, High Wycombe, UK) at an extension rate of 5 mm min. The tested root diameter range was mm, measured using a microscope fitted with an eyepiece graticule (measurement accuracy ± 1%, see [24]). The relation between root diameter and root tensile strength () or Young’s modulus (stiffness, ) was fitted using power law curves (e.g., [28]):
where is the root diameter [mm], mm (a reference diameter) and , , and are fitting parameters. No tensile tests were performed on bracken or heather roots.
2.5. Statistical Analysis
All statistical analyses were performed using R statistical software [29]. Soil dry bulk densities were compared using the Welch t-test (t.test() function in R). Because measured corkscrew and shear vane shear strengths were not normally distributed, the non-parametric Kruskal–Wallis test (kruskal.test()) was used to compare measured shear strengths between the two test devices and between treatments. The observed variation in corkscrew shear strength was investigated using principal component analysis (prcomp()) and linear regression (lm()). Significance levels are indicated as *** (); ** (); * ().
3. Results
3.1. Soil Characteristics
Based on the particle size distribution, the soil was classified as sandy silt (Figure 5). According to the Forestry Commission soil classification [30], the soil belongs to the brown earth soil group.
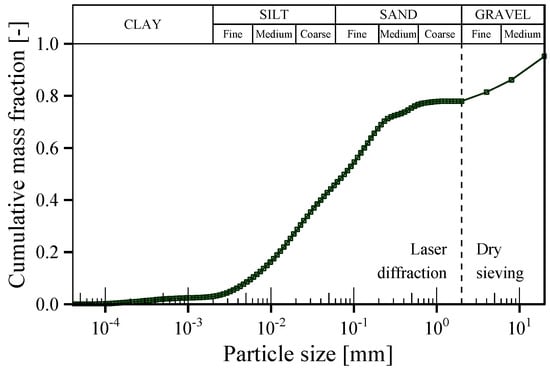
Figure 5.
Particle size distribution of a combined soil sample from the ‘unplanted’ and ‘clearfelled’ slope. Soils were sampled between 150 and 250 mm depth. A laser granulometer (LS 13320, Beckman Coulter, Brea, CA, USA) was used to quantify the amount of particles smaller than 2 mm, while dry sieving was adopted for particles >2 mm.
At all treatment locations, a 10–30 mm layer of litter was present which was thickest on the ‘forested’ and thinnest on the ‘clearfelled’ site. Topsoil (A horizon) was found down to approximately 150 mm depth. Below that, orange-coloured subsoil (B horizon) was found to 500 mm depth, the largest depth for which soil horizons could be reliably established based on visual observations on extracted soil samples. In the forest however the bedrock appeared to be much shallower than in the other treatments, with the C horizon (substratum), containing significant amounts of rock, observed at approximately 300 mm depth.
The various treatments showed considerable variation in measured soil dry bulk densities (measured on core samples), gravimetric water contents and suction pressures (Figure 6).
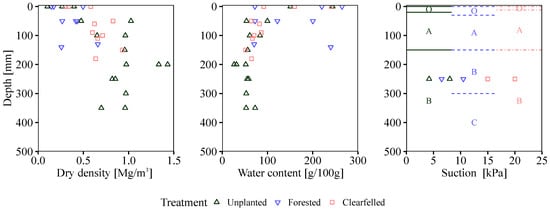
Figure 6.
Soil bulk dry density, gravimetric water content, matric suction and soil horizons. One gravimetric water content measurement on the ‘unplanted’ slope ( g/100 g at 21 mm depth) was excluded from the graph to improve readability.
Interestingly, the dry density in the A-horizon was significantly lower in the forest ( Mgm, mean ± standard deviation, ) compared to the ‘unplanted’ ( Mgm, ) and ‘clearfelled’ treatments ( Mgm, ). t-test p-values were 0.016 and 0.008 respectively.
Measured suctions were greatest on the ‘clearfelled’ slope, possibly due to warmer temperatures. On the day before and during the three days of testing the weather was sunny with temperatures around 15–20 C. Because of soil drying, suctions measured on the ‘clearfelled’ slope (measured on test day 2) were expected to be greater than those on the ‘unplanted’ slope (day 1). This drying effect might have been smaller in the forest (day 3) because of the shading provided by the tree canopy.
Apart from in the the surface layer (0–125 mm depth), a large amount of gravel (>2 mm particle size) was present in all treatments (Figure 7c). There was a significant positive correlation between the dry density of the extracted corkscrew sample and the mass fraction of gravel in these samples (), see Figure 8.
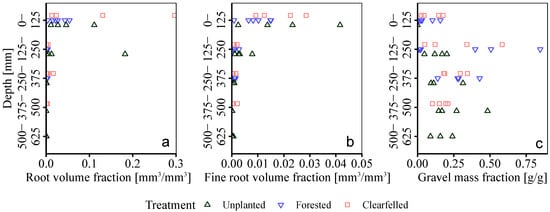
Figure 7.
(a) Volume fraction of all roots, (b) volume fraction of roots with root diameters below 2 mm and (c) mass fraction of gravel (soil particles with diameters above 2 mm).
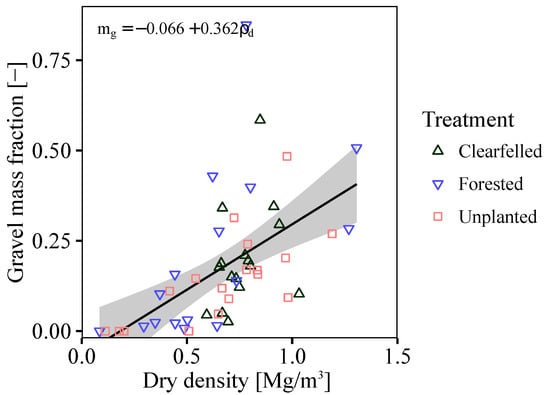
Figure 8.
Relationship between dry density and gravel mass fraction of extracted and subsequently analysed corkscrew samples.
3.2. Root Characteristics
Measured root volumes rapidly decreased with depth (Figure 7a,b). Roots in the different treatments belonged to different species: on the ‘unplanted’ slope most of the roots consisted of (black) bracken roots, on the ‘clearfelled’ slope they were largely grass roots with some (thicker) roots thought to be heather or old Sitka spruce roots and on the ‘forested’ slope roots belonged to the tree species present. Especially on the ‘forested’ (Sitka spruce) and ‘unplanted’ slope (bracken) a large part of the root volume consisted of thick roots ( mm).
Although the root volume measurements of fine roots (i.e., mm) were thought to reflect the real fine root volumes in the soil well, the measured root volumes of thicker roots should only be treated as indicative. For thick roots, a larger length of root will be embedded in the surrounding soil compared to in the corkscrew, causing thick roots to potentially remain in the soil rather than to be extracted with the corkscrew, resulting in underestimations of their volumes.
The shallow rooting pattern was confirmed by observations on overturned trees in the Sitka spruce forest (Figure 9). The maximum rooting depth was approximately 500 mm depth. The majority of roots however were located in the very surface layer (approx. 0–100 mm), forming a dense root mat.
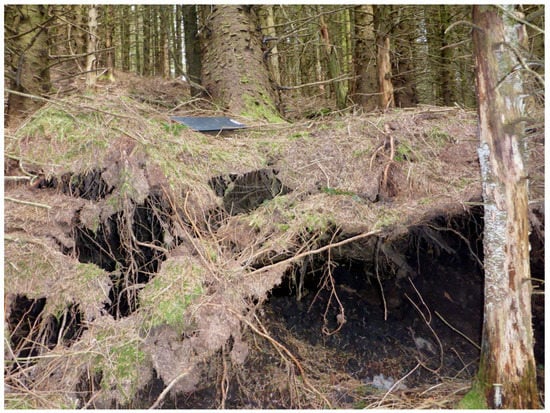
Figure 9.
Overturned Sitka spruce tree on the ‘forested’ slope. Black A4 clipboard for scale.
The measured root tensile strength and stiffness increased with increasing diameters, although the results show large scatter for both parameters (Figure 10). Exponential power fitting coefficients for tensile strength (, Equation (4)) and stiffness (, Equation (5)) were not significant.
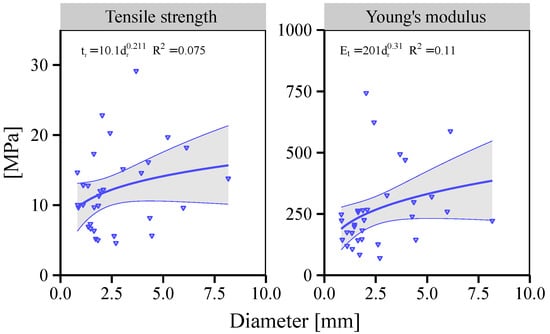
Figure 10.
Tensile strength and Young’s modulus for Sitka spruce roots. The best power law fit plus 95% confidence interval of this fit are indicated by solid lines.
3.3. Soil Strength Measurements
Corkscrew peak strength data showed an increase in strength with depth for all treatments, although variability at each depth was high (Figure 11). Large outliers were detected, reflecting the variability of soil and root conditions within treatments.
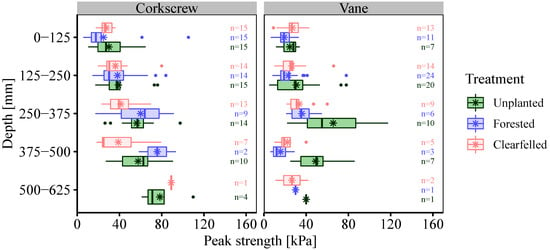
Figure 11.
Tukey boxplot of corkscrew and vane peak shear strength results. The ‘*’ symbol indicates mean strength per depth level and treatment, and ‘•’ indicates outlying points. Numbers on the right (n) indicate the number of successful measurements.
In all treatments, but especially in the ‘forested’ treatment, it proved difficult to obtain corkscrew measurements at depths >375 mm because of the proximity of bedrock and/or presence of large stones. This is reflected in the reduced number of successful corkscrew measurements. Similar refusal issues were encountered when using the shear vane, resulting in a lower number of successful tests at larger depth.
The average soil sensitivity (measured with the vane and defined as the ratio between the peak shear strength and the (residual) shear strength measured at large vane rotations) at different treatments and depth levels, ranged between and , and the average across all measurements was .
Comparing corkscrew shear strength measurements between treatments, grouped per test depth, showed that the effect of treatment is only significant at 0–125 mm depth () where the strength in the ‘forested’ slope is lower than in the ‘unplanted’ and ‘clearfelled’ slopes, and at 250–375 mm depth () where the ‘clearfelled’ slope demonstrated a relatively low strength. For vane testing, the effect of treatment on strength was only significant at 250–375 () and 375–500 mm depth (), where the strength measured on the ‘unplanted’ slopes was relatively high. Shear strengths measured with the corkscrew and the shear vane did not differ significantly, when analysed per treatment and depth level, apart from measurements at 125–250 mm depth in the ‘clearfelled’ () and ‘forested’ treatment () where the corkscrew measured larger strengths (Figure 12).
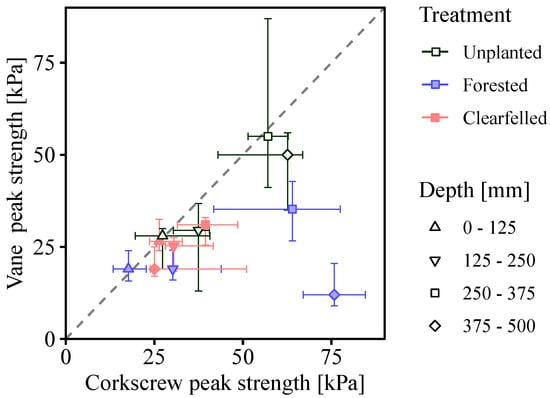
Figure 12.
Comparison of peak shear strengths measured with corkscrew and shear vane. Marker points indicate median values per treatment and depth while whiskers indicate the 25% and 75% quantile. Only measurement locations where both types of data were available are included.
To acquire further insight into what causes the large variation in the measured shear strength using the corkscrew method, further statistical analysis was performed on data acquired between 0 and 375 mm depth. The correlation matrix (Table 1) revealed a complex pattern of significant and almost significant interactions between variables, which was further explored using principal component analysis on this matrix.

Table 1.
Correlation matrix (Pearson) for corkscrew shear strength data acquired between 0 and 375 mm depth. Values in brackets indicate the significance level of the correlation. *** (); ** (); * ().
Of the variation in the data, 70% could be explained by the first two principal components (Figure 13). The first principal component (PC1) accounts for the strong correlation between shear strength, depth, dry density and the gravel fraction. This can be understood as the variation in the contribution of soil component towards the combined soil–root shear strength: greater depths and increased densities both increase the effective stress in the soil, while an increased amount of gravel will increase the soil friction angle. Both effects lead to an increase in soil shear strength. The negative contribution of the root fraction to PC1 reflected the decreasing root content with depth. The second, much weaker, principal component (PC2) reveals the positive contribution of roots to the measured soil–root shear strength. In summary, this analysis suggests that the variations in the measured shear strength of the rooted soil were dominated by variations in the strength of the soil rather than variations in root-reinforcement. This helps to explain why differences in measured shear strengths between treatments were largely non-significant.
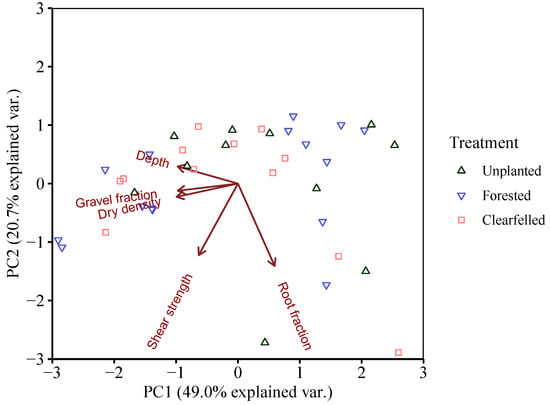
Figure 13.
Principal component analysis results using corkscrew shear strength data obtained at 0–375 mm depth.
Both the shear strength–dry density/depth/gravel trend (PC1) and the shear strength–root fraction trend (PC2) were explored in more detail. For soil depths with relatively few roots (depth > 125 mm), Figure 14 shows a clear positive relationship between both the measured dry density and the mass fraction of gravel versus the peak shear strength of the extracted corkscrew sample.
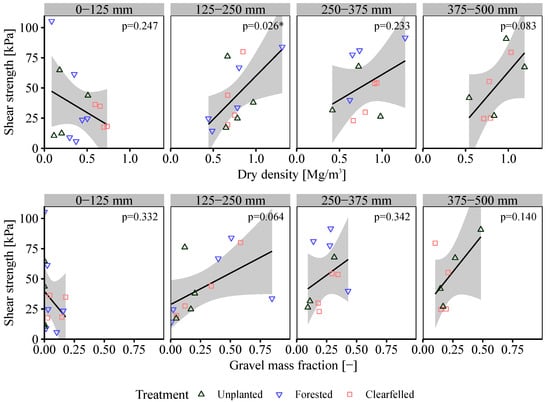
Figure 14.
Relation between corkscrew sample bulk dry density, gravel mass fraction and corkscrew peak shear strength. p-values for the statistical significance of the gradient of the linear regression line are given.
In the heavily rooted top layer of soil (0–125 mm depth), on the ‘forested’ slope a significant relation between root volume fraction and measured soil strength was found (Figure 15). This confirms the beneficial effect of roots on the shear strength of soil (through mechanical and/or hydrological effects). For the ‘unplanted’ slope, there are indications of a smaller but non-significant trend. For the ‘clearfelled’ slope, no significant relation was found between root volume and root-reinforced soil strength. The latter relation was however heavily skewed by the presence of a single test that contained a large piece of what was thought be decomposing heather taproot that was unlikely to have added significant reinforcement.
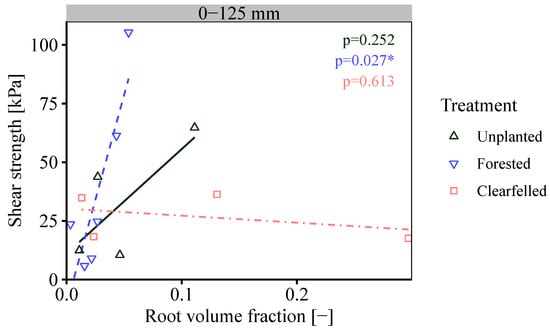
Figure 15.
Relation between corkscrew sample root volume fractions and corkscrew peak shear strength. p-values for the statistical significance of the gradient of the linear regression line are given for every treatment.
Roots washed out from corkscrew samples taken on the ‘forested’ slope were scanned and analysed using WinRhizo, providing information on root volumes and diameters. By combining this data with the tensile strength fit (Equation (4)) and assuming isotropic root orientations (Equation (3)), the correction factor in Equation (1) could be determined from the gradient of the linear regression line in Figure 16, resulting in ().
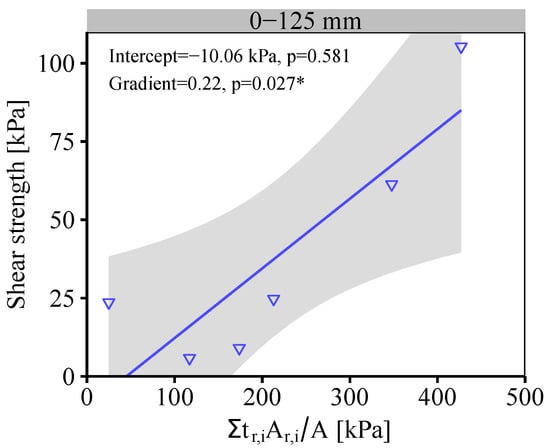
Figure 16.
Correlation between measured corkscrew peak soil shear strength and the sum of root tensile strength and root area ratio (), see Equation (1), in the surface layer (0–125 mm depth) of the ‘forested’ slope.
3.4. Performance of Corkscrew and Shear Vane
Seldom could the maximum corkscrew test depth of 625 mm or the maximum shear vane depth of 515 mm be reached (Figure 17). It proved slightly easier to reach larger depths using the corkscrew than using the shear vane, likely because of the larger size of the device and therefore the ability to navigate around stones. In contrast, because of the shape of the shear vane device it was prone to getting stuck on stones, increasing the likelihood of having to abandon the test.
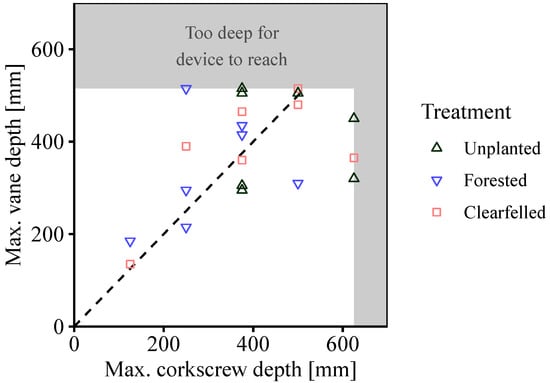
Figure 17.
Maximum test depth reached with corkscrew and shear vane devices. Every point indicates a single measurement location.
Corkscrew testing was quick to perform, and on average approximately 10 min were required to measure and record the shear strength depth profile at one location (4–5 tests per profile), including sampling of the extracted soil cores. Shear vane testing could be performed slightly faster, mostly because this test method did not double as a soil and root sampling technique.
4. Discussion
4.1. Root Biomechanics and Root-Reinforcement
Sitka spruce root samples measured in this experiment were stronger (63%–112%, comparing power law fits; larger differences corresponding with thicker roots) and stiffer (77%–214%) than previously measured in a similarly aged (54 years old) Sitka Spruce forest near Lundie, UK [24]. Measured average tensile strengths (–20 MPa) were however smaller than previously measured by others: Coutts [31] measured average tensile strengths of 15–63 MPa and an average stiffness of 900 MPa for 4–10 mm Sitka spruce roots (although these values were calculated using underbark rather than overbark root diameter), while O’Loughlin and Ziemer [6] reported an average tensile strength of 23 MPa and Parr and Cameron [32] a tensile strength range of 35–50 MPa for roots thinner than 2 mm. These differences may reflect both genetic and environmental factors: significant genotypic variation is present in different geographical populations of conifers including Sitka spruce (e.g., [33]). Root strength properties depend on the soil type and local physical conditions, hydrological conditions, wind loading, slope angle etc. (e.g., [34]). These results suggest that biomechanical properties derived at one site might not necessarily resemble those for the same species at different sites.
Many authors have observed a negative relation between root diameter and root tensile strength (e.g., [28,35]), while in this study a (non-significant) positive relationship was found. While less common, positive relationships has been observed previously for Sitka spruce [24], alpine tree species on some sites tested by Vergani et al. [36] or other woody species such as buxus, holly and blackthorn [37].
In the surface layer (0–125 mm) of the ‘forested’ slope, a significant positive correlation was found between root volume and measured root-reinforced shear strength (as measured with the corkscrew, see Figure 16). This confirms that roots increase the shear strength of soil, as previously found by many authors (e.g., [1]). Therefore increasing the density of tree roots would be expected to improve the stability of vulnerable slopes. The calculated parameter , required as input in the commonly used root-reinforcement quantification model (Equation (1)), agrees well with previously measured values using the corkscrew for soils rooted with Sitka spruce () or blackcurrant shrubs () [24]. Previous laboratory direct shear tests by Pollen and Simon [18] on switchgrass (), Loades et al. [38] on barley () or Operstein and Frydman [39] on various plant roots () are also comparable.
4.2. Factors Influencing Soil Strength
Corkscrew shear strength was controlled by soil density, gravel content, depth and root-reinforcement. In the surface layer (0–125 mm) of the ‘forested’ treatment, a significant part of the observed variation in measured soil shear strengths could be attributed to reinforcement by roots. However, the shear strength was smaller than measured on the ‘unplanted’ and ‘clearfelled’ slopes. This can be explained by the relatively small soil bulk densities measured in the ‘forested’ stand. Even though this layer was heavily rooted with tree roots, this might not have fully compensated for the decrease in the soil component of the total shear strength due to smaller soil densities.
In deeper seated layers, where rooting was sparse and therefore root-reinforcement small, the variation in peak shear strength as measured with the corkscrew was mainly driven by local variations in soil dry densities and the mass fraction of gravel. Since these showed considerable variation across the site, a large variation in measured strengths was observed, obscuring any difference between treatments in terms of root-reinforcement.
To study whether the measured variation in corkscrew shear strength was caused by inaccuracies in the corkscrew method itself, the coefficient of variance (COV) of measured corkscrew strengths was compared to COVs obtained with the corkscrew at other sites: (a) ‘Schoolfield’, an agricultural field at rest, consisting of sandy clayey silt [23], (b) ‘Bullionfield’, an agricultural field rooted with Blackcurrant shrubs (Ribes nigrum) in slightly clayey sand [24] and (c) ‘Halliburton Hill’, a Sitka spruce plantation on a natural sandy silt slope [24].
This analysis showed an increase in COV when moving from sites with relatively uniform conditions (non-rooted, relatively homogeneous agricultural soil) to more heterogeneous sites (rooted, natural soils, slopes) in the order ‘Schoolfield’ → ‘Bullionfield’ → ‘Hallyburton Hill’ → ‘unplanted’ and ‘clearfelled’ → ‘forested’ (Figure 18). This indicates that measured variation in this study is mainly due to the heterogeneous site conditions rather than an artefact introduced by the measurement method.
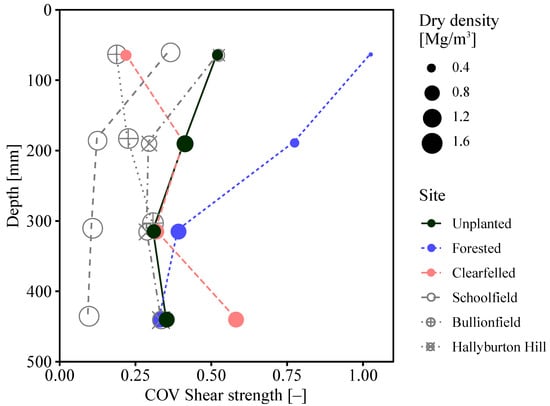
Figure 18.
Comparisons of the coefficient of variance of measured corkscrew peak shear strength for various sites.
4.3. Comparing Corkscrew and Shear Vane
Near the soil surface, at 0–125 mm depth, strengths measured with the conventional shear vane were very similar to those measured with the corkscrew. Although on the ‘unplanted’ slope at increasing depths corkscrew and vane measurements were similar, on the ‘clearfelled’ and especially the ‘forested’ slope corkscrew strengths were comparatively higher (Figure 12). Several explanations for these results are put forward. (1) Effect of large roots: Since these differences occurred in (historically) ‘forested’ slopes but not on the ‘unplanted’ slope, differences might have been caused by (decaying) tree roots. Although Figure 7 suggested that root volumes were small at these depths, it was known that the root sampling strategy will have underestimated the volume of thick roots. If these roots were present at greater depths, the vane device will have struggled measuring their effect while the corkscrew is more likely to have measured their reinforcement due to less disturbance during installation; (2) Effect of gravel: Soils were stony, especially on the ‘forested’ slope. Corkscrew readings are likely to be higher in stony ground as during installation the screw will locate between stones while, during extraction, they will increase the extraction force due their interaction with the shear plane. In contrast, stones will have been pushed aside during installation of the vane, thus heavily disturbing the soil potentially resulting in weaker strengths compared to non-stony soil; (3) Effects introduced by limited installation depths: In many corkscrew and vane tests, the target installation depth could not be reached. Therefore, at higher depths there will be a relative overabundance of measurements in weaker, non-stony soil, since these will have been more easily penetrated. Since the corkscrew was more likely to penetrate ‘difficult’ soil layers, average strengths were likely higher than those measured with the standard shear vane.
4.4. Suitability of the Corkscrew Device
This study shows some of the difficulties associated with field measurement of root-reinforcement in forested areas: the large variation in site characteristics make it difficult to accurately capture the influence of individual soil and root parameters. In addition, the presence of thicker (tree) roots in the relatively small corkscrew sample will have had a significant effect on the variation in measured strengths. Both emphasise the importance of conducting a large number of tests so that this variation can be taken into account in slope stability analyses.
An indication of the required amount of corkscrew tests was estimated using the experimentally measured data (Table 2). For every treatment and depth level, the shear strengths were fitted with a normal distribution. This distribution was then used to estimate the sample size required to be 80% confident that the mean strength of a new set of experiments will lie within 10%, 20% or 30% of the true mean. The results (Table 2) show more measurements are required in the surface layers of the ‘forested’ treatment (0–250 mm depth) compared to the other treatments and that, with increasing depth, fewer measurements will suffice to obtain the same reliability. Based on this analysis, if a sample size of 15 would be adopted for example (as in this study), the mean strength of the slope can be determined within 20% of the ‘real’ mean strength with 80% certainty, apart from in the surface layer of the forest where the accuracy will be lower (≈34%).

Table 2.
Estimation of corkscrew sample size. , and N indicate the mean, standard deviation and sample size in the field experiments. is the minimum sample size required so that the mean of a new set of measurements is within x% of with 80% confidence.
The variability of the corkscrew strength measurements could be reduced by increasing the size of the device, since any local variations in for example root content, gravel content or soil density will average out. However, the scope of this research was to develop a hand-held tool that can be used on slopes with difficult access (e.g., foot access only), limiting the dimensions of the corkscrew device. Instead, increasing the number of samples appears more practical.
This study showed that the corkscrew has some additional advantages over standard vane testing in stony soil. Since stony soils such as glacial tills are common in the UK and abroad, the corkscrew will be a valuable field testing tool. Furthermore, the corkscrew has the additional benefit of providing (disturbed) soil samples that can be used for soil or root identification purposes.
The corkscrew was suitable for use on sites with difficult accessibility. It could be transported easily across sites and could be carried up steep (1:2 gradient) forested and non-forested slopes. Measurements were at least an order of magnitude faster (approximately 1 test every 2 min) than those attainable using shear box testing, although slightly slower than shear vane testing. Large stones with sizes exceeding the pitch of the diameter (>25 mm diameter) did however cause problems with installation, limiting the usefulness of the corkscrew in certain soils. More work is required to calibrate the corkscrew in real field conditions, covering a range of soils and vegetation types and to understand the most important factors determining the strength measured.
5. Conclusions
The corkscrew strength measurement method can be a useful, practical tool when assessing (rooted) soil strength on sites with difficult accessibility. Compared to the shear vane, it is less susceptible to installation problems in stony soils, while still providing a relatively quick test. An additional benefit is the simultaneous extraction of small soil samples that can be used for further root and soil analysis.
Significant positive relationships were found between root volume and soil strength in forested topsoil. No significant differences between the soil shear strength on the natural unforested slope, the forested slope and the clearfelled slope were found, though both clearfelled and unforested sites had other vegetation growing. Soil density and gravel content had a strong effect on the measured soil strength, thus masking any trend introduced by the forest management strategy. The large strength variation encountered highlighted the importance of properly accounting for the variation in soil strength when quantifying root-reinforcement, as well as the importance of a suitably large sample size when working across such heterogeneous slopes.
Author Contributions
Conceptualization, G.M., G.B., J.K., K.L. and B.N.; Methodology, G.M., G.B., J.K., K.L. and B.N.; Investigation, G.M.; Formal Analysis, G.M. and G.B.; Resources: G.M., G.B., K.L. and B.N.; Funding Acquisition: G.B., J.K. and B.N.; Original Draft Preparation, G.M.; Writing—Review & Editing, G.M., G.B., J.K., K.L. and B.N.
Funding
Gerrit Meijer acknowledges a studentship provided by Forest Research, funded by ClimateXChange, the Scottish Government’s Centre for Expertise on Climate Change. This research was further supported through EPSRC grant EP/M020355/1, which is a collaboration between the University of Dundee, the University of Southampton, the University of Aberdeen, Durham University and The James Hutton Institute. The James Hutton Institute receives funding from the Scottish Government.
Acknowledgments
The authors thank Jennifer Brown (The James Hutton Institute) for her help during field experiments, and Forestry Commission Scotland (Cowal and Trossachs Forest District) and Comer Estate for providing field access. Further thanks goes to Christine Hackett (Biomathematics and Statistics Scotland) for her advice on the statistical analysis.
Conflicts of Interest
The authors declare no conflict of interest.
References
- Norris, J.E.; Stokes, A.; Mickovski, S.B.; Cammeraat, E.; Van Beek, R.; Nicoll, B.C.; Achim, A. Slope Stability and Erosion Control: Ecotechnical Solutions; Springer: Dordrecht, The Netherlands, 2008. [Google Scholar]
- Nicoll, B.C.; Gardiner, B.A.; Rayner, B.; Peace, A.J. Anchorage of coniferous trees in relation to species, soil type, and rooting depth. Can. J. For. Res. 2006, 36, 1871–1883. [Google Scholar] [CrossRef]
- Stokes, A.; Atger, C.; Bengough, A.G.; Fourcaud, T.; Sidle, R.C. Desirable plant root traits for protecting natural and engineered slopes against landslides. Plant Soil 2009, 324, 1–30. [Google Scholar] [CrossRef]
- Coutts, M.P. Development of the structural root system of Sitka Spruce. Agric. For. Bull. 1983, 56, 1–16. [Google Scholar] [CrossRef]
- Coutts, M.P.; Nielsen, C.C.N.; Nicoll, B.C. The development of symmetry, rigidity and anchorage in the structural root system of conifers. Plant Soil 1999, 217, 1–15. [Google Scholar] [CrossRef]
- O’Loughlin, C.; Ziemer, R.R. The importance of root strength and deterioration rates upon edaphic stability in steepland forests. In I.U.F.R.O. Workshop P.1.07-00 Ecology of Subalpine Ecosystems as a Key to Management; Oregon State University: Courvallis, OR, USA, 1982; pp. 70–78. [Google Scholar]
- Preti, F. Forest protection and protection forest: Tree root degradation over hydrological shallow landslides triggering. Ecol. Eng. 2013, 61 Pt C, 633–645. [Google Scholar] [CrossRef]
- Watson, A.; Phillips, C.; Marden, M. Root strength, growth, and rates of decay: Root reinforcement changes of two tree species and their contribution to slope stability. Plant Soil 1999, 217, 39–47. [Google Scholar] [CrossRef]
- Moos, C.; Bebi, P.; Graf, F.; Mattli, J.; Rickli, C.; Schwarz, M. How does forest structure affect root reinforcement and susceptibility to shallow landslides? Earth Surf. Process. Landf. 2016, 41, 951–960. [Google Scholar] [CrossRef]
- Marriott, C.A.; Hood, K.; Crabtree, J.R.; Macneil, D.J. TRL Report 506: Establishment of Vegetation for Slope Stability; Technical Report; Transport Research Laboratory: Crowthorne, UK, 2001. [Google Scholar]
- Landva, A.O. Vane testing in peat. Can. Geotech. J. 1980, 17, 1–19. [Google Scholar] [CrossRef]
- Docker, B.B.; Hubble, T.C.T. Quantifying root-reinforcement of river bank soils by four Australian tree species. Geomorphology 2008, 100, 401–418. [Google Scholar] [CrossRef]
- Ekanayake, J.C.; Marden, M.; Watson, A.J.; Rowan, D. Tree roots and slope stability: A comparison between Pinus radiata and kanuka. N. Z. J. For. Sci. 1997, 27, 216–233. [Google Scholar]
- Wu, T.H.; McKinnell, W.P., III; Swanston, D.N. Strength of tree roots and landslides on Prince of Wales Island, Alaska. Can. Geotech. J. 1979, 16, 19–33. [Google Scholar] [CrossRef]
- Wu, T.H.; Watson, A. In situ shear tests of soil blocks with roots. Can. Geotech. J. 1998, 35, 579–590. [Google Scholar] [CrossRef]
- Danjon, F.; Reubens, B. Assessing and analyzing 3D architecture of woody root systems, a review of methods and applications in tree and soil stability, resource acquisition and allocation. Plant Soil 2008, 303, 1–34. [Google Scholar] [CrossRef]
- Waldron, L.J. Shear resistance of root-permeated homogeneous and stratified soil. Soil Sci. Soc. Am. J. 1977, 41, 843–849. [Google Scholar] [CrossRef]
- Pollen, N.; Simon, A. Estimating the mechanical effects of riparian vegetation on stream bank stability using a fiber bundle model. Water Resour. Res. 2005, 41, W07025. [Google Scholar] [CrossRef]
- Schwarz, M.; Lehmann, P.; Or, D. Quantifying lateral root reinforcement in steep slopes—From a bundle of roots to tree stands. Earth Surf. Process. Landf. 2010, 35, 354–367. [Google Scholar] [CrossRef]
- Meijer, G.J.; Bengough, A.G.; Knappett, J.A.; Loades, K.W.; Nicoll, B.C. New in-site techniques for measuring the properties of root-reinforced soil—Laboratory evaluation. Géotechnique 2016, 66, 27–40. [Google Scholar] [CrossRef]
- Meijer, G.J.; Bengough, A.G.; Knappett, J.A.; Loades, K.W.; Nicoll, B.C.; Mukov, I.; Zhang, M. In situ root identification through blade penetrometer testing—Part 1: Interpretative models and laboratory testing. Géotechnique 2018, 68, 303–319. [Google Scholar] [CrossRef]
- Meijer, G.J.; Bengough, A.G.; Knappett, J.A.; Loades, K.W.; Nicoll, B.C. In situ root identification through blade penetrometer testing—Part 2: Field testing. Géotechnique 2018, 68, 320–331. [Google Scholar] [CrossRef]
- Meijer, G.J.; Bengough, A.G.; Knappett, J.A.; Loades, K.W.; Nicoll, B.C. Comparison of new in situ root-reinforcement measuring devices to existing techniques. In Proceedings of the 16th European Conference on Soil Mechanics and Geotechnical Engineering (XVI ECSMGE): Geotechnical Engineering for Infrastructure and Development; Winter, M., Smith, D., Eldred, P., Toll, D., Eds.; Institution of Civil Engineers: London, UK, 2015; pp. 1621–1626. [Google Scholar] [CrossRef]
- Meijer, G.J.; Bengough, A.G.; Knappett, J.A.; Loades, K.W.; Nicoll, B.C. In situ measurement of root-reinforcement using the corkscrew extraction method. Can. Geotech. J. 2018, 55, 1372–1390. [Google Scholar] [CrossRef]
- Ordnance Survey. The National Grid. 2016. Available online: https://www.ordnancesurvey.co.uk/resources/maps-and-geographic-resources/the-national-grid.html (accessed on 26 May 2016).
- Davies, M.C.R.; Bowman, E.T.; White, D.J. Physical modelling of natural hazards. In Physical Modelling in Geotechnics, ICPMG 2010; Springman, S., Laue, J., Seward, L., Eds.; Taylor and Francis: London, UK, 2010; pp. 3–22. [Google Scholar]
- Bengough, A.G.; Mackenzie, C.J.; Diggle, A.J. Relations between root length densities and root intersections with horizontal and vertical planes using root growth modelling in 3-dimensions. Plant Soil 1992, 145, 245–252. [Google Scholar] [CrossRef]
- Mao, Z.; Saint-Andre, L.; Genet, M.; Mine, F.X.; Jourdan, C.; Rey, H.; Courbaud, B.; Stokes, A. Engineering ecological protection against landslides in diverse mountain forests: Choosing cohesion models. Ecol. Eng. 2012, 45, 55–69. [Google Scholar] [CrossRef]
- R Core Team. R: A Language and Environment for Statistical Computing; R Foundation for Statistical Computing: Vienna, Austria, 2013. [Google Scholar]
- Kennedy, F. The Identification of Soils for Forest Management: Field Guide; Forestry Commission: Edinburgh, UK, 2002. [Google Scholar]
- Coutts, M.P. Root architecture and tree stability. Plant Soil 1983, 71, 171–188. [Google Scholar] [CrossRef]
- Parr, A.; Cameron, A.D. Effects of tree selection on strength properties and distribution of structural roots of clonal Sitka spruce. For. Ecol. Manag. 2004, 195, 97–106. [Google Scholar] [CrossRef]
- Gapare, W.J.; Aitken, S.N.; Ritland, C.E. Genetic diversity of core and peripheral Sitka spruce (Picea sitchensis (Bong.) Carr) populations: Implications for conservation of widespread species. Biol. Conserv. 2005, 123, 113–123. [Google Scholar] [CrossRef]
- Loades, K.W.; Bengough, A.G.; Bransby, M.F.; Hallett, P.D. Biomechanics of nodal, seminal and lateral roots of barley: Effects of diameter, waterlogging and mechanical impedance. Plant Soil 2013, 370, 407–418. [Google Scholar] [CrossRef]
- Baets, S.D.; Poesen, J.; Reubens, B.; Wemans, K.; Baerdemaeker, J.D.; Muys, B. Correction to: Root tensile strength and root distribution of typical Mediterranean plant species and their contribution to soil shear strength. Plant Soil 2018, 426, 429–430. [Google Scholar] [CrossRef]
- Vergani, C.; Chiaradia, E.; Bischetti, G. Variability in the tensile resistance of roots in Alpine forest tree species. Ecol. Eng. 2012, 46, 43–56. [Google Scholar] [CrossRef]
- Boldrin, D.; Leung, A.; Bengough, A. Root biomechanical properties during establishment of woody perennials. Ecol. Eng. 2017, 109, 196–206. [Google Scholar] [CrossRef]
- Loades, K.W.; Bengough, A.G.; Bransby, M.F.; Hallett, P.D. Planting density influence on fibrous root reinforcement of soils. Ecol. Eng. 2010, 36, 276–284. [Google Scholar] [CrossRef]
- Operstein, V.; Frydman, S. The influence of vegetation on soil strength. Ground Improv. 2000, 4, 81–89. [Google Scholar] [CrossRef]
© 2019 by the authors. Licensee MDPI, Basel, Switzerland. This article is an open access article distributed under the terms and conditions of the Creative Commons Attribution (CC BY) license (http://creativecommons.org/licenses/by/4.0/).