Article

Carbon Limitation and Drought Sensitivity at Contrasting Elevation and Competition of Abies pinsapo Forests. Does Experimental Thinning Enhance Water Supply and Carbohydrates?

by
Victor Lechuga
1,
Vinicio Carraro
2,
Benjamín Viñegla
1,
José Antonio Carreira
1 and
Juan Carlos Linares
3,*
1
Departamento de Biología Animal, Biología Vegetal y Ecología, Universidad de Jaén, Ed. B3, Paraje las Lagunillas s/n, 23071 Jaén, Spain
2
Department of Land, Environment, Agriculture and Forestry, University of Padova. v. le dell’Università, 16-35020 Legnaro (PD), Italy
3
Department of Physical, Chemical and Natural Systems, Pablo Olavide University, Carretera de Utrera Km 1, 41013 Seville, Spain
*
Author to whom correspondence should be addressed.
Forests 2019, 10(12), 1132; https://doi.org/10.3390/f10121132
Submission received: 23 October 2019 / Revised: 5 December 2019 / Accepted: 7 December 2019 / Published: 11 December 2019
(This article belongs to the Section Forest Ecophysiology and Biology)

Abstract

:
Stand-level competition and local climate influence tree responses to increased drought at the regional scale. To evaluate stand density and elevation effects on tree carbon and water balances, we monitored seasonal changes in sap-flow density (SFD), gas exchange, xylem water potential, secondary growth, and non-structural carbohydrates (NSCs) in Abies pinsapo. Trees were subjected to experimental thinning within a low-elevation stand (1200 m), and carbon and water balances were compared to control plots at low and high elevation (1700 m). The hydraulic conductivity and the resistance to cavitation were also characterized, showing relatively high values and no significant differences among treatments. Trees growing at higher elevations presented the highest SFD, photosynthetic rates, and secondary growth, mainly because their growing season was extended until summer. Trees growing at low elevation reduced SFD during late spring and summer while SFD and secondary growth were significantly higher in the thinned stands. Declining NSC concentrations in needles, branches, and sapwood suggest drought-induced control of the carbon supply status. Our results might indicate potential altitudinal shifts, as better performance occurs at higher elevations, while thinning may be suitable as adaptive management to mitigate drought effects in endangered Mediterranean trees.

1. Introduction

Drought-sensitive forests are exposed to warmer and drier climates, whose effects are likely being modulated by competition [1,2,3]. As a consequence, the interrelation between stand-level density and tree-level water and carbon balances requires more research efforts [4,5]. Tree-to-tree competition is considered a critical biotic factor regarding tree water–carbon balances, stand-level dynamics, and forest functions [3,6]. Competition for irradiance, water, and nutrients modulates the tree physiology, enhancing drought-induced decline and mortality likelihood [7]. Specifically, trees exposed to intense competition display lower secondary growth and increased mortality likelihood following extreme drought events [8,9].
Water uptake and carbon metabolism are limited by drought according to the specific sensitivities of physiological processes, like hydraulic failure, carbon starvation, and phloem transport failure, to declining water availability [10,11,12]. Briefly, hydraulic failure appears to usually be related to a high xylem susceptibility to embolism [13,14,15], whereas carbon starvation is related to isohydric stomatal control [16,17]. Phloem transport failure is relative to carbon starvation and seems to be present when the drought-induced limitation of carbohydrate transport to growth exceeds the drought sensitivity of photosynthesis [12,18]. Consequently, the balance between water supply and demand, on the one hand, and sources and sinks of carbohydrates, on the other hand, characterize the inherent species’ drought sensitivity and determine how water and carbon relationships affect tree survival [11,14,19]. Indeed, the timing of this sequential reduction, in functions, such as gas exchange and growth, has been largely related to recent events of forest decline and mortality worldwide [11,16,17,18,19]. Nonetheless, the functional and structural dynamics of these critical processes in response to competition are still not well understood.
We focused on the hydraulic characteristics and seasonal patterns of sap flow density (SFD), gas exchange, secondary growth, and non-structural carbohydrate (NSC) of the drought-sensitive fir Abies pinsapo Boiss [20,21,22,23]. We assumed that xylem vulnerability to embolism places a physical limit for A. pinsapo tolerance to water shortage while the dynamics of NSC would be related to drought sensitivity, for the extent of isohydric regulation of the water potential, as well as the persistence of the drought [13,14,19]. Specifically, an increase in NSC concentrations should be expected beneath moderate drought, assuming growth ceases before photosynthesis, whereas NSC concentrations should decay under extreme drought conditions [10,11,12].
According to this general framework, we focused on low elevation stands, as they are subjected to higher than average drought conditions [20]. Here, we investigated the effects of experimental thinning, aimed to diversify the stand structure and reduce tree-to-tree competition, modulating drought stress in the remaining trees [23]. These results were compared to high elevation stands to account for contrasting competition and elevation. We hypothesized that the stomatal control, which regulates transpiration and prevents hydraulic failures, is related to stand density. In turn, carbohydrate reserves, which decrease as a consequence of the photosynthetic limitation caused by stomatal closure, should be improved in the remaining trees within the thinned stands. Specifically, we aimed: (1) To quantify the hydraulic conductivity and resistance to the cavitation of A. pinsapo trees under contrasting competition (thinned versus control) and elevation (low versus high elevation); (2) to quantify seasonal dynamics of SFD, gas exchange, secondary growth, and NSC content; and (3) to evaluate the relationships between the microclimate and carbon and water balances, and to what extent competition modulates them.

2. Materials and Methods

2.1. Experimental Design and Environmental Monitoring

Field experiments were conducted at the lower (36°43′ N, 4°58′ W, 1196 m; L thereafter) and higher (36°41′ N, 5°01′ W, 1734 m; H thereafter) elevation limits of A. pinsapo in the Sierra de las Nieves National Park (South Spain). Within the L sites, we compared two plots, previously subjected to thinning (TL1 and TL2), and two controls (CL1 and CL2); see detailed information of the sites in Table 1 and [23]. Following the same methodology reported in [23], we selected and measured the stand structure of two control plots within the H site (CH1 and CH2). The experimental thinning was carried out in 2004 while the current field sampling was performed throughout 2011, 2012, and 2013; therefore, it may be assumed as being representative of the long-term response of A. pinsapo trees to thinning.
Microclimatic conditions within each plot (air temperature, T, ºC; relative air humidity, RH, %; soil water content, SWC, % vol.) were monitored hourly and recorded by two dataloggers per plot. Two T-RH sensors per plot were located at 1 m above the ground while four SWC probes per plot were buried at 0.30 m. A detailed description of the instrumentation can be found in [23]. Vapor pressure deficit (VPD, kPa) was estimated using T and RH data [20,23].

2.2. Hydraulic Conductivity and Cavitation Vulnerability Curves

We selected 15 trees per stand (CL, TL, and CH) with sun-exposed branches in the lower third of the canopy to investigate the hydraulic conductivity and the percent loss of conductivity. We sampled one branch per tree. Branches were stored at 4 ºC in plastic bags and transported to the laboratory. Then, we removed the needles from the distal part of the branches and the leaf area was estimated using a scanner. Measurements were performed in the hydraulic conductivity laboratory of the Centre de Recerca Ecològica i Aplicacions Forestals (CREAF, Universidad Autónoma de Barcelona). Segments of ca. 18.5 cm in length and ca. 0.7 to 1 cm in diameter were cut under water, the bark was removed, and their proximal end was connected to a pipe system [24]. The circuit was filled with degassed distilled water. Hydraulic conductivity (Kh, m4 MPa−1 s−1) was calculated as the ratio between the flow through the segment (measured gravimetrically) and the pressure gradient (ΔP, ca. 6 kPa) [24]. Maximum hydraulic conductivity was estimated by injecting degassed distilled water at high pressure (ca. 100 kPa) to remove native embolism [24]. The specific hydraulic conductivity (Ks, m2 MPa−1 s−1) was calculated as the ratio between maximum hydraulic conductivity and the mean section of the sample, excluding the bark. Branch conductivity expressed per needle area (Kl, m2 MPa−1 s−1) was calculated as the ratio between the maximum hydraulic conductivity and needle area [25].
Vulnerability curves represent the relationship between the xylem water potential (Ψ) and the percent loss of conductivity (PLC) due to embolism [26,27]. The air injection method was used to establish the PLC, as it has been validated for several conifer tree species [28]. The samples were located inside a pressure chamber, with both ends protruding. Maximum hydraulic conductivity was measured; then, the pressure inside the chamber was increased to 1 MPa, maintained for 10 min, and reduced to the basal value of ca. 10 kPa. These steps were repeated, waiting 15 min between, until the conductivity of the sample was below 5% of the maximum conductivity, or when the pressure in the chamber reached 7 MPa. The residual pressure inside the chamber was maintained to avoid refilling. PLC was calculated as:
PLC = 100*(Kmax − Kh)/Kmax,
where Kh is the hydraulic conductivity obtained in each measurement and Kmax is the maximum hydraulic conductivity. Vulnerability curves were fitted by the following equation [29]:
PLC = 100/(1 + e^(a(ψ − b))),
where ψ is the applied pressure, b is the pressure at a 50% loss of hydraulic conductivity, and a is the fitted slope of the curve. Regression parameters were calculated by least squares after linearizing as:
ln(100/(PLC − 1)) = aψ − ab.
The relationship observed between ln(100/PLC − 1) vs. ψ was also fitted by a linear function, whose parameters (slope and intercept) were compared among treatments (elevation and thinning) [24,25,29]. Some samples were discarded due to the shape or length not being suitable for the measure system; the final number of suitable samples was 7 for CL, 7 for TL, and 4 for CH, respectively.

2.3. SAP Flow Measurements

Sap flow density (SFD) was estimated by Granier sensors [30]. Heat dissipation probes were manufactured in the laboratory of the Department of Land, Environment, Agriculture, and Forestry of the University of Padova, Italy (http://intra.tesaf.unipd.it/cms/carraro/doc/application.pdf). Sensors were installed in six trees within the CL1, CL2, TL1, and TL2 plots, and five trees within the CH1 and CH2 plots, respectively. Sap flow sensors were installed on dominant trees within each plot; sensors were replaced annually or bi-annually at new positions on the tree [31]. Sap flow estimates were corrected for radial variability in the sap flow density according to the methodology described by [32,33] while a correction coefficient was used to obtain the mean sap flux per sapwood area according to the methodology described by [23,34]. The diameter at 1.3 m (DBH) of the trees was between 17.2 and 37.0 cm DBH in the low altitude population (CL mean DBH: 25.0 ± 1.4 cm; TL mean DBH: 23.3 ± 1.6 cm), and between 11.4 and 61.4 cm DBH within the high elevation (CH mean DBH 35.4 ± 4.7 cm). the energy supply was inadequate during some winter months due to snow cover and limited solar radiation; nonetheless, comparisons were performed for matching time periods among all plots. Thereafter, the mean SFD of each treatment was calculated as the mean of the operative sensors (between 4 and 12) in each treatment. Missing data due to occasional sensor failure were not filled out.

2.4. Secondary Growth, Gas Exchange Variables, and Xylem Water Potential

Secondary growth for the years 2011–2013 was estimated by band dendrometers (D1 Permanent Tree Girth, UMS, Munich, Germany). Sampled trees covered a DBH range between 6 and 44 cm (18.9 ± 0.9 cm on average, [23]). Changes in tree girth were recorded monthly between October and March, and biweekly between April and September [23] while secondary growth was expressed as tree-ring width increments (mm). CL plots were monitored by 37 dendrometers (26 CL1, 11 CL2), TL plots were monitored by 24 dendrometers (12 TL1, 12 TL2), and CH plots were monitored by 21 dendrometers (10 CH1, 11 CH2).
Leaf gas exchange (stomatal conductance to water vapor, gs; and net C assimilation, AN) were monitored throughout three years (2011–2013) on five to six trees per treatment. Measurements were made on a twig terminus carrying 1- to 3-year-old needles, using a LI-6400 Photosynthesis System (Li-Cor Inc., Lincoln, NE, USA). In all the cases, before the measuring set, the device was calibrated in situ. In order to achieve reliable measurements, it is necessary to maintain stable reference conditions within the device. Due to the non-availability of a CO2 source to maintain a stable CO2 concentration inside the chamber and apparatus, we buffered the CO2 concentration by a 5-L bottle attached to the reference socket. The measurements were always carried out in the central hours of the day, selecting terminal branch sections, about 5 cm in length, in 3 branches per tree. Measurements were averaged for each tree. Each measurement lasted 90 s, taking one data measurement every 5 s (18 repeated measurements per sampling event), and the measurements began when AN and gs rates were steady. After each measurement, branches were stored in paper envelopes, to scan and determine the leaf area. In order to calculate the leaf area, we obtained a linear relationship between the dry weight and area [20]. Thus, needles were dried at 70 °C in an oven to a constant weight and the needle area was calculated from the empirical relation of 40.46 cm2 g−1 [20].
Simultaneously to the gaseous exchange measures, the xylem water potential (Ψ) was measured in the same trees by a Scholander pressure chamber (PMS 100, PMS Instrument Co., Corvalis, Oregon, OR, USA). The sampling strategy was the same as for the gas exchange measurements, using sun-exposed branches as well. The selected branches were in a terminal position and had about a 15-cm length and 0.5-cm diameter. After the measurements, branches were stored in paper envelopes and maintained in the cold until analysis of the non-structural carbohydrates.

2.5. Non-Structural Carbohydrates

Seasonal dynamics of the non-structural carbohydrates (NSCs, i.e., free low molecular weight sugars: Glucose, fructose, and sucrose; and starch) were estimated in the same days as the gas exchange and Ψ sampling. Samples were taken from needles, branches, and stem (sapwood). Sampled trees were the same as those selected for gas exchange and Ψ, except for the sapwood samples, which were taken from thicker trees, using a 12-mm diameter increment borer and extracting about 4-cm sapwood cores. The enzymes present in the samples were denatured within a maximum of 6 h, by means of a thermal shock in a microwave oven (600 W of power for 90 s) [35]. Subsequently, the samples were dried at 75 °C to a constant weight. Once dried, the needles were separated from the branch and the bark and cambium were removed. The needles, branches, and trunk samples were ground to obtain a very fine and homogeneous powder using a ball mill. The powder obtained after this procedure was stored in hermetic plastic bags and stored at 4 °C until the analyses.
Samples were analyzed for total soluble sugars and starch using ethanol and perchloric acid [36]. Total soluble sugars were extracted from the tissues in 80% v/v ethanol at 80 °C for 1 h. The supernatant was collected after centrifugation and the concentration of total soluble sugars was determined spectrophotometrically by the resorcinol method at a wavelength of 520 nm, using sucrose as the standard. Starch was extracted from the ethanol-insoluble fraction by agitating for 1 h with 35% v/v perchloric acid [37]. This method of extraction can yield starch values higher than those estimated by more accurate enzyme methods, probably as a result of hydrolysis of some cell wall components [38]. However, this should not be a main limitation in our study, as we were interested primarily in the relative concentrations among controls and thinned plots and their temporal patterns. The starch determination procedure was similar to that used for sugars but used glucose as the standard. Starch and soluble sugars were added to represent total NSCs (mg g−1 dry mass).

2.6. Statistical Analyses
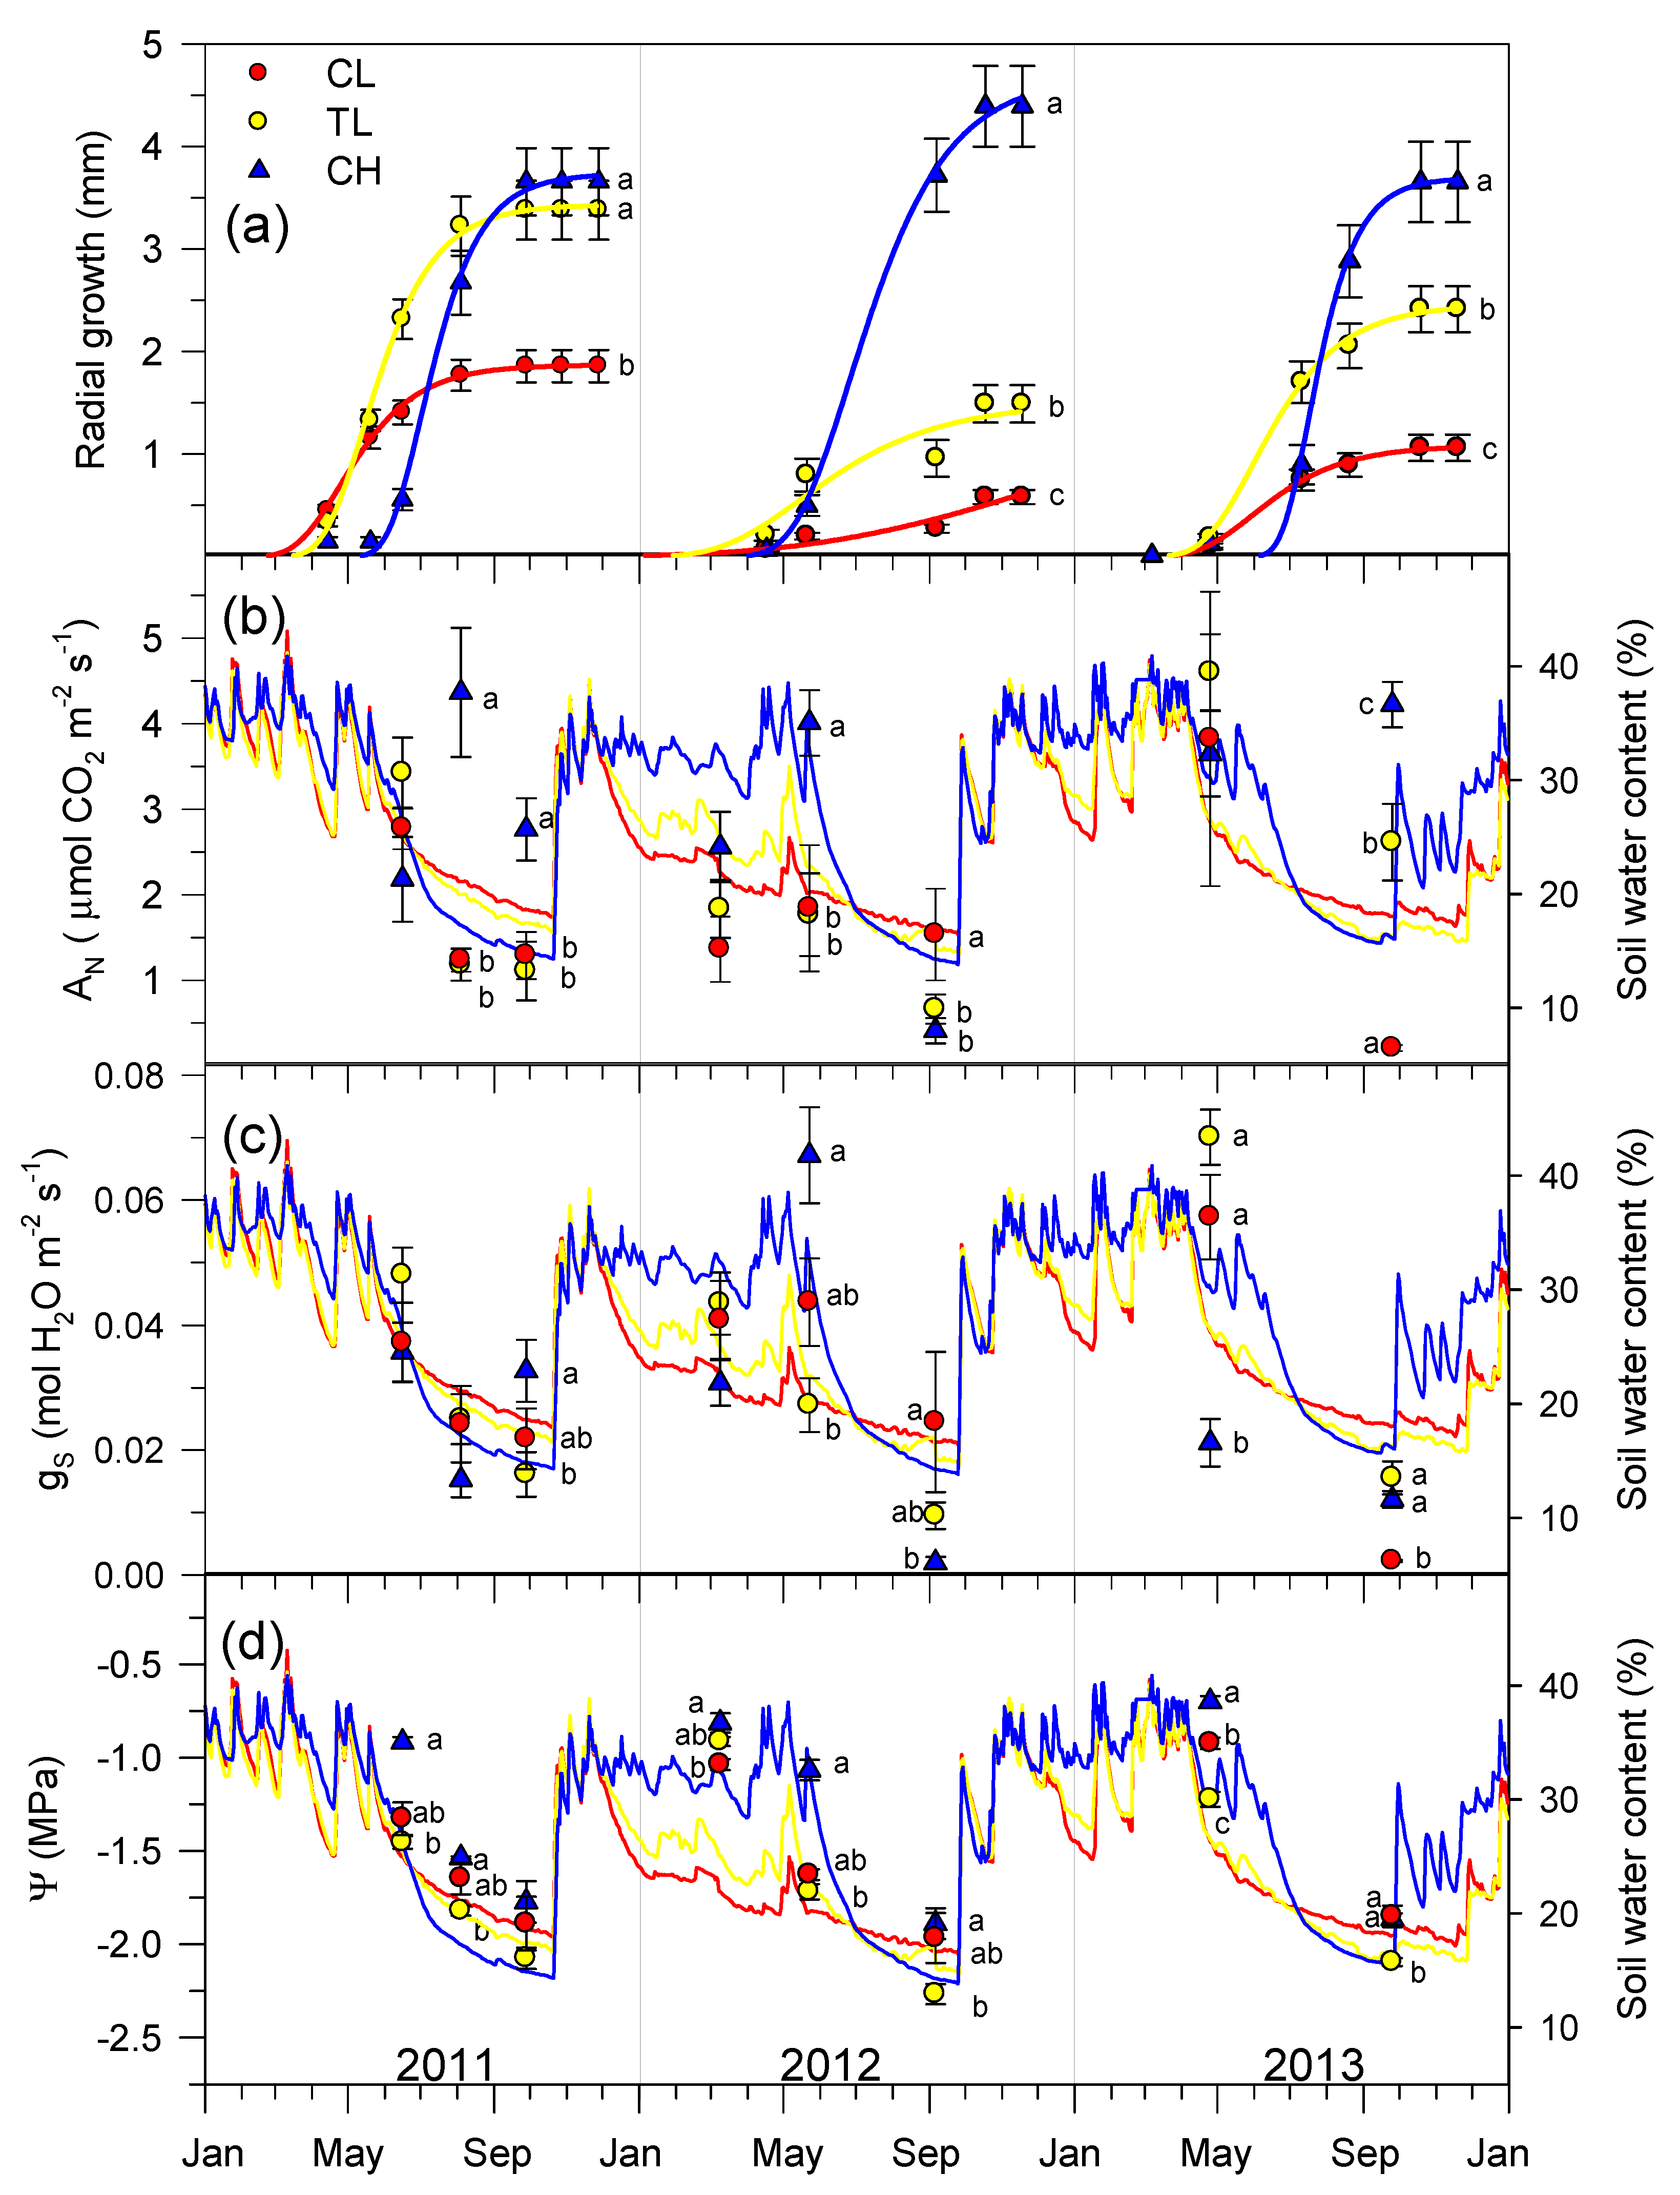
Control plots at low elevation (CL), thinned plots at low elevation (TL), and control plots at high elevation (CH) were considered here as stand variants, noted as treatments thereafter. Microclimate variables (T, HR, VPD, and SWC) were compared by student T test for dependent paired samples (dependency was assumed regarding the sampling date). Differences in mean gs, AN, Ψ, and NSC among treatments (thinning and elevation) were tested by one-way ANOVA. Kruskal–Wallis test was used when the residuals showed a non-normal distribution. Secondary growth and SFD were analyzed by a semi-parametric repeated measures test [39]. The between-subject factor was the thinning treatment (control versus thinning), whereas tree size (DBH) was considered as a covariate. Sampling date was regarded as the within-subject factor. Statistical analyses were performed in R [40], Package ‘MANOVA.RM’. Data are shown as mean ± standard error (SE) throughout the text. Significant threshold was fixed at p < 0.05.

3. Results

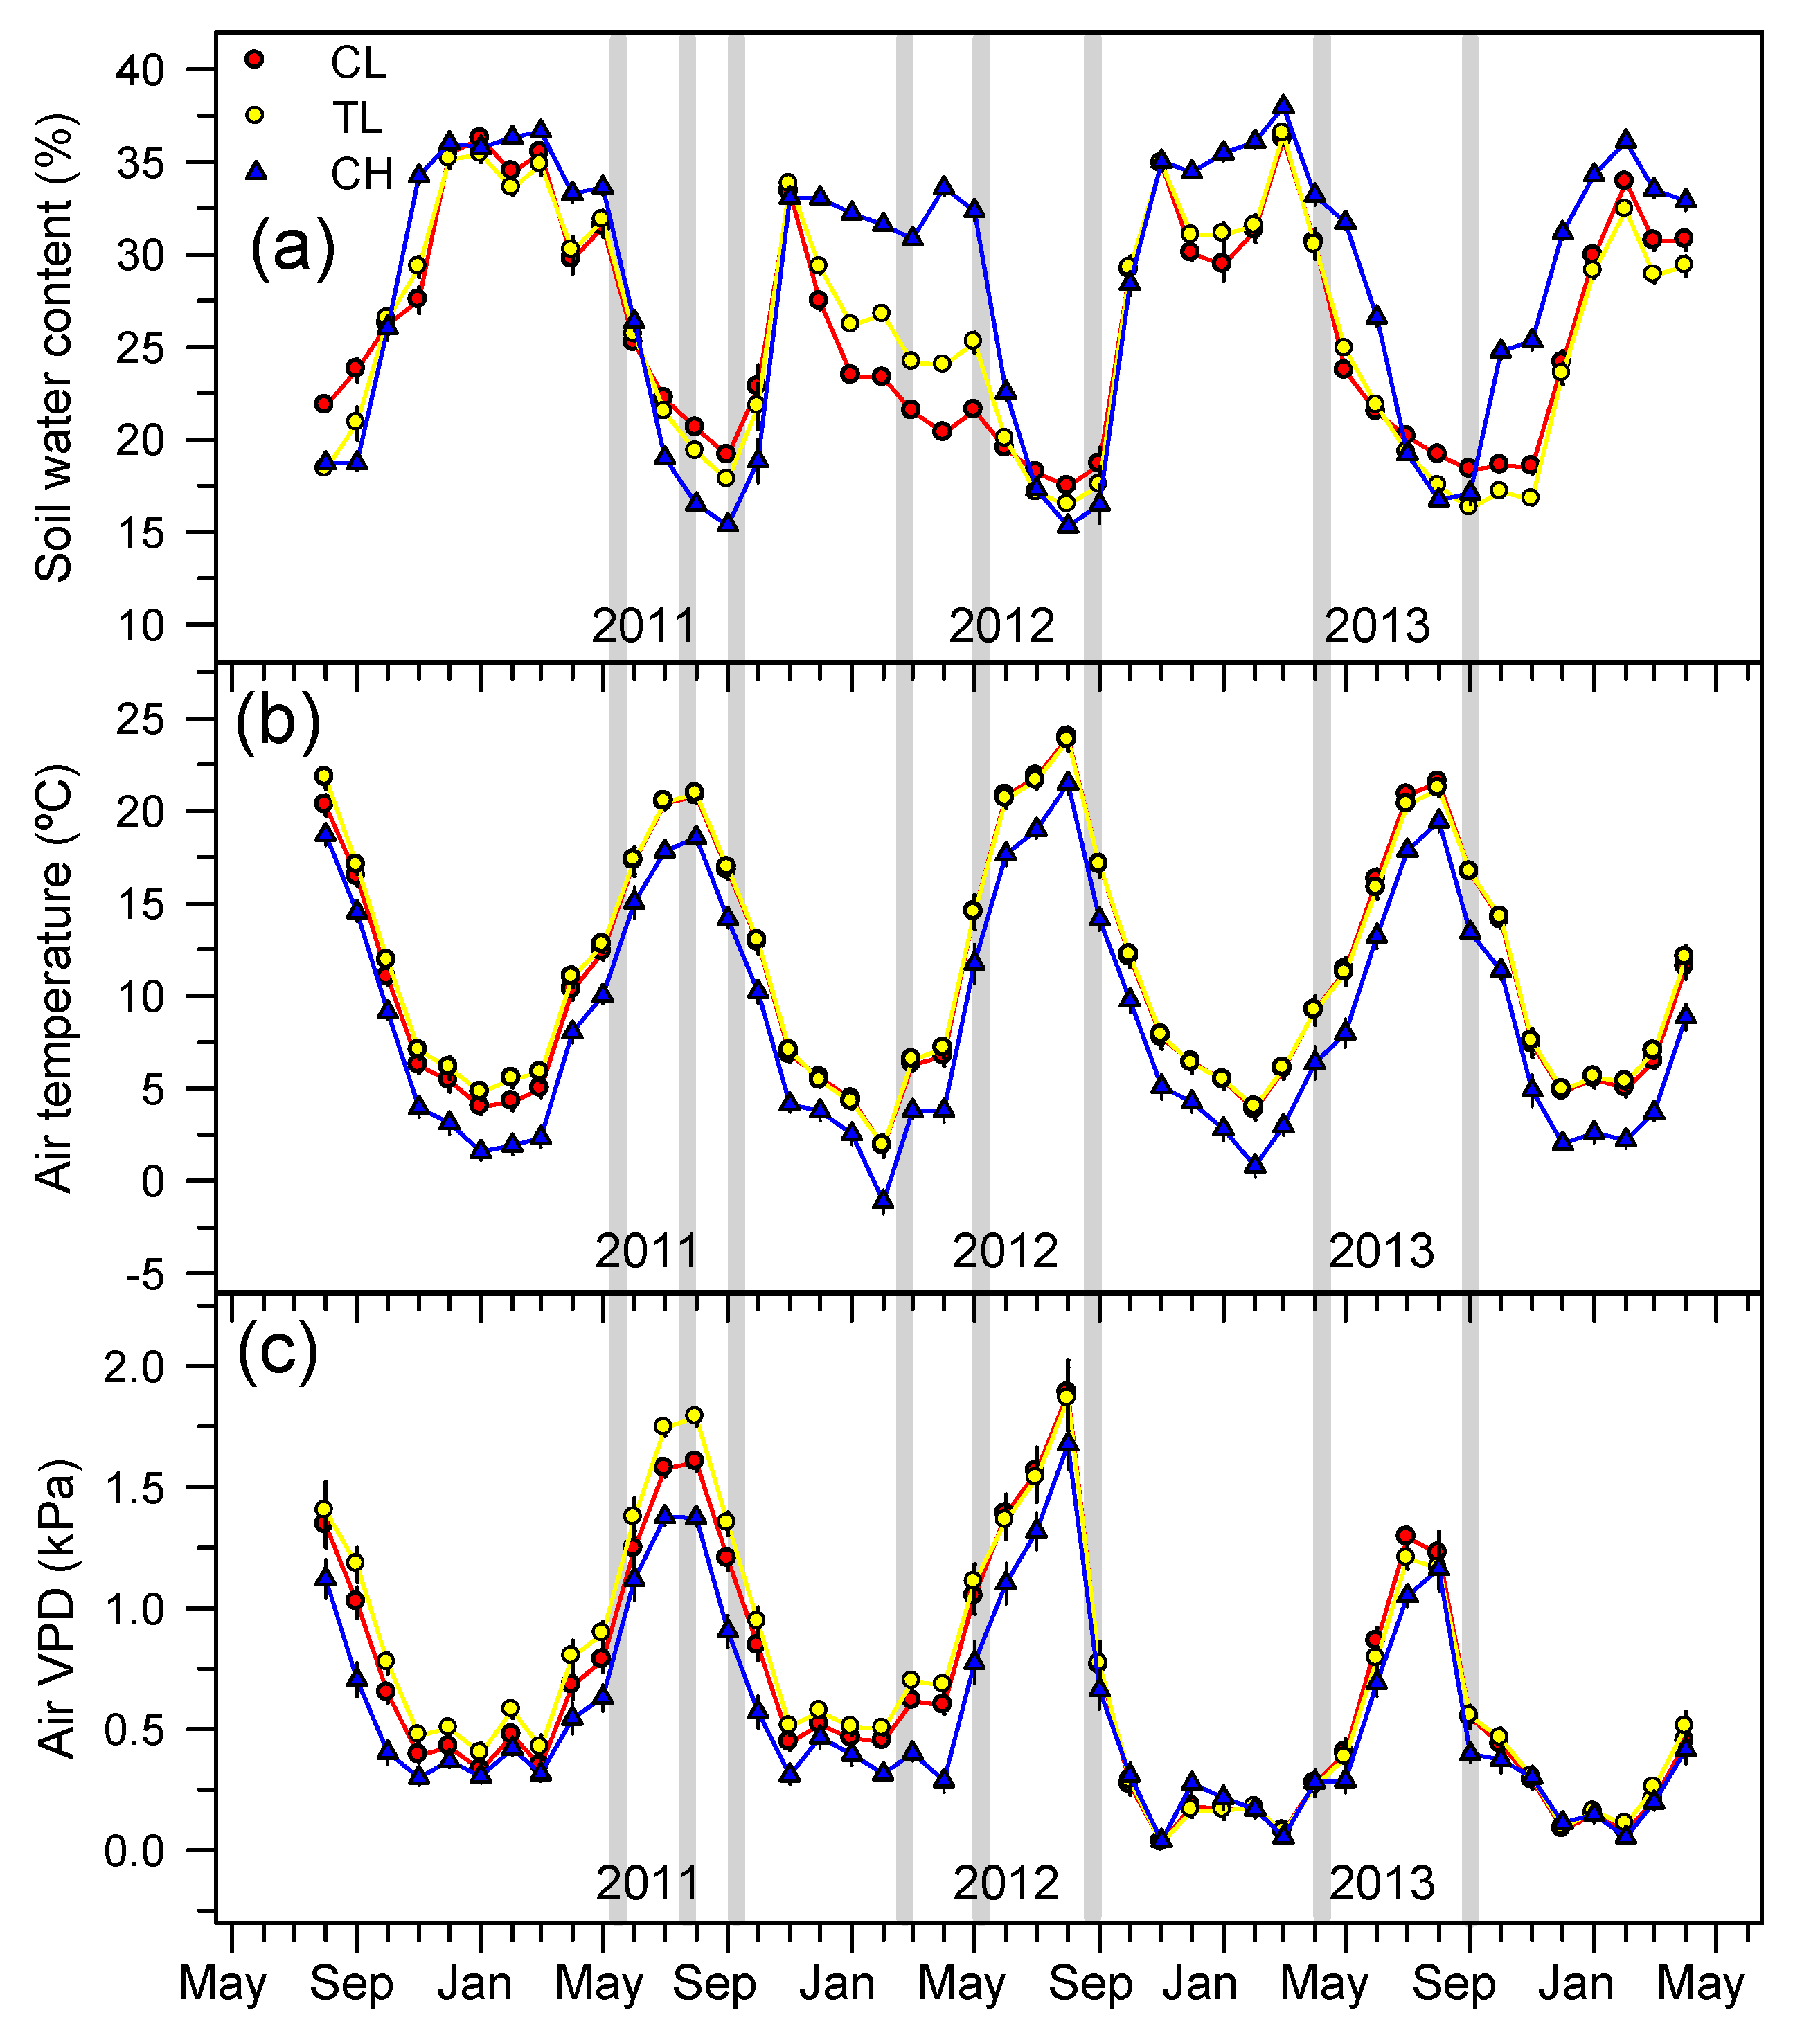
3.1. Microclimatic Conditions

High elevation stands (CH) usually showed higher SWC and lower VPD (Figure 1). At low elevation, the thinned stands (TL) showed the lowest SWC and the highest VPD values during the drought periods, compared to both controls (CL and CH, respectively). During the years 2011 and 2013, the onset of autumn rainfall, after the summer drought period, was at the end of September in both low and high elevation; however, in 2012, these first rainfalls took place in late October, extending this drought season (Figure 1a). Furthermore, the spring of 2012 was especially scarce in precipitation, especially at low elevation.
During the study period, the mean temperature was 2.7 °C lower at the high elevation stands (Figure 1b). The mean annual temperature at the low elevation stands was about 11.2 °C, with a minimum monthly mean temperature of 2 °C and a mean monthly maximum of 24 °C. At the high elevation stands, the mean annual temperature was about 8.7 °C, with a mean monthly minimum of –1 °C and a mean monthly maximum of 21 °C. The hottest months were from June to September, which are also the months with the lowest water availability. Lower air VPD was observed at the high elevation, according to its lower mean temperature and slightly higher air relative humidity (Figure 1c).

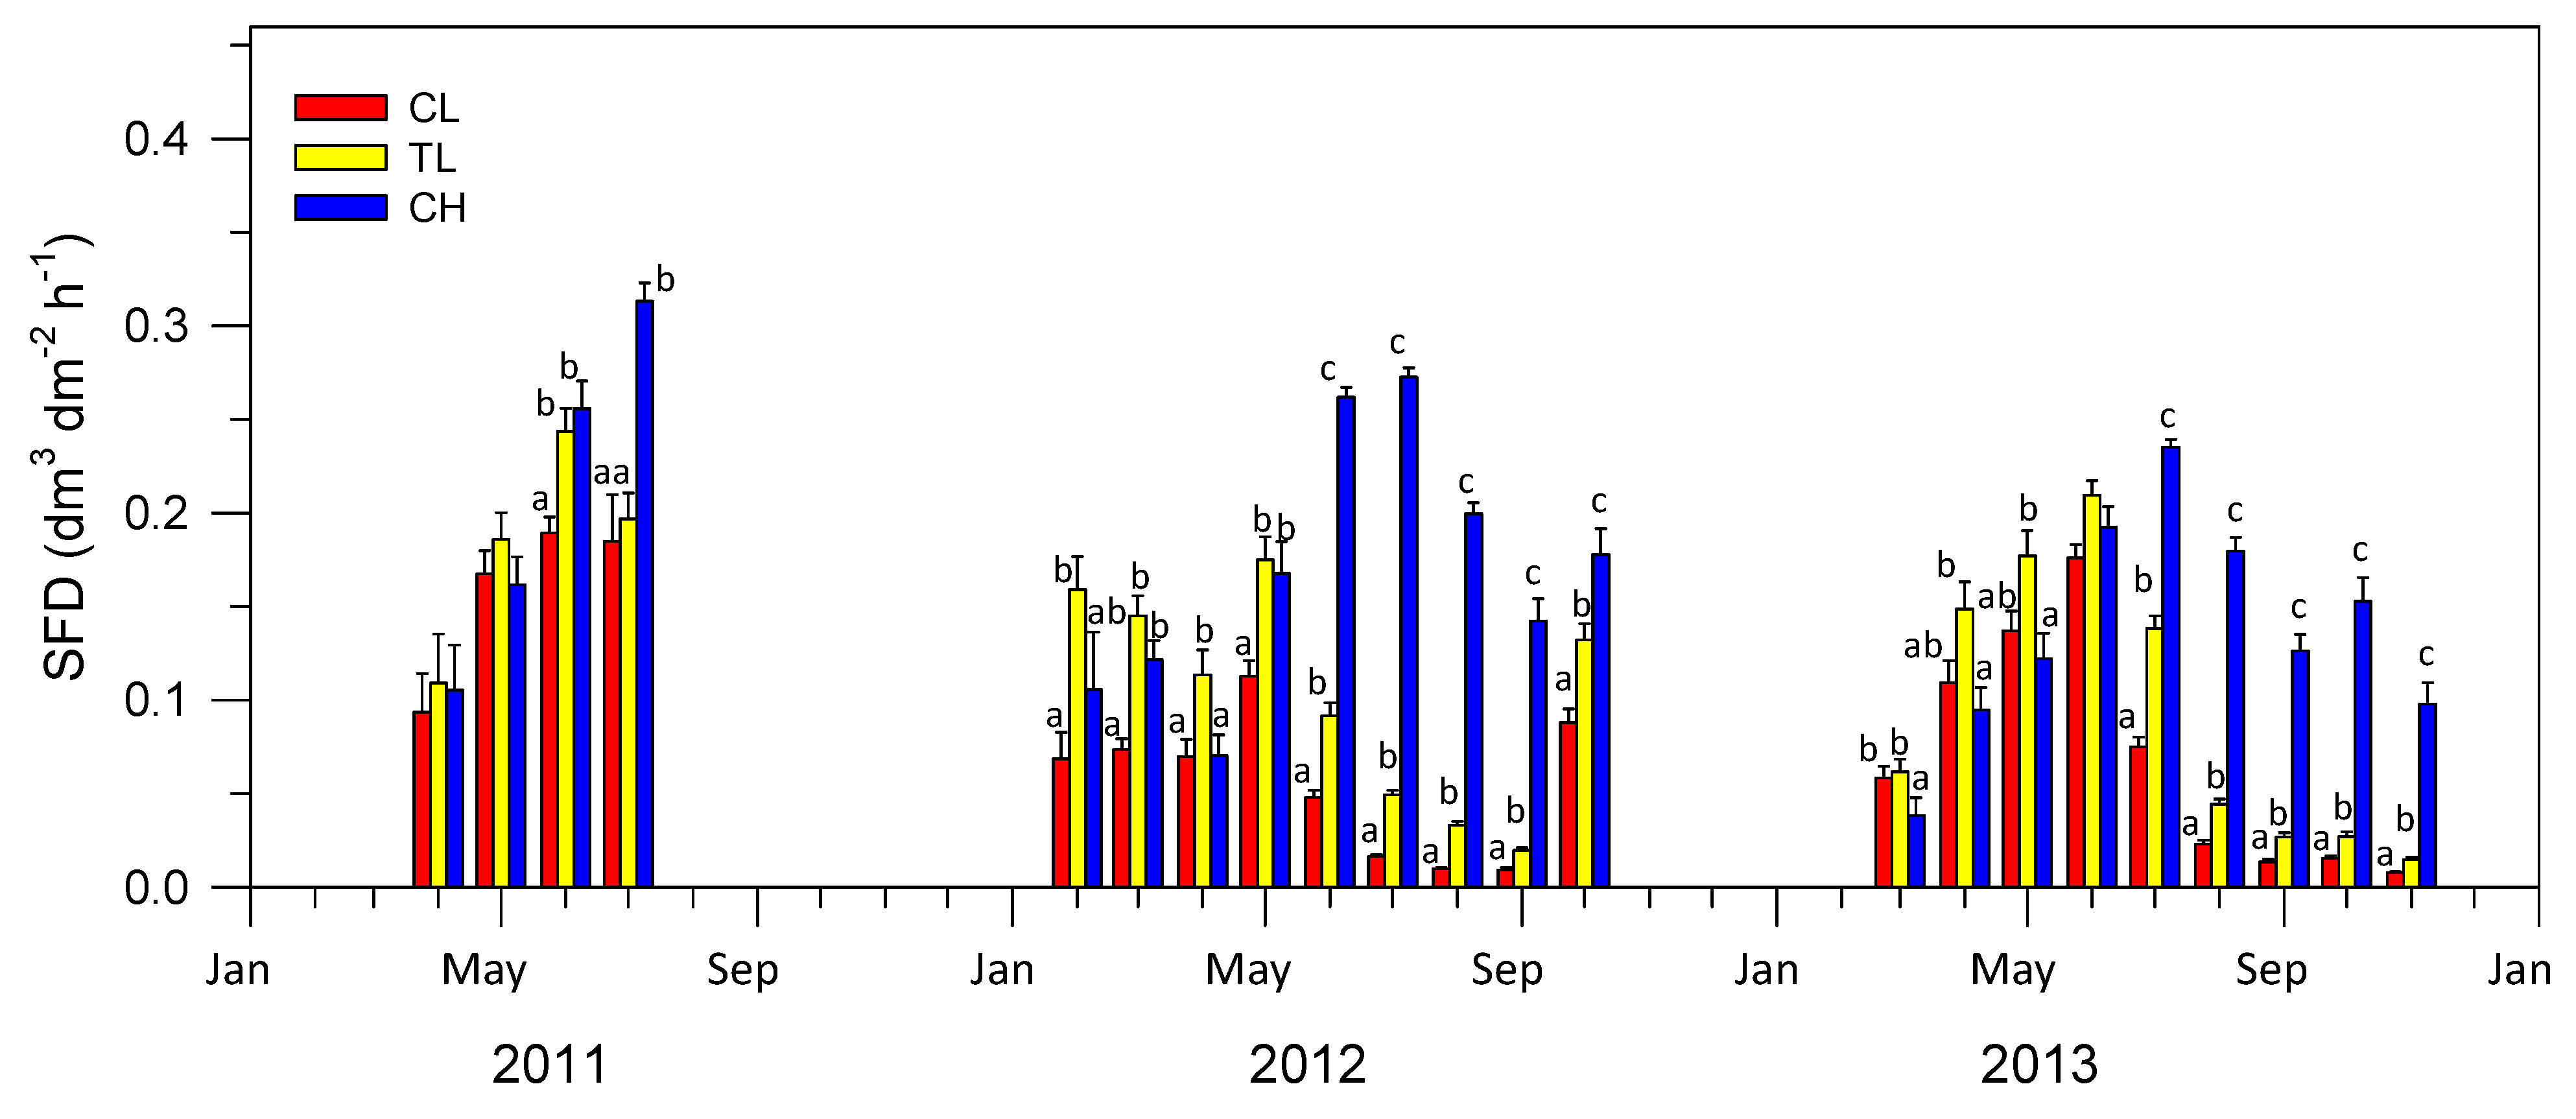
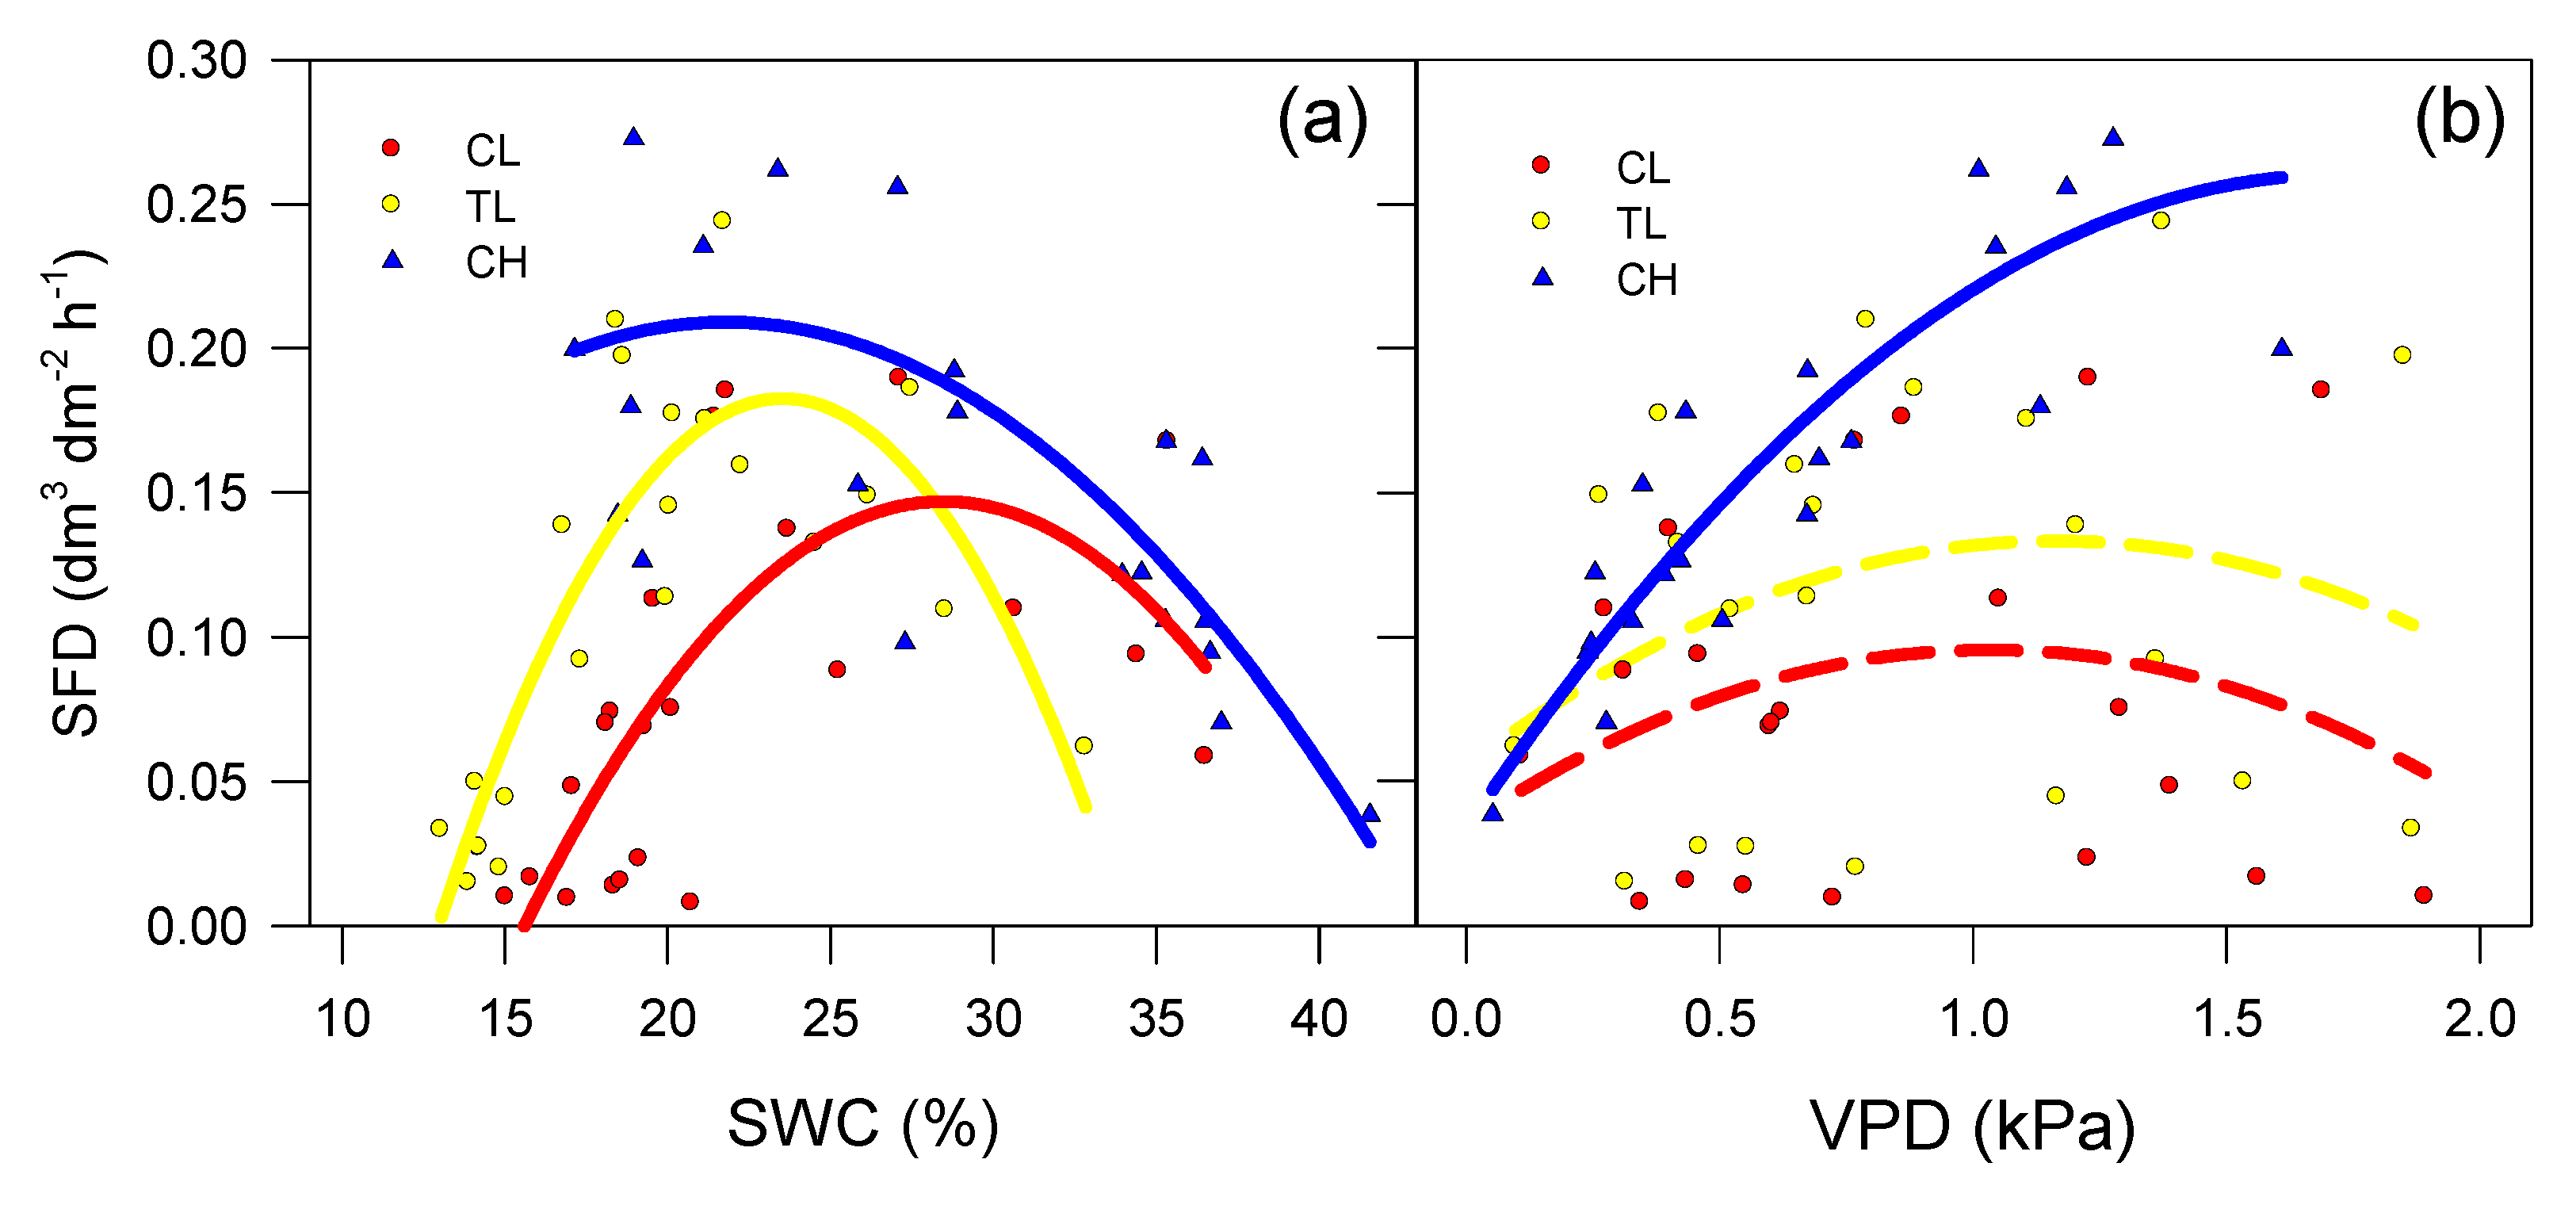
3.2. SAP Flow Measurements

SFD reaches maximum values during late spring (June) at low elevation (both in CL and TL), and then shows a steep decline in early summer (July). During the dry year of 2012, there were earlier SFD reductions (Figure 2). Subsequent recovery was observed following the onset of the autumn rainfalls while lower temperatures and VPD limited the extent of this retrieval (Figure 1 and Figure 2). By opposite, despite CH stands also showing increased SFD throughout the spring, maximum values were registered in mid-summer (July or even August; Figure 2). Furthermore, the SFD decrease during late summer was significantly lower in CH than those observed in the trees located at low elevations.
Regarding the effect of thinning, both CL and TL showed similar seasonal SFD patterns while thinning stands maintained significantly higher SFD in summer, despite lower SWC (Figure 1 and Figure 2). During 2011, all plots showed similar SFD during April and May, but it became significantly lower in CL during June. In July 2011 the SFD of TL also declined, reaching values as low as CL. During 2012, SFD of CL and TL decreased in late May, following a prior decline in SWC and rise in VPD. By opposite, significant SFD values were maintained at CH until mid-July. Notwithstanding, through the dry year of 2012, the thinned stands TL showed higher SFD values, compared to CL. From June to October, CH showed significantly higher SFD than both CL and TL stands. In 2013, SFD declined in CL and TL since July and maintained low transpiration values until late November. However, TL showed significantly higher SFD from June till the end of the summer, compared to CL (Figure 2).
SFD was significantly correlated with SWC in all the studied stands (Figure 3a). Maximum SFD rates were observed at about 25% of SWC while decreasing trends were observed as water shortages occurred. Notwithstanding, CH showed higher SFD than CL and TL at any SWC. In turn, TL showed similar or higher SFD values than that of CL, despite a lower mean SWC (Figure 3a). Minimum SFD was observed at the low elevation stands during the maximum water shortage (about 15% SWC). SFD was significantly related to VPD only at high elevation CH (Figure 3b). Mean SFD increased along with VPD rise (up to about 1.0 kPa). This response to VPD was maintained in CH during the summer while both CL and TL showed declining SFD, as VPD increased (Figure 3b).

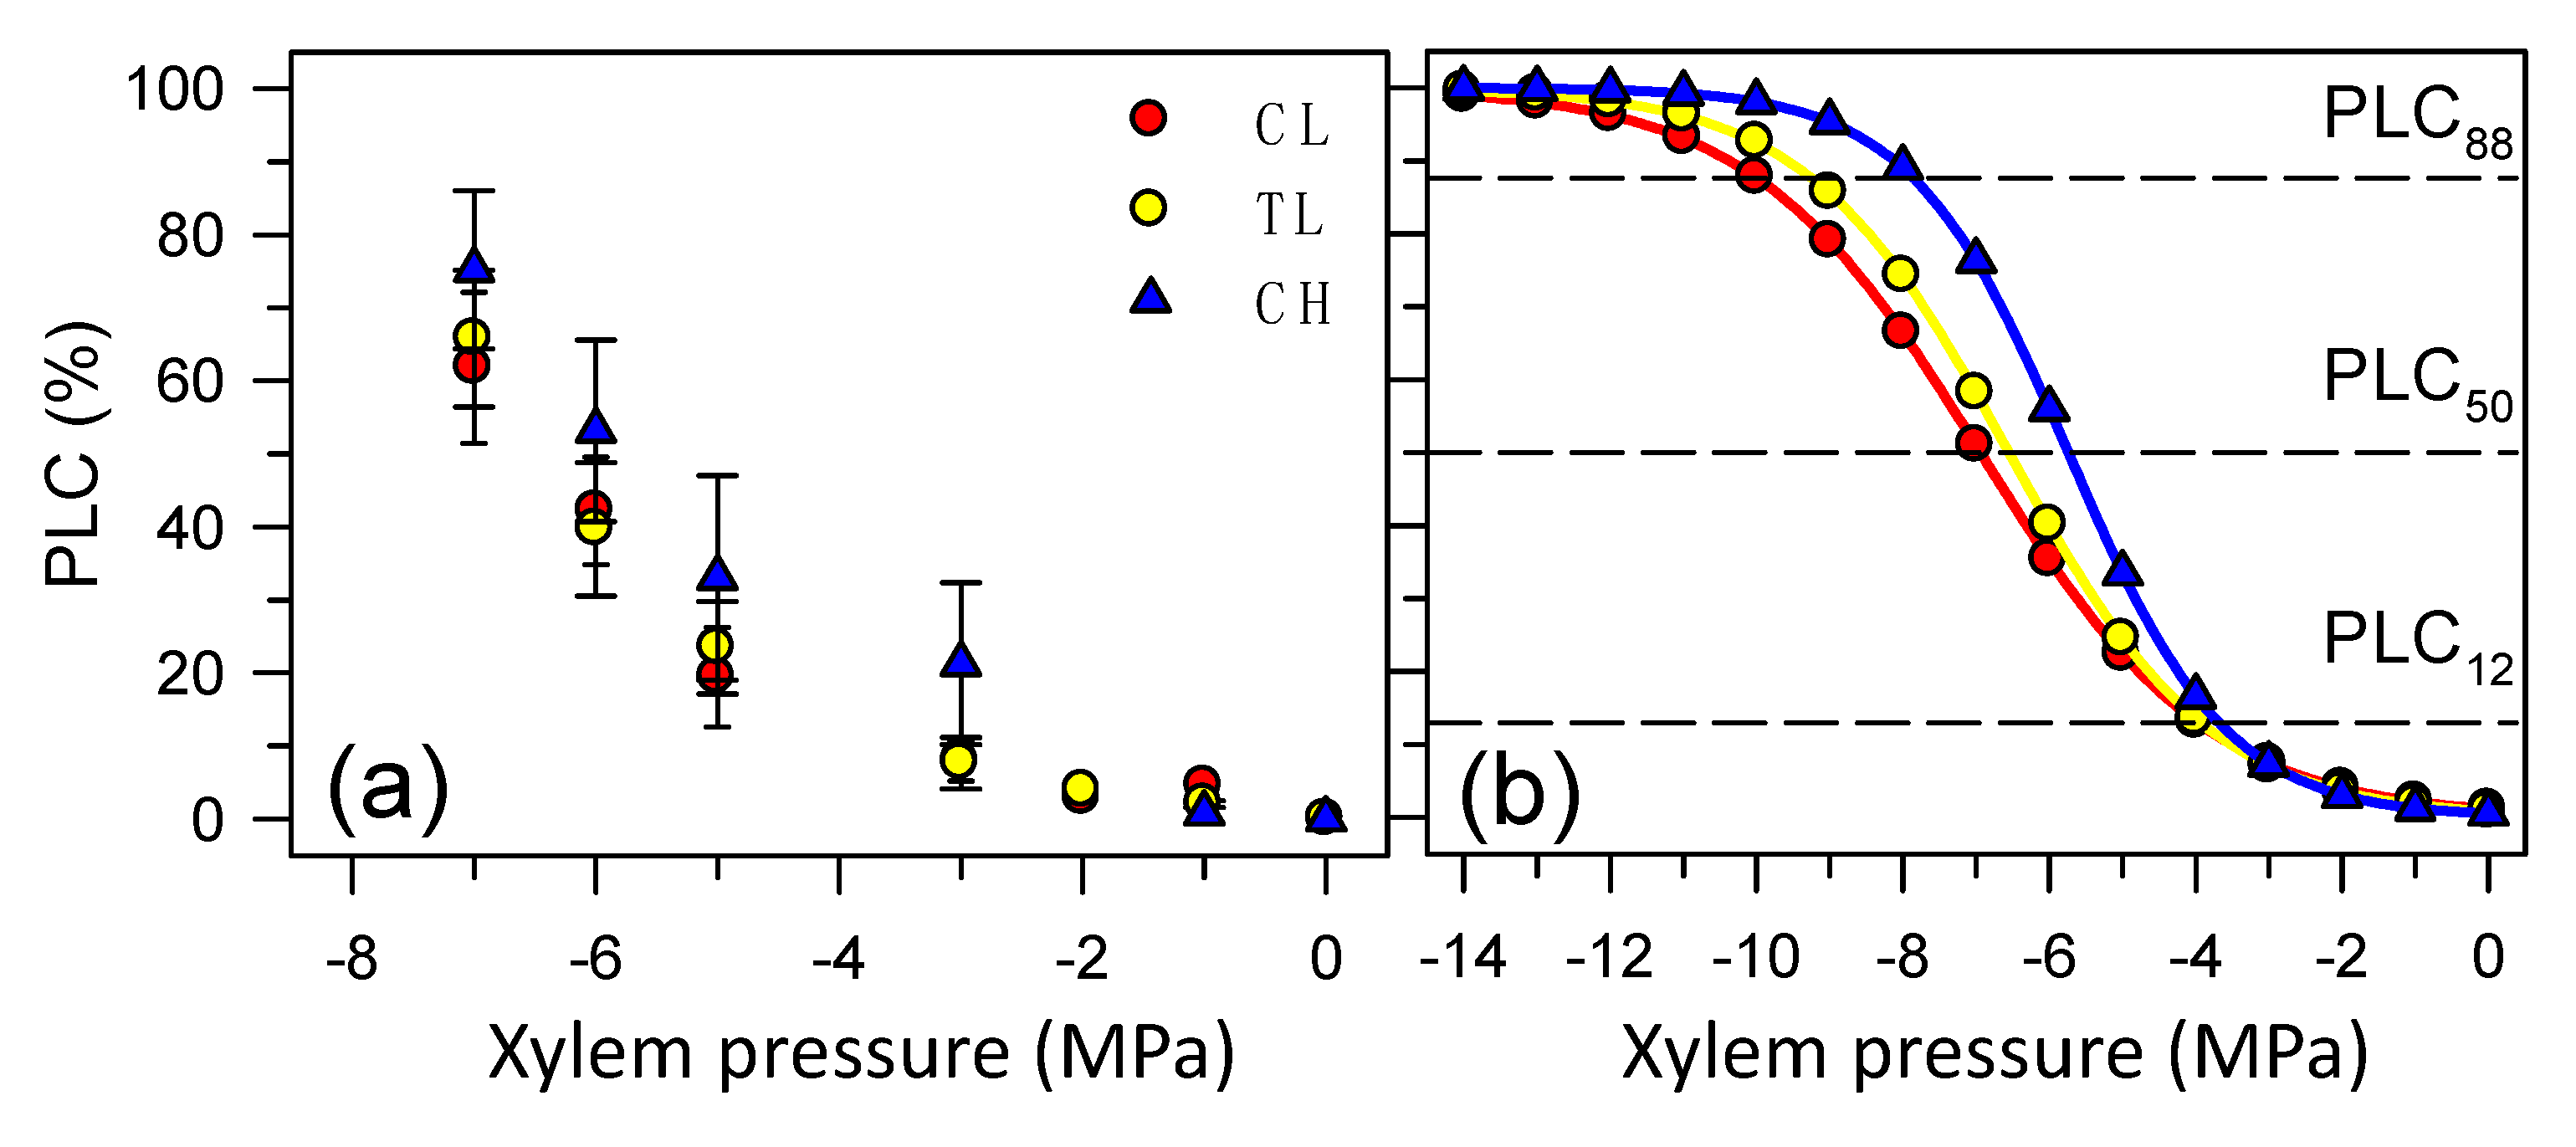
3.3. Hydraulic Conductivity and Cavitation Vulnerability Curves

Trees used to characterize hydraulic conductivity and cavitation vulnerability curves were about 7 cm DBH, while branches were about 9 mm in diameter (Table 2). The mean age of the branches (estimated by counting the tree rings) was significantly lower in the CH trees, despite a similar diameter, supporting higher secondary growth. Hydraulic conductivity (Kh), specific hydraulic conductivity (Ks), and branch conductivity per needle area (Kl) were on average lower in CH while differences where not significant. Leaf area (Al) was significantly lower at higher elevations while the regression parameters and xylem pressures, related to the percentage loss of conductivity (PLC), were not significant (Table 2, Figure 4).

3.4. Secondary Growth, Gas Exchange, and Xylem Water Potential

Secondary growth, expressed as the tree ring width, was significantly higher at high elevation CH and thinned stands TL compared to CL (Figure 5a). In 2011, the photosynthetic rate during June was two times higher than what was measured in August and September; no significant differences were found between control and thinned stands (Figure 5b). Significant differences between CL and TL were obtained in September 2012 (higher in the CL) and September 2013 (higher in TL). CH showed maximum photosynthetic rates in summer, with values significantly higher than those recorded in the CL and TL (Figure 5b). We obtained a significant relationship between SWC and AN in the CL (Supplementary Materials, Figure S1). During the late summer (September), gs values were on average low in all the studied stands as a consequence of water shortages (Figure 5c), although the thinned stands TL showed higher gs sensitivity to SWC, T, and VPD (Supplementary Materials, Figure S2). Ψ showed a consistent seasonal pattern throughout the year (Figure 5d), significantly related to SWC in all plots (Supplementary Materials, Figure S3). TL usually showed more negative Ψ values, except for April 2012, when the CL showed the lowest ones. Anyway, CH showed less negative Ψ values.

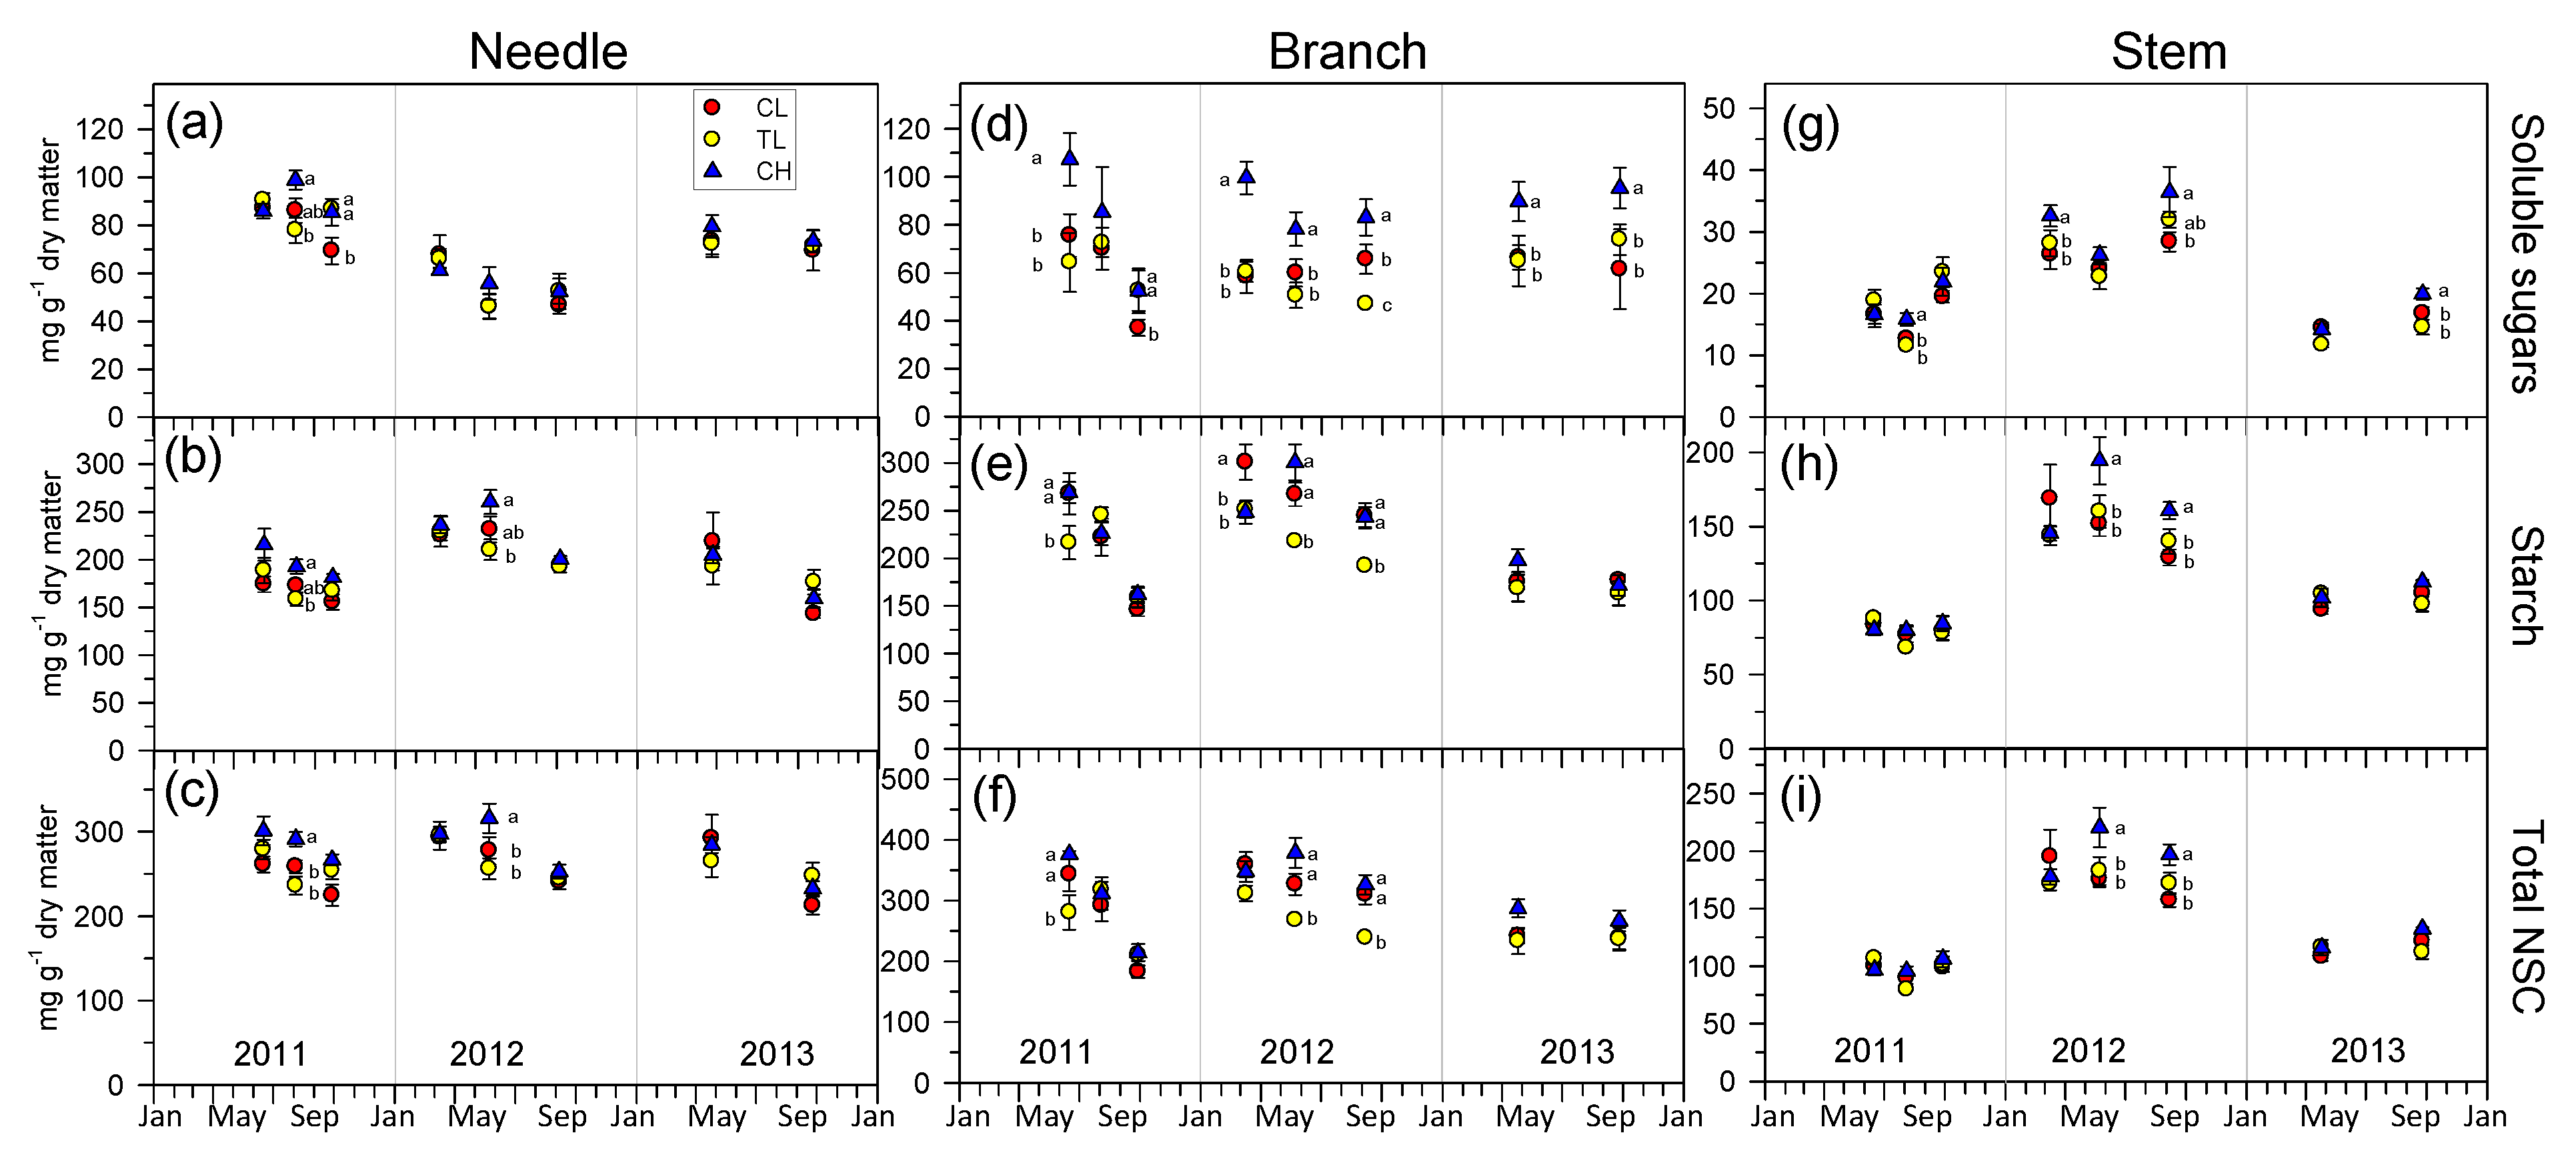
3.5. Non-Structural Carbohydrates Dynamics

Soluble sugars and starch contents in needles decreased from spring to late summer, with some significantly lower values in TL (Figure 6a–c). Soluble sugar contents in branches were on average higher in CH (Figure 6d). During 2011, the soluble sugars and starch contents in branches decreased in CL and CH throughout the year, with a sharp drop in September 2011 (Figure 6d–f). During 2012, the soluble sugars content in branches increased in CL throughout this dry year while the lowest values of sugars, starch, and NSCs in branches were in 2012, as observed in TL. Overall, soluble sugars, starch, and NSCs in branches were lower in the stands located at lower elevations (CL, TL). The content of soluble sugars in the stem decreased in August and increased in September (Figure 6g). During 2011, the starch content in the stem was relatively steady in all the stands (Figure 6h), with no significant differences. Starch content in the stem was in 2012 higher than those in 2011 and 2013, although CL shows a gradual decrease throughout the year (Figure 6h). Finally, no significant differences between treatments were found in 2013 for stem soluble sugar, starch, and NSCs (Figure 6i).

4. Discussion

Mediterranean mountain forests are characterized by large spatial variability in local microclimates while large temporal variability, from a seasonal to inter-annual scale, is also present (Figure 1). Furthermore, recent studies have pointed out expected changes in precipitation and temperature regimes in the Mediterranean Basin [41], the latter being particularly critical for drought-sensitive tree species, since water scarcity is already present in several areas [1,7,20,23]. Specifically, climate projections present a remarkable agreement for the Mediterranean region, reporting that warming will likely be larger than the global average, whilst a large reduction of precipitation, and increasing inter-annual variability seems to be expected [41]. The A. pinsapo trees studied here are subjected to seasonal soil water shortages and high evaporative demands while local environmental gradients (elevation) and stand structure (competition) significantly modulate the tree carbon and water balances. Trees growing at low elevation respond to drought by means of a water-saving strategy, consisting of pronounced reductions in transpiration (SFD) as soil water content (SWC) declines and evaporative demand (VPD) increases. In contrast, high elevation stands were characterized by the maintenance of high SFD rates during the summer, despite concomitant SWC declines and VPD increases also being registered. These contrasting responses have also been observed in different conifers, such as Pinus sylvestris L. and Picea abies (L.) Karst., which typically show a water-saving strategy [42,43], while in other conifers, such as Larix decidua Mill., greater transpiration is shown during the summer [44]. The fact that those different strategies, reported in different species, were present here in different populations of A. pinsapo reveals a significant plasticity in this relict fir to cope with the Mediterranean climate conditions [45].
Relatively isohydric trees, such as A. pinsapo [20], show a sensitive response to soil water shortages and atmospheric moisture demand increase by stomatal closure [10,13,14,15]. Despite A. pinsapo growing in areas with a total annual rainfall of typically around 1000 mm, this relict fir also undergoes long summer drought spans, which might cause xylem cavitation and subsequent hydraulic failure [20,45]. Our results support a relatively high hydraulic conductivity and resistance to cavitation in A. pinsapo (Table 2). Thus, these xylem characteristics might allow this relic fir to withstand high Ψ during summer while relatively high conductance might favor stem water storage under non-limiting SWC [14,19,46].
Despite a high efficiency in water transport contributing to fast refilling of the xylem vessels, it might increase the cavitation risk under drought conditions [10,14,15,21]. In this sense, a high hydraulic conductivity has been related with a rising vulnerability to embolism in the xylem [13,47]. Nevertheless, the existence of this trade-off remains controversial [19,46]. Indeed, minimum Ψ recorded in the field samplings (about −2.26 MPa, TL treatment September 2012) are far from the estimated cavitation, assuming this would occur at PLC50 (about −6.6 MPa, TL treatment). Notwithstanding, it should be noted that our PLC values are higher than those obtained in previous studies [48]. These authors measured the percentage loss of conductance in two populations of A. pinsapo and two populations of A. alba, reporting no significant differences between species or populations [48]. The mean PLC50 reported in [48] was about −3.8 MPa, which might diverge from our results due to the different methodology (centrifugation-induced cavitation method in [48]). Furthermore, the branches used in our study were collected in early November 2013, prior to autumn rainfalls, which may have also affected the hydration of the samples. Indeed, native embolism has been observed in branches measured in field conditions or under severe drought treatments [13,15,49,50]. In any case, the results suggest that A. pinsapo shows a relatively high resistance to cavitation [48]. Although our results did not show any significant differences in the hydraulic conductivity between treatments, individuals from low elevation stands showed slightly higher conductivity than those growing at high elevation (Table 2). Moreover, while the sizes of the trees and the branches were almost similar, the mean age of the branches sampled in the low elevation stands was significantly higher due to contrasting growth rates (Table 2) [45].
Regarding transpiration patterns (SFD), we found that SWC was not a major limiting factor for SFD at high elevation, even during summer, while it seems to be rather coupled to VPD (Figure 3) [44,50]. This favorable ecophysiological performance has also been observed in other relict conifer trees, like Pinus leucodermis Ant., growing at high elevations in southern Italy (V. Carraro, personal observation). Particularly noteworthy, gs was not congruent with concurrent sap flow measurements at high elevations. Hence, gs declined as SWC did during the summer, which was not accounted for to the same extent in the SFD data [42,43,44,45]. In this sense, the open canopy structure of this population (Table 1) may imply a stronger dependence on VPD (Figure 3b). Contrastingly, trees subjected to high competition (CL) prevent water loss by stomata closure during longer periods than the trees growing in thinned stands (Figure 2). As a result, SFD, AN, and secondary growth were, on average, reduced in CL, likely at the expense of the negative carbon balance during drought [10,11,16]. Furthermore, given that under the Mediterranean climate declining water availability concurs with high temperatures, rising respiration rates may also increase the chance of carbon starvation [12,16,17,18]. Trees subjected to lower competition (TL) seem to be more sensitive to water availability (Supplementary Materials, Figures S1–S3) [23,51], likely because they allocate more resources to growth (Figure 5a) [52]. Then, an overall response to thinning seems to be a fast and efficient response to the environmental changes [51,52,53,54]. Increasing water uptake and growth allocation has been reported for trees in thinned stands, as the canopies become better exposed to light [22,23,53,54].
Thinning increased the average growth of the remaining trees and showed several evidences of improved water and carbon uptake, which has been reported recently in several studies [51,52,53,54]. Notwithstanding, the patterns observed here for some gas-exchange variables, such as AN and gs, were not as significant as for more integrative variables, such as basal area increments and sap flow [23]. No significant effect of thinning regarding carbon uptake has been previously described in Sitka spruce (Picea sitchensis (Bong.) Carr) forests [55]. Hence, decreased competition showed no effects in this study regarding photosynthetic rates, although the inter-annual variability in net ecosystem exchange increased [55]. Our observations seem to be contradictory, since one might expect that the opening of the canopy within the thinned plots (TL) would alter the light environment, increasing radiation, in addition to increasing tree water availability [54]. However, it should be noted that our field samplings were made using branches with direct sunlight at the central hours of the day, with the radiation intensity comparable in the control and thinned stands. Nevertheless, it should be taken into account that the canopy opening induced by thinning may also affect the needle morphology and efficiency of water transport [21,22]. Indeed, it has been observed that A. pinsapo trees growing in open stands increase the efficiency of water transport while trees growing under the canopy develop shoots adapted to maximize light interception [56]. In this sense, trees growing in thinned stands may develop new branches, whose ecophysiological performance changes in response to higher irradiance [56]. Furthermore, these trees tend to reach lower values of Ψ (see TL in Figure 5d). Achieving a more negative potential may be an advantage under severe water shortages, though the field data were far from the values of PLC50, suggesting wide margins of safety [13,14,23,48].
Within this context of seasonal drought, the role of non-structural carbohydrates (NSCs) has been widely recognized regarding, for instance, phloem transport, osmoregulation, cold tolerance, and reversal of xylem embolism [12,13,57,58]. However, tree-level regulation of these competing functions is still not fully understood [18,57,58,59]. Different timings in temperature and soil water availability, associated here with elevation, results in temporal variation in resource allocation [60,61,62]. For instance, early secondary growth may use stored carbohydrates while the late growth seems to rely on more immediately produced carbohydrates (sugars) from photosynthesis [63]. As a result, the seasonal pattern of sugar concentrations and cambial activity is usually characterized by decreasing NSC concentrations during the period of active xylogenesis [60,62]. The secondary growth dynamics observed here suggests that A. pinsapo trees growing at low elevations (CL) might suffer from an insufficient carbon and energy supply for growth and survival because of a shortage of photosynthates (Figure 5a). Thus, growth cessation might occur at the moment where carbon need exceeds carbon gain, as photosynthesis appears to be limited by drought (Figure 5b; Supplementary Materials, Figure S1) [20,45]. On the other hand, the remaining trees within the thinned plots (TL) showed a more efficient carbon sink, as they had significantly higher secondary growth, and consequently deeper NSC depletion. At higher elevations (CH), A. pinsapo trees showed improved growth rates and higher soluble sugar concentrations in the branches compared to CL and TL. Given that the allocation of C resources to growth implies a trade-off with others functions, such as maintenance and defense (prioritized over reproduction and storage), A. pinsapo trees growing at higher elevations might proportionally allocate more resources to these functions than those trees subjected to warmer and drier local climate conditions [57,58,61].
The seasonal dynamics of NSCs observed in our study were relatively consistent among the years. Both soluble sugars and starch tend to decline in needles and branches throughout the growing season (Figure 6). Furthermore, similar patterns were observed in the starch concentrations of the stem sapwood, suggesting a carbon source limitation as seasonal drought increases [11,60,61]. Notwithstanding, seasonal changes in the sapwood NSC are driven by several physiological processes, such as photosynthesis, respiration, osmotic regulation, or growth [57,58]. Hence, a periodic reduction of NSC content may indicate either that carbon demand exceeds supply, or that both source and sink activity are low [58,62,64]. The decrease in NSC observed in A. pinsapo during the year agrees with the stomatal regulation in response to the water shortage, as lower conductance also reduces the photosynthetic rate [11,12,16]. Indeed, a positive relationship has been observed between stem NSC concentrations and radial growth under severe drought [60]. Stomatal control prevents hydraulic failure by reducing water loss in needles, but it occurs at the cost of the carbon supply via photosynthesis, potentially leading to reductions in stored NSCs [17,58]. The increase in the free sugar content found in late summer, when SWC is very low, may indicate the mobilization of soluble sugars towards the needles, likely involving osmotic regulation and vascular integrity in xylem and phloem [12,57]. Nonetheless, osmotic regulation in needles was not observed in A. pinsapo, based on seasonal measurements of the needles’ osmotic potential [20]. An alternative hypothesis to osmotic regulation might be that stomatal closure and reduction of the leaf area by summer needle fall reduces transpiration (as well as carbon uptake) during and after drought periods [12,20,45]. Although A. pinsapo needles have great longevity (about 13–15 years), this species is able to reduce transpiration by summer litterfall, a mechanism that intensifies in the driest years [45].
As we pointed above, A. pinsapo trees growing at high elevations yielded the highest values of growth, AN, and NSC contents (Figure 5 and Figure 6). This improved ecophysiological performance is likely favored by the open stand structure and the relatively young ages of the trees in CH stands (Table 1), in addition to the less restrictive environmental conditions (Figure 1; [20,45]). Furthermore, recent studies support that mobile carbon concentrations may increase with elevation [65,66]. For instance, the seasonal dynamics of mobile carbon observed in Abies fargesii Franch., along contrasting elevation, showed that trees growing at higher altitudes show the highest concentrations of NSCs and sugars during the late growing season, compared to those at lower elevations [65]. According to our results, NSC concentrations seem to decline in the stems, mainly under severe drought (in our case, during 2012, Figure 6h,i), but we did not observe NSC increases in needles and branches over the growing season. This result may indicate a depletion of mobile carbon reserves, mainly in thinned stand (TL) but less noticeable at the upper elevation (CH), suggesting a limitation of source activity [57,58].

5. Conclusions

Low elevation A. pinsapo stands differed from the upper elevation ones, which were characterized by the highest secondary growth and SFD rates. These results agreed with the seasonal NSC dynamics, suggesting an improved energy balance at higher elevations. In turn, managing stand structure may potentially be a way to modulate the water uptake and carbon metabolism of the remaining trees. Indeed, trees subjected to a reduced stand density (competition) by experimental thinning showed a less pronounced reduction in transpiration to increasing soil water shortages and evaporative demands while those trees growing at the upper elevation did not show a water-saving strategy through the summer. Our results support that thinning provides a promising strategy for minimizing climate change effects on drought-sensitive tree species by improving resources’ availability to the remaining trees. The significant effect of thinning should be considered in order to forecast reliable potential impacts of forest management in some Mediterranean drought-sensitive forests, as has already been stated, for instance, in the inner alpine dry valleys. These adaptive management strategies, such as the experimental thinning reported here, may increase tree-level resource availability. Hence, we demonstrated that water and carbon supplies depend largely on whether the trees are subjected to competition.

Supplementary Materials

The following are available online at https://www.mdpi.com/1999-4907/10/12/1132/s1, Figure S1: Relationships observed among photosynthetic rate (AN) and soil water content (a), air temperature (b), and air vapour pressure deficit (Air VPD, (c)) in control low-elevation (CL), thinning low-elevation (TL) and control high-elevation (CH) stands. Means ± standard errors of the daily data are shown. Significant and marginally significant linear regressions are indicated: (a) CL p < 0.001, TL p = 0.07. Figure S2: Relationships observed among stomatal conductance (gs) and soil water content (a), air temperature (b), and air vapour pressure deficit (Air VPD, (c)) in control low-elevation (CL), thinning low-elevation (TL) and control high-elevation (CH) stands. Means ± standard errors of the daily data are shown. Significant and marginally significant linear regressions are indicated: (a) TL p = 0.03, CH p < 0.02; (b) TL p = 0.09; (c) TL p = 0.06. Figure S3: Relationships observed among xylem water potential (Ψ) and soil water content (a), air temperature (b), and air vapour pressure deficit (Air VPD, (c)) in control low-elevation (CL), thinning low-elevation (TL) and control high-elevation (CH) stands. Means ± standard errors of the daily data are shown. Significant and marginally significant regressions are indicated: (a) p < 0.01 in all the regressions using linear relationships; (c) CL p < 0.01, TL p = 0.05 using polynomial quadratic relationships.

Author Contributions

J.A.C. conceived the study; B.V., J.A.C. and J.C.L. designed the experiments; V.L., V.C., B.V. and J.C.L. performed the experiments; V.L. analyzed the data. All authors contributed to the final writing of the manuscript.

Funding

This work was supported by the Junta de Andalucía (research groups CVI-302, RNM-296 and RNM-313; project P06RNM2183; and contract Egmasa-NET313926), Spanish Ministry of Science and Innovation (projects CGL2010-19876 and CGL2013-48843-C2) and European Union (project FEDER 0087 TRANSHABITAT). V. Lechuga is grateful for UJA labour contracts 2011/CL007 and 2014/CL101 as research technician, funded by MINECO CGL2010-19876 and CGL2013-48843-C2.

Acknowledgments

We thank José B. López-Quintanilla, Andrés Madrid and Fernando Ríos (Consejería de Medio Ambiente y Ordenación del Territorio, Junta de Andalucía) for logistic assistance and sampling permissions. We thank J. Rodríguez (University Pablo de Olavide) and J. Aguilera (University of Jaén) for technical assistance. We thank J. Martínez-Vilalta (CREAF, Autonomous University of Barcelona) for assistance and support in hydraulic conductivity and cavitation vulnerability measurements. We would like to thank the editors and reviewers for their positive comments and corrections over a prior version of the manuscript.

Conflicts of Interest

The authors declare no conflict of interest.

References

  1. Gómez-Aparicio, L.; García-Valdés, R.; Ruíz-Benito, P.; Zavala, M.A. Disentangling the relative importance of climate, size and competition on tree growth in Iberian forests: Implications for forest management under global change. Glob. Change Biol. 2011, 17, 2400–2414. [Google Scholar] [CrossRef] [Green Version]
  2. Carnwath, G.C.; Nelson, C.R. The effect of competition on responses to drought and interannual climate variability of a dominant conifer tree of western North America. J. Ecol. 2016, 104, 1421–1431. [Google Scholar] [CrossRef]
  3. Fernández-de-Uña, L.; McDowell, N.G.; Canellas, I.; Gea-Izquierdo, G. Disentangling the effect of competition, CO2 and climate on intrinsic water-use efficiency and tree growth. J. Ecol. 2016, 104, 678–690. [Google Scholar] [CrossRef] [Green Version]
  4. Gleason, K.E.; Bradford, J.B.; Bottero, A.; D’Amato, A.W.; Fraver, S.; Palik, B.J.; Battaglia, M.A.; Iverson, L.; Kenefic, L.; Kern, C.C. Competition amplifies drought stress in forests across broad climatic and compositional gradients. Ecosphere 2017, 8, 7. [Google Scholar] [CrossRef] [Green Version]
  5. Lu, K.; Chen, N.; Zhang, C.; Dong, X.; Zhao, C. Drought Enhances the Role of Competition in Mediating the Relationship between Tree Growth and Climate in Semi-Arid Areas of Northwest China. Forests 2019, 10, 804. [Google Scholar] [CrossRef] [Green Version]
  6. Canham, C.D.; Papaik, M.J.; Uriarte, M.; McWilliams, W.H.; Jenkins, J.C.; Twery, M.J. Neighborhood analyses of canopy tree competition along environmental gradients in New England forests. Ecol. Appl. 2006, 16, 540–554. [Google Scholar] [CrossRef] [Green Version]
  7. Ruíz-Benito, P.; Lines, E.; Gómez-Aparicio, L.; Coomes, D.; Zavala, M.A. Climatic effects on tree mortality are amplified by competition in Mediterranean forests. PLoS ONE 2013, e56843. [Google Scholar] [CrossRef] [Green Version]
  8. Fernandez-de-Uña, L.; Cañellas, I.; Gea-Izquierdo, G. Stand competition determines how different tree species will cope with a warming climate. PLoS ONE 2015, 10, e0122255. [Google Scholar] [CrossRef] [Green Version]
  9. Ford, K.R.; Breckheimer, I.K.; Franklin, J.F.; Freund, J.A.; Kroiss, S.J.; Larson, A.J.; Theobald, E.J.; Hille Ris Lambers, J. Competition alters tree growth responses to climate at individual and stand scales. Can. J. For. Res. 2017, 47, 53–62. [Google Scholar] [CrossRef] [Green Version]
  10. Mitchell, P.J.; O’Grady, A.P.; Tissue, D.T.; Worledge, D.; Pinkard, E.A. Co-ordination of growth, gas exchange and hydraulics define the carbon margin in tree species with contrasting drought strategies. Tree Physiol. 2014, 34, 443–458. [Google Scholar] [CrossRef]
  11. McDowell, N.G. Mechanisms linking drought, hydraulics, carbon metabolism, and vegetation mortality. Plant. Physiol. 2011, 155, 1051–1059. [Google Scholar] [CrossRef] [Green Version]
  12. Sala, A.; Woodruff, D.R.; Meinzer, F.C. Carbon dynamics in trees: Feast or famine? Tree Physiol. 2012, 32, 764–775. [Google Scholar] [CrossRef] [Green Version]
  13. Brodribb, T.J.; Cochard, H. Hydraulic failure defines the recovery and point of death in water-stressed conifers. Plant. Physiol. 2009, 149, 575–584. [Google Scholar] [CrossRef] [Green Version]
  14. Choat, B.; Jansen, S.; Brodribb, T.J.; Cochard, H.; Delzon, S.; Bhaskar, R.; Bucci, S.J.; Field, T.S.; Gleason, S.M.; Hacke, U.G.; et al. Global convergence in the vulnerability of forests to drought. Nature 2012, 491, 752–755. [Google Scholar] [CrossRef] [Green Version]
  15. Nardini, A.; Battistuzzo, M.; Savi, T. Shoot desiccation and hydraulic failure in temperate woody angiosperms during an extreme summer drought. New Phytol. 2013, 200, 322–329. [Google Scholar] [CrossRef]
  16. McDowell, N.; Pockman, W.T.; Allen, C.D.; Breshears, D.D.; Cobb, N.; Kolb, T.; Plaut, J.; Sperry, J.; West, A.; Williams, D.G.; et al. Mechanisms of plant survival and mortality during drought: Why do some plants survive while others succumb to drought? New Phytol. 2008, 178, 719–739. [Google Scholar] [CrossRef]
  17. McDowell, N.G.; Sevanto, S. The mechanisms of carbon starvation: How, when, or does it even occur at all? New Phytol. 2010, 186, 264–266. [Google Scholar] [CrossRef]
  18. Adams, H.D.; Germino, M.J.; Breshears, D.D.; Barron-Gafford, G.A.; Guardiola-Claramonte, M.; Zou, C.B.; Huxman, T.E. Nonstructural leaf carbohydrate dynamics of Pinus edulis during drought-induced tree mortality reveal role for carbon metabolism in mortality mechanism. New Phytol. 2013, 197, 1142–1151. [Google Scholar] [CrossRef]
  19. Mencuccini, M.; Minunno, F.; Salmon, Y.; Martínez-Vilalta, J.; Hölttä, T. Coordination of physiological traits involved in drought-induced mortality of woody plants. New Phytol. 2015, 208, 96–409. [Google Scholar] [CrossRef] [Green Version]
  20. Sánchez-Salguero, R.; Ortíz, C.; Covelo, F.; Ochoa, V.; García-Ruíz, R.; Seco, J.; Carreira, J.A.; Merino, J.A.; Linares, J.C. Regulation of water use in the southernmost European fir (Abies pinsapo Boiss.): Drought avoidance matters. Forests 2015, 6, 2241–2260. [Google Scholar] [CrossRef]
  21. Peguero-Pina, J.J.; Flexas, J.; Galmés, J.; Niinemets, U.; Sancho-Knapik, D.; Barredo, G.; Villarroya, D.; Gil-Pelegrín, E. Leaf anatomical properties in relation to differences in mesophyll conductance to CO2 and photosynthesis in two related Mediterranean Abies species. Plant. Cell Environ. 2012, 35, 2121–2129. [Google Scholar] [CrossRef]
  22. Sancho-Knapik, D.; Peguero-Pina, J.J.; Flexas, J.; Herbette, S.; Cochard, H.; Niinemets, U.; Gil-Pelegrín, E. Coping with low light under high atmospheric dryness: Shade acclimation in a Mediterranean conifer (Abies pinsapo Boiss.). Tree Physiol. 2014, 34, 1321–1333. [Google Scholar] [CrossRef]
  23. Lechuga, V.; Carraro, V.; Viñegla, B.; Carreira, J.A.; Linares, J.C. Managing drought-sensitive forests under global change. Low competition enhances long-term growth and water uptake in Abies pinsapo. For. Ecol. Manag. 2017, 406, 72–82. [Google Scholar] [CrossRef]
  24. Sperry, J.S.; Donnelly, J.R.; Tyree, M.T. A method for measuring hydraulic conductivity and embolism in xylem. Plant. Cell Environ. 1988, 11, 35–40. [Google Scholar] [CrossRef]
  25. Zimmermann, M.H. Xylem Structure and the Ascent of Sap; Springer: Berlin, Germany, 1983; p. 144. [Google Scholar]
  26. Cochard, H.; Cruiziat, P.; Tyree, M.T. Use of positive pressures to establish vulnerability curves. Plant. Physiol. 1992, 100, 205–209. [Google Scholar] [CrossRef] [Green Version]
  27. Sperry, J.S.; Saliendra, N.Z. Intra- and inter-plant variation in xylem cavitation in Betula occidentalis. Plant. Cell Environ. 1994, 17, 1233–1241. [Google Scholar] [CrossRef]
  28. Sperry, J.S.; Ikeda, T. Xylem cavitation in roots and stems of Douglas-fir and white-fir. Tree Physiol. 1997, 17, 275–280. [Google Scholar]
  29. Pammenter, N.W.; Willigen, C.V. A mathematical and statistical analysis of the curves illustrating vulnerability of xylem to cavitation. Tree Physiol. 1998, 18, 589–593. [Google Scholar] [CrossRef] [Green Version]
  30. Granier, A. Une nouvelle methode pour la measure du flux de seve brute dans le tronc des arbres. Ann. Sci. Forest. 1985, 42, 193–200. [Google Scholar] [CrossRef]
  31. Moore, G.W.; Bond, B.J.; Jones, J.A.; Meinzer, F.C. Thermal-dissipation sap flow sensors may not yield consistent sap-flux estimates over multiple years. Trees 2010, 24, 165–174. [Google Scholar] [CrossRef]
  32. Clearwater, M.J.; Meinzer, F.C.; Andrade, J.L.; Goldstein, G.; Holbrook, N.M. Potential errors in measurement of non-uniform sap flow using heat dissipation probes. Tree Physiol. 1999, 19, 681–687. [Google Scholar] [CrossRef] [Green Version]
  33. Poyatos, R.; Cěrmák, J.; Llorens, P. Variation in the radial patterns of sap flux density in pubescent oak (Quercus pubescens Willd.) and its implications for tree and stand transpiration measurements. Tree Physiol. 2007, 27, 537–548. [Google Scholar] [CrossRef] [Green Version]
  34. Ford, C.R.; McGuire, M.A.; Mitchell, R.J.; Teskey, R.O. Assessing variation in the radial profile of sap flux density in Pinus species and its effect on daily water use. Tree Physiol. 2004, 24, 241–249. [Google Scholar] [CrossRef] [Green Version]
  35. Popp, M.; Lied, W.; Meyer, A.J.; Richter, A.; Schiller, P.; Schwitte, H. Sample preservation for determination of organic compounds: Microwave versus freeze-drying. J. Exp. Bot. 1996, 47, 1469–1473. [Google Scholar] [CrossRef] [Green Version]
  36. Hansen, J.; Moller, I. Percolation of starch and soluble carbohydrates from plant tissue for quantitative determination with anthrone. Anal. Biochem. 1975, 68, 87–94. [Google Scholar] [CrossRef]
  37. Sutton, B.G.; Ting, I.P.; Sutton, R. Carbohydrate metabolism of cactus in a desert environment. Plant. Physiol. 1981, 68, 784–787. [Google Scholar] [CrossRef] [Green Version]
  38. Rose, R.; Rose, C.L.; Omi, S.K.; Forry, K.R.; Durall, D.M.; Bigg, W.L. Starch determination by perchloric acid vs. enzymes: Evaluating the accuracy and precision of six colorimetric methods. J. Agric. Food Chem. 1991, 39, 2–11. [Google Scholar] [CrossRef]
  39. Friedrich, S.; Brunner, E.; Pauly, M. Permuting longitudinal data in spite of the dependencies. J. Multivar. Anal. 2017, 153, 255–265. [Google Scholar] [CrossRef]
  40. R Development Core Team. R: A Language and Environment for Statistical Computing; R. Development Core Team: Vienna, Austria, 2019. [Google Scholar]
  41. Giorgi, F.; Lionello, P. Climate change projects for the Mediterranean region. Gl. Planet. Change 2008, 63, 90–104. [Google Scholar] [CrossRef]
  42. Lagergren, F.; Lindroth, A. Variation in sap flow and stem growth in relation to tree size, competition and thinning in a mixed forest of pine and spruce in Sweden. For. Ecol. Manag. 2004, 188, 51–63. [Google Scholar] [CrossRef]
  43. Dulamsuren, C.; Hauck, M.; Bader, M.; Oyungerel, S.; Dalaikhuu, O.; Nyambayar, S.; Leuschner, C. The different strategies of Pinus sylvestris and Larix sibirica to deal with summer drought in a northern Mongolian forest-steppe ecotone suggest a future superiority of pine in a warming climate. Can. J. For. Res. 2009, 39, 2520–2528. [Google Scholar] [CrossRef]
  44. Anfodillo, T.; Rento, S.; Carraro, V.; Furlanetto, L.; Urbinati, C.; Carrer, M. Tree water relations and climatic variations at the alpine timberline: Sesonal changes of sap flux and xylem water potential in Larix decidua, Picea abies and Pinus cembra. Ann. For. Sci. 1998, 55, 159–172. [Google Scholar] [CrossRef]
  45. Linares, J.C.; Covelo, F.; Carreira, J.A.; Merino, J. Phenological and water-use patterns underlying maximum growing season length at the highest elevations: Implications under climate change. Tree Physiol. 2012, 32, 161–170. [Google Scholar] [CrossRef] [Green Version]
  46. Martínez-Vilalta, J.; Piñol, J.; Beven, K. A hydraulic model to predict drought-induced mortality in woody plants: An application to climate change in the Mediterranean. Ecol. Model. 2002, 155, 127–147. [Google Scholar] [CrossRef]
  47. Piñol, J.; Sala, A. Ecological implications of xylem cavitation for several Pinaceae in the Pacific Northern USA. Funct. Ecol. 2000, 14, 538–545. [Google Scholar] [CrossRef]
  48. Peguero-Pina, J.J.; Sancho-Knapik, D.; Cochard, H.; Barredo, G.; Villarroya, D.; Gil-Pelegrín, E. Hydraulic traits are associated with the distribution range of two closely related Mediterranean firs, Abies alba Mill. and Abies pinsapo Boiss. Tree Physiol. 2011, 31, 1067–1075. [Google Scholar] [CrossRef]
  49. Oliveras, I.; Martínez-Vilalta, J.; Jiménez-Ortiz, T.; Lledó, M.J.; Escarré, A.; Piñol, J. Hydraulic properties of Pinus halepensis, Pinus pinea and Tetraclinis articulata in a dune ecosystem of Eastern Spain. Plant. Ecol. 2003, 169, 131–141. [Google Scholar] [CrossRef]
  50. Irvine, J.; Perks, M.P.; Magnani, F.; Grace, J. The response of Pinus sylvestris to drought: Stomatal control of transpiration and hydraulic conductance. Tree Physiol. 1998, 18, 393–402. [Google Scholar] [CrossRef]
  51. Sohn, J.A.; Saha, S.; Bauhus, J. Potential of forest thinning to mitigate drought stress: A meta-analysis. For. Ecol. Manag. 2016, 380, 261–273. [Google Scholar] [CrossRef]
  52. Aldea, J.; Bravo, F.; Bravo-Oviedo, A.; Ruiz-Peinado, R.; Rodriguez, F.; del Rio, M. Thinning enhances the species-specific radial increment response to drought in Mediterranean pine-oak stands. Agr. Forest. Meteorol. 2017, 237, 371–383. [Google Scholar] [CrossRef]
  53. Elkin, C.; Giuggiola, A.; Rigling, A.; Bugmann, H. Short- and long-term efficacy of forest thinning to mitigate drought impacts in mountain forests in the European Alps. Ecol. Appl. 2015, 25, 108–1098. [Google Scholar] [CrossRef] [PubMed]
  54. D’Amato, A.W.; Bradford, J.B.; Fraver, S.; Palik, B.J. Effects of thinning on drought vulnerability and climate response in north temperate forest ecosystems. Ecol. Appl. 2013, 23, 1735–1742. [Google Scholar] [CrossRef] [PubMed] [Green Version]
  55. Saunders, M.; Tobin, B.; Black, K.; Gioria, M.; Nieuwenhuis, M.; Osborne, B.A. Thinning effects on the net ecosystem carbon exchange of a sitka spruce forest are temperature-dependent. Agr. For. Meteorol. 2012, 157, 1–10. [Google Scholar] [CrossRef]
  56. Peguero-Pina, J.J.; Sancho-Knapik, D.; Flexas, J.; Galmés, J.; Niinemets, Ü.; Gil-Pelegrín, E. Light acclimation of photosynthesis in two closely related firs (Abies pinsapo Boiss. and Abies alba Mill.): The role of leaf anatomy and mesophyll conductance to CO2. Tree Physiol. 2016, 36, 300–310. [Google Scholar] [CrossRef] [PubMed] [Green Version]
  57. Dietze, M.C.; Sala, A.; Carbone, M.S.; Czimczik, C.I.; Mantooth, J.A.; Richardson, A.D.; Vargas, R. Non-structural carbon in woody plants. Annu. Rev. Plant. Biol. 2014, 65, 667–687. [Google Scholar] [CrossRef] [PubMed] [Green Version]
  58. Wiley, E.; Helliker, B. A re-evaluation of carbon storage in trees lends greater support for carbon limitation to growth. New Phytol. 2012, 195, 285–289. [Google Scholar] [CrossRef]
  59. Körner, C. Carbon limitation in trees. J. Ecol. 2003, 91, 4–17. [Google Scholar] [CrossRef] [Green Version]
  60. Oberhuber, W.; Swidrak, I.; Pirkebner, D.; Gruber, A. Temporal dynamics of nonstructural carbohydrates and xylem growth in Pinus sylvestris exposed to drought. Can. J. For. Res. 2011, 1597, 1590–1597. [Google Scholar] [CrossRef] [Green Version]
  61. Piper, F. Drought induces opposite changes in the concentration of non-structural carbohydrates of two evergreen Nothofagus species of differential drought resistance. Ann. For. Sci. 2011, 68, 415–424. [Google Scholar] [CrossRef] [Green Version]
  62. DeSoto, L.; Olano, J.M.; Rozas, V. Secondary Growth and Carbohydrate Storage Patterns Differ between Sexes in Juniperus thurifera. Front. Plant. Sci. 2016, 7, 723. [Google Scholar] [CrossRef] [Green Version]
  63. Carbone, M.S.; Czimczik, C.I.; Keenan, T.F.; Murakami, P.F.; Pederson, N.; Schaberg, P.G.; Xu, X.; Richardson, A.D. Age, allocation and availability of nonstructural carbon in mature red maple trees. New Phytol. 2013, 200, 1145–1155. [Google Scholar] [CrossRef] [PubMed] [Green Version]
  64. Garcia-Forner, N.; Biel, C.; Savé, R.; Martinez-Vilalta, J. 2016. Isohydric species are not necessarily more carbon limited than anisohydric species during drought. Tree Physiol. 2016, 37, 441–445. [Google Scholar] [CrossRef] [PubMed] [Green Version]
  65. Dang, H.S.; Zhang, K.R.; Zhang, Q.F.; Xu, Y.M. Temporal variations of mobile carbohydrates in Abies fargesii at the upper tree limits. Plant. Biol. 2015, 17, 106–113. [Google Scholar] [CrossRef] [PubMed]
  66. Fajardo, A.; Piper, F.; Pfund, L.; Körner, C.; Hoch, G. Variation of mobile carbon reserves in trees at the alpine treeline ecotone is under environmental control. New Phytol. 2012, 195, 794–802. [Google Scholar] [CrossRef]
Figure 1. Seasonal dynamics of air temperature (a), air vapor pressure deficit (b), and volumetric soil water content (c) recorded in control plots at low elevation (CL), thinned plots at low elevation (TL), and control plots at high elevation (CH). Vertical lines indicate the sampling days for gas exchange, xylem water potential, and non-structural carbohydrates. Error bars indicate the standard error between plot replicates.
Forests 10 01132 g001
Figure 2. Mean monthly sap flow density (SFD) in control low elevation (CL), thinning low elevation (TL), and control high elevation (CH) stands. Means ± standard errors of the daily data are shown. Different letters indicate significant differences by repeated measures ANOVA between treatments at a given month.
Forests 10 01132 g002
Figure 3. Relationship observed between mean monthly sap flux density (SFD) and (a) soil water content (SWC), and (b) air vapor pressure deficit (VPD) using polynomial quadratic relationships. SWC: CL, R2 = 0.50; p = 0.0014; TL, R2 = 0.75; p < 0.0001; CH, R2 = 0.51; p = 0.0012. VPD: CH, R2 = 0.80; p < 0.0001. Dashed lines indicate non-significant relationships.
Forests 10 01132 g003
Figure 4. Xylem cavitation vulnerability estimated as the percentage loss of conductivity (PLC). Experimental loss in hydraulic conductivity (a) was obtained by injection pressure. Theoretical dynamics (b) were estimated from the adjusted parameters using Equation (2) [29]. CL, n = 7; TL, n = 7; CH, n = 4. Error bars show the standard error. Dashed lines show the 12% (PLC12), 50% (PLC50), and 88% (PLC88) loss of conductivity, respectively.
Forests 10 01132 g004
Figure 5. Accumulated radial growth (a), photosynthesis rate, AN (b), stomatal conductance, gS (c), and xylem water potential, Ψ (d), in control low elevation (CL), thinning low elevation (TL), and control high elevation (CH). Means ± standard errors are shown. Within each date, different letters indicate significant differences (ANOVA) between treatments at a given sampling.
Forests 10 01132 g005
Figure 6. Temporal dynamics of non-structural carbohydrates (NSCs) in needles (ac), branches (df), and stem sapwood (gi). Upper panels show the soluble sugars (a,d,g). Middle panels show the starch (b,e,h). Bottom panels show the total NSCs (c,f,i). CL, n = 5; TL), n = 5; CH, n = 6. Error bars show the standard error. Different letters indicate significant differences (ANOVA) between treatments at a given sampling.
Forests 10 01132 g006
Table 1. Characteristics of the Abies pinsapo stands in control plots at low elevation (CL), thinned plots at low elevation (TL), and control plots at high elevation (CH). Values between parentheses show the standard error (two plots per factor).
TreatmentCLTLCH
Basal area(m2 ha−1)31.45(3.8)13.40(1.41)9.15(2.76)
Density(trees ha−1)1616(664)571(15)502(62)
Tree diameter(DBH, cm)13.00(1.70)14.15(2.05)7.90(0.57)
Tree age(years at DBH)45(2)46(2)29(1)
Table 2. Characteristics of the Abies pinsapo branches sampled to estimate hydraulic conductivity and percentage loss of conductivity in control plots at low elevation (CL), thinned plots at low elevation (TL), and control plots at high elevation (CH). Kh: hydraulic conductivity; Ks: specific hydraulic conductivity; Kl: branch conductivity per needle area; Al: leaf area; a: slope parameter; b(PLC50): xylem pressure, which produces a 50% loss of conductivity; PLC12: xylem pressure, which produces a 12% loss of conductivity; PLC88: xylem pressure, which produces an 88% loss of conductivity (see Equation (2) in the material and methods); the R2 and number of branches (n) are also indicated. Values between parentheses show the standard error; different letters indicate significant differences between treatments (ANOVA).
TreatmentCLTLCH
Tree diameter(DBH, cm)8.16(1.10)7.63(0.85)5.25(2.13)
Branch diameter(mm)9.70(0.30)9.60(0.30)8.30(0.30)
Branch age(years)13(2) a11(2) a5(2) b
Kh(kg m4 MPa−1 s−1)2.51 × 10⁻⁵(8.4 × 10⁻⁶)2.3 × 10⁻⁵(3.8 × 10⁻⁶)1.05 × 10⁻⁵(4.7 × 10⁻⁶)
Ks(kg m2 MPa−1 s−1)0.33(0.09)0.32(0.05)0.19(0.08)
Kl(kg m2 MPa−1 s−1)1.16 × 10⁻⁴(2.6 × 10⁻⁵)0.91 × 10⁻⁴(1.6 × 10⁻⁵)0.68 × 10⁻⁴(2.8 × 10⁻⁵)
Al(m2)0.21(0.02) ab0.25(0.02) a 0.14(0.01) b
a 0.64(0.12)0.76 (0.12)0.93 (0.11)
b (PLC50)(MPa)−6.94(0.7)−6.55(0.11)−5.73(0.72)
PLC12(MPa)−3.83(0.7)−3.82(0.74)−3.59(0.72)
PLC88(MPa)−10.05(0.7)−9.29(0.74)−7.89(0.72)
R2 0.82(0.07)0.84(0.05)0.91(0.01)
N 7 7 4

