Article

Future Climate Change Will Have a Positive Effect on Populus davidiana in China

1
College of Forestry, Northwest A&F University, Yangling 712100, China
2
Institute of Soil and Water Conservation, Chinese Academy of Sciences and Ministry of Water Resources, Yangling 712100, China
3
State Key Laboratory of Soil Erosion and Dryland Farming on the Loess Plateau, Northwest A&F University, Yangling 712100, China
*
Author to whom correspondence should be addressed.
Forests 2019, 10(12), 1120; https://doi.org/10.3390/f10121120
Submission received: 15 October 2019 / Revised: 4 December 2019 / Accepted: 6 December 2019 / Published: 8 December 2019
(This article belongs to the Section Forest Ecology and Management)

Abstract

:
Since climate change significantly affects global biodiversity, a reasonable assessment of the vulnerability of species in response to climate change is crucial for conservation. Most existing methods estimate the impact of climate change on the vulnerability of species by projecting the change of a species’ distribution range. This single-component evaluation ignores the impact of other components on vulnerability. In this study, Populus davidiana (David’s aspen), a tree species widely used in afforestation projects, was selected as the research subject under four future climate change scenarios (representative concentration pathway (RCP)2.6, RCP4.5, RCP6.0, and RCP8.5). Exposure components of range change as well as the degree of fragmentation, degree of human disturbance, and degree of protection were considered simultaneously. Then, a multicomponent vulnerability index was established to assess the effect of future climate change on the vulnerability of P. davidiana in China. The results show that the distribution range of P. davidiana will expand to the northwest of China under future climate change scenarios, which will lead to an increased degree of protection and a decreased degree of human disturbance, and hardly any change in the degree of fragmentation. The multicomponent vulnerability index values of P. davidiana under the four emission scenarios are all positive by 2070, ranging from 14.05 to 38.18, which fully indicates that future climate change will be conducive to the survival of P. davidiana. This study provides a reference for the development of conservation strategies for the species as well as a methodological case study for multicomponent assessment of species vulnerability to future climate change.

1. Introduction

Global climate change can have a great impact on biodiversity [1,2,3,4]. If the trend of climate warming is not effectively stopped, 15%–35% of terrestrial species will become extinct globally from only a 2 °C rise in temperature, which will undoubtedly bring severe challenges for the conservation of species [5]. Therefore, in the context of global climate change, how the vulnerability of species is assessed has become an issue that governments, ecologists, and the public are committed to solving [6,7,8,9].
Currently, climatic impacts on the vulnerability of species are commonly assessed by changes of species’ ranges under different climate conditions (e.g., past, current, or future scenarios) [10,11,12]. However, this is only a single component of species’ vulnerability to climate change. In a study by Ewers et al. [13], it was found that habitat fragmentation harms species’ persistence by reducing the core area and increasing the edge effects, which increases their vulnerability to a certain degree. Li et al. [14] found that climatic factors and human disturbance were equally important in determining the distribution of Liaotung oak (Quercus wutaishanica) in China. Cianfrani et al. [15] suggested that changes in fragmentation, as well as shifts in both protected areas and human footprint, could also have a dramatic effect on the vulnerability of species in response to climate change.
From the above literature review, we could summarize four external exposure factors that affect the vulnerability of species: Range change, fragmentation, protection area, and human disturbance [13,14,15]. Although these four factors are classical indicators, they are rarely used to describe the vulnerability of species in combination with range change in response to future climate change. Cianfrani et al. [15] suggested that these components play an equally important role in determining the vulnerability of species, and they normalized the value of vulnerability in these components from −100 to 100. Then, they established an overall vulnerability index by averaging the vulnerability in the four components, which challenges the classical approach of evaluation using only one component. They proposed that the integrated vulnerability index offers a new opportunity to develop a more comprehensive way to assess the vulnerability of species and could be easily extended to any species.
Populus davidiana (David’s aspen), one of the six aspen species (Populus spp.) across the world, is a deciduous tree of the family Salicaceae and is widely distributed in eastern Asia (northeast China, Korean peninsula) [16]. The harvest rotations of P. davidiana are generally short and the fast growth facilitates commercial forestry, so it is widely planted in China through the encouragement of government programs targeting conversion of crop lands to forest cover [17]. The P. davidiana forest covers about 21,600 km2 in China, which is substantially less than the potential/historical extent [18]. At present, most research regarding P. davidiana mainly focuses on the following aspects: Physiological ecology [19,20,21], genetic variation [22,23], genetic expression [24,25], tissue culture [26,27], and spatial structure [28]. All these provide a basis for the protection and utilization of P. davidiana. However, Rogers et al. [16] highlighted that climate warming is one of the common threats to aspen ecosystems from a global point of view for six aspen species by means of a qualitative survey and systematic literature analysis. Although Zhao et al. [29] took a preliminary step in this area and suggested that moderate drought may favor quick regeneration of P. davidiana based on monitoring of past community data, few studies have explored its vulnerability under future climate change. Therefore, we still do not fully understand how future climatic change will affect the growth and survival of P. davidiana. To solve this problem, we used P. davidiana as a research subject in this study and evaluated the projected effects of future climate on the vulnerability of the species based on the method established by Cianfrani et al. [15]. We proposed the following two hypotheses:
Hypotheses (H1).
According to current studies on other trees with ranges similar to P. davidiana, climate change will drive their range expansion in the future, such as Pinus tabulaeformis [30] and Hippophae rhamnoides [31]. Therefore, we hypothesized that P. davidiana will expand its distribution range in response to future climate change, and its vulnerability will get positive values in the future according to the range change method (RCM; mainstream approach).
Hypotheses (H2).
Although the RCM has been successfully used in many studies to support decision-making [4,5,6,7,13], it implies an assumption that the other three exposure factors are less important and unchanged in the future. Therefore, we hypothesized that the relative contribution of the range change component to vulnerability would be much larger than that of the other three components (fragmentation, protected area, and human disturbance) in determining the vulnerability of P. davidiana under future climate change scenarios.
Addressing these questions has important practical significance for the protection and sustainable utilization of P. davidiana in the future.

2. Materials and Methods

2.1. Species Occurrence Data

P. davidiana is distributed in East Asia (northeast China, Korean peninsula), with almost all potential distribution areas located in China (Appendix A, Figure A1). Here, we collected the species occurrence records in the context of China, mainly obtained from the Chinese Virtual Herbarium [32]. The Chinese Virtual Herbarium is a free and open access database that integrates the herbarium data of national natural museums from 300 institutions and stores more than 6 million specimens across China. A total of 1509 specimens were identified by the coordinates recorded in the database or coordinates derived from place names included in the database. Spatially clustered records can cause model overfitting and lead to non-independent simulations, so we rasterized the obtained records at a spatial resolution of 10 × 10 arcmin [30,33]. Finally, we got 266 valid points, which were used to establish a species distribution model.

2.2. Climatic Variables and Their Layers under Current and Future Conditions

Climatic variables were selected from the BIOCLIM system (CSIRONET, Australia) [1] and identified in conjunction with the Holdridge life zone system (University of Michigan, USA) [34] and the Kira indices (Kyoto University, Japan) [35]. The three groups of climatic variables are widely used in research on the relationship between species/vegetation and climate on a regional or global scale. For example, the BIOCLIM system contributes 19 climatic variables that can characterize the hydrothermal requirements of species around the world. The Holdridge life zone system contributes 3 climatic variables that can globally describe the potential distribution of life form on earth. The Kira indices, with 3 climatic variables, can accurately depict boundaries of vegetation zones in China and East Asia. In this study, all variables in the Holdridge life zone system and Kira indices were selected as candidate factors, together with 7 other variables from the BIOCLIM system. Finally, a set of 13 climatic variables were used to characterize the climatic niche of China (Table 1).
The current climatic layers were obtained from the WorldClim database [36] with a spatial resolution of 10 arc min and a coordinate system of WGS84 (National Geospatial-Intelligence Agency, USA). The current climate layers were generated on the basis of thin-plate smoothing splines using the mean values of the latitude, longitude, altitude, and monthly temperature and precipitation data recorded by meteorological stations over 50 years (1950–2000) [37].
The choice of future climate projections is critical for forest adaptive management and strategic planning [38]. There is no supremacy among different general circulation models (GCMs), but attempts should be made to justify their use. Recently, Xu and Xu [39] evaluated the simulation performance of 18 GCMs from coupled model intercomparison project 5 (CMIP5) across China based on the past of temperature and precipitation during 1961–2005. They suggested that most GCMs underestimate the actual temperature and overestimate precipitation in China. Although Xu and Xu [39] reported the results of comparisons, they still did not give a reasonable standard for selecting a particular GCM in China. As far as we know, there is still no optimal GCM suitable for every part of China. Fortunately, Giorgi and Mearns [40] provided an easy way to generate reasonable future climate data and proved that the ensemble averaging approach could filter out biases of individual GCMs and retain only those errors that are generally pervasive and could compare better with the observed climatology than an individual model.
At present, the Fifth Assessment Report of the Intergovernmental Panel on Climate Change (IPCC5) has published more than 20 GCMs that can reflect the uncertainty of future climate generated by GCM algorithms. However, it is very energy-consuming work to collect all GCMs and integrate them under each representative concentration pathway (RCP) scenario for each climatic variable. Here, we use a typical sampling method to select 7 GCMs from 6 countries with 7 research teams. They are BCC-CSM1-1(Beijing Climate Center Climate System Model version 1, BBC, China), CCSM4 (The Community Climate System Model version 4, NCAR, USA), GISS-E2-R (Goddard Institute for Space Studies Model E version 2, GISS, USA), HadGEM2-AO (Hadley Centre Global Environment Model version 2, MOHC, UK), IPSL-CM5A-LR (Institute Pierre Simon Laplace Climate Model 5A-Low Resolution, IPSL, France), MIROC-ESM-CHEM (Atmospheric Chemistry Coupled Version of Model for Interdisciplinary Research on Climate-Earth System, AMSTEC, AORI, NIES, Japan), and NorESM1-M (The Norwegian Earth System Model version 1, NCC, Norway).
All the candidate outputs of GCMs are provided by the WorldClim database [36], with availability of all 4 RCP scenarios (only 8 GCMs provide data for all 4 RCPs in the database). We assumed that a simple arithmetic average of these 7 GCMs could represent results similar to those of all GCMs, and we acknowledge that this hypothesis still needs further testing. At least we can make sure that the integrated method can overcome the shortcomings of the single method and retain the overall trend of climate change, which has been used in past research [40,41]. The method has been successfully applied to the projection of future potential distribution of Pinus tabulaeformis [30] and Hippophae rhamnoides [31] with ranges similar to P. davidiana. In the study, the time period 2061–2080 (represented by 2070) was selected as the target for future climate estimation and 4 representative concentration pathways were considered to deal with the uncertainty of carbon dioxide emission paths: RCP2.6, RCP4.5, RCP6.0, and RCP8.5.

2.3. Species Distribution Simulation under Current and Future Climate

Predicting the response of species to climate change is an extremely complex and active field of research [41,42]. Despite a number of limitations (lack of biological process as well as methodological and theoretical issues [43]), species distribution models still constitute most of the studies in this area [44] and have been successfully used to support decision-making.
Currently, many algorithms have been developed, such as the box algorithm, genetic algorithm, maximum entropy algorithm, and distance algorithm. Although there are consistencies between these models, many studies have shown that maximum entropy modeling (MaxEnt) is widely used and usually produces accurate predictions of species distributions [45,46]. Here, we chose the MaxEnt model [47] to simulate distribution of species. MaxEnt finds the statistical relationship between occurrence records and climatic variables through the algorithm of maximum entropy and is often evaluated by 10-fold cross-validation.
The area under the curve (AUC) and kappa values were used to evaluate the performance of MaxEnt simulation. The criteria for AUC were as follows [14,48]: Poor, 0.5–0.6; fair, 0.6–0.7; good, 0.7–0.8; very good, 0.8–0.9; and excellent, 0.90–1.00. The standard for kappa was as follows [49,50]: Poor, 0.00–0.40; fair, 0.40–0.55; good, 0.55–0.70; very good, 0.70–0.85; and excellent, 0.85–1.00. The optimal threshold was calculated based on the criteria of maximum sensitivity and specificity and was used to convert a probability map into a binary map of 0/1, where one represents a suitable habitat and zero represents an unsuitable habitat. Then, we obtained the current binary map of P. davidiana based on MaxEnt simulation. A jackknife test (systematically leaving out each variable) was used to evaluate the importance of climatic factors in determining the potential distribution of species. Climatic variables with contribution percentage greater than 10% were considered as important climatic factors [51,52].
For future projections, we considered the same set of climatic variables for the target year 2070. The simulation result of MaxEnt was projected onto future climatic conditions (RCP2.6, RCP4.5, RCP6.0, and RCP8.5) to produce future probability maps of species. Then, four future probability maps were also converted into future binary maps based on the optimal threshold used previously. Finally, we used the following equation proposed by Huang et al. [31] to recalculate the current and future binary maps:
RCMAPi = FMAPi × 2 + CMAPi
where RCMAP is the range shift map, FMAP is the future binary map, and CMAP is the current binary map. Subscript i represents climatic change scenarios (RCP2.6, RCP4.5, RCP6.0, and RCP8.5). According to the above map integration processes, we obtained 4 maps with grid values of 0, 1, 2, and 3, which could be used to visualize range shift dynamics of P. davidiana under each RCP scenario; 0 represents an unsuitable habitat, 1 represents loss of suitable habitat, 2 represents expansion of suitable habitat, and 3 represents stable suitable habitat.

2.4. Measures of Species Vulnerability to Climate Change in Different Components

Under future climate change, species will be affected differently by exposure components. That is, some components will have a positive impact on species and be conducive to their survival, whereas other components will have a negative impact and pose a threat to survival. Based on this, we used + and − to represent positive and negative effects, respectively. We set the maximum positive impact as +100 and the maximum negative impact as −100 for each component, according to the definition of Cianfrani et al. [15]. Finally, we obtained the overall vulnerability index of the species by averaging the values of all components.

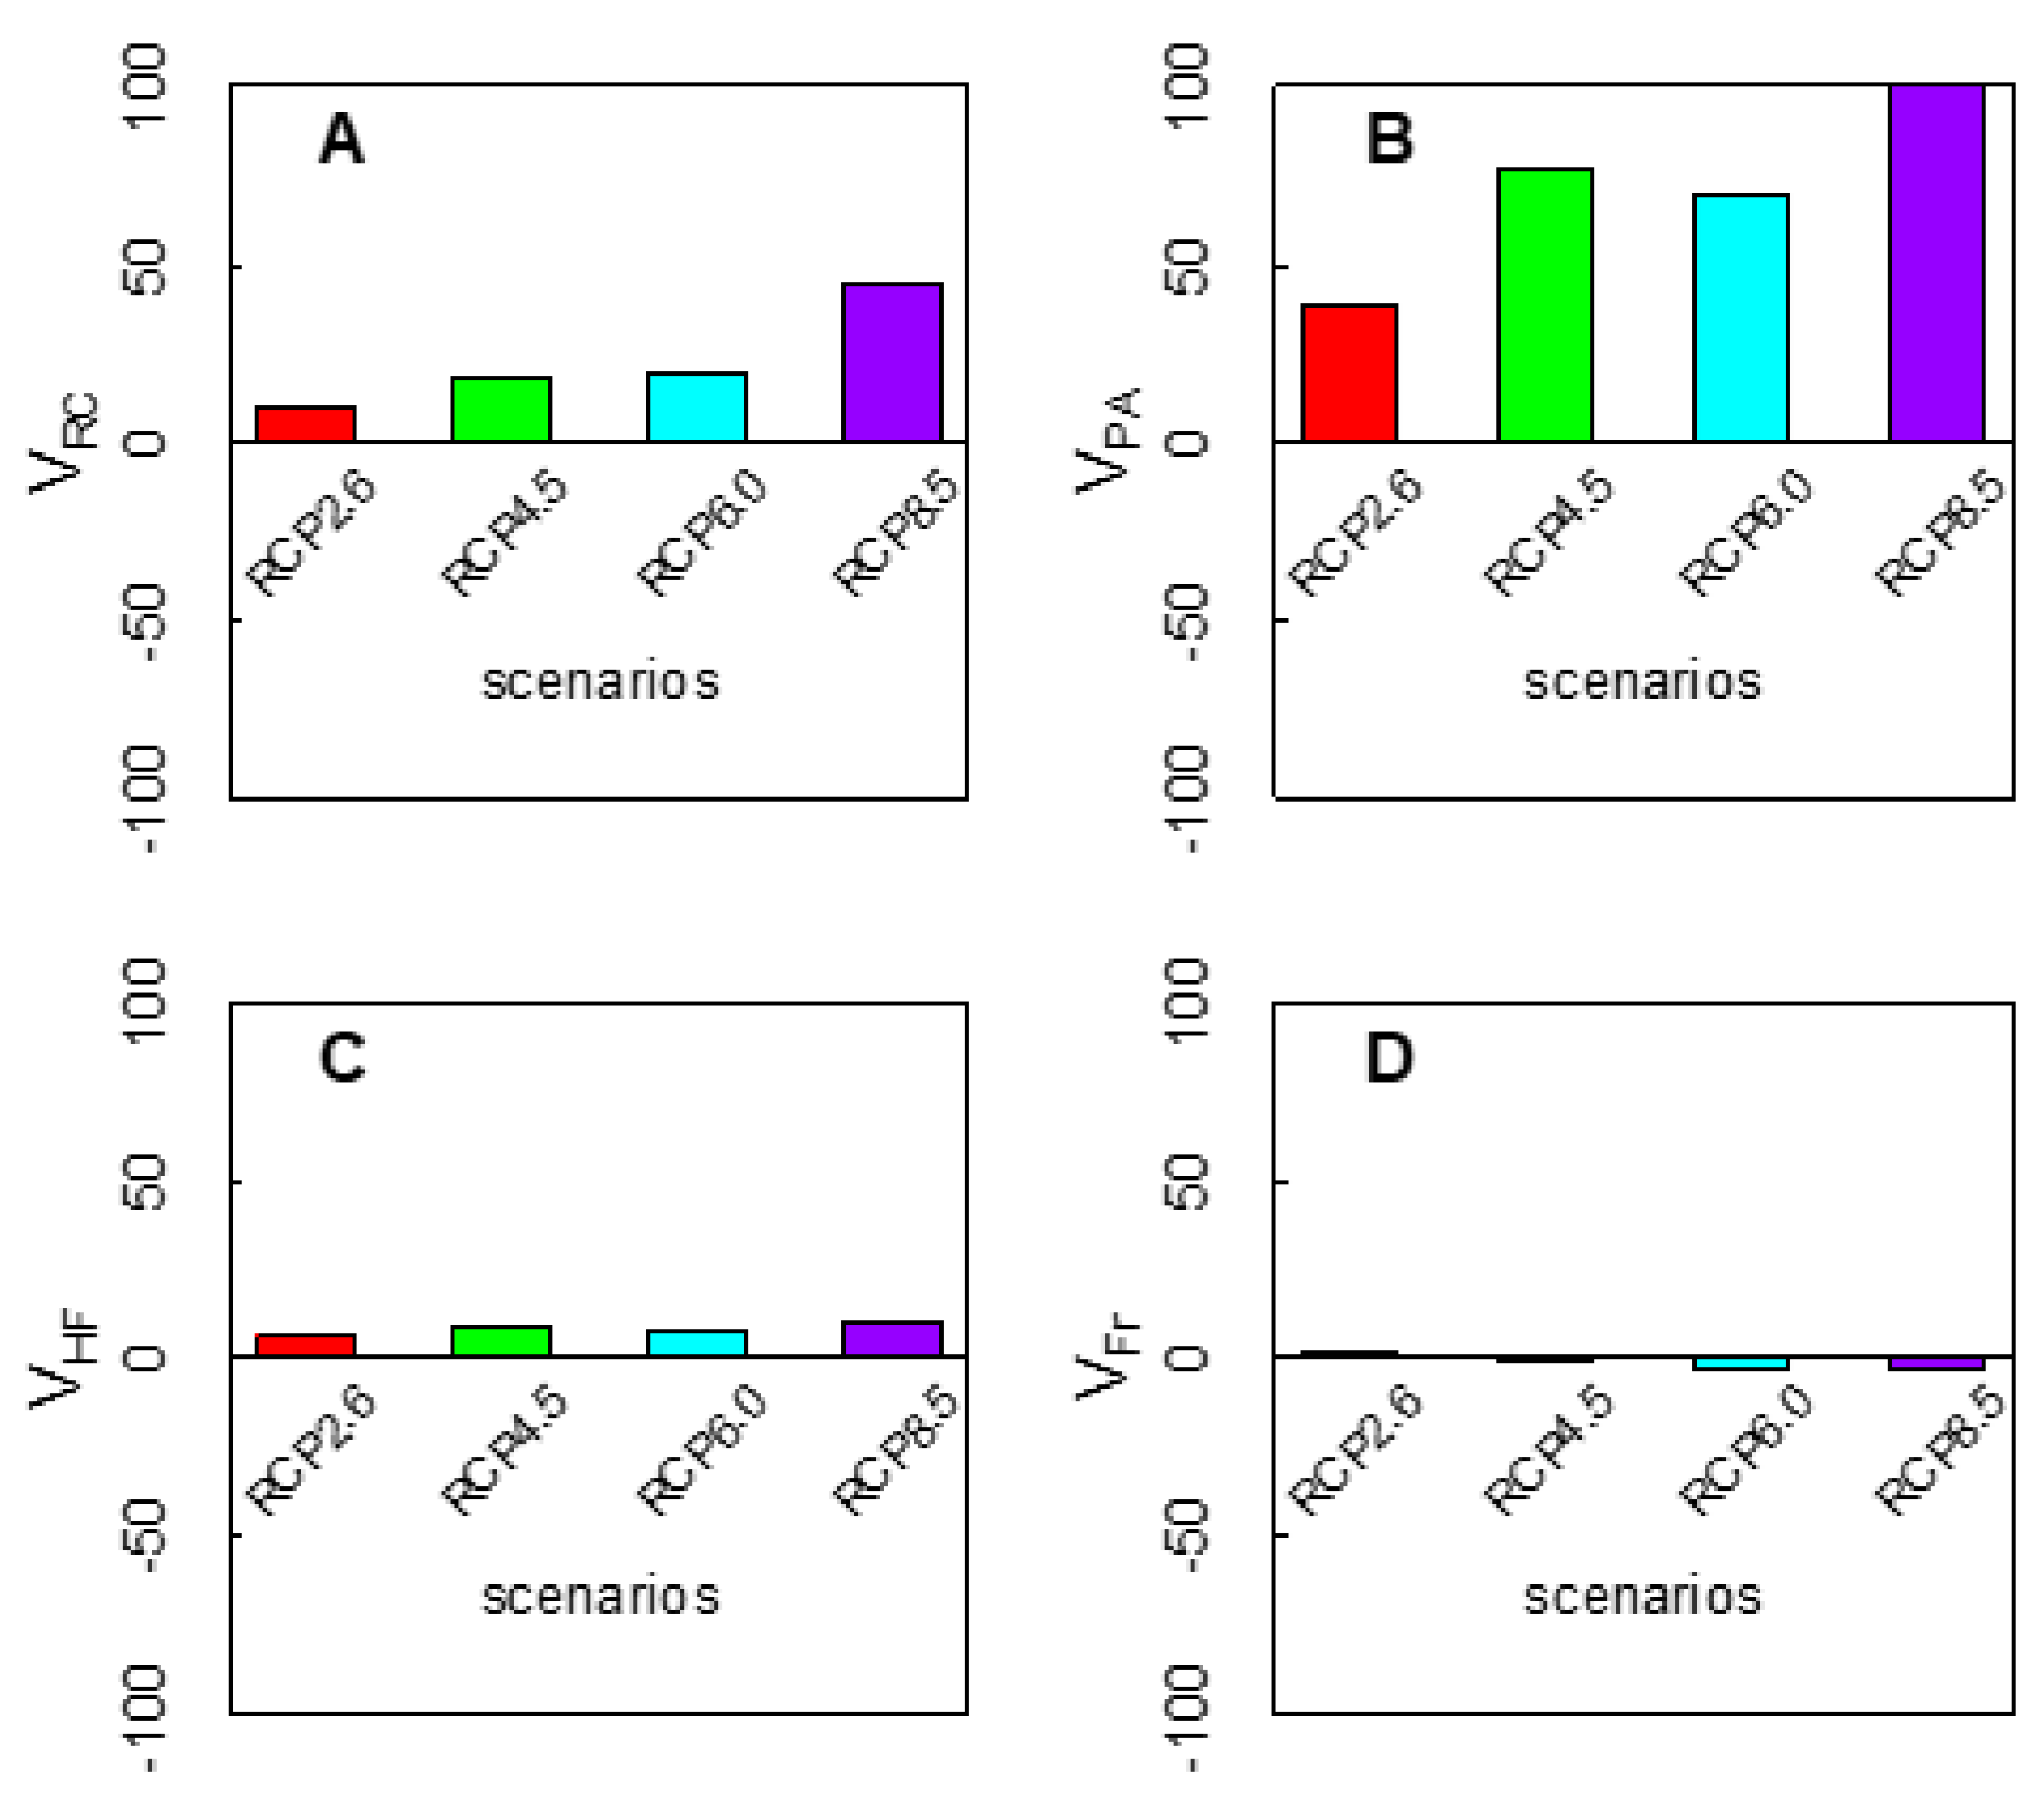
2.4.1. Vulnerability in the Component of Range Change (VRC)

The range changes were quantified using the area of suitable habitat for current and future scenarios, and the proportion change was calculated using the following equation:
Src = (SfSc)/Sc
where Src represents the proportion change of suitable habitat, Sf represents the size of the future suitable habitat, and Sc represents the size of the current suitable habitat. Since range expansion will have a positive effect on species, VRC = Src × 100 (if −1 ≤ Src ≤ 1) or VRC = 100 (if Src > 1).

2.4.2. Vulnerability in the Component of Protected Area (VPA)

The degree of protection was measured by the overlap between suitable habitats and protected areas. The protected areas were obtained from the World Database on Protected Areas (WDPA, www.wdpa.org, updated 2013). After masking, the proportion change of protected areas within suitable areas was calculated using the following equation:
Prc = (PfPc)/Pc
where Prc represents the proportion change of protected areas, Pf represents the size of future protected areas, and Pc represents the size of current protected areas. Since the expansion of protected areas will have a positive impact on species, VPA = Prc × 100 (if −1 ≤ Prc ≤ 1) or VPA = 100 (if Prc > 1).

2.4.3. Vulnerability in the Component of Human Footprint (VHF)

Human footprint layers are used to represent the degree of disturbance on Earth, which is an estimate of human influence based on population density, land transformation, accessibility, and infrastructure data collected from the 1960s to 2001 [53]. Based on the assumption that the distribution of human footprint will remain unchanged in the future, the suitable climatic habitats of P. davidiana were superimposed on the human footprint map to calculate the mean value of human footprint in suitable climatic habitats of P. davidiana under current and future climate change scenarios. After masking, the proportion change of human footprint within suitable areas under current and future climate conditions was calculated using the following equation:
HFrc = (HFfHFc)/HFc
where HFrc is the proportion change of the human footprint, HFf is the average value of the human footprint in the future climate, and HFc is the average value of the human footprint in the current climate. The higher the HFrc value, the stronger the human disturbance will be, indicating that species are negatively affected. Therefore, it is considered that VHF = −HFr × 100 (if −1 ≤ HFrc ≤ 1) or VHF = 100 (if HFrc > 1).

2.4.4. Vulnerability in the Component of Fragmentation (VFr)

The PatchStat function in the SDMTools [54] package was used to calculate the number of boundaries (N_edgs_per), perimeter (Per_per), area (Area_per), and core area index (Core_area) of each patch in suitable habitats under current and future climate scenarios. The total patch boundary number (Ed = Σ(N_edges_per)), total perimeter area ratio (P_A = Σ(Per_per)/Σ(Area_per)), total shape index (Shape = 0.25 × Σ(Per_per)/sqrt(Σ(Area_per))), and core area index (CA = Σ(Core_area)/Σ(Area_per)) were also calculated. The impact of each patch component on species vulnerability is different, including both positive and negative values. The greater the values of P_A and Shape, the greater the degree of fragmentation and the greater the negative impact on species. On the contrary, the larger the values of CA and Ed, the smaller the degree of fragmentation and the greater the positive impact on species. Therefore, the vulnerability of species within the component of fragmentation (VFr) was calculated according to the following equation:
VFr = (CA + EdP_AShape)/4.

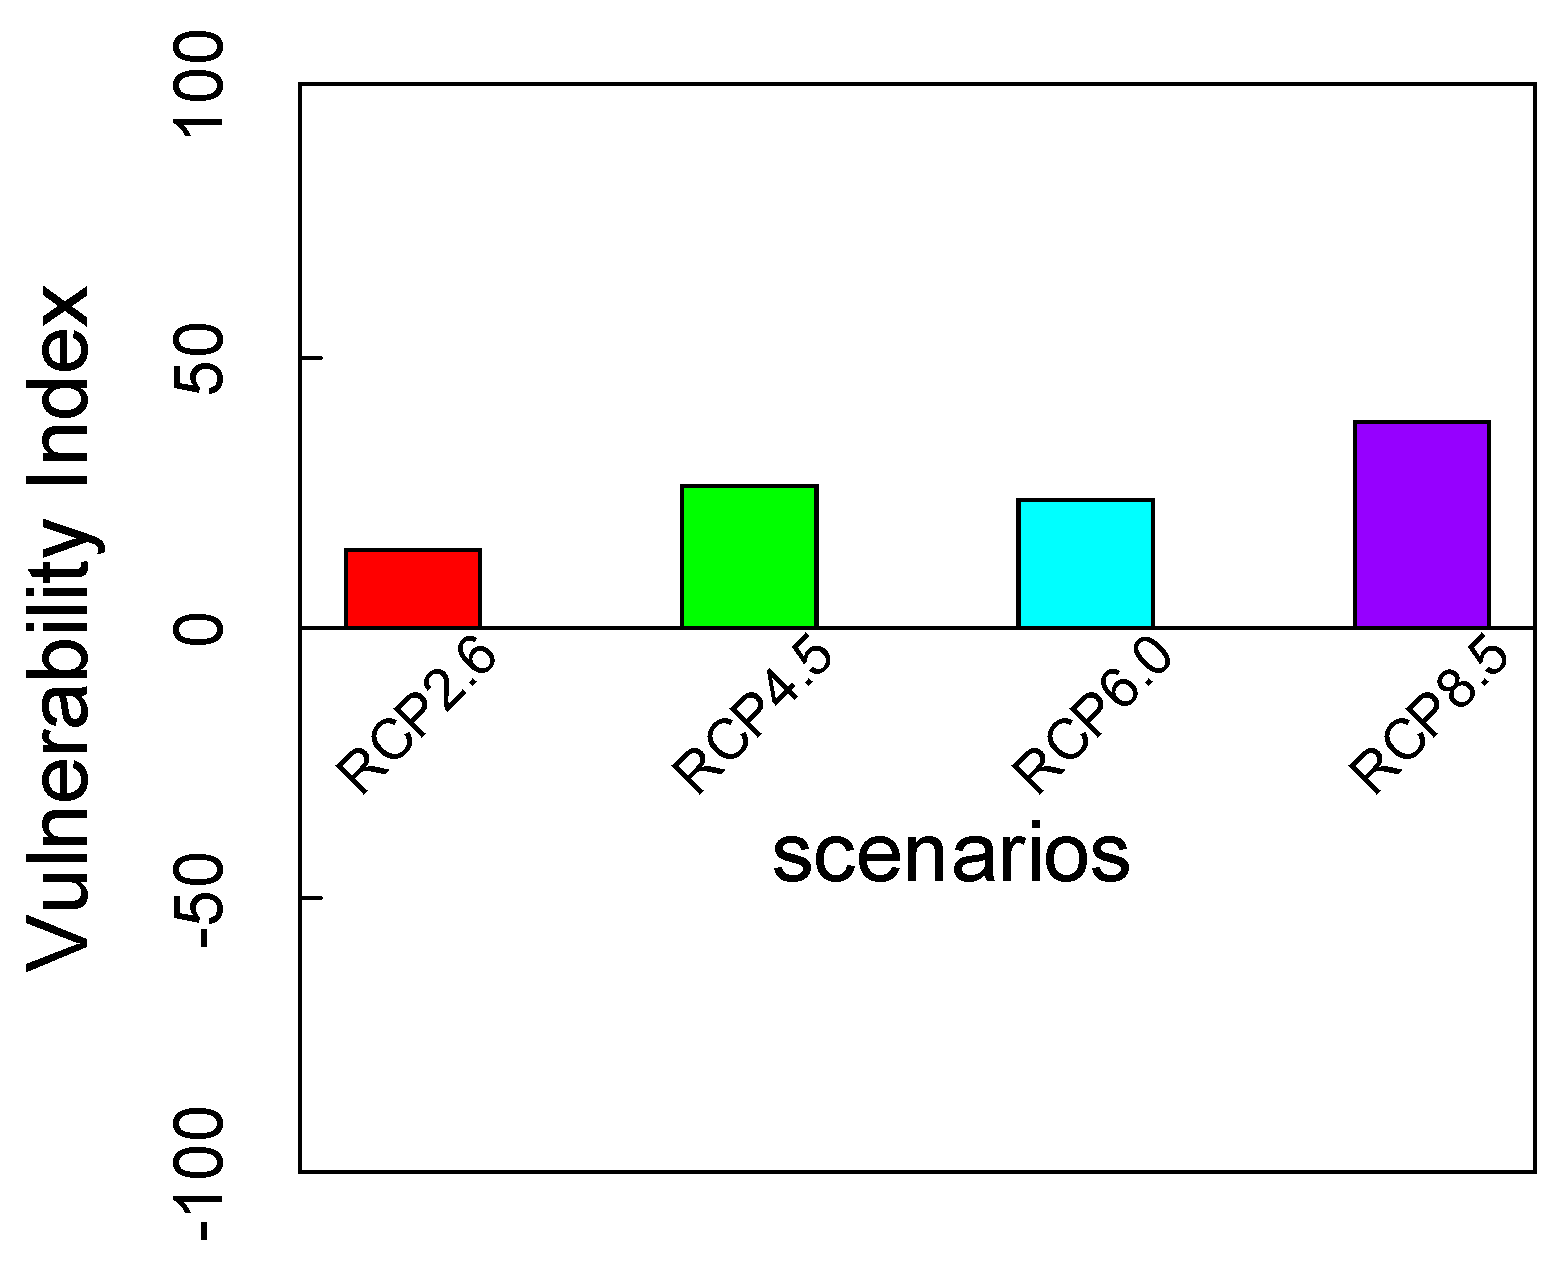
2.4.5. Overall Vulnerability Index (V)

There is subjectivity in assigning weight values to the vulnerability of species in different components. When Cianfrani et al. [15] assessed otter vulnerability, 11 weights with an interval size of 0.1 between 0 and 1 were tested. By assigning different weights to different components, the overall vulnerability index of most species did not exhibit significant changes. Therefore, they suggested that the overall vulnerability of species is almost unaffected by the weights of different components. Based on this, we chose to use an equal weight in this study. Finally, the overall vulnerability index of P. davidiana under each future scenario was calculated using the following equation:
V = (VRC + VPA + VHF + VFr)/4.

3. Results

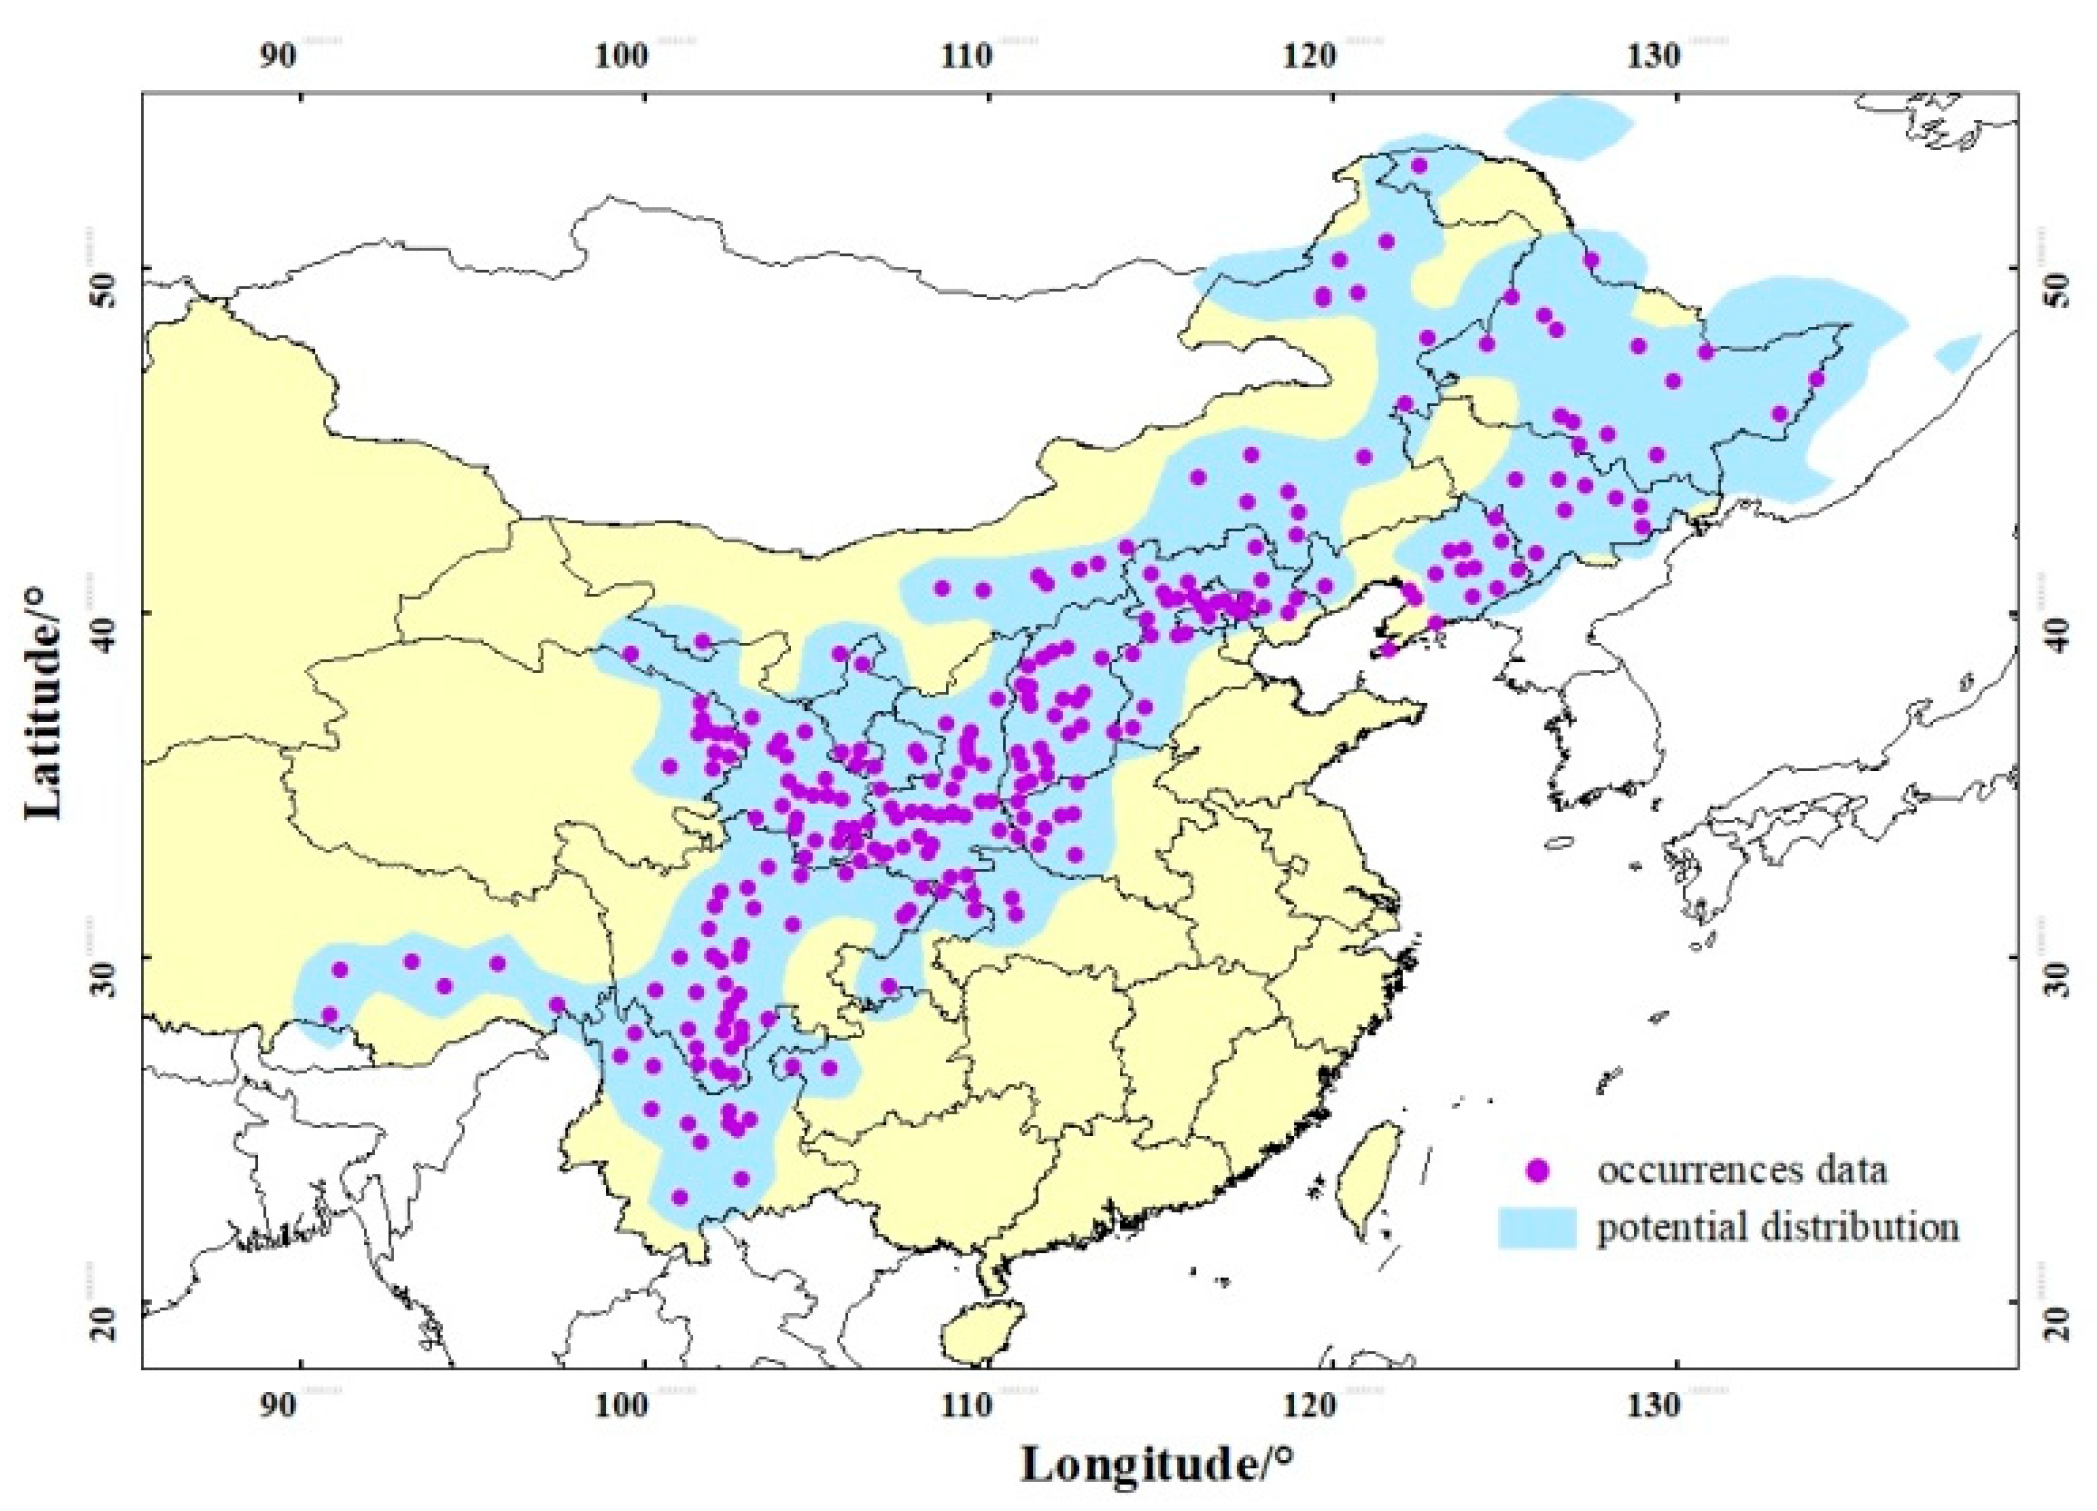
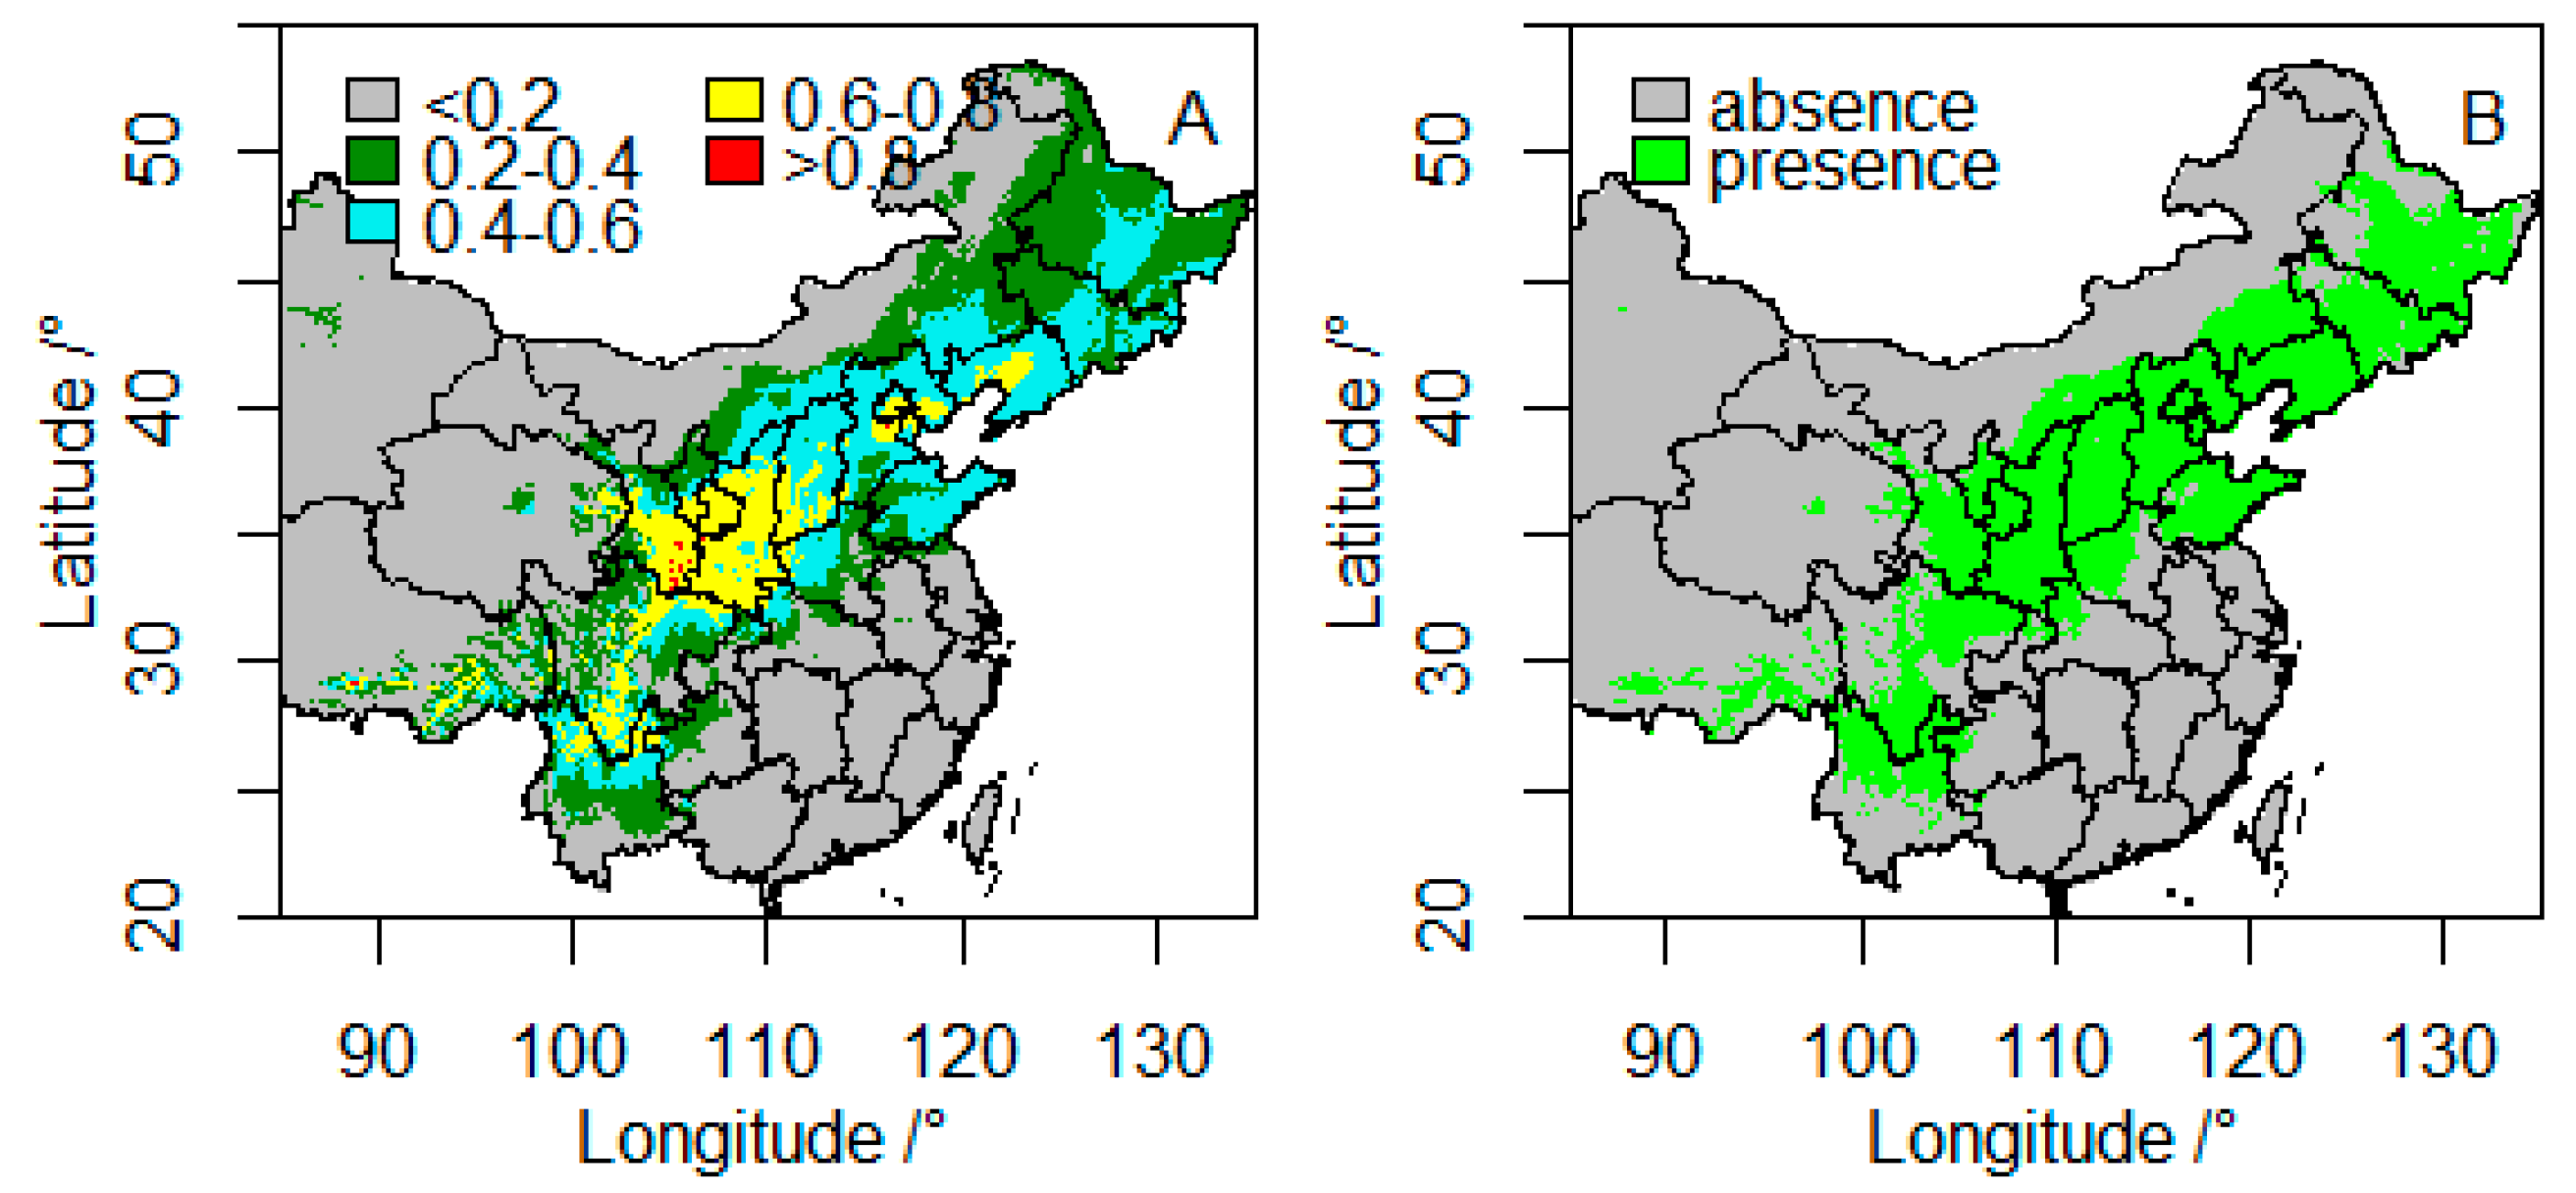
3.1. Model Accuracy and Current Suitable Climatic Habitats

The final average AUC value was 0.82 when the MaxEnt model was evaluated by 10-fold cross-validation, which indicated that the performance of the model had a good accuracy, and the kappa value was 0.78. Based on the threshold of maximum sensitivity and specificity, we obtained a mean optimal threshold value of 0.32. Among the 13 climatic variables, the importance of five of them (annual precipitation, precipitation of the driest month, precipitation of the wettest month, annual biotemperature, and annual mean temperature) was greater than 10%, so they were considered to be the most important in determining the distribution of P. davidiana.
The current potential distribution of P. davidiana and its binary map, according to the optimal threshold, are shown in Figure 1. The area of suitable habitat is about 2.42 × 10⁶ km2, accounting for 24% of China’s land area. The suitable habitat of P. davidiana is mainly located in the semihumid and semiarid regions, including 15 provinces: Heilongjiang, Jilin, Liaoning, Hebei, Inner Mongolia, Shandong, Shanxi, Shaanxi, Henan, Sichuan, Yunnan, Gansu, Ningxia, Tibet, and Hubei.

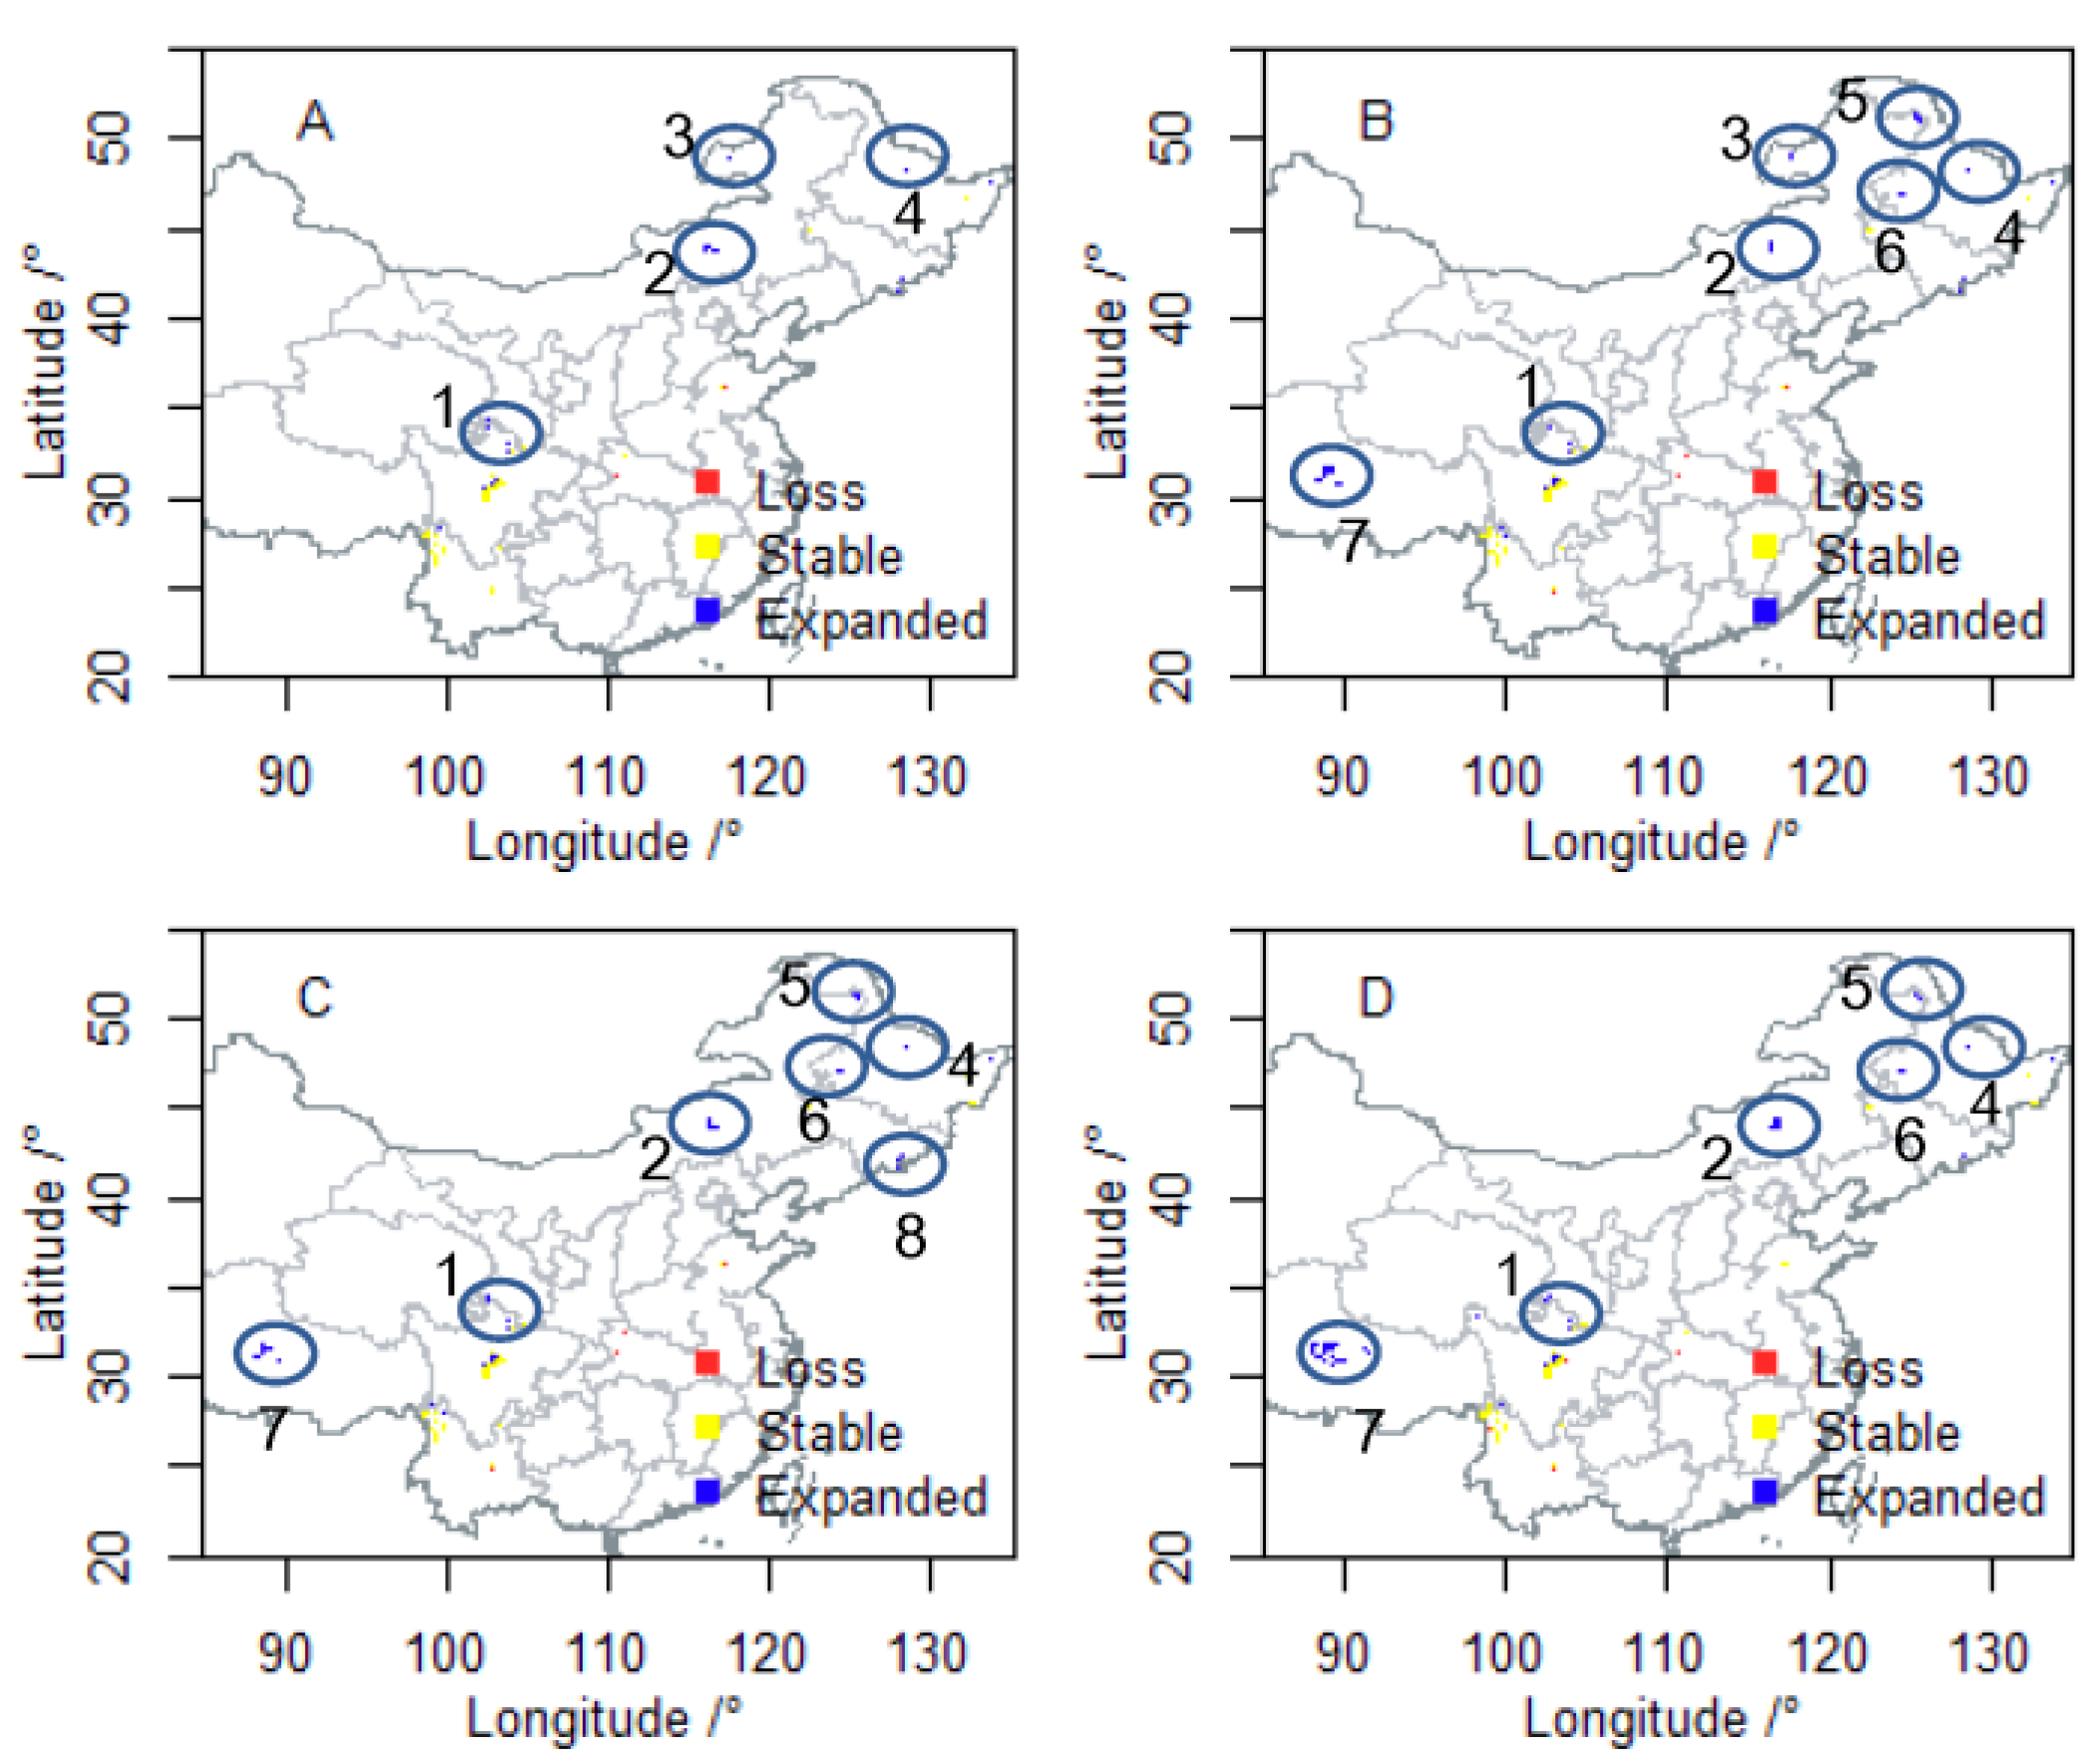
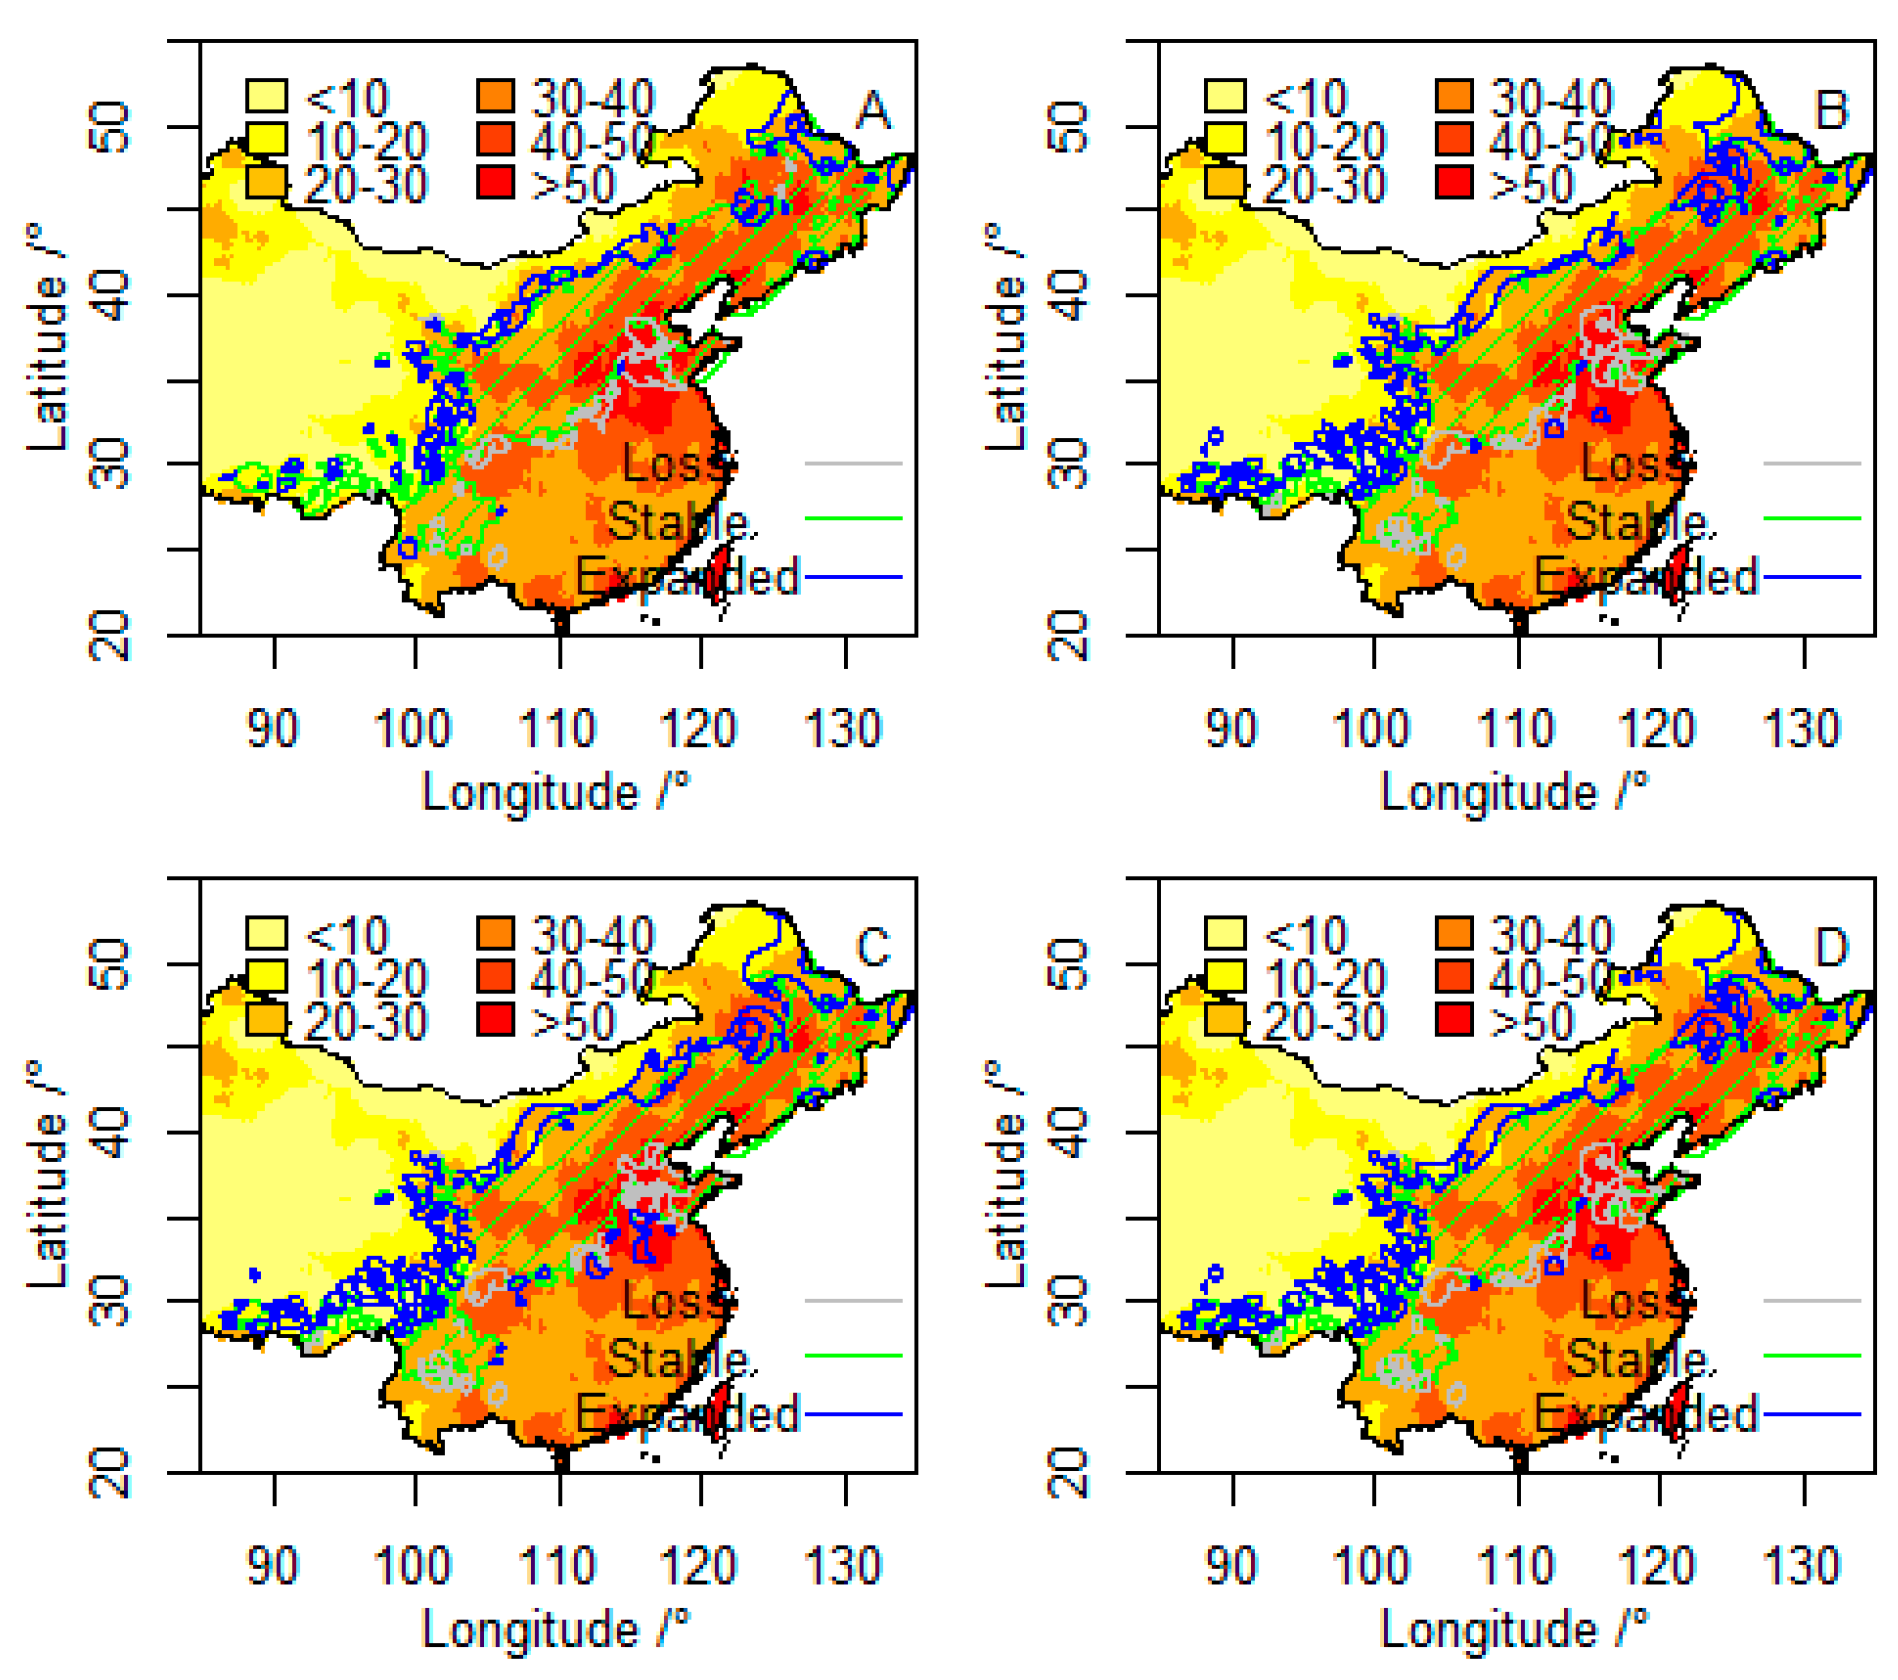
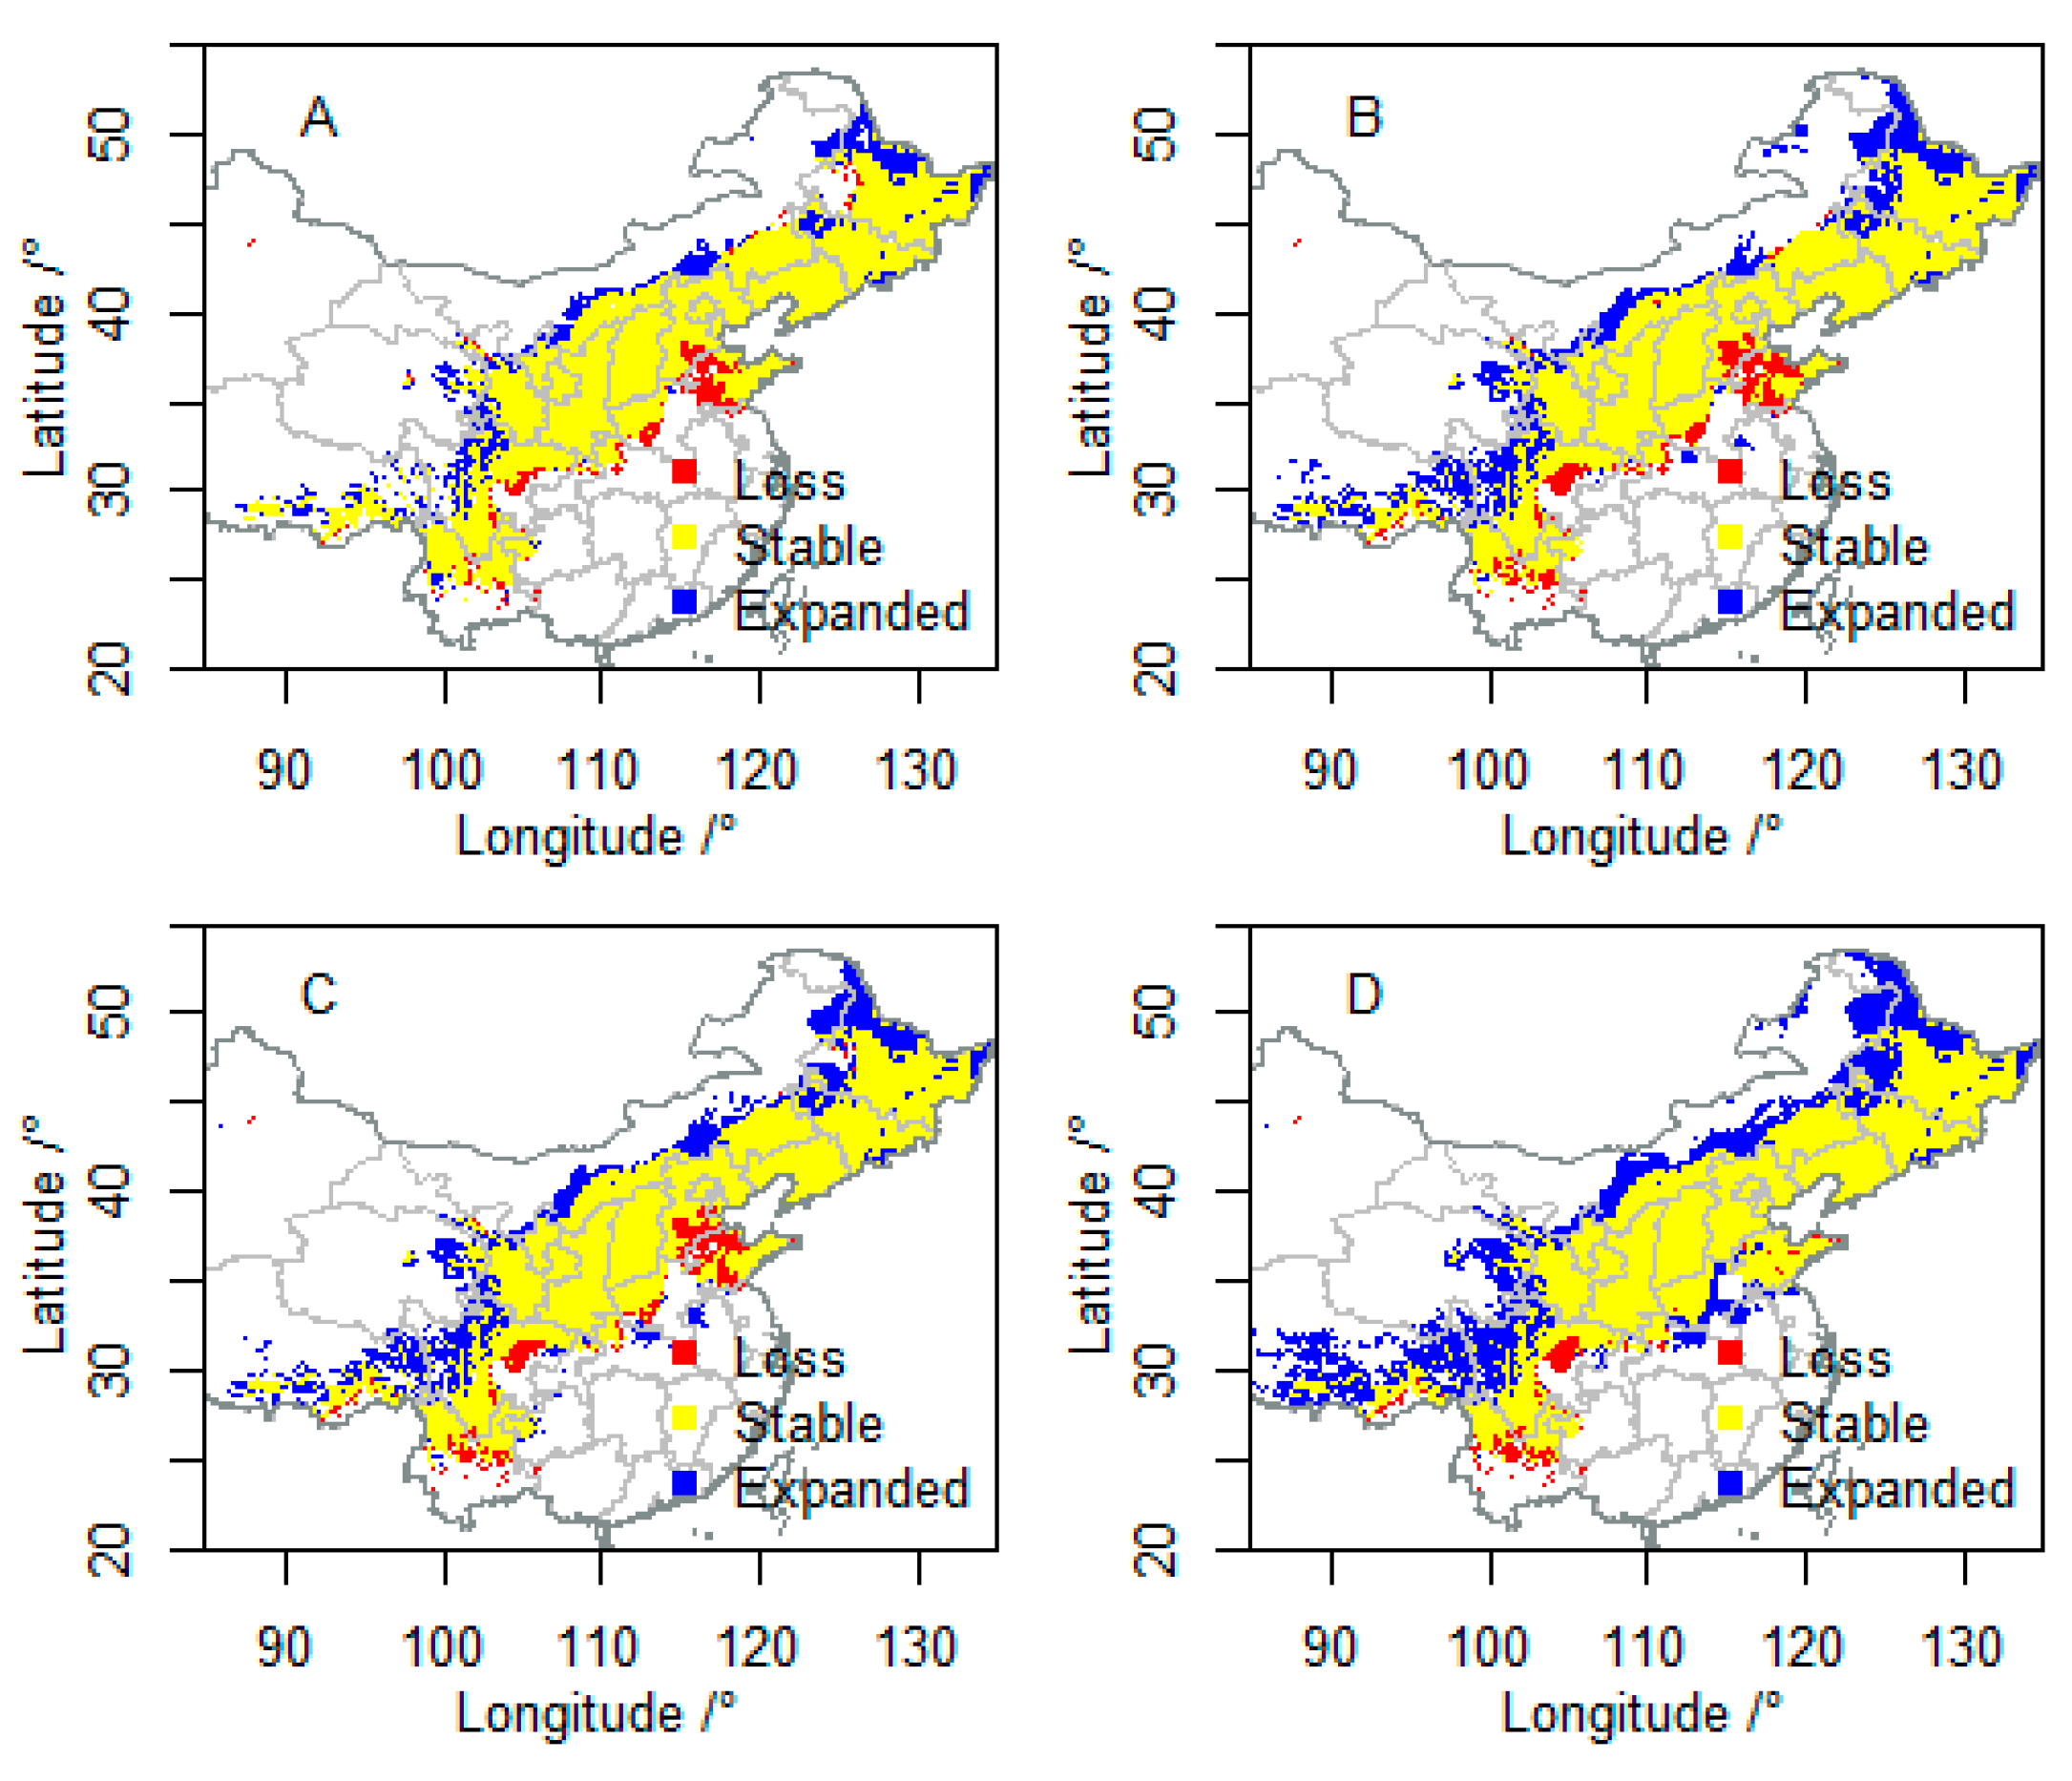
3.2. Future Suitable Climatic Habitats

The future distribution range of P. davidiana by 2070 is shown in Figure 2. It indicates that range changes of the species have similar patterns among the four climatic scenarios. The potential suitable habitats will shift toward the northwest of China, and the expanded area will be larger than the loss area. Interestingly, a significant expansion of suitable habitats occurs in the southern boundary of P. davidiana under the RCP8.5 scenario (Figure 2D). The area of suitable habitat for the species under the four scenarios will reach 2.64 × 10⁶, 2.86 × 10⁶, 2.90 × 10⁶, and 3.49 × 10⁶ km2. It increases with the increased concentration of CO2 emissions.

3.3. Vulnerability to Climatic Change of P. davidiana in Four Components

Four components of vulnerability assessment were considered in this research: Range change, protected area, human footprint, and fragmentation. The results are shown in Figure 3.
For range change, we noticed that the area of suitable habitat will increase under the studied climate change scenarios (Figure 2). The scores of VRC are 9.37, 18.31, 19.93, and 44.56 under RCP2.6, RCP4.5, RCP6.0, and RCP8.5, respectively (Figure 3A), which indicates that the range shift of suitable habitat induced by future climate change will have a positive effect on the population of the species.
We found that the size of the protected area will increase under future climate change scenarios, from 3.0 × 10⁴ to 4.16–6.29 × 10⁴  km2. The spatial pattern of expanded, stable, and loss areas of reserves are shown in the Appendix A, Figure A2. A large increase of the protected area will occur in the northeast of China (e.g., Heilongjiang Zhalong National Nature Reserve), as well as in the Tibetan Plateau (Tibet Selincuo Wetlands), whereas there will be little decrease of the protected area in the southern boundary of the species. The scores of VPA are 39.01, 76.87, 69.51, and 100 under RCP2.6, RCP4.5, RCP6.0, and RCP8.5, respectively (Figure 3B), which indicates that the shift of protected area induced by future climate change will have a positive effect on the population of the species.
We discovered that the value of human footprint will decrease from 30.75 to 27.53–28.89 under future climate change scenarios. The spatial pattern of expanded, stable, and loss areas of human footprint are shown in the Appendix A, Figure A3. The value of human footprint in expanded areas is smaller than that in loss areas, and the size of expanded areas is larger than that of loss areas. The combination of the two factors leads to a smaller average value of human footprint under future climate change scenarios than under current climate conditions. The scores of VHF are 6.03, 9.14, 8.18, and 10.49 under RCP2.6, RCP4.5, RCP6.0, and RCP8.5, respectively (Figure 3C), which implies that the shift of human footprint induced by future climate change will have a positive effect on the population of the species.
We found that component of fragmentation will hardly be changed under future climate change scenarios. The change of fragmentation in a suitable range by 2070 and the effects on vulnerability of P. davidiana under future climate scenarios are shown in the Appendix A, Table A1. The number of patches will change from 7850 to 6858–8076 and the perimeter area ratio will change from 0.22 to 0.2–0.23; the shape index will change from 10.19 to 9.22–10.85, whereas the core area index will change from 0.82 to 0.81–0.83. The value of any component in fragmentation is around zero, indicating that fragmentation of climatically suitable habitat hardly happens by 2070 under the four RCPs. The scores of VFr are 1.8, −0.87, −2.31, and −2.34 under RCP2.6, RCP4.5, RCP6.0, and RCP8.5, respectively (Figure 3D), which suggests that a shift of fragmentation induced by future climate change will have hardly any effect on the population of the species.

3.4. Integration of Exposure Components into an Overall Vulnerability Index

We integrated the four external components affecting species vulnerability into an overall vulnerability index for P. davidiana. The final overall vulnerability index for P. davidiana under each RCP is shown in Figure 4. It suggests that the values of vulnerability are all positive by 2070 under the four RCP scenarios, ranging from 14.05 to 38.18, which indicates that future climate change will have a positive effect on P. davidiana in China, especially under the highest emission scenario (RCP8.5). The assessment trend of overall vulnerability index is similar to that of range shift assessment (Figure 3A), but there are significant differences in the magnitude of vulnerability value.

4. Discussion

4.1. Future Climatic Conditions Will Benefit the Survival of P. davidiana

Different from the RCM approach (mainstream range change method) where only the range change is examined, in this study, we assessed the overall vulnerability of P. davidiana to future climate change through the analysis of four components. The research shows that the future climate will not only be conducive to the expansion of the potential habitat of P. davidiana but will also increase the degree of protection and reduce the degree of disturbance; it will have little impact on fragmentation of suitable habitats. The range expansion of P. davidiana under future climate change is similar to that of P. tabulaeformis and H. rhamnoides with similar ranges [30,31]. This means that the study supports our first hypothesis and future climate change will be more conducive to the survival of P. davidiana populations. This also means that the vulnerability of P. davidiana in responding to future climate change will be reduced according to the mainstream approach (RCM). The vulnerability obtained by the RCM approach will reach 9.37, 18.31, 19.93, and 44.56 by 2070 under RCP2.6, RCP4.5, RCP6.0, and RCP8.5, respectively. This indicates that the higher the representative concentration pathways, the greater the positive effects on P. davidiana in the future.
When the vulnerability of P. davidiana was evaluated by the multicomponent method proposed by Cianfrani et al. [15], we found that overall vulnerability will reach 14.05, 25.86, 23.83, and 38.18 by 2070 under RCP2.6, RCP4.5, RCP6.0, and RCP8.5, respectively. Compared with the results of the RCM approach, the two methods have similarities and differences. The similarity is mainly reflected in the positive values of both methods, indicating that future climate change will have a positive effect on P. davidiana whatever assessment method is used. The difference is mainly illustrated by the magnitude of the effect, indicating that the positive effect is underestimated under a lower emission scenario (e.g., RCP2.6) and overestimated under the highest emission scenario (RCP8.5). Meanwhile, our paper suggests that no matter what assessment method is applied, the vulnerability of P. davidiana in responding to climate change will be reduced in the future. To a great extent, we can judge that future climate change will benefit the survival of P. davidiana and will have a positive effect on the species.
However, we found that there may be inconsistency in the assessment of vulnerability of species between the RCM and multicomponent approaches. In Cianfrani et al.’s assessment of vulnerability of global otter [15], their results also implied that many inconsistencies between the two methods exist for many species. The reason for this is mainly due to range change, fragmentation, protected area, and human footprint, all of which are independent and have either a positive or negative effect on the vulnerability of species in responding to future climate change. Although the RCM approach also indicates that climate change is beneficial to the survival of P. davidiana, it is impossible to evaluate the impact of the other three components (protected area, fragmentation, and human footprint). Our multicomponent approach shows that future climate change will induce an increase in protected area, a decrease in human footprint, and hardly any change in fragmentation. The rank order of the beneficial contribution for all components was protected area (70.7%) > range change (22.1%) > human footprint (8.1%) > fragmentation (−0.9%), produced by average of the components’ vulnerability under the four RCPs. This suggests that the effect of protected areas will exceed that of range change on the vulnerability of P. davidiana. This also implies that the study does not support our second hypothesis: The relative importance of the range change component is far greater than that of the other three components in determining the vulnerability of P. davidiana under future climate change scenarios. This greatly challenges the RCM approach, which involves only range change in evaluating the vulnerability of species to future climate change.
From monitoring P. davidiana regeneration, Zhao et al. [29] found that climatic change in the past decades was conducive to the regeneration of P. davidiana forests. Their study is very consistent with our projection results that future climate change will favor the expansion of P. davidiana and this species will not face the risk of extinction. However, some studies reported that the existing P. davidiana forest suffers from degradation, as well as loss of biodiversity and biomass [55]. During an investigation into the causes of dead woods in the Ziwuling Mountains, it was found that those stands were mature or overmatured forest with slow growth, and trees there are weaker and more susceptible to disease and death [56]. The distributions of these populations are mainly in the core areas of P. davidiana. According to our research, we can infer that the decline of these populations should not be attributed to climate change, but rather nonclimatic reasons, such as increased competition, pests, diseases, land degradation, and other factors.
The main reason why P. davidiana could benefit from future climate change is that the range shifts toward the northwest of China, and the expansion area is larger than the loss area; in addition, the shift of the leading edge is greater than that of the trailing edge (Figure 2) [57,58]. It is generally believed that the leading edge of terrestrial plants in their distribution area is mainly controlled by low temperatures [59,60], and future climatic change will significantly increase the minimum temperature. The trailing edge of a species is affected not only by low temperatures, but also by rainfall. The increased rainfall will likely alleviate the negative impact of increased temperature, thus making the trailing edge of P. davidiana more stable than the leading edge. When the distribution of P. davidiana shifts southward under the highest emission scenario (RCP8.5), this is mainly due to the strengthening of the East Asian monsoon under those conditions. This phenomenon would likely occur for many tree species in China, but it should be further tested. It is also found that the leading edge also shifts faster than the trailing edge in marine species, similar to the terrestrial plants that we studied [61].

4.2. Uncertainty and Potential Application

In this study, a species distribution model was used to estimate the range of species distribution, which does not consider the ecological process of migration and competition. Therefore, the area of the simulated distribution may be larger than the actual distribution area. The simulated habitat should be an area where the species could potentially live, not where it actually exists. It is worth mentioning here that P. davidiana is a species distributed in East Asia, so using only occurrence records in China may underestimate the species’ climatic tolerance to future climate change. Actually, the potential distribution areas of P. davidiana (shown in Figure 1 of [16]) almost all fall in mainland China (Appendix A, Figure A1). Moreover, the MaxEnt model requires fewer occurrence records than Bioclim, GARP, and other species distribution algorithms [45,47,62], and even close to 10 records can meet the needs of MaxEnt. Their studies showed that MaxEnt has strong extrapolation ability, which can be explained by the way it uses regularization to avoid overfitting. Therefore, we believe that 266 records collected in China can reflect the climatic niche of P. davidiana.
The climatic factors included in this study represent the moderate state of the climate, and the impact of extreme climatic events on P. davidiana was not considered. It is generally believed that extreme climate has a significant impact on the survival of species. However, P. davidiana can both rely on seeds for reproduction and be cloned from roots. This means that it has a strong ability to adapt to extreme climate. Recent studies have shown that moderate drought is beneficial to the regeneration of P. davidiana [55]. Based on this, we conclude that the suitable habitat of our study may reasonably reflect the ecological requirements of P. davidiana.
The approach we used to evaluate the vulnerability of P. davidiana included four external components: Range change, protected area, human footprint, and fragmentation. In Cianfrani’s study, it was thought that intrinsic components, sensitivity and specificity, would also play an important role in the vulnerability of species to climate change [15], because the intrinsic components reflect species’ ability to migrate, as well as their phenotypic plasticity, physiological tolerance to warming and drought, and genetic diversity. We suggest that including these intrinsic components only makes sense in multispecies comparison. As for the study of individual species, there is no difference in the intrinsic components under different climatic scenarios, as a tree species’ climatic niche is usually conservative for decades within the same region. Therefore, in this study, we only explored external components instead of considering intrinsic components. The approach used here takes a big step forward in multicomponent vulnerability assessment and provides a standard procedure that could be easily extended to any species.
Our evaluation of P. davidiana has great potential for application. Our results show that the distribution area of P. davidiana is large under current and future climate scenarios. According to the theory of species area curve [63], a large and increasing area means that P. davidiana will not face the risk of extinction in the future. Interestingly, part of the expanded area will fall into nature reserves (Appendix A, Figure A2). Thus, populations of P. davidiana will automatically be protected if they enter these reserves through long-distance migration. For example, P. davidiana will extend into the Gansu Gaihai Wetlands and Heilongjiang Zhalong National Nature Reserves. At the same time, we should pay more attention to the natural regeneration of P. davidiana along its leading edge and relevant nature reserves under future climate change. Strengthening the connection between target future regions and the nearest existing populations, and so establishing a corridor, may provide the basis for possible migration of P. davidiana in the future. However, it should be noted that the data of nature reserves we used are from the World Database on Protected Areas (WDPA, www.wdpa.org, updated 2013), which cannot characterize the latest patterns of the nature reserve system in China. The number and area of China’s nature reserves have increased rapidly in recent years. We believe that the positive effects of climate change on P. davidiana will be reflected with reasonable help from human science.

5. Conclusions

In this study, we comprehensively assessed the vulnerability of P. davidiana using a multicomponent approach under four representative concentration pathways (RCP2.6, RCP4.5, RCP6.0, and RCP8.5) by 2070. The results show that future climate will induce an expansion of suitable habitat, an increase in protected area, a decrease in human footprint, and hardly any changes of fragmentation. The overall vulnerability index values of P. davidiana obtained by the multicomponent approach will reach 14.05, 25.86, 23.83, and 38.18, and the species will benefit from future change without facing the risk of extinction. Our results highlight that the effect of protected areas will exceed that of range change on the vulnerability of P. davidiana in the future. We suggest that the multicomponent approach has advantages over the contrasting range change method (mainstream approach) in assessing the vulnerability of species, and we also suggest that conservation strategies should be further developed based on the latest national nature reserve system in China.

Author Contributions

J.L., G.L. (Guan Liu), Q.L., S.D., Y.Z., and G.L. (Guoqing Li) conceived and designed the experiments; J.L. and G.L. (Guoqing Li) analyzed the data; J.L. and G.L. (Guoqing Li) wrote the paper.

Funding

This research was funded by the National Natural Science Foundation of China grant number 31971488 and the National Key Research and Development Program of China grant number 2017YFC0504601.

Acknowledgments

We thank the anonymous reviewers and the editor for their valuable comments.

Conflicts of Interest

The authors declare no conflict of interest. The founding sponsors had no role in the design of the study; in the collection, analyses, or interpretation of data; in the writing of the manuscript, and in the decision to publish the results

Appendix A

Figure A1. Spatial distributions of potential range of P. davidiana in East Asia (obtained from [16]) and of 266 occurrence records in China, showing that almost all potential distribution areas of P. davidiana fall in mainland China. Therefore, 266 records collected in China should reflect its climatic tolerance.
Forests 10 01120 g0a1
Figure A2. Range shifts of protected area by 2070 for P. davidiana under future climate scenarios: (A) RCP2.6; (B) RCP4.5; (C) RCP6.0; (D) RCP8.5. Protected area in suitable habitat will increase from 3.0 × 10⁴ km2 (current climate) to 4.2 × 10⁴ km2 (RCP2.6), 5.3 × 10⁴ km2 (RCP4.5), 5.1 × 10⁴ km2 (RCP6.0), and 6.3 × 10⁴ km2 (RCP8.0). There is a large increase in protected areas in northeast China, as well as Tibetan Plateau, whereas there is little decrease in protected areas in the southern boundary of the species. 1: Gansu Gahai Wetlands Nature Reserve; 2: Xilin Gol Natural Steppe Protected Area; 3: Dalai Lake National Nature Reserve; 4: Heilongjiang Youhao Wetlands; 5: Heilongjiang Nanweng River National Nature Reserve; 6: Heilongjiang Zhalong National Nature Reserve; 7: Tibet Selincuo Wetlands; 8: Changbaishan National Nature Reserve.
Forests 10 01120 g0a2
Figure A3. Range shifts of human footprint by 2070 for P. davidiana under future climate scenarios: (A) RCP2.6; (B) RCP4.5; (C) RCP6.0; (D) RCP8.5. In order to clearly visualize the distribution pattern of human footprint, the ranges of loss, stable, and expanded areas are characterized by polyline or polygon format instead of grid format. Human footprint will decrease under each future climate change scenario, from 30.75 to 28.89 (RCP2.6), 27.94 (RCP4.5), 28.24 (RCP6.0), and 27.53 (RCP8.5). The value of human footprint in expanded areas is smaller than that in loss areas, and the size of expanded areas is larger than that of loss areas. The combination of the above two factors leads to smaller average value of human footprint under future climate change scenarios than under current climate conditions.
Forests 10 01120 g0a3
Table A1. Percentatge change of fragmentation in suitable range by 2070 and its effects on vulnerability on P. davidiana under future climate scenarios. The value of any component of fragmentation is around zero, indicating that fragmentation of climatically suitable habitat hardly happens by 2070 under four RCPs. The vulnerability of P. davidiana to fragmentation is also around zero, indicating that its future survival will not be affected by fragmentation from the point of view of climatically suitable habitat.
FragmentationRCP2.6RCP4.5RCP6.0RCP8.5
Ed−12.64−1.500.152.88
P_A−9.090.004.554.55
Shape−9.521.963.636.48
CA1.220.00−1.22−1.22
Vulnerability1.80−0.87−2.31−2.34

References

  1. Booth, T.H. Why understanding the pioneering and continuing contributions of BIOCLIM to species distribution modeling is important. Austral. Ecol. 2018, 43, 852–860. [Google Scholar] [CrossRef] [Green Version]
  2. Booth, T.H.; Broadhurst, L.M.; Pinkard, E.; Prober, S.M.; Dillon, S.K. Native forests and climate change: Lessons from Eucalypts. For. Ecol. Manag. 2015, 347, 18–29. [Google Scholar] [CrossRef]
  3. Bellard, C.; Bertelsmeier, C.; Leadley, P.; Thuiller, W.; Courchamp, F. Impacts of climate change on the future of biodiversity. Ecol. Lett. 2012, 15, 365–377. [Google Scholar] [CrossRef] [PubMed] [Green Version]
  4. Nunez, S.; Arets, E.; Alkemade, R.; Verwer, C.; Leemans, R. Assessing the impacts of climate change on biodiversity: Is below 2 °C enough? Clim. Chang. 2019, 154, 351–365. [Google Scholar] [CrossRef] [Green Version]
  5. Thomas, C.D.; Cameron, A.; Green, R.E.; Bakkenes, M.; Beaumont, L.J.; Collingham, Y.C.; Erasmus, B.F.N.; De Siqueira, M.F.; Grainger, A.; Hannah, L. Extinction risk from climate change. Nature 2004, 427, 145–148. [Google Scholar] [CrossRef]
  6. Levinsky, I.; Skov, F.; Svenning, J.C.; Rahbek, C. Potential impacts of climate change on the distributions and diversity patterns of European mammals. Biodivers. Conserv. 2007, 16, 3803–3816. [Google Scholar] [CrossRef]
  7. Arribas, P.; Abellan, P.; Velasco, J.; Bilton, D.T.; Millan, A.; Sanchez-Fernandez, D. Evaluating drivers of vulnerability to climate change: A guide for insect conservation strategies. Glob. Chang. Biol. 2012, 18, 2135–2146. [Google Scholar] [CrossRef]
  8. Foden, W.B.; Butchart, S.H.M.; Stuart, S.N.; Vie, J.C.; Akcakaya, H.R.; Angulo, A.; DeVantier, L.M.; Gutsche, A.; Turak, E.; Cao, L. Identifying the world’s most climate change vulnerable species: A systematic trait-based assessment of all birds, amphibians and corals. PloS ONE 2013, 8, e65427. [Google Scholar] [CrossRef] [Green Version]
  9. Booth, T.H. Estimating potential range and hence climatic adaptability in selected tree species. For. Ecol. Manag. 2016, 366, 175–183. [Google Scholar] [CrossRef]
  10. Beaumont, L.J.; Hughes, L. Potential changes in the distributions of latitudinally restricted Australian butterfly species in response to climate change. Glob. Chang. Biol. 2002, 8, 954–971. [Google Scholar] [CrossRef]
  11. Harrison, P.A.; Berry, P.M.; Butt, N.; New, M. Modelling climate change impacts on species’ distributions at the European scale: Implications for conservation policy. Environ. Sci. Policy 2006, 9, 116–128. [Google Scholar] [CrossRef]
  12. Huntley, B.; Collingham, Y.C.; Willis, S.G.; Green, R.E. Potential impacts of climatic change on European breeding birds. PloS ONE 2008, 3, e1439. [Google Scholar] [CrossRef] [PubMed] [Green Version]
  13. Ewers, R.M.; Didham, R.K. The effect of fragment shape and species’ sensitivity to habitat edges on animal population size. Conserv. Biol. 2007, 21, 926–936. [Google Scholar] [CrossRef] [PubMed]
  14. Li, G.Q.; Liu, C.C.; Liu, Y.G.; Yang, J.; Zhang, X.S.; Guo, K. Effects of climate, disturbance and soil factors on the potential distribution of Liaotung oak (Quercus wutaishanica Mayr) in China. Ecol. Res. 2012, 27, 427–436. [Google Scholar] [CrossRef]
  15. Cianfrani, C.; Broennimann, O.; Loy, A.; Guisan, A. More than range exposure: Global otter vulnerability to climate change. Biol. Conserv. 2018, 221, 103–113. [Google Scholar] [CrossRef] [Green Version]
  16. Rogers, P.C.; Pinno, B.D.; Šebesta, J.; Albrectsen, B.R.; Li, G.Q.; Ivanova, N.; Kusbach, A.; Kuuluvainen, T.; Landhäusser, S.M.; Liu, H.Y.; et al. A global view of aspen: Conservation science for widespread keystone systems. Glob. Ecol. Conserv. 2019, 21, e00828. [Google Scholar] [CrossRef]
  17. Hou, G.K.; Duan, S.G.; Zhao, S. Main Tree Species of Conversion Farmland to Forest in China (Volume of the North); China Agriculture Press: Beijing, China, 2004. [Google Scholar]
  18. ECVAC-Editorial Committee for Vegetation Atlas of China. 1:100 Million Vegetation Atlas of China; Science Press: Beijing, China, 2001. [Google Scholar]
  19. Chen, B.Q.; Zhang, J.J.; Zhang, Y.T.; Tian, N.N. Whole-tree sap flow of Quercus liaotungensis and Populus davidiana in response to environmental factors in the loess plateau area of western Shanxi Province, northern China. Appl. Ecol. J. 2016, 27, 746–754. [Google Scholar]
  20. Sun, Y.; Chen, S.; Huang, H.; Jiang, J.; Bai, S.; Liu, G. Improved salt tolerance of Populus davidiana x P. bolleana overexpressed LEA from Tamarix androssowii. J. For. Res. 2014, 25, 813–818. [Google Scholar] [CrossRef]
  21. Zhang, X.; Wu, N.; Li, C. Physiological and growth responses of Populus davidiana ecotypes to different soil water contents. J. Arid Environ. 2005, 60, 567–579. [Google Scholar] [CrossRef]
  22. Lee, K.M.; Kim, Y.Y.; Hyun, J.O. Genetic variation in populations of Populus davidiana Dode based on microsatellite marker analysis. Genes Genomics 2011, 33, 163–171. [Google Scholar] [CrossRef]
  23. Kim, Y.Y.; Kwon, S.H.; Jo, A.; Kim, Y.G.; Lee, J.W. Single nucleotide polymorphism (SNP) characterization of drought-responsive genes to estimate genetic variation of Populus tremula var. davidiana and eight other Populus species. Can. J. For. Res. 2018, 48, 689–696. [Google Scholar]
  24. Li, S.H.; Miao, R.; Chang, Y.; Li, J.N.; Yan, X.J.; Liu, Z.Y.; Zhang, R.S. Differential expression of PodaPIN9 gene in tissues of Populus davidiana x P-alba var. pyramidlis induced by Trichoderma. Bull. Bot. Res. 2019, 39, 267–275. [Google Scholar]
  25. Mun, B.G.; Hussain, A.; Park, E.J.; Lee, S.U.; Sharma, A.; Imran, Q.M.; Jung, K.H.; Yun, B.W. Profile and time-scale dynamics of differentially expressed genes in transcriptome of Populus davidiana under drought stress. Plant Mol. Biol. Rep. 2017, 35, 647–660. [Google Scholar] [CrossRef]
  26. Wang, N.; Dou, K.; Wang, Z.Y.; Zhang, R.S.; Wang, Y.C.; Liu, Z.H. Rooting and transplanting method of Populus davidiana x P-bolleana tissue culture seedlings. Bull. Bot. Res. 2014, 34, 380–385. [Google Scholar]
  27. Lu, M.M.; Liu, Z.H.; Wang, H.; Zhu, G.D.; Yang, X.T.; Zhang, R.S. Effects of Trichoderma asperellum on the physical and chemical properties and nutrient components of the pot coil culturing tissue cultured Populus davidiana x P. bolleana seedlings. Bull. Bot. Res. 2015, 35, 289–296. [Google Scholar]
  28. Shao, F.L.; Yu, X.X.; Song, S.M.; Zhao, Y. Spatial structural characteristics of natural Populus davidiana-Betula platyphylla secondary forest. Appl. Ecol. J. 2011, 22, 2792–2798. [Google Scholar]
  29. Zhao, P.W.; Xu, C.Y.; Zhoul, M.; Zhang, B.; Ge, P.; Zeng, N.; Liu, H.Y. Rapid regeneration offsets losses from warming-induced tree mortality in an aspen dominated broad-leaved forest in northern China. PloS ONE 2018, 13, e0195630. [Google Scholar] [CrossRef]
  30. Li, G.; Xu, G.H.; Guo, K.; Du, S. Geographical distribution and climatic analysis of Pinus tabuliformis in China: Insight on its afforestation. Ecol. Eng. 2016, 86, 75–84. [Google Scholar] [CrossRef]
  31. Huang, J.H.; Li, G.Q.; Li, J.; Zhang, X.Q.; Yan, M.J.; Du, S. Projecting the range shifts in climatically suitable habitat for Chinese Sea Buckthorn under climate change scenarios. Forests 2018, 9, 9. [Google Scholar] [CrossRef] [Green Version]
  32. Chinese Virtual Herbarium. Available online: http://www.cvh.ac.cn (accessed on 21 March 2018).
  33. Li, G.; Du, S.; Guo, K. Evaluation of limiting climatic factors and simulation of a climatically suitable habitat for Chinese Sea Buckthorn. PloS ONE 2015, 10, e0131659. [Google Scholar]
  34. Holdridge, L.R. Determination of world plant formations from simple climatic data. Science 1947, 105, 367–368. [Google Scholar] [CrossRef] [PubMed]
  35. Kira, T. A New Classification of Climate in Eastern Asia as the Basis for Agricultural Geography; Horticultural Institute Kyoto University: Kyoto, Japan, 1945. [Google Scholar]
  36. WorldClim. Global Climata Data—Free Climate Data for Ecological Modeling and GIS. Available online: http://www.worldclim.org/ (accessed on 2 May 2017).
  37. Hijmans, R.J.; Cameron, S.E.; Parra, J.L.; Jones, P.G.; Jarvis, A. Very high resolution interpolated climate surfaces for global land areas. Int. J. Climatol. 2005, 25, 1965–1978. [Google Scholar] [CrossRef]
  38. Beaumont, L.J.; Hughes, L.; Pitman, A.J. Why is the choice of future climate scenarios for species distribution modeling important. Ecol. Lett. 2008, 11, 1135–1146. [Google Scholar] [CrossRef] [PubMed]
  39. Xu, Y.; Xu, C.H. Preliminary assessment of simulations of climate changes over China by CMIP5 multi-models. Atmos. Ocean. Sci. Lett. 2012, 5, 489–494. [Google Scholar]
  40. Giorgi, F.; Mearns, L. Calculation of average, uncertainty range, and reliability of regional climate changes from AOGCM simulations via the reliability ensemble averaging (REA) method. J. Clim. 2002, 15, 1141–1158. [Google Scholar] [CrossRef]
  41. McMahon, S.M.; Harrison, S.P.; Armbruster, W.S.; Bartlein, P.J.; Beale, C.M.; Edwards, M.E.; Kattge, J.; Midgly, G.; Morin, X.; Prentice, I.C. Improving assessment and modelling of climate change impacts on global terrestrial biodiversity. Trends Ecol. Evol. 2011, 26, 249–259. [Google Scholar] [CrossRef]
  42. Burrows, M.T.; Schoeman, D.S.; Richardson, A.J.; Molinos, J.G.; Hoffmann, A.; Buckley, L.B.; Moore, P.J.; Brown, C.J.; Bruno, J.F.; Duarte, C.M.; et al. Geographical limits to species-range shifts are suggested by climate velocity. Nature 2014, 507, 492–495. [Google Scholar] [CrossRef]
  43. Soberon, J.; Nakamura, M. Niches and distributional areas: Concepts, methods, and assumptions. Proc. Natl. Acad. Sci. USA 2009, 106, 19644–19650. [Google Scholar] [CrossRef] [Green Version]
  44. Sinclair, S.J.; White, M.D.; Newell, G.R. How useful are species distribution models for managing biodiversity under future climates? Ecol. Soc. 2010, 15, 8. [Google Scholar] [CrossRef]
  45. Elith, J.; Graham, C.H.; Anderson, R.P.; Dudik, M.; Ferrier, S.; Guisan, A.; Hijmans, R.J.; Huettman, F.; Lehmann, A. Novel methods improve prediction of species’ distribution from occurrence data. Ecography 2006, 29, 129–151. [Google Scholar] [CrossRef] [Green Version]
  46. Tsoar, A.; Allouche, O.; Steinitz, O.; Rotem, D.; Kadmon, R. A comparative evaluation of presence-only methods for modeling species distribution. Divers. Distrib. 2007, 13, 397–405. [Google Scholar] [CrossRef]
  47. Phillips, S.J.; Anderson, R.P.; Schapire, R.E. Maximum entropy modeling of species geographic distributions. Ecol. Model. 2006, 190, 231–259. [Google Scholar] [CrossRef] [Green Version]
  48. Swets, J.A. Measuring the accuracy of diagnostic systems. Science 1988, 240, 1285–1293. [Google Scholar] [CrossRef] [PubMed] [Green Version]
  49. Landis, J.R.; Koch, G.G. The measurement of observer agreement for categorical data. Biometrics 1977, 33, 159–174. [Google Scholar] [CrossRef] [Green Version]
  50. Monserud, R.A.; Leemans, R. Comparing global vegetation maps with the Kappa-Statistic. Ecol. Model. 1992, 62, 275–293. [Google Scholar] [CrossRef]
  51. Wang, R.L.; Li, Q.; He, S.A.; Liu, Y.; Wang, M.T.; Jiang, G. Modeling and mapping the current and future distribution of Pseudomonas syringae pv. actinidiae under climate change in China. PloS ONE 2018, 13, e0192153. [Google Scholar] [CrossRef] [PubMed] [Green Version]
  52. Jarnevich, C.S.; Reynolds, L.V. Challenges of predicting the potential distribution of a slow-spreading invader: A habitat suitability map for an invasive riparian tree. Biol. Invasions 2011, 13, 153–163. [Google Scholar] [CrossRef]
  53. Sanderson, E.W.; Jaiteh, M.; Levy, M.A.; Redford, K.H.; Wannebo, A.V.; Woolmer, G. The human footprint and the last of the wild. Bioscience 2002, 52, 891–904. [Google Scholar] [CrossRef]
  54. Vanderwal, J.; Falconi, L.; Januchowski, S.; Shoo, L.; Storlie, C. Sdmtools: Species Distribution Modelling Tools: Tools for Processing Data Associated with Species Distribution Modelling Exercises. R Package Version 1.1-221. 2014. Available online: https://cran.R-project.Org/package=sdmtools (accessed on 20 May 2016).
  55. Wu, Q.F.; Wang, J.S.; Lu, Z.F. Research progress of poplar plantation degradation and recovery. Chin. Agric. Sci. Bull. 2015, 31, 1–6. [Google Scholar]
  56. Li, H.F.; Zhang, B.Z.; Wang, J.M. Investigation on the causes of death of natural Populus davidiana forest in Ziwuling. Gansu Sci. Technol. 2008, 24, 166–167. [Google Scholar]
  57. Parmesan, C. Ecological and evolutionary responses to recent climate change. Annu. Rev. Ecol. Evol. Syst. 2006, 37, 637–669. [Google Scholar] [CrossRef] [Green Version]
  58. Hampe, A.; Petit, R.J. Conserving biodiversity under climate change: The rear edge matters. Ecol. Lett. 2005, 8, 461–467. [Google Scholar] [CrossRef] [PubMed] [Green Version]
  59. Hawkins, B.A. Ecology’s oldest pattern? Endeavour 2001, 25, 133–134. [Google Scholar] [CrossRef]
  60. Sakai, A.; Malla, M.S. Winter hardiness of tree species at high altitudes in the east Himalaya, Nepal. Ecology 1981, 62, 1288–1298. [Google Scholar] [CrossRef]
  61. Poloczanska, E.S.; Brown, C.J.; Sydeman, W.J.; Kiessling, W.; Schoeman, D.S.; Moore, P.J.; Brander, K.; Bruno, J.F.; Buckley, L.B.; Burrows, M.T. Global imprint of climate change on marine life. Nat. Clim. Chang. 2013, 3, 919–925. [Google Scholar] [CrossRef]
  62. Wisz, M.S.; Hijmans, H.J.; Li, J.; Peterson, A.T.; Graham, C.H.; Guisan, A. NCEAS Predicting Species Distributions Working Group. Effects of sample size on the performance of species distribution models. Divers. Distrib. 2008, 14, 763–773. [Google Scholar] [CrossRef]
  63. Lomolino, M.V. Ecology’s most general, yet protean pattern: The species-area relationship. J. Biogeogr. 2000, 27, 17–26. [Google Scholar] [CrossRef]
Figure 1. Distribution maps of current suitable habitat of P. davidiana in China: (A) Probability map; (B) binary map (threshold = 0.32 in MaxEnt).
Forests 10 01120 g001
Figure 2. Range shifts of P. davidiana by 2070 under future climatic change scenarios: (A) Representative concentration pathway (RCP)2.6; (B) RCP4.5; (C) RCP6.0; (D) RCP8.5.
Forests 10 01120 g002
Figure 3. Vulnerability indices of P. davidiana in four components by 2070 under future climatic change scenarios: (A) Range change; (B) protected area; (C) human footprint; and (D) fragmentation.
Forests 10 01120 g003
Figure 4. Overall vulnerability index of P. davidiana under future climatic change scenarios.
Forests 10 01120 g004
Table 1. Detailed descriptions and abbreviations of 13 climatic variables for distribution modeling.
No.VariableAbbr.
1Annual mean temperatureAMT
2Maximum temperature of the warmest monthMTWM
3Minimum temperature of the coldest monthMTCM
4Annual temperature rangeART
5Annual precipitationAP
6Precipitation of the wettest monthPWM
7Precipitation of the driest monthPDM
8Precipitation of seasonality (monthly coefficient of variation of precipitation)PSD
9Annual biotemperature 1ABT
10Warmth index (WI = ∑(T − 5), where T > 5 °C)WI
11Coldness index (CI = −∑(5−T), where T < 5 °C)CI
12Potential evapotranspiration rate (PER = 58.93 × ABT/AP)PER
13Humidity index (HI = AP/WI)HI
1ABT = ∑(T/12), where T is mean monthly temperature with values both above 30 °C and below 0 °C substituted by 0 °C.

