Article

Sensitivity of Vegetation on Alpine and Subalpine Timberline in Qinling Mountains to Temperature Change

1
College of Resources, Environment, History and Culture, Xianyang Normal University, Xianyang 712000, China
2
College of Geography and Tourism, Shaanxi Normal University, Xi’an 710126, China
3
College of Urban and Environmental Sciences, Northwest University, Xi’an 710127, China
4
Equipment Management and UAV College, Air Force Engineering University, Xi’an 710051, China
5
College of Automation, Northwestern Polytechnical University, Xi’an 710072, China
*
Author to whom correspondence should be addressed.
Forests 2019, 10(12), 1105; https://doi.org/10.3390/f10121105
Submission received: 29 October 2019 / Revised: 18 November 2019 / Accepted: 26 November 2019 / Published: 3 December 2019

Abstract

:
Alpine timberline is a great place for monitoring climate change. The study of alpine and subalpine timberline in Qinling Mountains has led to early warning that reveals the response and adaptation of terrestrial vegetation ecosystem to climate change. Based on the remote sensing image classification method, the typical timberline area in Qinling Mountains was determined. Temperature and normalized difference vegetation index (NDVI) data were extracted from the typical timberline area based on spatial interpolation and NDVI data. The relationship between NDVI and temperature change and the critical temperature value affecting vegetation response in the timberline area in Qinling Mountains were analyzed. Correlation between NDVI and air temperature in the alpine and subalpine timberline areas of Qinling Mountains exhibited an upward trend, which implied that temperature promotes vegetation activity. A strong correlation between temperature and NDVI in typical timberline areas of Qinling Mountains, and a significant correlation between temperature and NDVI in the early growing season. A phenomenon of NDVI lagging behind air temperature was observed. Temperature response showed synchronization and hysteresis. The correlation between cumulative temperature and vegetation was similar between Taibai Mountain and Niubeiliang timberline, and the correlation between NDVI in April and cumulative temperature in the first 12 months was the strongest. Temperature threshold range of Taibai Mountain timberline played a dominant role in vegetation growth. Our results provide insights and basis for future studies of early warning signs of climate change, specifically between 0.34 and 1.34 °C. The threshold ranges of temperature response of different vegetation types vary. Compared with alpine shrub meadow, the threshold ranges of temperature effect of Coniferous forest and Larix chinensis Beissn. are smaller, implying that these vegetation types are more sensitive to temperature change.

1. Introduction

Global warming brings more challenges to the development of human society [1]. The terrestrial ecosystem has been noticeably affected by climate change [2]. Forest disturbances are sensitive to the climate. The disturbances frequency and severity will increase under climate change in forest ecosystems [3]. Future changes in disturbance are likely to be most pronounced in coniferous forests and the boreal biome [4]. Alpine timberline, transitional in nature, is generally considered as a key research area that reflects climate change [5]. To date, studies focusing on timberline mainly concern population structure, annual ring growth, and response of timberline location to climate change [6,7,8,9,10,11]. Compared with timberline location, the change in forest population density is a more sensitive ecological index [4]. The Picea crassifolia Kom. population in timberline region were studied and the response of structure, ring growth, and timberline location to climate change demonstrated an increase of population density of timberline by about 23 times in the past 100 years, despite the absence of significant changes in the location of timberline [6]. Another factor that is more sensitive to climate change is tree ring [5]. The growth of tree ring in the ecotone of the whole timberline was mainly affected by the previous growth season (last growth season and autumn and winter). The impact of climate indicators also demonstrated that tree ring growth was relatively sensitive to climate change. The sedimentary sequences of two high-altitude lakes in the South Carpathian Mountains in Romania were analyzed by using a multi-agent method, and studied the responses of tree lines, woodlands, and alpine/subalpine vegetation to climate change and human activities [10]. The tree ring and 14C precise dating technology were used and the tree populations that are affected by climate change were predicted. To summarize, most of the studies on the response of timberline to climate change use tree rings and 14C dating techniques to obtain long-term historical data that reveal the response mechanism of timberline to climate change.
At the end of the 20th century, the International Tundra Experiment adopted the open-top chamber method to simulate the warming of the tundra ecosystem at high latitudes. The results showed that plant growth physiology and phenology responded to global warming. The temperature of alpine timberline was found to be the main limiting factor of vegetation change. Normalized vegetation index (NDVI) was demonstrated to reflect the overall growth status of vegetation [12]. In addition, given the close relationship between vegetation change and meteorological factors [11], the relationship between global NDVI and climate change were studied and the conclusion showed that temperature had a significant impact on vegetation growth, especially during the vegetation growing season [12]. The previous experiment or quadrat investigation is too one-sided, NDVI can macroscopically reflect the overall growth of vegetation, which is conducive to the overall grasp of the response relationship between vegetation and temperature [13]. The age structure of Larix gmelinii (Rupr.) Rupr. forest in Western Putula Plateau were analyzed and the synchronous topographic map and satellite image were compared to reveal the change of the elevation position of the upper boundary of vegetation. The results showed a certain correlation between the diameter of tree trunk and the amount and composition of trees. In the past few centuries, changes to the forest structure and flora in the upper part of the forest have been reconstructed, and the study of general changes in regional climate conditions (warming) has promoted forest expansion. To date, investigations related to alpine timberline generally focus on the mechanism of plant response to climate change, with limited use of 3S technology which is a general term for remote sensing technology, geographic information system, and global positioning system. Although the development of RS (remote sensing) and GIS (geographic information system) is late and cannot provide enough historical data, the monitoring of timberline spatial pattern is more comprehensive, which makes up for the shortage of micro-experiment. Therefore, this study aims to explore the application of 3S technology in timberline research and to understand the response mechanism of timberline to climate at a macro scale.
The main objective of this work is to study the temporal and spatial relationship between the vegetation index and the temperature in the timberline area, and to reveal the sensitivity of the vegetation in the timberline area to the temperature. We assume that there is a response threshold between vegetation change and temperature fluctuation along the timberline. Through the temporal and spatial relationship between the temperature and the vegetation index, the response threshold of the vegetation in the timberline area to the temperature is determined with the help of remote sensing and geographic information system, so as to provide scientific support for the early warning research of climate change.

2. Materials and Methods
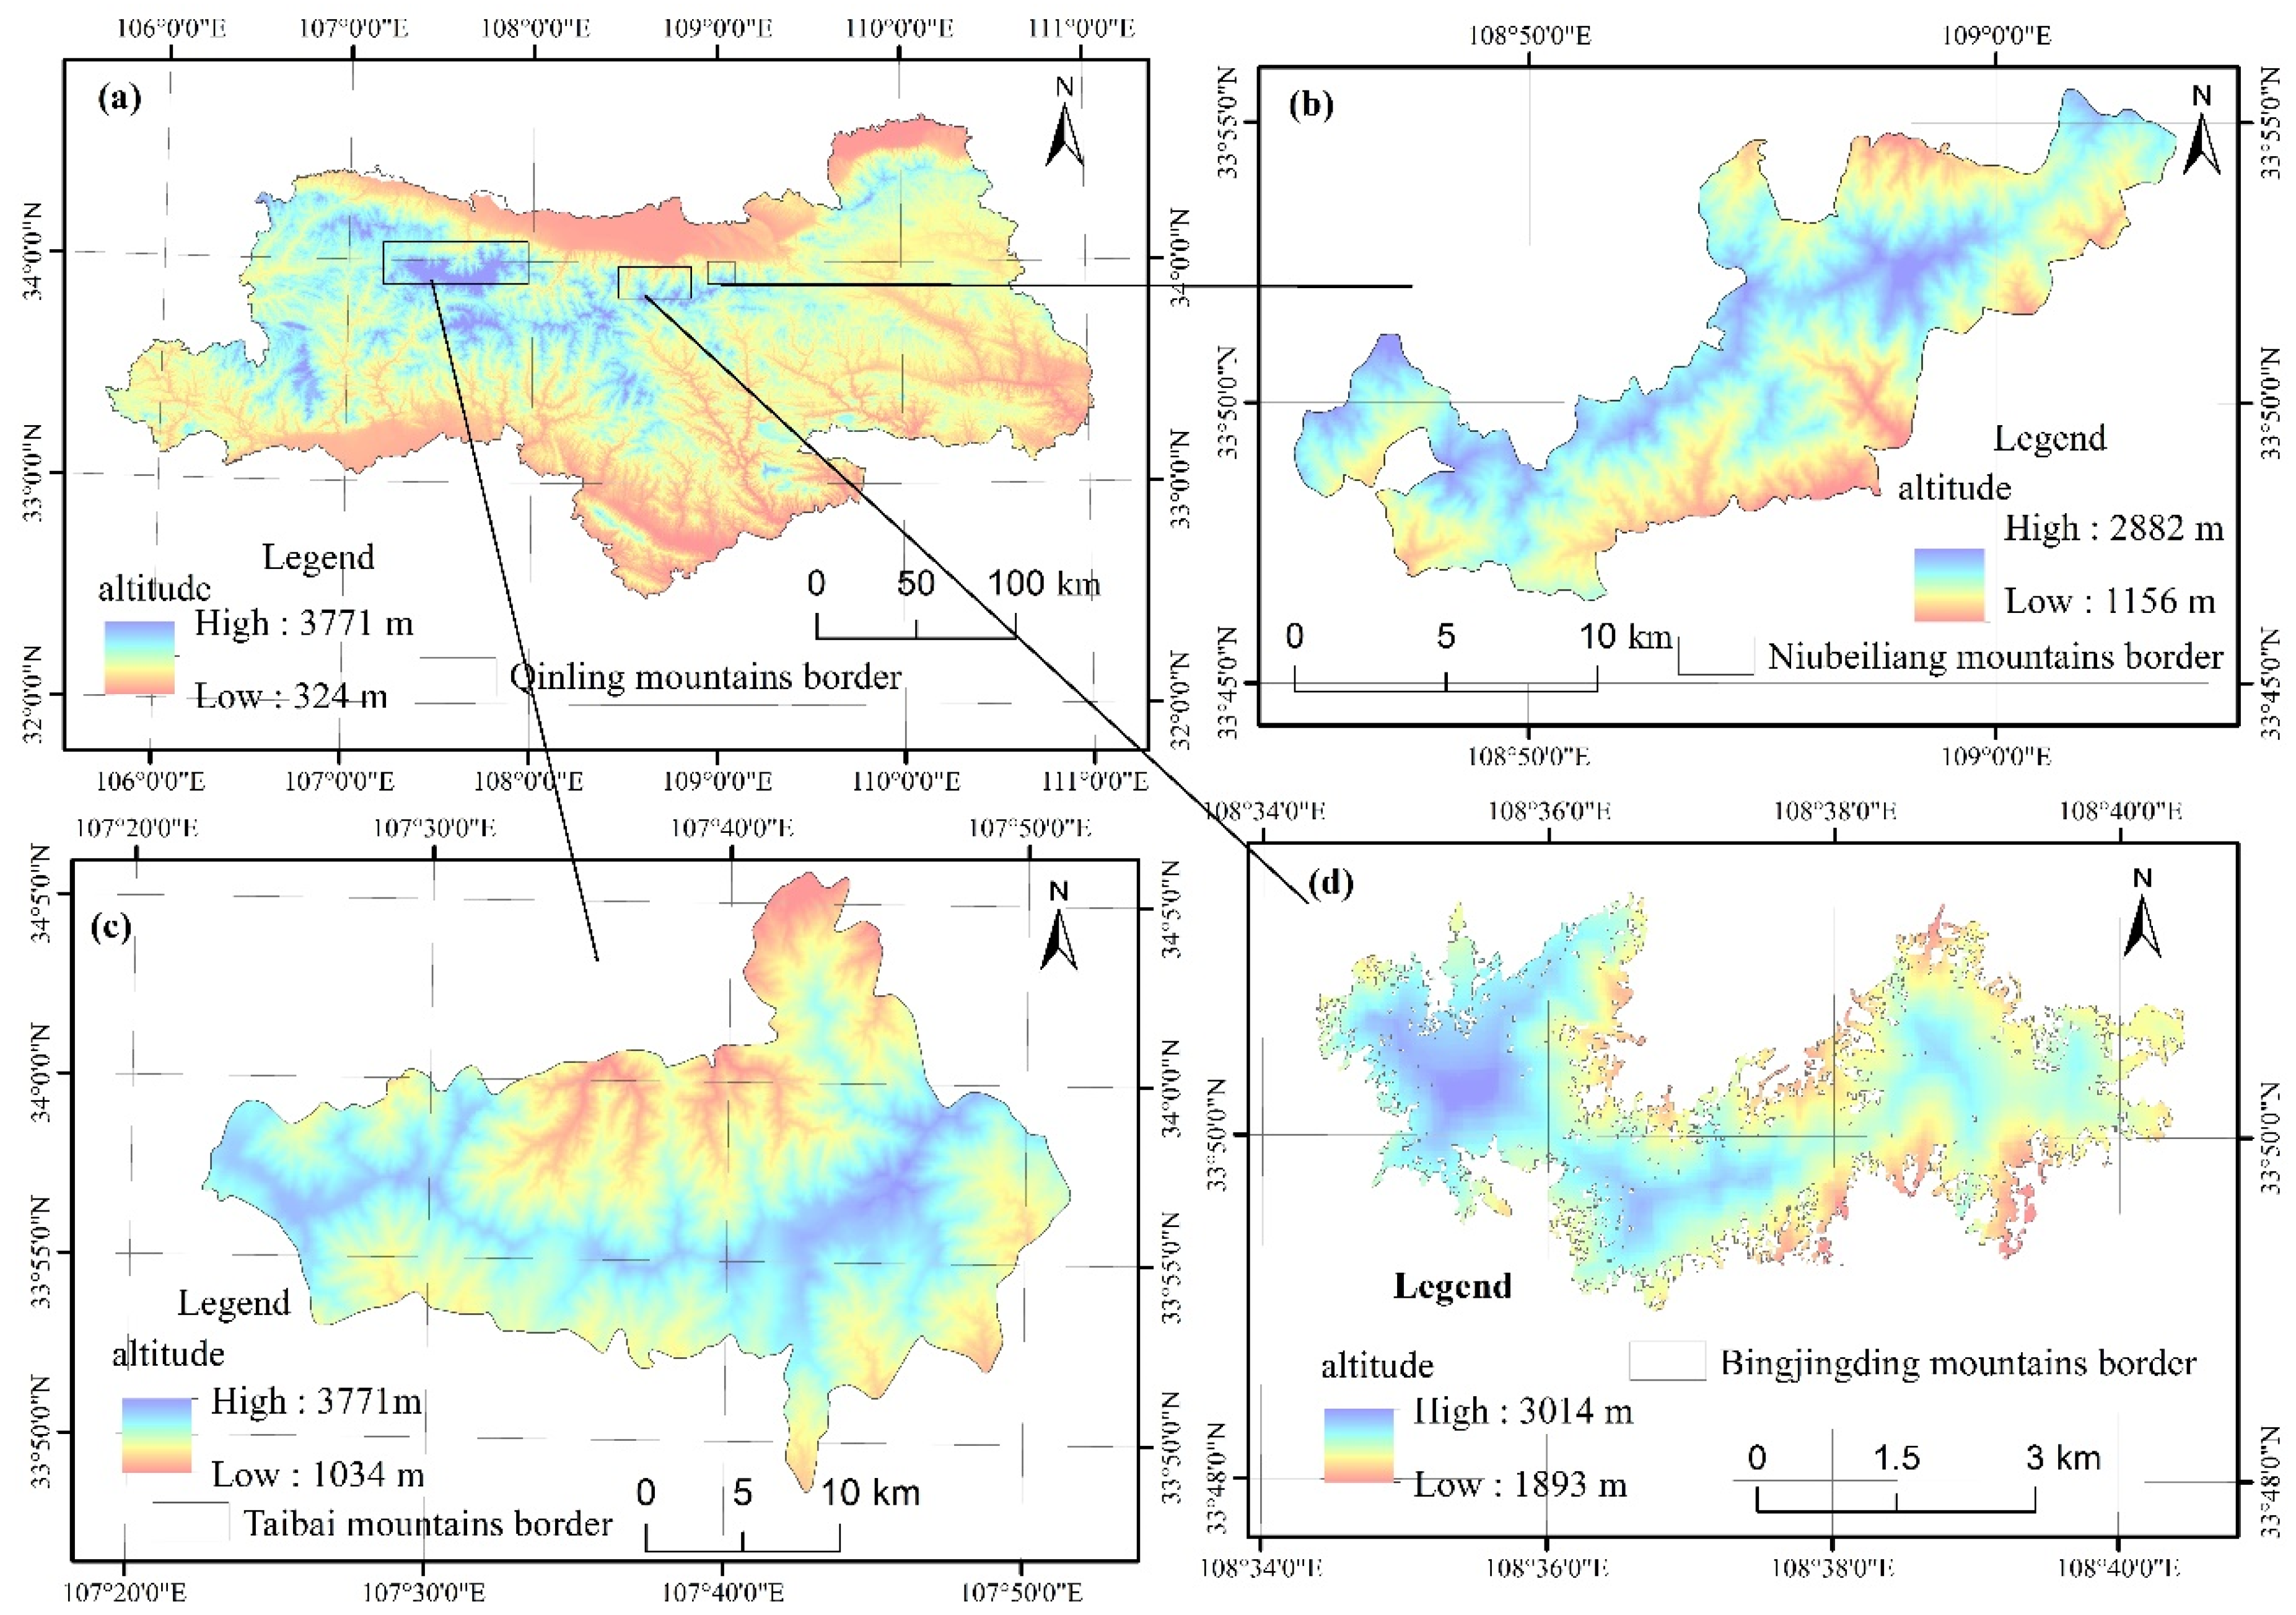
2.1. Study Area

The range of Qinling Mountains being referred to in this paper includes the middle section of Qinling Mountains, which is located mostly in the Shaanxi Province. It is bounded by the administrative unit near the ridge line in the north, and by the south with Han River and the boundary of Shaanxi Province in the east and west. The longitude from east to west is about 6 degrees (105°29′–111°15′ E) and the longitude between north and south is 8 degrees (31°42′–39°35′ N), with a width of about 1500 km. Most of them are 1500–2500 m above sea level. The climate of Qinling Mountains varies greatly from north to south, exhibiting a northern subtropical climate in the south and a warm temperate climate in the north. The average temperature in January is −5–3.5 °C, while that in July is 21–28 °C. The frost-free period is 160–250 days, the extreme minimum temperature is −32.7 °C, and the extreme maximum temperature is 42.8 °C. The annual average precipitation is 340–1240 mm, with more than 70% of the annual precipitation observed from May to September, and more precipitation is detected in the south and less in the north [14]. The timberline area is mainly located in high-altitude areas, and the timberline in Qinling Mountains distributes in a range of 2600–2900 m. We have found several alpine sample areas with high altitude and timberline distribution in Qinling Mountains. Taibai Mountain is located in the west of Qinling, which is the highest peak of Qinling Mountains. Niubeiliang is located in the east of the south slope of Qinling Mountains, and Bingjingding is located in the middle of Qinling Mountains. These three sample areas are all located in the main ridge of Qinling Mountains, with high altitude and more timberline distribution. Therefore, typical timberline-like areas of Taibai Mountain, Niubeiliang, and Bingjingding in the high-altitude areas in Qinling Mountains were selected for this study (Figure 1).
Taibai Mountain is the main peak of Qinling Mountains. It is located in Baoji, Shaanxi Province, with a forest coverage of 94.3% and an altitude of 3771 m. Taibai Mountain is characterized by its unique climatic characteristics due to its alpine drop. Temperature decreases vertically with increasing altitude. The average vertical decline rate of temperature is between 0.4 and 0.5 °C [15]. According to the characteristics of climate and vegetation, Taibai Mountain can be divided into five climatic zones: Warm temperate zone, temperate zone, cold zone, cold zone, and alpine cold zone.
Niubeiliang is located in the east of Qinling Mountains. Chang’an, Zhashui, and Ningshan are the three counties that form its boundary. The forest coverage rate of Niubeiliang is over 97%, with a peak of 2802 m.
Bingjingding is the highest peak in Qinling Mountains and is to the east of Taibai Mountain, with an elevation of 3015.1 m, it is also the highest peak in Huxian County, 74 km away from Xi’an City. It belongs to the National Forest Park Nature Reserve of Suzaku [16].

2.2. Data Compilation

The meteorological data used in this paper include the monthly average temperature and precipitation data of 46 meteorological stations in Qinling Mountains from 1959 to 2015. The data are collected from the Shaanxi Meteorological Bureau and the China Meteorological Science Data Sharing Service Network (http://cdc.cma.gov.com). In addition, data from 11 meteorological stations in high altitude areas were collected in 2013 to verify the accuracy of raster data of temperature and precipitation.
The remote sensing image data include SPOT-5 (It is the fifth satellite of SPOT satellite in France) remote sensing images of Taibai Mountain, Niubeiliang, and Bingjingding in October 2013. After pretreatment, the spatial resolution of the image data is 2.5 × 2.5 m. The data were purchased from the Beijing Bosco Space Information Technology Co., Ltd. (Beijing, China). The SPOT-5 remote sensing imagery data were used for classifying vegetation in typical timberline-like areas and dividing the timberline area. In addition, field GPS data of Taibai Mountain, Niubeiliang, and high-altitude Bingjingding were used to verify the image classification results by collecting the positioning data of field survey sample points along the different routes of Taibai Mountain.
MODIS NDVI data are derived from a 16-day composite product of MOD13Q1 250 m resolution vegetation index in National Aeronautics and Space Administration (NASA)’s EOS/MODIS data set [17,18].

2.3. Research Methods

2.3.1. Remote Sensing Image Processing and Classification

(1) Image Pre-Processing
For the downloaded image, first carry out geometric fine correction, then select the 3, 4, 5 bands suitable for vegetation classification for the fusion, the third part for color enhancement, adjust to the color mode for recognition. Based on the field investigation data, the interpretation marks are established (Table 1).
(2) Supervised Classification
According to the established interpretation criteria, the training samples were selected, and all the land types were divided into six categories: Broad-leaved forest, coniferous and broad-leaved mixed forest, coniferous.
Forest, Larix chinensis, meadow and rock-block field, which mainly identified the coniferous forest, Larix chinensis, meadow and rock-block field in the high-altitude area. The selection of training samples must be uniform, and each type of sample selection covers more than 60% of the image. Based on the selected training samples, the maximum likelihood method [19] is used for image classification, and the preliminary classification results are obtained.
(3) Verification of Classification Results
The commonly used methods to test the accuracy of supervised classification are confusion matrix and kappa coefficient analysis. This paper takes the real data recorded (Figure 2) in the field survey as the basis for the accuracy verification of classification results, evaluates the accuracy of classification results, and finally obtains the overall classification accuracy of 90%, kappa coefficient of 0.85. The relationship between kappa coefficient and classification quality is shown in Table 2.

2.3.2. Auxiliary Interpolation Method Based on DEM

The horizontal and vertical distribution characteristics of temperature have a great influence on the results of temperature interpolation. Therefore, this paper uses the relationship between temperature and longitude, latitude and altitude to improve the accuracy of temperature interpolation.
(1) Temperature Altitude Correction
The terrain of Qinling mountain area is complex, the climate type is variable, and the temperature difference is large. Therefore, the difference of vertical decline rate of temperature in the south and north slopes should be considered in the spatial interpolation of Qinling temperature. According to the difference of the vertical decreasing rate of air temperature with altitude in the south and north slopes of Qinling Mountains, the air temperature data of Qinling Mountains are modified to the altitude of sea level to eliminate the influence of altitude on air temperature. According to the research of Moshenguo et al. [20], the vertical decline rate of annual average temperature in the south and north slopes of Qinling Mountains is the same, both of which are 0.4 °C/100 m. The temperature at any point can be expressed as:
Tsouth = T0 − A1 × E, Tnorth = T0 − A2 × E
In the formula, TSouth and Tnorth respectively represent the temperature of the North–South slope, T0 is the temperature at sea level (°C), E is the altitude (m), A1 is the vertical decline rate of temperature on the south slope, and A2 is the vertical decline rate of temperature on the north slope.
(2) Temperature Interpolation
The setting of meteorological stations is often limited in space, which makes the temperature after O-Kriging interpolation [21] different from the actual temperature. The Kriging method, also known as spatial local interpolation method, is a method of unbiased optimal estimation of regionalized variables in a limited area based on the theory of variation function and structural analysis. Its essence is to use the original data of regionalized variables and the structural characteristics of variation function to make linear unbiased and optimal estimation of unknown samples.Therefore, the influence of altitude on the temperature must be considered in the interpolation of temperature space. According to the vertical decline rate of air temperature, the air temperature data of the meteorological stations around Qinling Mountains are corrected to the height of sea level, and then the O-Kriging method in ArcGIS spatial interpolation module is used for interpolation, which is transformed into a unified temperature grid image with the same resolution as DEM. The temperature field grid data and DEM data generated are divided into south and north slopes for grid calculation by using the formula T = T0 − A × E. Finally, the temperature field data with grid resolution of 25 × 25 m in Qinling area with terrain characteristics is generated. The grid calculation expression is as follows:
GR ID3 = GR ID1 − A × GR ID2
where GRID3 is the generated temperature field data, GRID1 is the modified temperature data generated by Kriging method, and GRID2 is the DEM grid data. Generally, cross validation is used to test the accuracy of the interpolation results. In this method, the mean absolute error (MAE) and the square root of the mean square error (RMSE) are generally used as the test indicators of the prediction results. The closer the absolute value of MAE is to 0, the smaller the error difference is. The smaller the RMSE value is, the higher the accuracy of the model simulation is. After cross validation, both MAE and RMSE of the temperature interpolation achieve the simulation accuracy. The validation of the data set can be referred to the literature [22,23]. The data set is also the research result of the public welfare industry special project “Qinling natural forest and climate change corresponding research” of the Ministry of natural resources of China.

3. Results

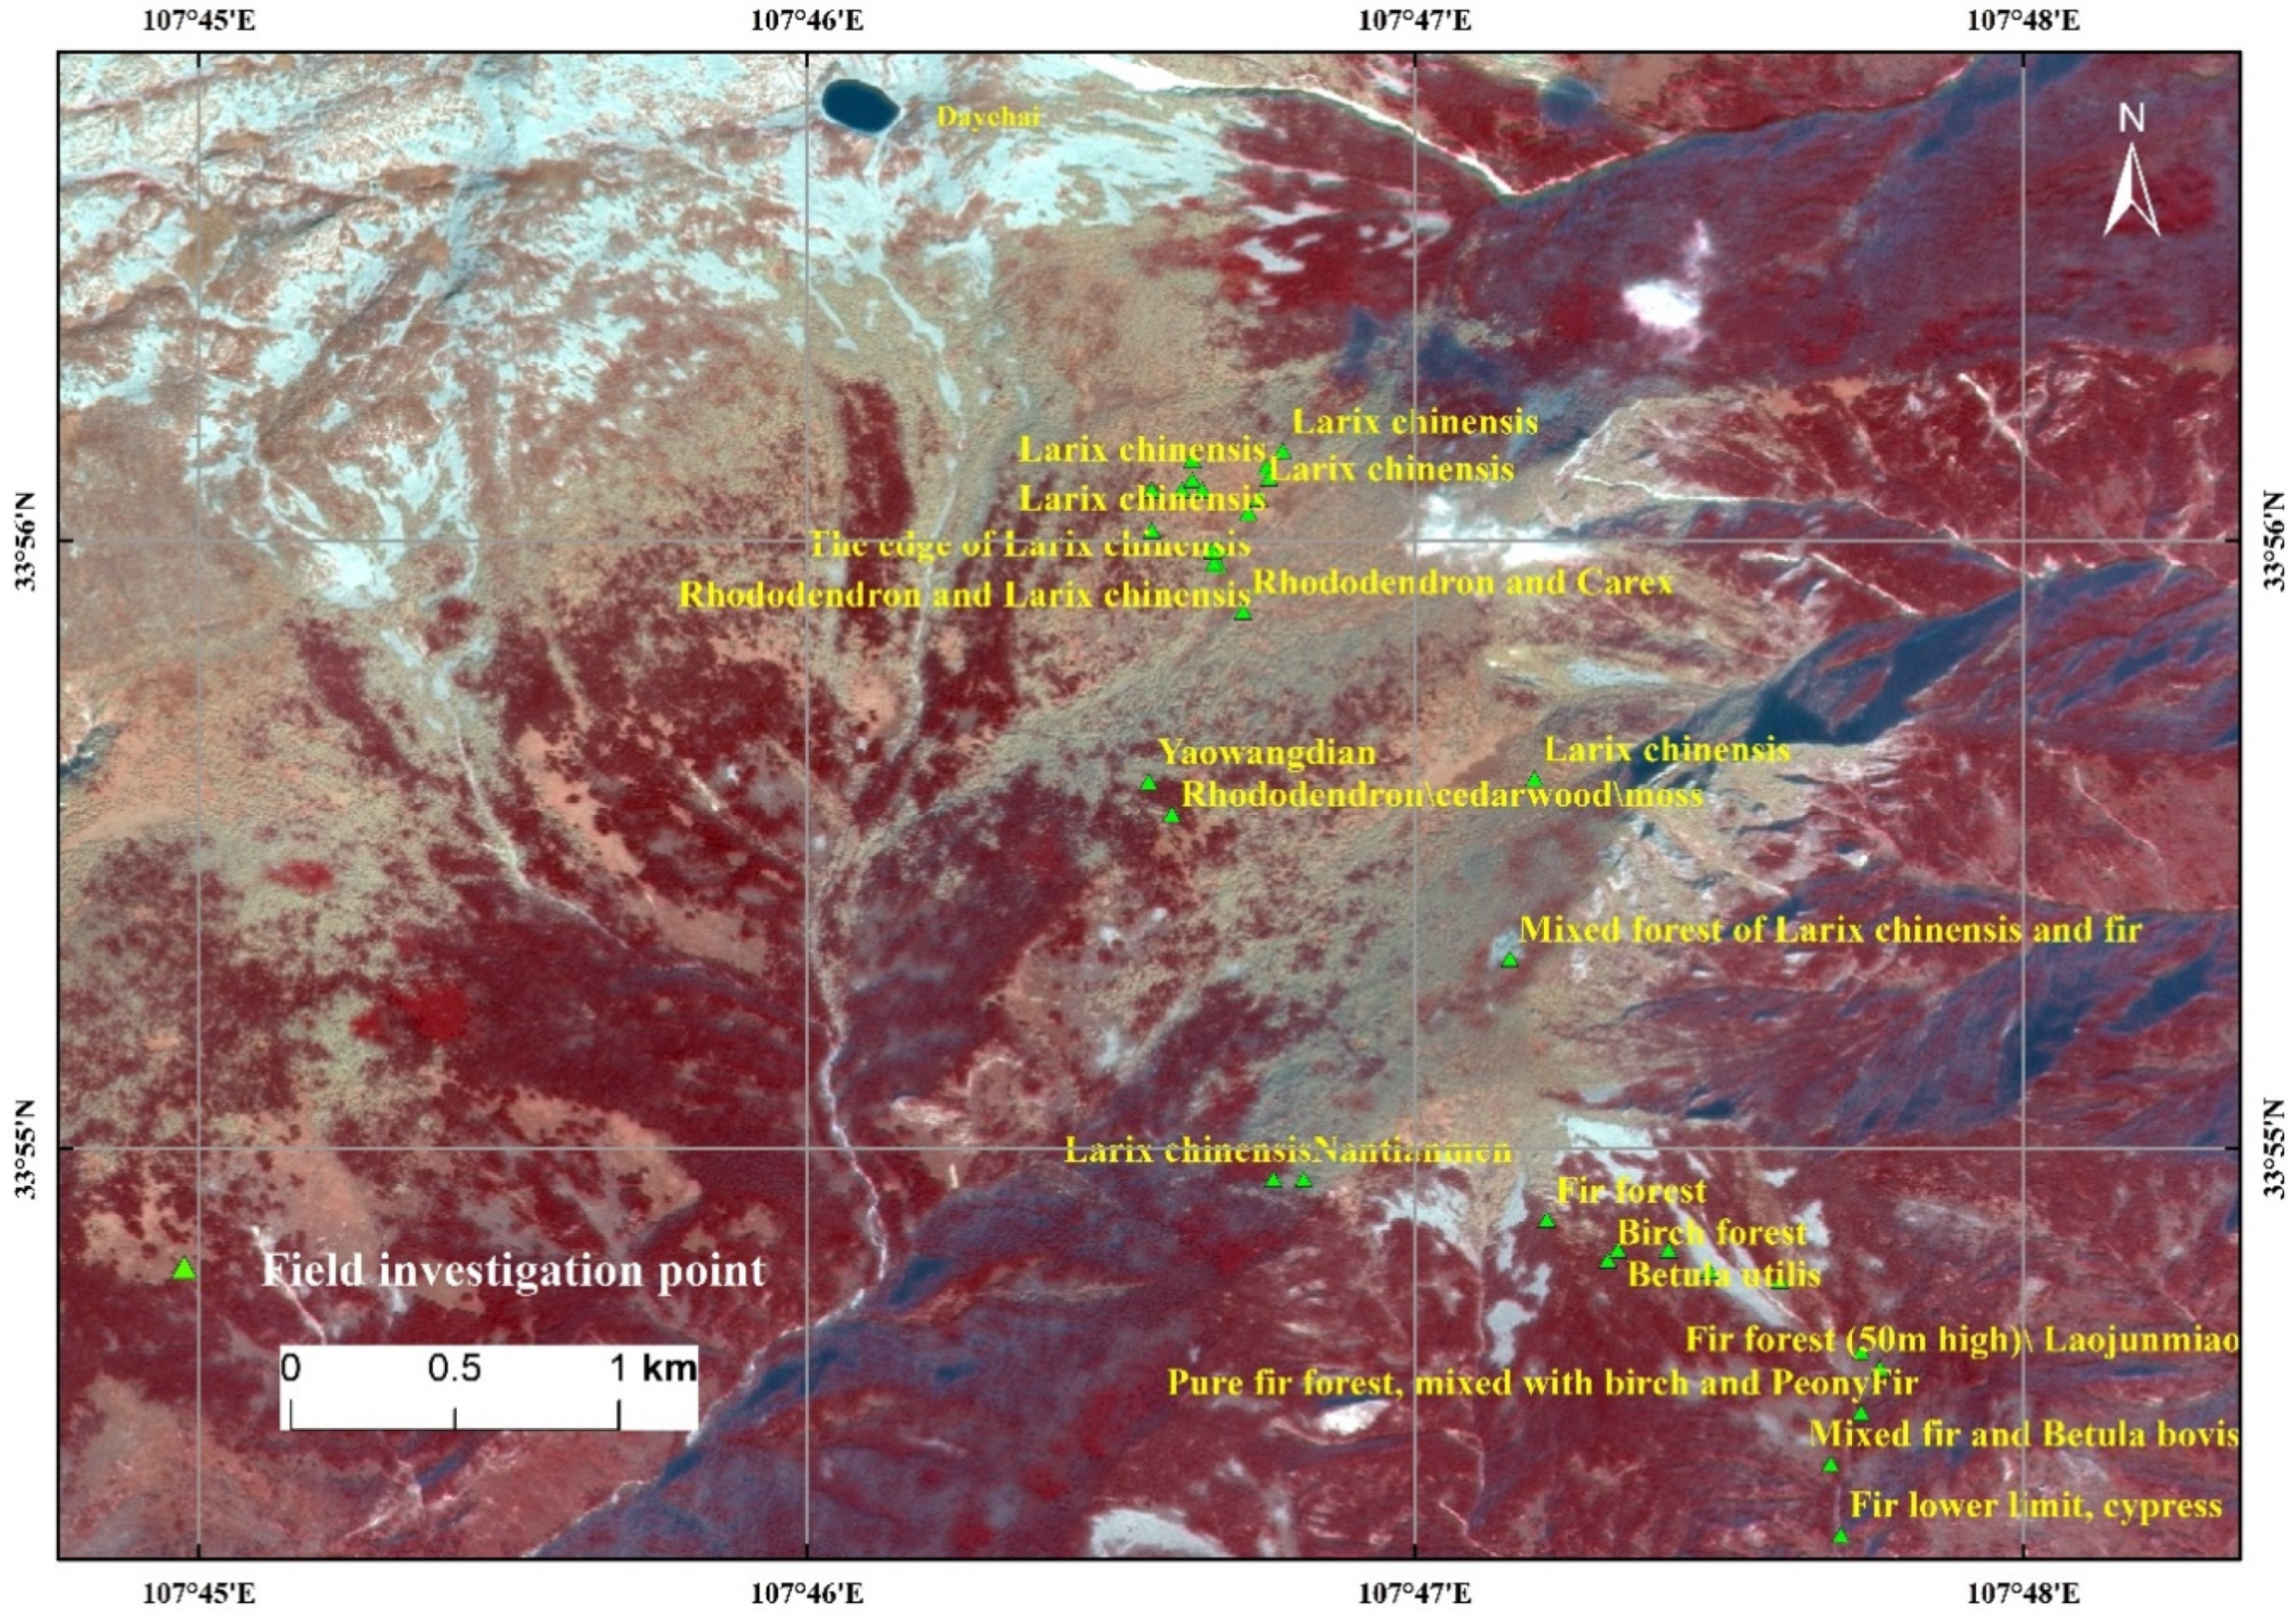
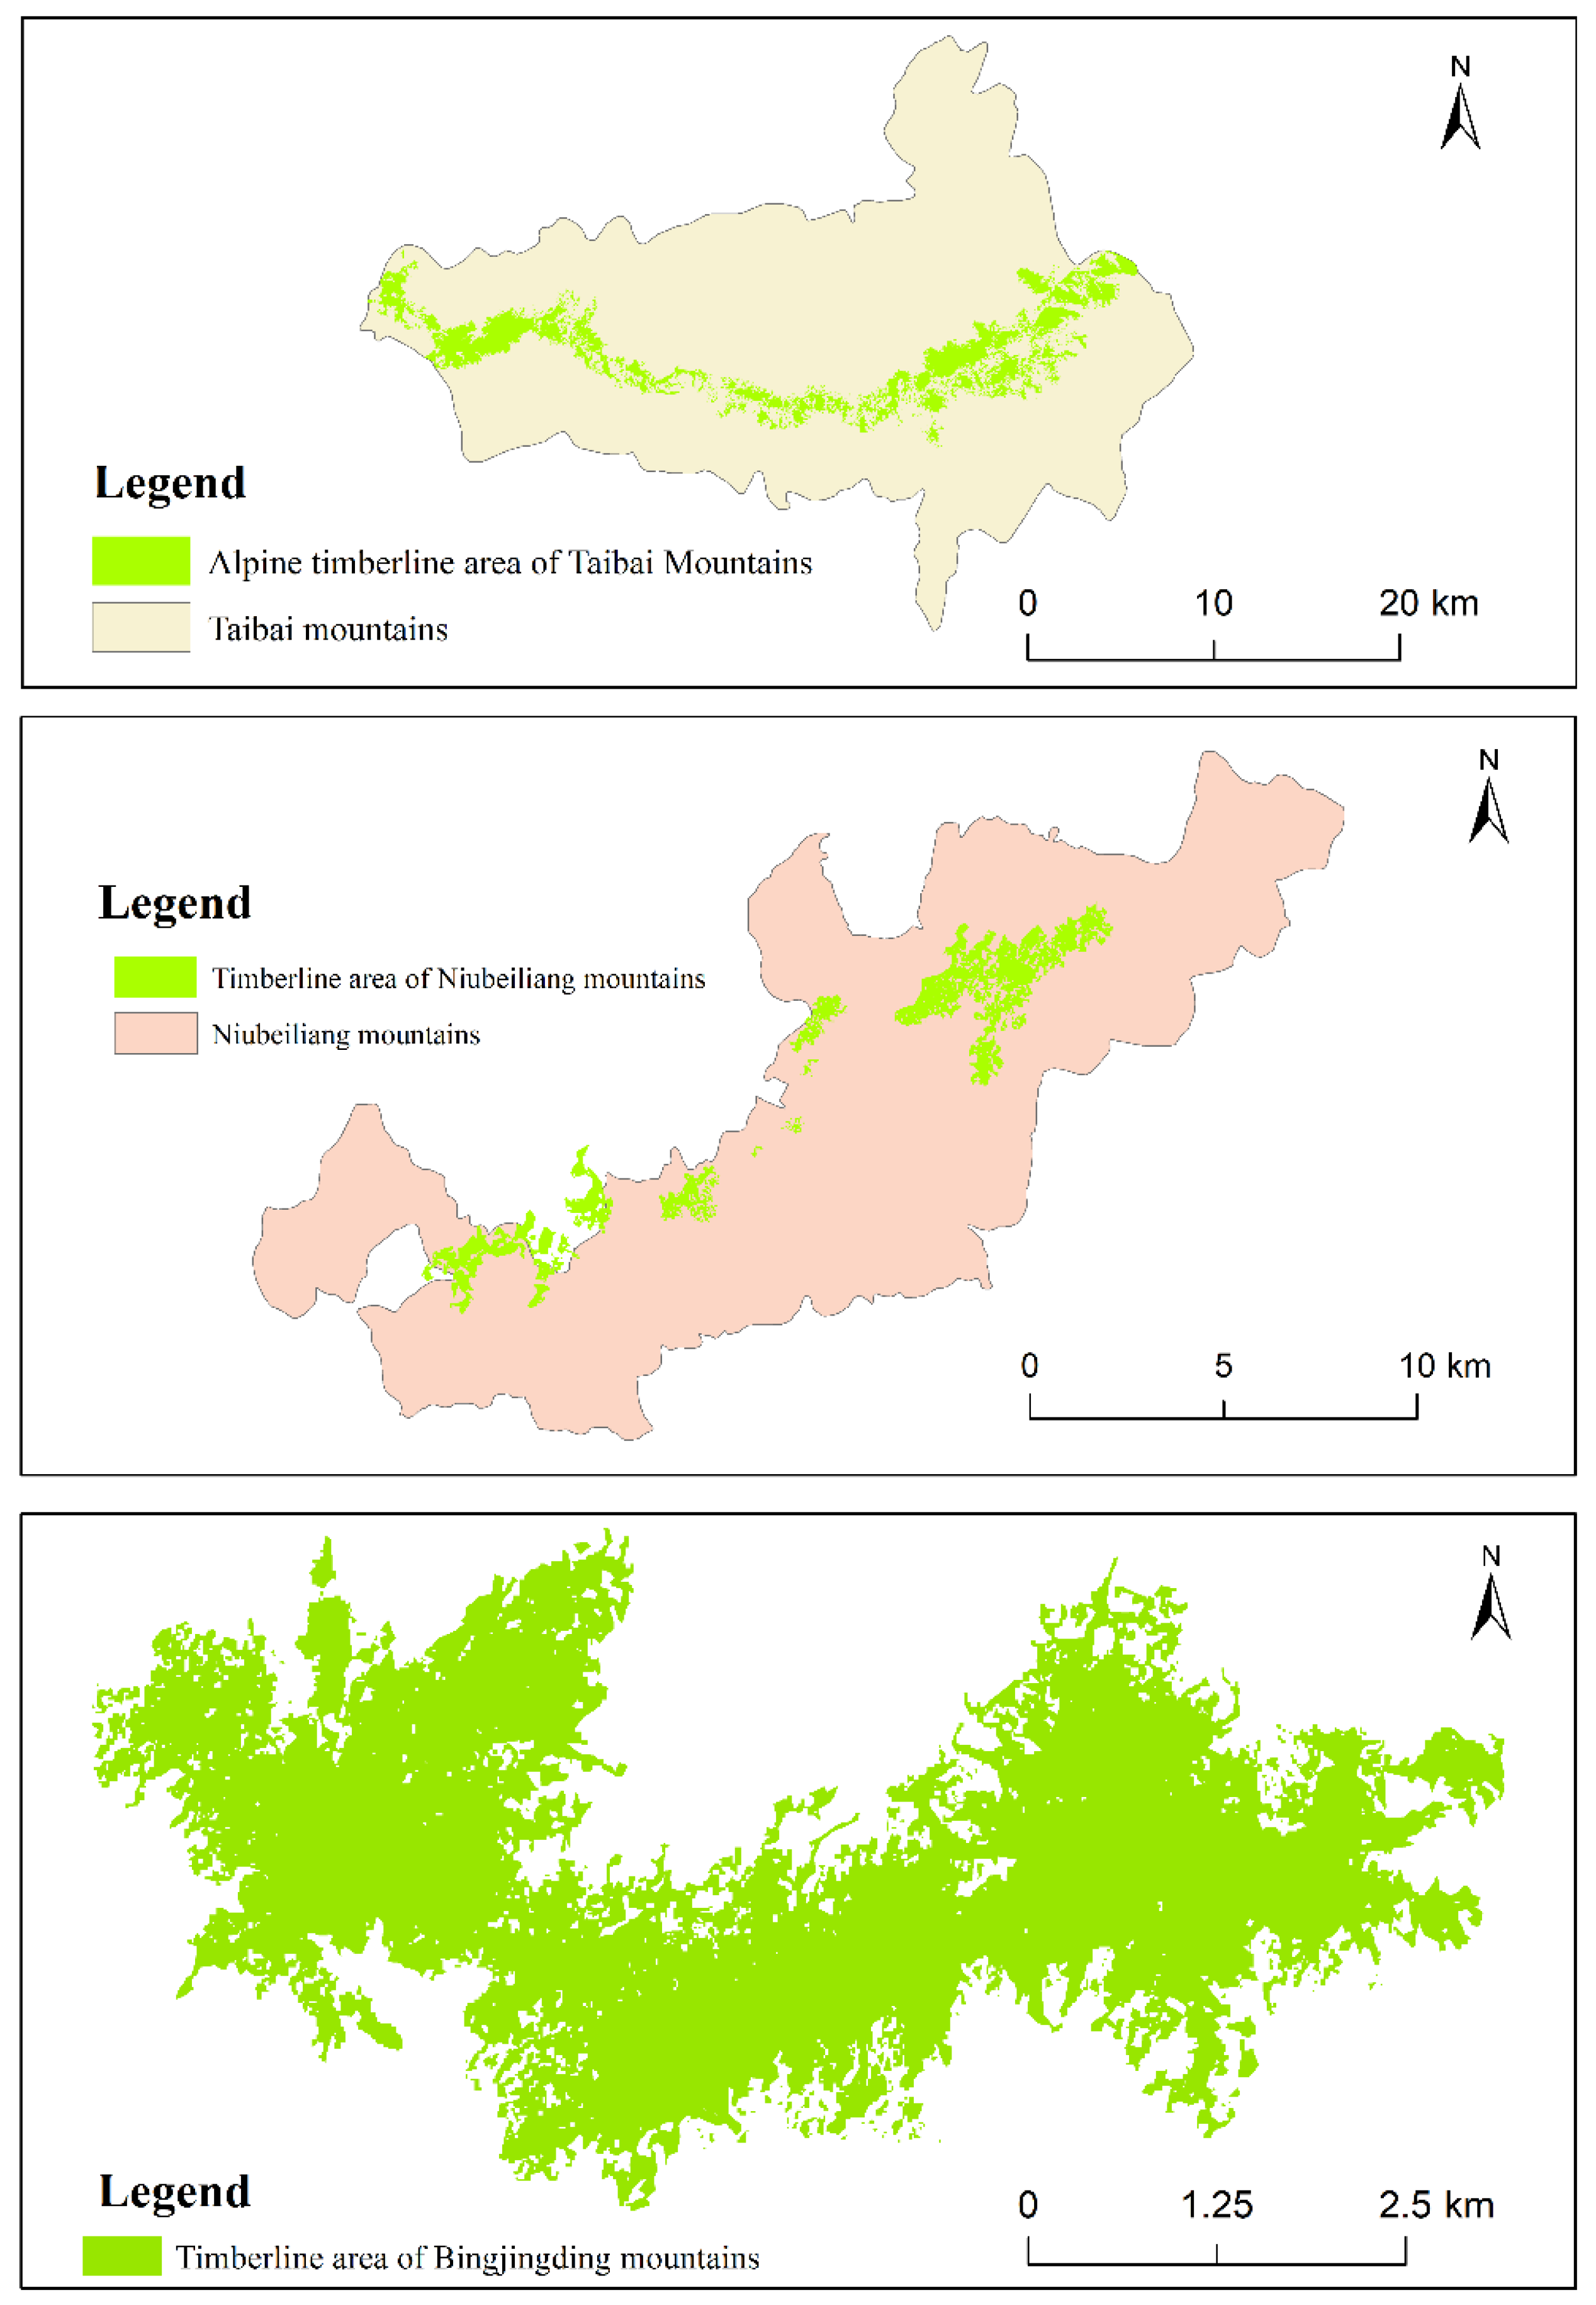
3.1. Extraction of Typical Timberline Regions in Qinling Mountains

Through data collection, remote sensing image analysis and field investigation, the response relationship between climate and vegetation in the timberline area of selected Taibai Mountains, Niubeiliang, and Bingjingding areas at high altitude in Qinling Mountains was examined. Pre-processing and post-clipping classification of remote sensing images of typical timberline areas in 2013 were performed. A range of typical timberline areas was obtained based on these analyses. See Figure 3.

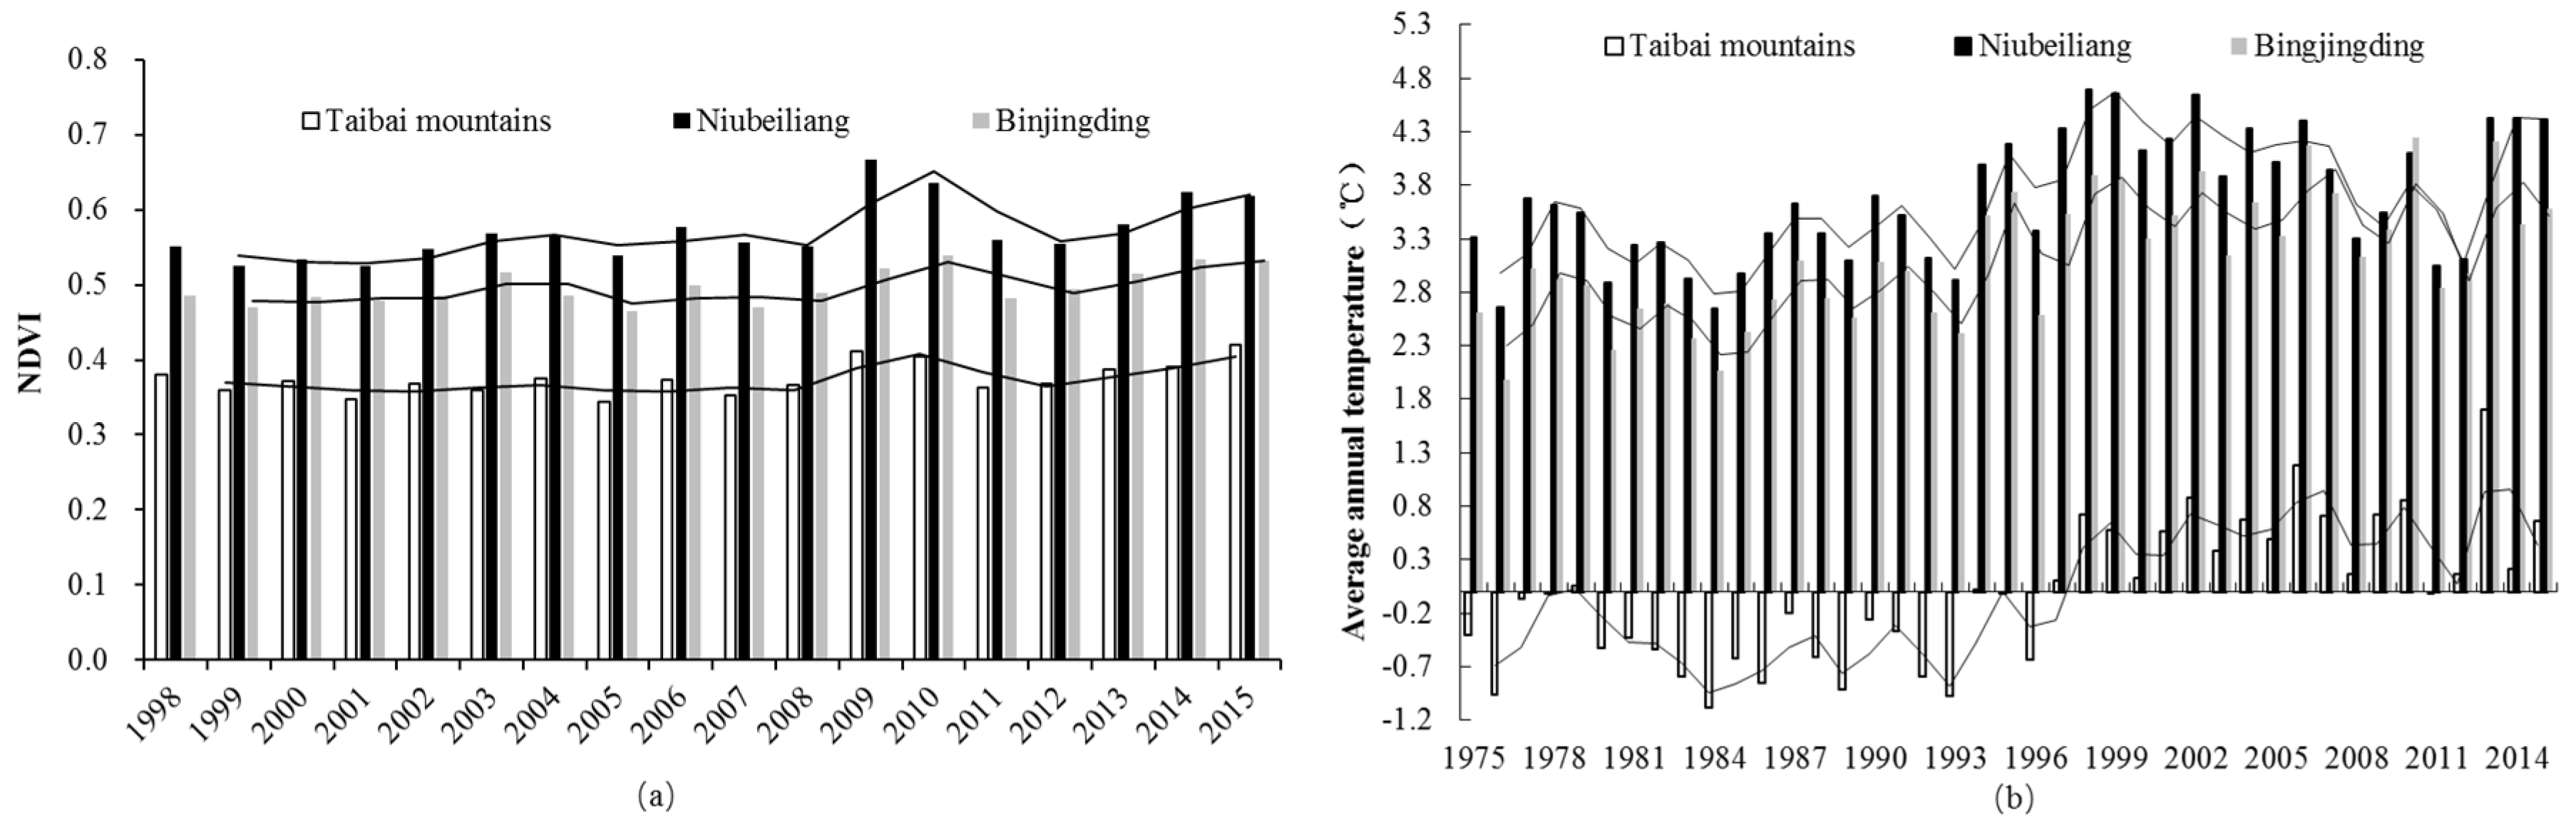
3.2. Analysis of NDVI and Temperature Change Characteristics in Typical Timberline Regions

Based on the NDVI and timberline areas in Qinling Mountains, the annual average NDVI of typical timberline areas from 1998 to 2015 was extracted using the method of zonal statistics, and its changing trend was analyzed.
According to Figure 4a, the average annual NDVI of each timberline area exhibits an upward trend. From the overall value of NDVI, the average annual NDVI of Niubeiliang timberline area is 0.5–0.6; the average annual NDVI of Taibai Mountain timberline area is 0.35–0.4; and the average annual NDVI of Bingjingding timberline area is about 0.5. As a result, the overall NDVI of Niubeiliang timberline area is higher than that of Taibai Mountain.
From the analysis of the time series change trend chart of temperature in the timberline area in Figure 4b, the annual average temperature in the three typical timberline areas show no obvious upward trend. The annual average temperature change rate in the timberline area of Taibai Mountain is 0.41 °C/10a, the annual average temperature change rate in Niubeiliang timberline area is 0.282 °C/10a, and the annual average temperature in the Bingjingding timberline area is 0.282 °C/10a. Temperature change rate is 0.347 °C/10a. Moreover, the overall temperature of Niubeiliang and Bingjingding timberline is significantly higher than that of Taibai Mountain timberline, and the temperature warming phenomenon is the most prominent in the Taibai Mountain timberline.

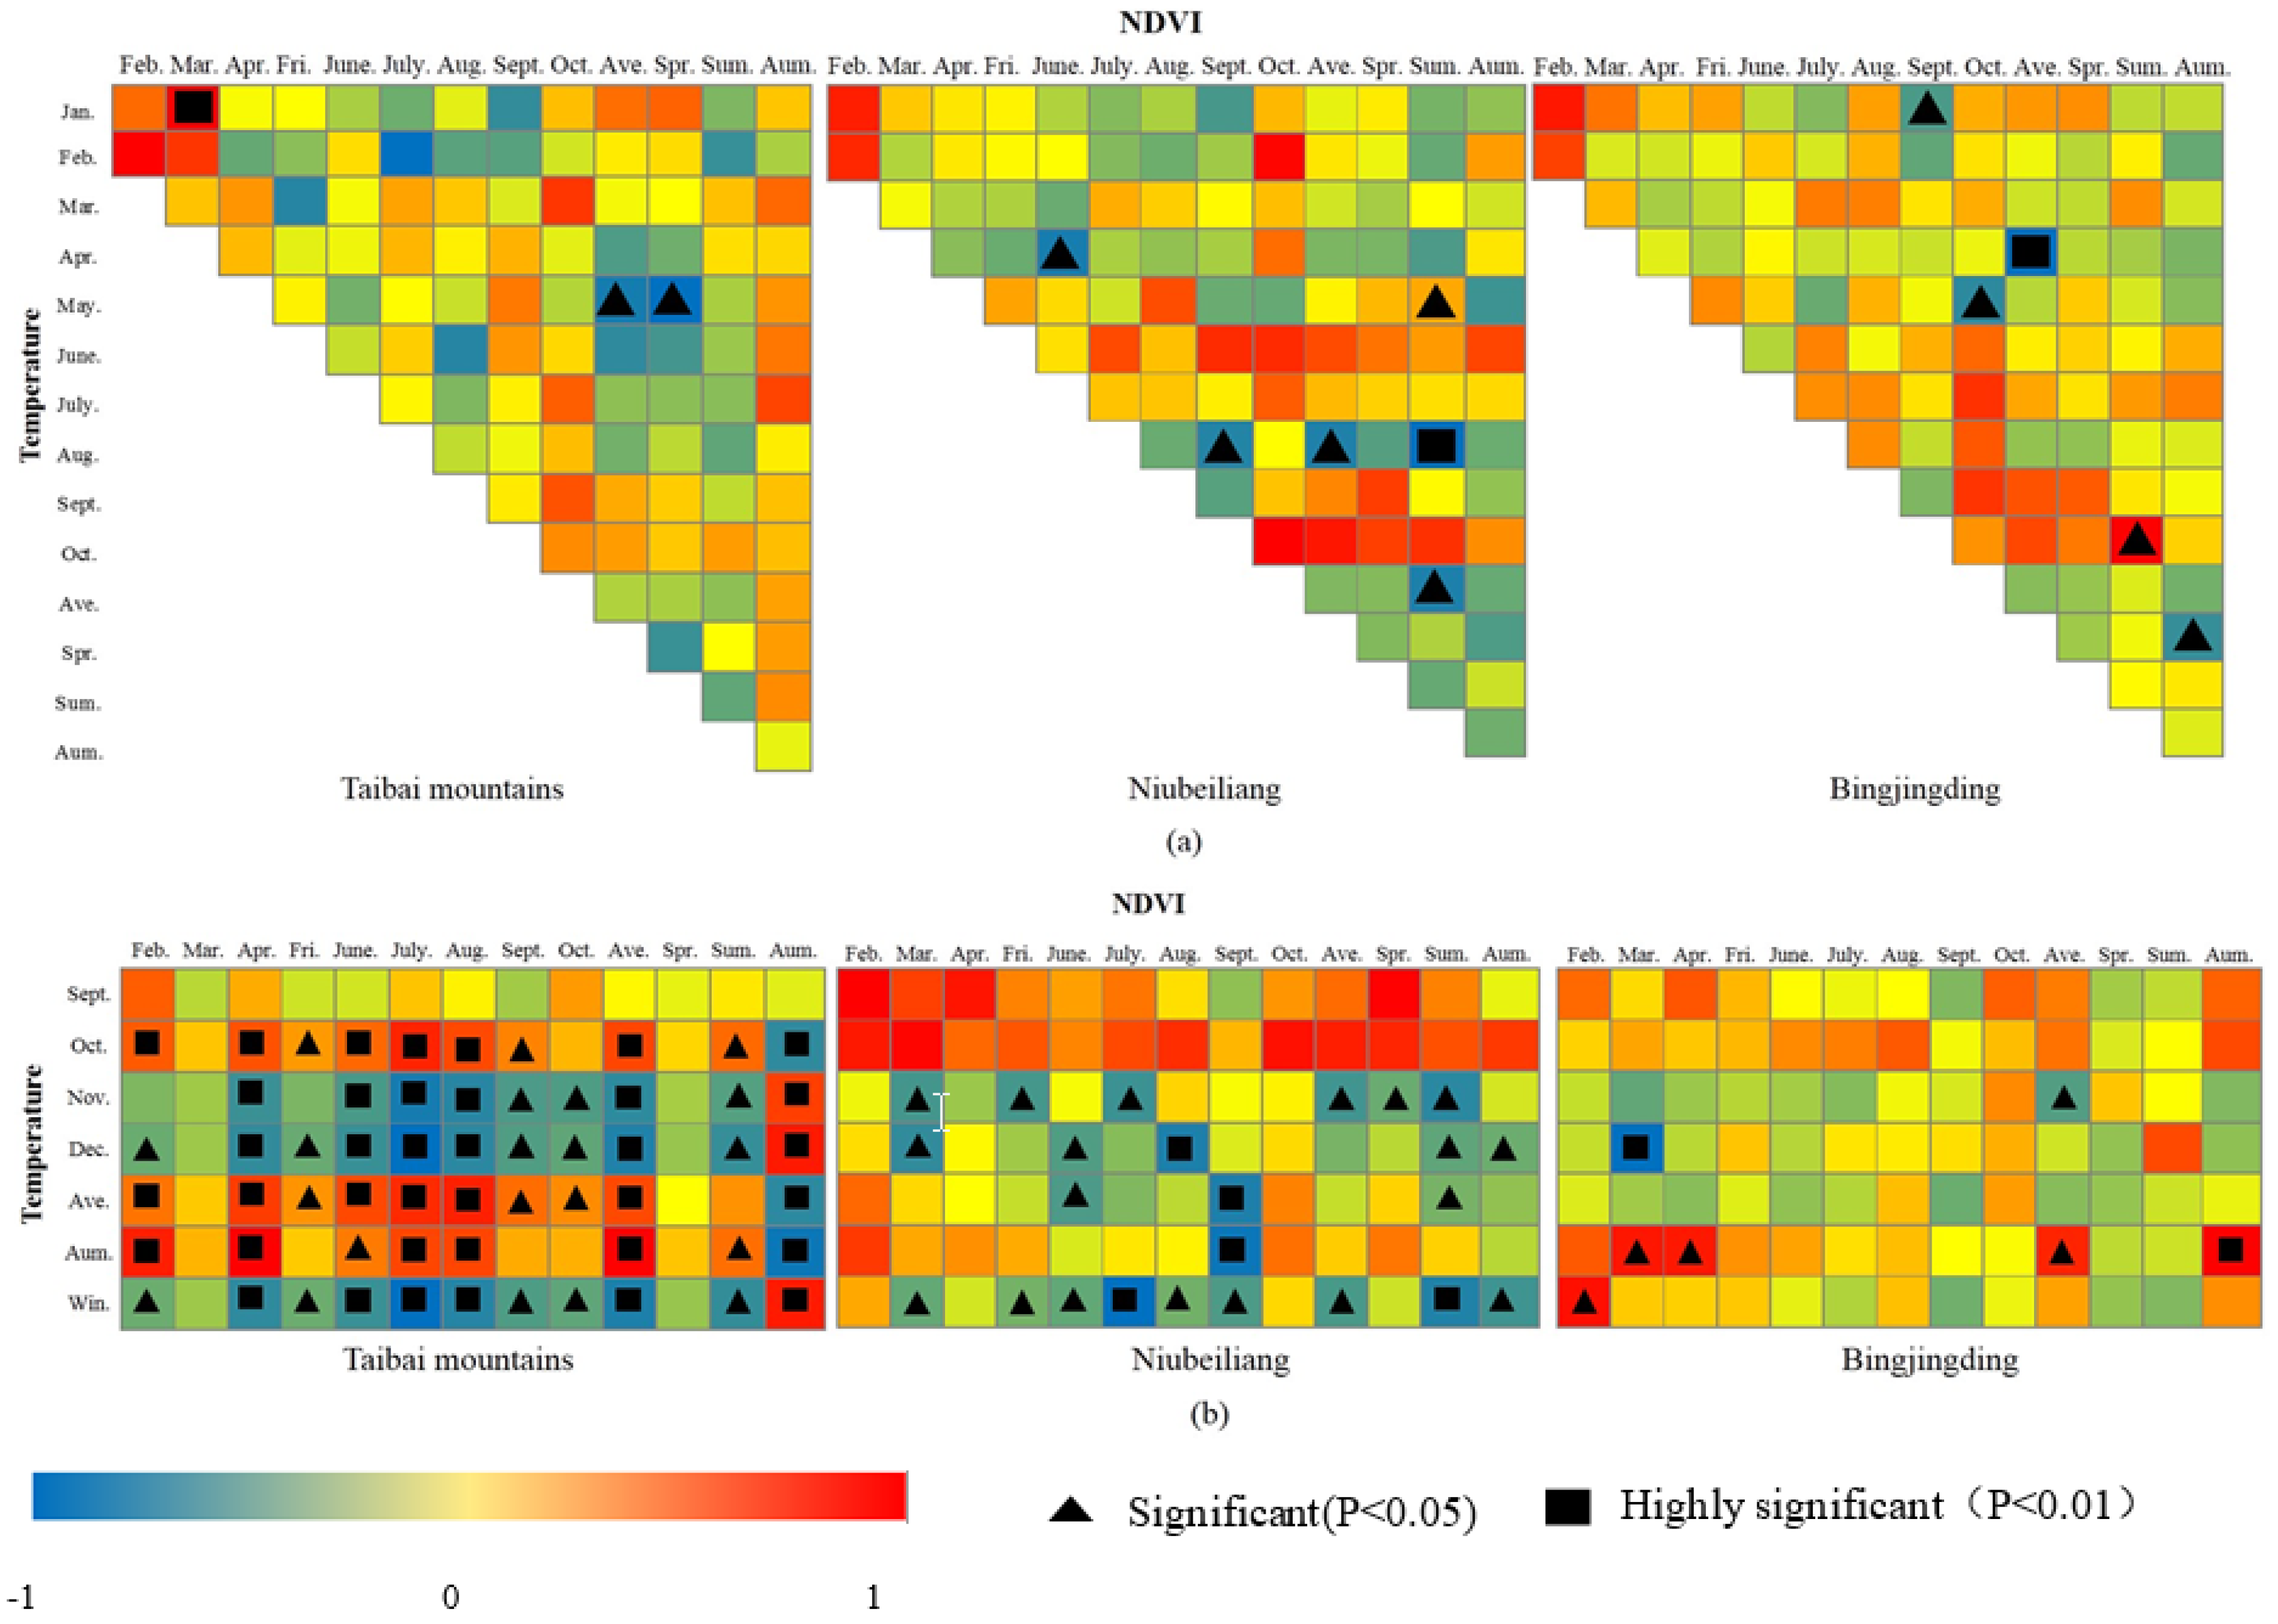
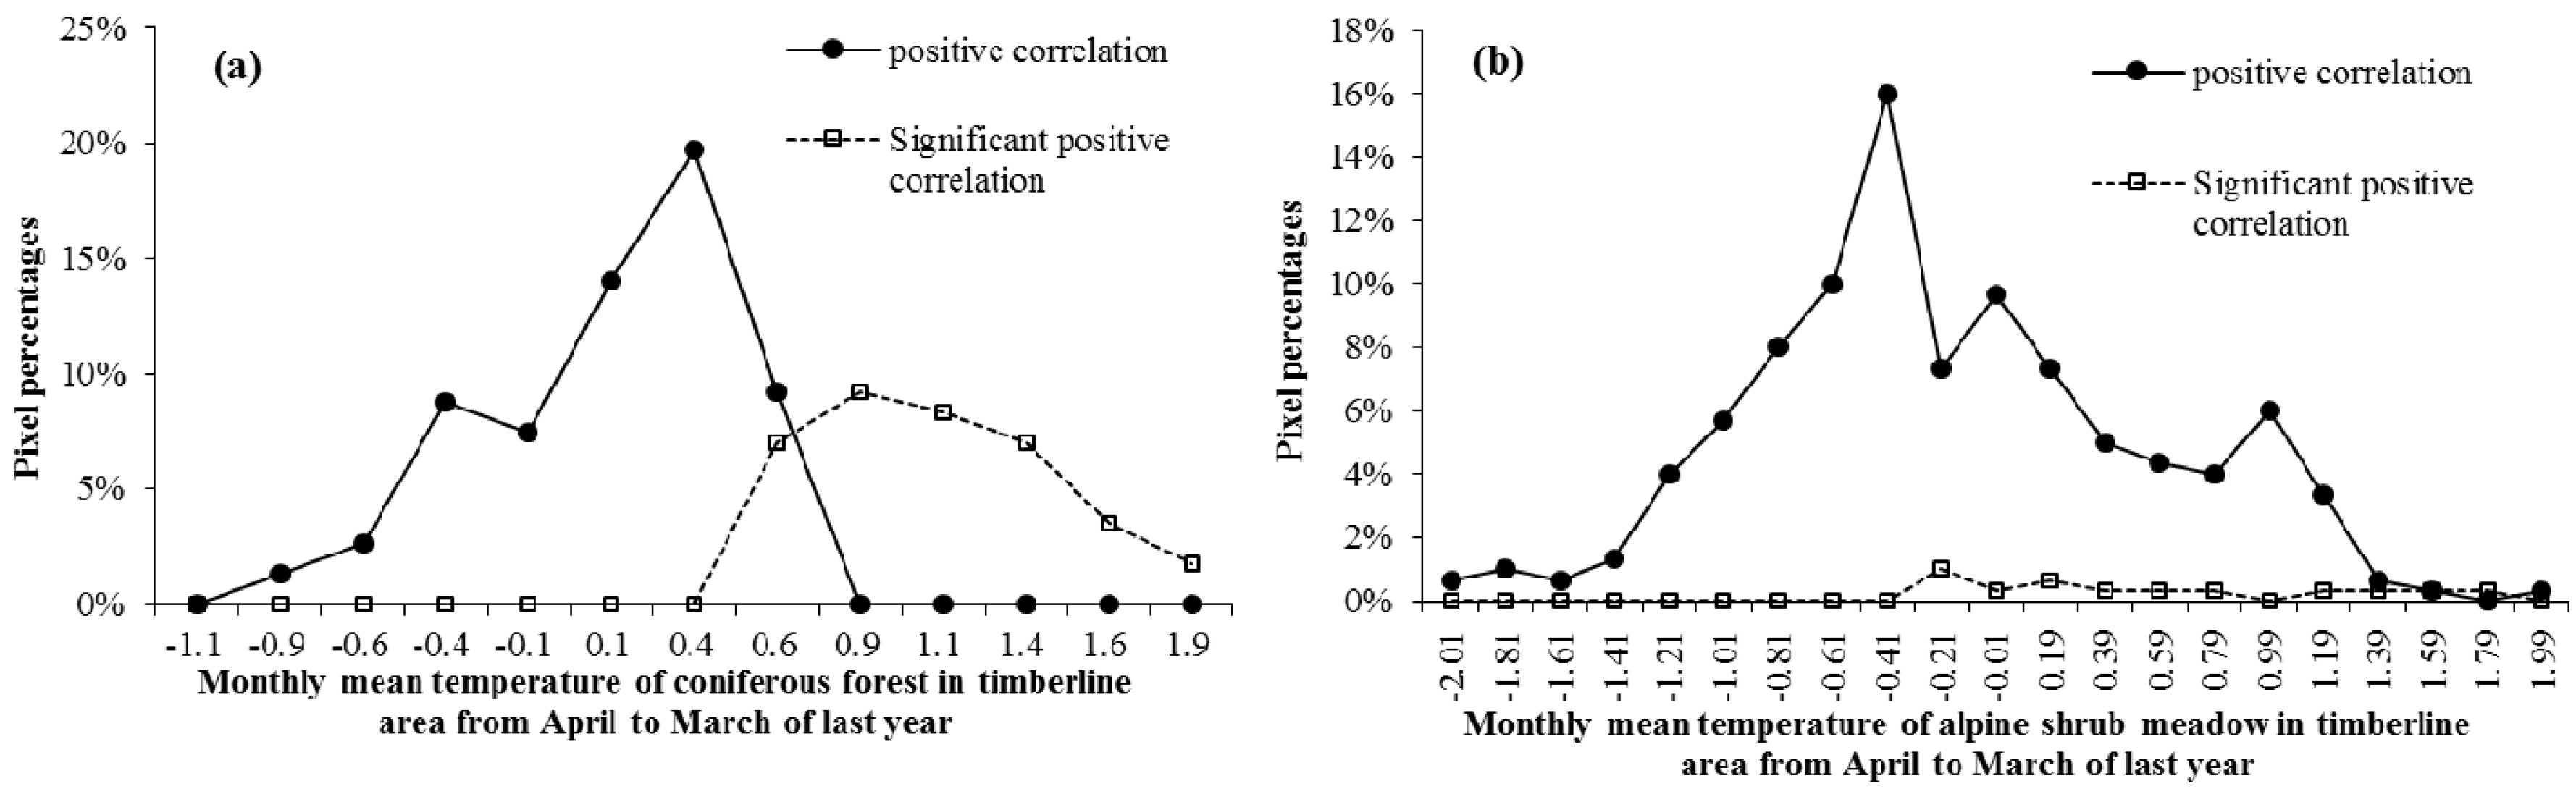
3.3. Analysis of the Correlation between NDVI and Temperature in Typical Timberline Areas

Results of ecosystem and climate change studies in many high altitude and high latitude areas show that plant growth and phenological changes respond significantly to the rise in temperature. Based on the monthly, seasonal, and annual correlation analysis of NDVI and temperature data from the three typical timberline regions of Taibai Mountain, Niubeiliang, and Bingjingding, the following conclusions were drawn:
On the seasonal and annual scales, the annual mean temperature of Taibai Mountain and Niubeiliang timberline was significantly, or very significantly, positively correlated with NDVI in March, April, and spring, see Figure 5a. The annual mean temperature of Taibai Mountain timberline was significantly positively correlated with NDVI in spring, while that of Niubeiliang timberline was positively correlated with NDVI in April, May, and spring. At the Bingjingding timberline area, the temperature in spring exhibited a significantly negative correlation with NDVI in autumn and winter.
Figure 5b shows the correlation coefficient map between temperature and NDVI of current and previous year in Taibai Mountain, Niubeiliang, and Bingjingding timberline. On the seasonal and annual scales, the average temperature in Niubeiliang timberline in the last year was positively correlated with NDVI in April and spring of the current year. Overall, the summer temperature of last year in Niubeiliang timberline area exhibited a positive effect on vegetation growth in spring of the current year. The winter temperature from last year also demonstrated a strong relationship with the vegetation growth during the summer of the subsequent year. Additionally, the average temperature of previous year exhibited a stronger relationship with the vegetation growth in the spring of the following year.
In general, the response of NDVI to temperature was found to exhibit signs of synchronization and hysteresis. Synchronization was reflected by the reverse regulatory effect of the NDVI from the previous year on the temperature of the three timberline areas in the following year. Meanwhile, the regulation of summer temperature was obviously hysteretic, as our results showed that there was a one-month lag between the change in NDVI and air temperature in the early growing season. This is also demonstrated by the significantly stronger correlation between the air temperature in February and the NDVI in March in the Niubeiliang and Taibai Mountain timberline areas.

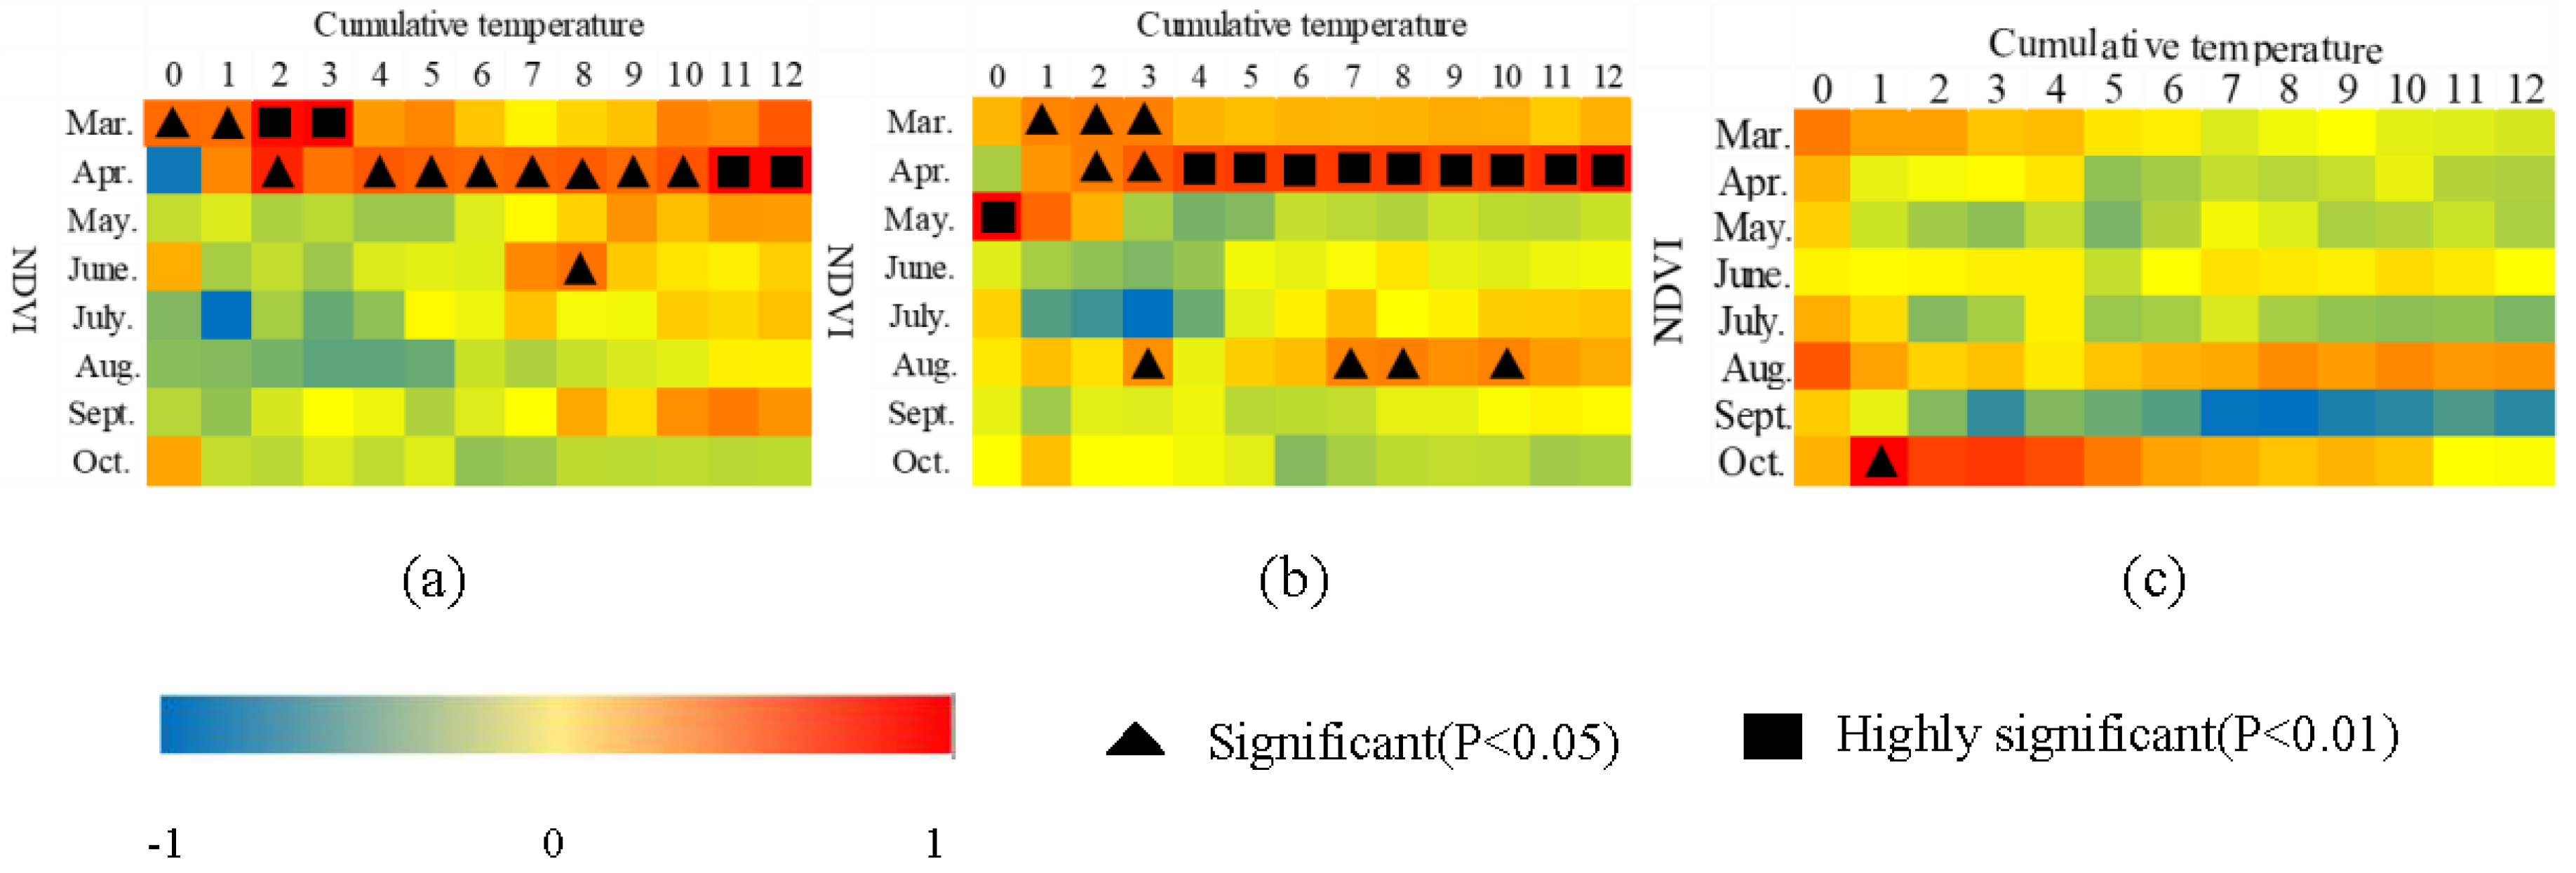
3.4. Correlation between NDVI and Cumulative Temperature in Typical Timberline

Long-term cumulative temperature can have a great impact on vegetation growth. It has been suggested that cumulative temperature is correlated with the NDVI of vegetation. Correlation analysis of the cumulative temperature in the first 1–12 months and the NDVI of typical timberline areas in Taibai Mountain, Niubeiliang, and Bingjingding from March to October was performed (Figure 6), and the relationship between the two was found to be regular.
The correlation between monthly NDVI and cumulative temperature of Niubeiliang timberline was similar to that of Taibai Mountain timberline, and the correlation between monthly NDVI and cumulative temperature in March and April was also more noticeable. In addition, the correlation between monthly NDVI and cumulative temperature of Niubeiliang in April and the cumulative temperature in the first 4–12 months also reached a very significant level.
From the table of correlation coefficient between monthly NDVI and cumulative temperature of the Bingjingding timberline, the NDVI and cumulative temperature from March to September was basically all in the negative phase. In September, NDVI was negatively correlated with the cumulative temperature during the first 7–10 months and the cumulative temperature in the first 12 months. In October, NDVI was positively correlated with the cumulative temperature in the first 12 months.
In summary, the correlations between cumulative temperature and vegetation in Taibai Mountain and in Niubeiliang timberline were similar. The correlation between cumulative temperature and NDVI in March and April was the strongest. The correlation between cumulative temperature and NDVI increased with the increase of cumulative time of temperature. There was a sensitive correlation between temperature and vegetation in the alpine timberline of Qinling Mountains, however, some areas exhibited special conditions and complex topography that could lead to changes in the dominant factors affecting vegetation.

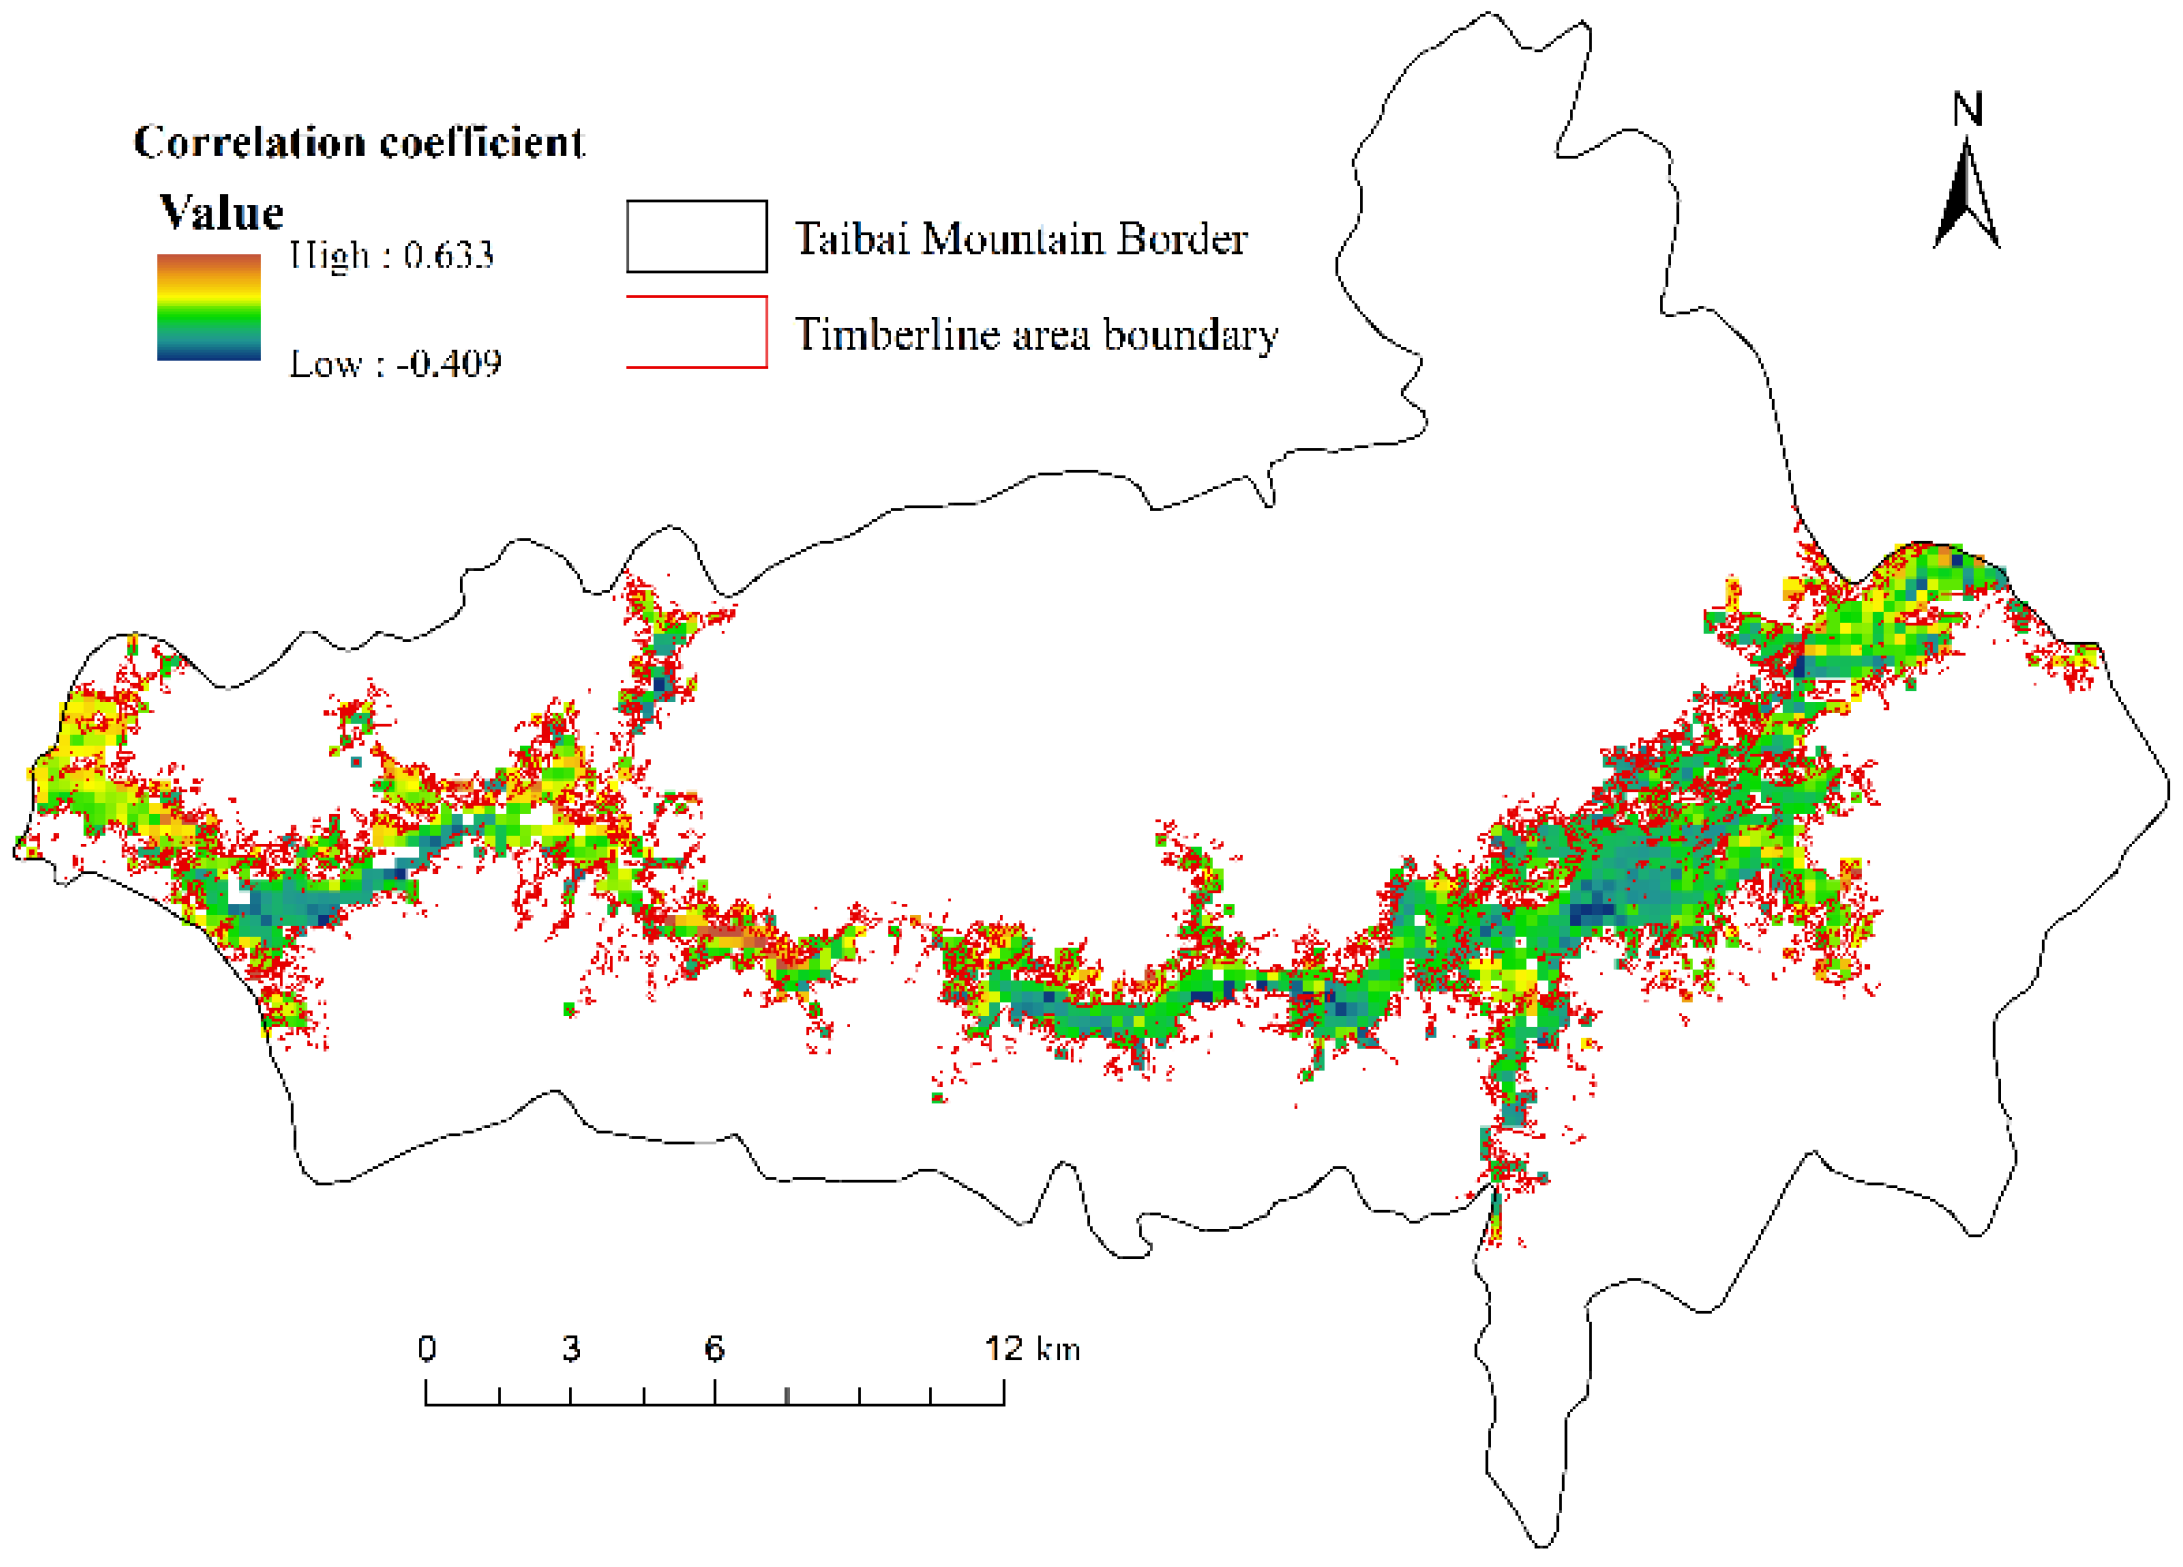
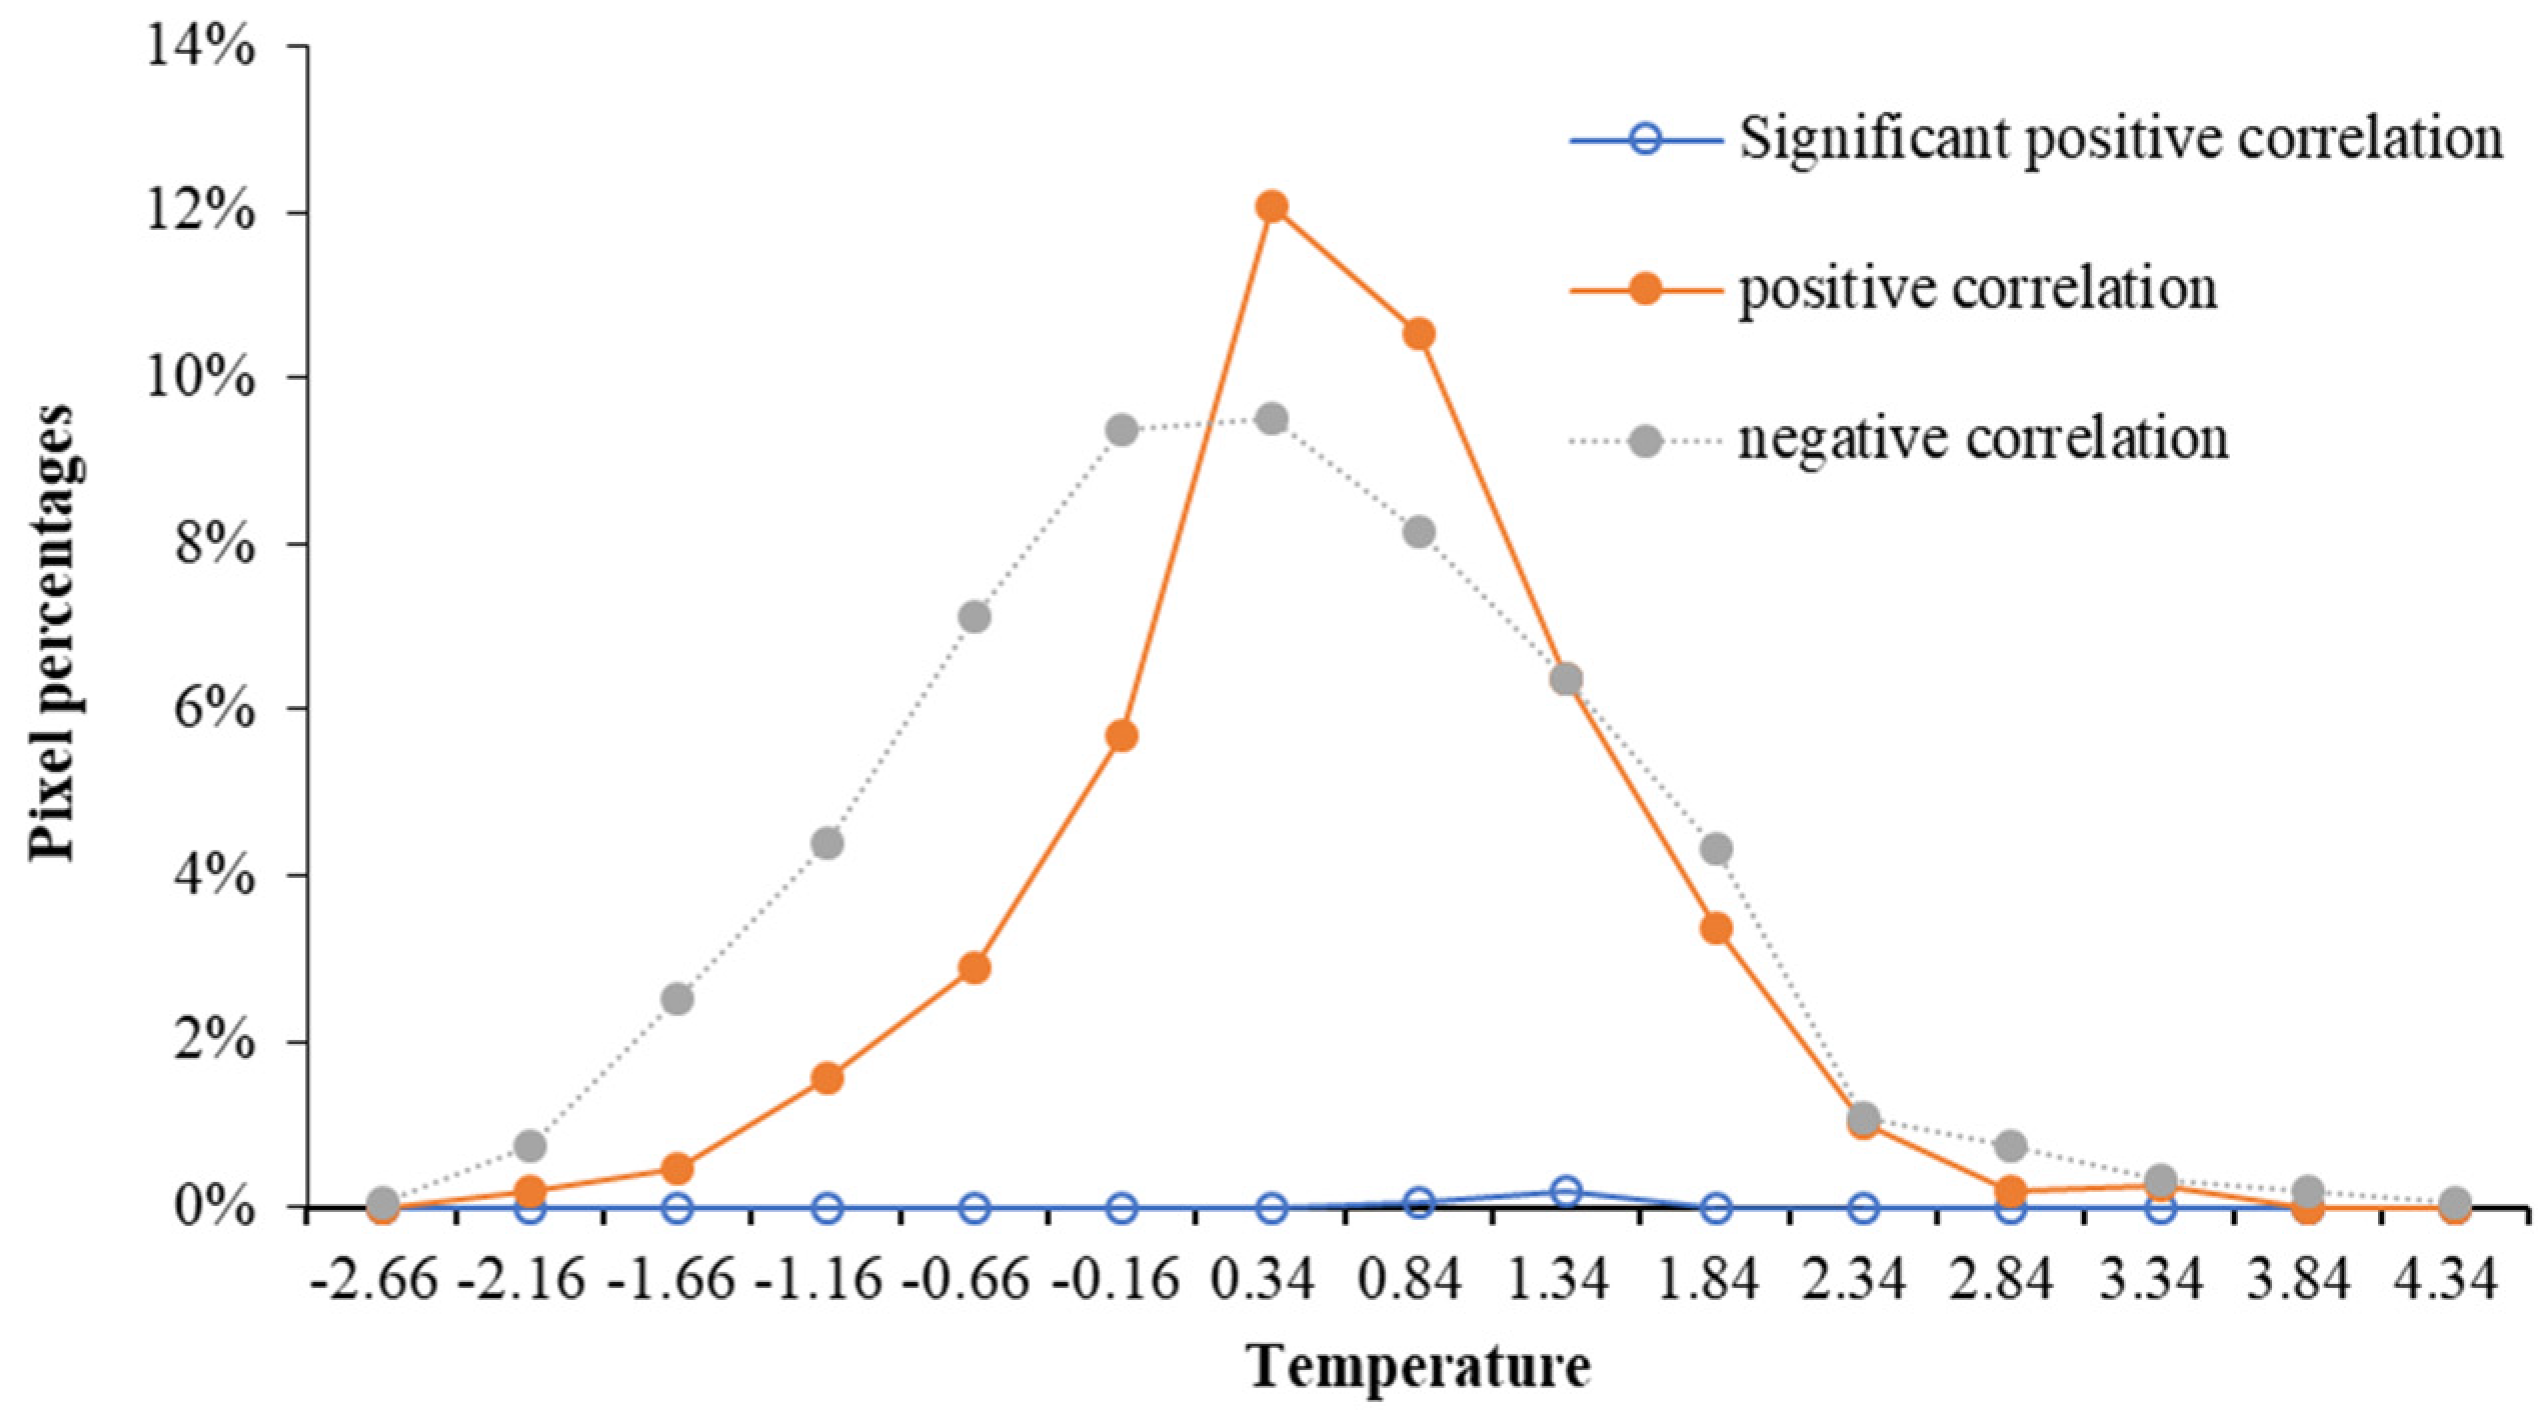
3.5. Threshold Analysis of Response of Timberline Vegetation to Temperature Change in Taibai Mountain

Through the study of the correlation between NDVI and temperature data, it is found that the timberline of Taibai Mountain belongs to the alpine timberline, which attributes to its higher sensitivity to climate change than sub-alpine timberline. The correlation coefficient between NDVI in April and the cumulative temperature in the first 12 months of Taibai Mountain timberline area reached 0.879, which was considered a very significant correlation. The cumulative temperature of this timeframe and the NDVI raster data set in April were selected for spatial correlation analysis, and the spatial distribution of correlation coefficients was shown in Figure 7.
As shown in Figure 8, the spatial correlation coefficient ranged from significantly positive correlation to negative correlation. In the correlation figure, significantly positive correlation pixels accounted for 10.49% of the total pixels, while positive correlation pixels accounted for 68.54% of the total pixels, and negative correlation pixels accounted for 21.54% of the total pixels. The corresponding temperature and correlation coefficients of each pixel were obtained by overlapping the graphs, and calculating the number of pixels of the corresponding correlation coefficients at different levels in each temperature segment.
In Figure 8, we can see, at the low temperature stage, the monthly average temperature range of Taibai Mountain timberline area from April of last year to March of next year was −2.66–4.34 °C. With the increase of temperature in the timberline area, the number of significantly positive correlation, positive correlation and negative correlation pixels exhibited a trend of first increasing, followed by a decline. Between −2.66 and 0.16 °C, the proportion of negative correlation pixels was higher than that of positive correlation pixels, which indicated that temperature was not the dominant factor of vegetation growth at the low temperature stage. However, at 0.34 °C, the number of positive correlation pixels exceeded that of negative correlation pixels. This demonstrated that temperature played a dominant role in vegetation growth between 0.34 and 1.34 °C. As the temperature continued to rise, the correlation became negative after 1.34 °C, as the number of negative correlation pixels was slightly higher than that of positive correlation pixels.
The relationship between temperature and NDVI correlation coefficient of coniferous forest and alpine shrub meadow area in timberline area was analyzed, respectively. Larix chinensis was divided into coniferous forest areas. As shown in Figure 9a, the proportion of positive correlation pixels between coniferous forest temperature and NDVI correlation coefficient in timberline area began to decrease when the monthly average temperature was 0.4 °C from April of last year to March of next year. The critical temperature point of significantly positive correlation pixel ratio reduction is 0.9 °C. In the alpine shrub meadow area, see Figure 9b, the critical temperature point at which the proportion of positive correlation pixels began to decrease in the alpine shrub area was −0.41 °C, and the proportion of significant positive correlation was not obvious.

4. Discussion

Vegetation change in timberline area is more susceptible to environmental change. Therefore, we choose the high-altitude timberline area to study the overall NDVI. This paper studies the temporal and spatial correlation between air temperature and NDVI in Qinling timberline area, and finds the most sensitive area and time. Based on this, the threshold range of NDVI affected by air temperature in timberline area is analyzed by pixel statistics. The final result is that if the accumulated temperature in the timberline area of Taibai Mountain from April of last year to March of this year exceeds 0.34 °C, the correlation between vegetation and temperature in the timberline area will begin to decline, new vegetation types will replace the original vegetation, and the change of environmental factors may cause new environmental problems, such as drought, so the future ecosystem changes will be more complex and unpredictable. In addition, the maximum threshold range of coniferous forest and meadow for temperature rise is 0.9 °C and −0.41 °C, respectively, indicating that meadow is more vulnerable to environmental change, and it is more likely to be replaced or degraded by other species. At present, many studies show that climate warming leads to the increase of vegetation activity [16,17,18], but what kind of impact will the continuous warming of temperature have on the overall vegetation growth? What is the specific threshold range of vegetation response to air temperature? These are the specific problems that need to be solved in climate change early warning research.
Up to this point in time, several studies have shown that as temperatures increase there is nearly always an increase in the growth of vegetation and NDVI [24,25,26]. Wang Lanhui derived global Vgreenup from a satellite leaf area index (LAI) observations taken over a span of 34 years, to study the spatio-temporal dynamics of Vgreenup at global, hemispheric, and ecosystem scales. It was found that those areas with the largest Vgreenup and the largest positive trends can be found in both deciduous and mixed forests, rather than non-forest ecosystems, which show both lower Vgreenup and lower positive trends. This is similar to the conclusion of this study. From this is can be seen that globally, warming has increased Vgreenup in temperature-constrained high latitude forest ecosystems and arctic regions, but decreased Vgreenup in those areas known to be temperate and arid/semi-arid [27]. In ordinary circumstances, the temperature warming up in alpine timberline areas is reflected by the timberline rising to higher altitudes [28,29,30]. Johnston et al. also highlighted climate warming in high-altitude mountains in his findings [31].
Certain studies have also reported that some parts of the timberline area are not as sensitive to climate change as others [32,33,34]. Particularly, many studies from abroad suggest that certain areas are much more sensitive to climate change than others [5]. In addition, human activities have led to the decline of the timberline in some mountainous areas, leading to the need to be more selective when choosing typical mountainous areas when studying the effect of timberline climate change. Ildikó Vincze et al. analysed two high-altitude lake-sediment sequences (Lake Lia, 1910 m a.s.l. and Lake Bucura, 2040 m a.s.l.) from the Retezat Mountains (South Carpathians, Romania) using multi-proxy methods to study the effect of and response to climate change and human impact by tree line, timberline, and alpine/subalpine vegetation during the past 16,000 years. It was concluded that climate change and human impact have both played an important role in lowering the tree line and timberline in the late-Holocene, and will continue to do so [35]. Therefore, with a background of climate warming, not all timberline areas can be generalized. When it comes to the study of climate change adaptation, it is important that only the most appropriate timberline areas should be selected for experimental sites. We have also realized the importance of this in the process of research.
The results of this study show that the sensitivity of high mountain timberline to climate change is higher than that of sub high mountain timberline. At present, temperature is the main factor affecting vegetation change. With climate change, vegetation types in timberline area will change significantly, which will cause the movement of timberline. The same phenomenon has been found by other studies. Maliheh Arekhi developed a new approach based on the NDVI, LST (land surface temperature) data, air temperature data, and forest stand maps over a 43-year period. The results show that during 1970–2013, the two pioneer tree species continued to expand and grow on open land, mainly in areas covered by rock and soil [36].

5. Conclusions

In this study, the relationship between vegetation and the warming temperatures in alpine timberline areas has been analyzed by remote sensing for the first time. The fact that alpine vegetation is very sensitive to temperature change was proven. The feedback of the relationship between the vegetation found in alpine areas and warming temperature was also analyzed. The alpine timberline has been calculated based on spatial analysis and pixel statistics of a geographic information system. The temperature threshold of vegetation makes up for the limitations of sediment experiments [34,37], tree ring chronology [38,39] and other sample point experiments, to a certain extent. While lake sediment and tree ring chronology [40,41,42] can reflect the response relationship between vegetation and temperature on a long-time scale, it will take more improvement in the development of remote sensing technology to make it easier to accurately show the overall situation on a spatial scale. Even though it can help us grasp the overall change at the present, there must still be field investigation and experimentation to verify the results.
However, when it comes to the overall warming of cumulative temperatures, the gradual increase will affect the survival of certain vegetation types. When the cumulative temperature exceeds that needed by the ecological area of certain vegetation, it will die and gradually be replaced by those species that require the warmer temperatures to grow well. In this study, the temperature threshold of forest vegetation types was analyzed from the spatial–temporal relationship between vegetation and temperature. However, biological experiments are needed to test the threshold value for specific vegetation types. Additionally, what kind of change will happen to the vegetation type in the future under the current temperature development, and what kind of risk may appear are the problems we need to explore in the future. In the aspect of forest management, we should pay special attention to the protection of typical vegetation species in the high mountain timberline, reduce the interference of tourism, hiking and other activities on the natural environment, and try to improve the biodiversity of the timberline transition area.

Author Contributions

Conceptualization, X.M. and H.B.; Methodology, X.M.; Software, X.M.; Validation, X.M., C.D., and T.W.; Formal analysis, C.D. and T.W.; Investigation, X.M.; Resources, X.M.; Data curation, X.M., C.D., and T.W.; Writing—original draft preparation, X.M.; Writing—review and editing, X.M.; Visualization, X.M. and T.W.; Supervision, H.B.; Project administration, H.B.; Funding acquisition, H.B. and T.W.

Funding

This research was funded by the Special Scientific Research Project of Shaanxi Education Department (Grant no. 19JK0931) Special Research Foundation Project of Xianyang Normal University (Grant no. 15XSYK043).

Conflicts of Interest

The authors declare no conflict of interest.

References

  1. Working Group, I Contribution to the IPCC Fifth Assessment Report Climate Change 2013: The Physical Science Basis Summary for Policymakers. Available online: https://www.ipcc.ch/ (accessed on 13 January 2015).
  2. Xie, J.F.; Mao, D.H.; Ren, C.Y. Advances in remote sensing analysis of vegetation-climate relationship. J. Northeast Norm. Univ. (Nat. Sci. Ed.) 2011, 3, 145–150. [Google Scholar]
  3. Seidl, R.; Thom, D.; Kautz, M.; Martin-Benito, D.; Peltoniemi, M.; Vacchiano, G.; Wild, J.; Ascoli, D.; Petr, M.; Honkaniemi, J.; et al. Forest disturbances under climate change. Nat. Clim. Chang. 2017, 7, 395–402. [Google Scholar] [CrossRef] [PubMed] [Green Version]
  4. Navarro, L.; Morin, H.; Bergeron, Y.; Montoro Girona, M. Changes in Spatiotemporal Patterns of 20th Century Spruce Budworm Outbreaks in Eastern Canadian Boreal Forests. Front. Plant Sci. 2018, 9, 1905. [Google Scholar] [CrossRef] [PubMed] [Green Version]
  5. Korenr, K.C.; Paulsen, P.J. A world-wide study of high-altitude tree line temperatures. J. Biogeogr. 2004, 31, 713–732. [Google Scholar] [CrossRef]
  6. Wang, Y.F.; Liang, E.Y. Tree line fluctuation and climate change research progress. J. Geoenviron. 2012, 3, 855–861. [Google Scholar]
  7. Zeng, L.B.; Wang, X.P.; Chang, J.F. The relationship between tree ring width and climate change in the ecotone of Qinghai spruce alpine timberline in the middle part of Qilian Mountain. J. Beijing For. Univ. 2012, 34, 50–56. [Google Scholar] [CrossRef]
  8. Zhang, L.J.; Liu, G. Response of Picea crassifolia population to climate change in Qilian Mountain timberline region. For. Sci. 2012, 48, 18–21. [Google Scholar] [CrossRef]
  9. Zhang, Q.B.; Lv, L.X. The relationship between tree growth and climate on alpine forestline in Tibet. In Proceedings of the Botany in the Construction of Ecological Civilization: The Present and the Future—The 15th Member Congress of the Chinese Botanical Society and the 80th Anniversary Academic Conference, Nanchang, China, 13 October 2013. [Google Scholar]
  10. Yu, J.; Xu, Q.Q.; Liu, W.H. Response of Radial Growth of Larix olgensis to Climate Change at Different Altitudes on the Eastern Slope of Changbai Mountain. J. Plant Ecol. 2016, 40, 24–35. [Google Scholar] [CrossRef] [Green Version]
  11. Wang, X.D.; Liu, H.Q.; Dong, W.H. A comparative analysis of the response of Rhododendron bark and Chapter Leaf on the western slope of Changbai Mountain to temperature rise. Geogr. Stud. 2015, 34, 1044–1052. [Google Scholar] [CrossRef]
  12. Edwards, M.; Henry, G.H.R.; Kühn, L.; Ingolf, I. The effects of long-term experimental warming on the structure of three High Arctic plant communities. J. Veg. Sci. 2016, 21, 1021–1035. [Google Scholar] [CrossRef]
  13. Huang, X.Y.; Bai, H.Y.; Su, K. Response and mechanism of Larix chinensisi to temperature change in Qinling Mountains. J. Ecol. 2017, 36, 1832–1840. [Google Scholar] [CrossRef]
  14. Guo, S.H.; Bai, H.Y.; Meng, Q. Landscape pattern change and its response to human disturbance in Qinling region from 1980 to 2015. J. Appl. Ecol. 2018, 29, 4080–4088. [Google Scholar] [CrossRef]
  15. Su, K.; Bai, H.Y.; Zhang, Y. Reconstruction of precipitation change characteristics of Taibai Mountain in Qinling Mountains over 160 years based on tree ring-climate data. J. Ecol. 2018, 37, 1467–1475. [Google Scholar] [CrossRef]
  16. Li, P.X. Changes of Vegetation on the Ice Crystal Top of Qinling Mountains and Its Response to Climate Change. Master’s Thesis, Northwest University, Xi’an, China, 2015. [Google Scholar]
  17. Wang, Y.; Xue, Z.; Chen, J.; Chen, G. Spatio-temporal analysis of phenology in Yangtze River Delta based on MODIS NDVI time series from 2001 to 2015. Front. Earth Sci. 2019, 13, 92–110. [Google Scholar] [CrossRef]
  18. Padhee, S.K.; Dutta, S. Spatio-Temporal Reconstruction of MODIS NDVI by Regional Land Surface Phenology and Harmonic Analysis of Time-Series. GISci. Remote Sens. 2019, 56, 1–28. [Google Scholar] [CrossRef]
  19. Xing, Z.C.; Li, G.M. Intelligent Classification Method of Remote Sensing Image Based on Big Data in Spark Environment. Int. J. Wirel. Inf. Netw. 2019, 26, 1325–1340. [Google Scholar] [CrossRef]
  20. Mo, S.G.; Zhang, B.P. Simulation of temperature field in Qinling Mountains based on DEM. J. Mt. 2007, 25, 406–411. [Google Scholar] [CrossRef]
  21. Wan, L.; Zhang, Z.; Dong, C. The Study on Influence Factors of Reference Crop Evapotranspiration in Hanjiang River Basin and Its Spatio-Temporal Change. J. South China Norm. Univ. 2017, 49, 73–81. [Google Scholar]
  22. Bai, H.Y.; Ma, X.P.; Gao, X.; Hou, Q.L. Temperature and 0 °C isotherm changes in Qinling Mountains in January based on DEM. J. Geogr. 2012, 67, 1443–1450. [Google Scholar]
  23. Ma, X.P.; Bai, H.Y.; Guo, S.; Deng, C.H.; Han, S.S. Study on the vertical decline rate of air temperature in Taibai Mountain of Qinling Mountains. Resour. Environ. Arid Areas 2017, 31, 139–144. [Google Scholar] [CrossRef]
  24. Liu, D.; Penuelas, J.; Ogaya, R.; Estiarte, M.; Tielbörger, K.; Slowik, F.; Yang, X.; Bilton, M.C. Species selection under long-term experimental warming and drought explained by climatic distributions. New Phytol. 2017, 217, 1494–1506. [Google Scholar] [CrossRef] [Green Version]
  25. Pang, B.; Zhang, P.Y.; Cheng-Peng, L.U. Dynamic response and variance of vegetation in China from 1982 to 2015 under the asymmetric rate of temperature fluctuation. Chin. J. Appl. Ecol. 2018, 29, 2362–2372. [Google Scholar] [CrossRef] [Green Version]
  26. Hou, J.; Du, L.; Liu, K.; Hu, Y.; Zhou, Y. Characteristics of vegetation activity and its responses to climate change in desert/grassland biome transition zones in the last 30 years based on GIMMS3g. Theor. Appl. Climatol. 2018, 136, 915–928. [Google Scholar] [CrossRef]
  27. Wang, L.H.; Feng, T.; Wang, Y.H.; Wu, Z.; Schurgers, G.; Fensholt, R. Acceleration of global vegetation greenup from combined effects of climate change and human land management. Glob. Chang. Biol. 2018, 24, 256–266. [Google Scholar] [CrossRef]
  28. Arno, S.F. Timberline Mountain & Arctic Forest Frontiers, 3rd ed.; The Mountaineers: Washington, DC, USA, 1984; pp. 102–103. [Google Scholar]
  29. Ferrari, C. Timberline and Alpine Vegetation in the Northern Apennines: Bioclimate Scenery and Vegetation Diversity. In Climate Gradients and Biodiversity in Mountains of Italy; Springer: Cham, Switzerland, 2018; pp. 109–124. [Google Scholar] [CrossRef]
  30. Naqinezhad, A.; Esmailpoor, A. Flora and vegetation of rocky outcrops/cliffs near the Hyrcanian forest timberline in the Mazandaran mountains, northern Iran. Nord. J. Bot. 2017, 35, 22–33. [Google Scholar] [CrossRef]
  31. Johnston, V.E.; Borsato, A.; Frisia, S.; Spötl, C.; Dublyansky, Y.; Töchterle, P.; Hellstrom, J.C.; Bajo, B.; Edwards, R.L.; Cheng, H. Evidence of thermophilisation and elevation-dependent warming during the Last Interglacial in the Italian Alps. Sci. Rep. 2018, 8, 2680. [Google Scholar] [CrossRef] [Green Version]
  32. Łajczak, A.; Lamorski, T. Economic use of the Babia Góra Massif and the assessment of anthropogenic changes in the course of the timberline. Geogr. Pol. 2015, 88, 115–138. [Google Scholar] [CrossRef] [Green Version]
  33. Kaczka, R.J.; Czajka, B.; Łajczak, A.; Nicia, P.; Szwagrzyk, J. The timberline as result of the interactions among forest, abiotic environment and human activity in the Babia Góra Mt. Western Carpathians. Geogr. Pol. 2015, 88, 177–191. [Google Scholar] [CrossRef] [Green Version]
  34. Orbán, I.; Birks, H.H.; Vincze, I.; Finsinger, W.; Pál, I.; Marinova, E.; Jakab, G.; Braun, M.; Hubay, K.; Bíró, T. Treeline and timberline dynamics on the northern and southern slopes of the Retezat Mountains (Romania) during the late glacial and the Holocene. Quat. Int. 2017, 477, 59–78. [Google Scholar] [CrossRef]
  35. Vincze, I.; Orbán, I.; Birks, H.H.; Pál, I.; Finsinger, W.; Hubay, K.; Marinova, E.; Jakab, G.; Braun, M.; Biró, T.; et al. Holocene treeline and timberline changes in the South Carpathians (Romania): Climatic and anthropogenic drivers on the southern slopes of the Retezat Mountains. Holocene 2018, 27, 359–371. [Google Scholar] [CrossRef] [Green Version]
  36. Arekhi, M.; Yesil, A.; Ozkan, U.Y.; Sanli, F.B. Detecting tree line dynamics in response to climate warming using forest stand maps and Landsat data in a temperate forest. For. Ecosyst. 2018, 5, 311–324. [Google Scholar] [CrossRef] [Green Version]
  37. Cheng, Y.; Liu, H.; Wang, H. Contrasting effects of winter and summer climate on alpine timberline evolution in monsoon-dominated East Asia. Quat. Sci. Rev. 2017, 169, 278–287. [Google Scholar] [CrossRef]
  38. Guo, B.D.; Wang, X.C.; Zhang, Y.D. Effects of threshold temperature and accumulated temperature on radial growth of Abies fasciatus in Minjiang River of the western Sichuan plateau forest line. J. Ecol. 2019, 39, 895–904. [Google Scholar] [CrossRef]
  39. Qin, J.; Bai, H.Y.; Liu, R. Reconstruction of March-June mean air temperature along the timberline of Mount Taibai, Qinling mountains, northwest China, over the last 144 years. Acta Ecol. Sin. 2017, 37, 7585–7594. [Google Scholar] [CrossRef] [Green Version]
  40. Girona, M.; Rossi, S.; Lussier, J.-M.; Walsh, D.; Morin, H. Understanding tree growth responses after partial cuttings: A new approach. PLoS ONE 2017, 12, e0172653. [Google Scholar] [CrossRef]
  41. Montoro Girona, M.; Morin, H.; Lussier, J.-M.; Walsh, D. Radial Growth Response of Black Spruce Stands Ten Years after Experimental Shelterwoods and Seed-Tree Cuttings in Boreal Forest. Forests 2016, 7, 240. [Google Scholar] [CrossRef] [Green Version]
  42. Montoro Girona, M.; Navarro, L.; Morin, H. A secret hidden in the sediments: Lepidoptera scales. Front. Ecol. Evol. 2018, 6, 2. [Google Scholar] [CrossRef] [Green Version]
Figure 1. Regional scope of typical timberline area. (a) Qinling Mountains and the position of typical timberline area in Qinling Mountains. (b) Niubeiliang Mountains. (c) Taibai Mountain. (d) The timberline area of Bingjingding Mountains.
Forests 10 01105 g001
Figure 2. Location of study sites.
Forests 10 01105 g002
Figure 3. Regional scope of typical timberline.
Forests 10 01105 g003
Figure 4. The trend of annual NDVI and temperature in typical timberline areas in 1998–2015. (a) Trend of NDVI in typical timberline area; (b) annual average temperature change trend of typical timberline area.
Forests 10 01105 g004
Figure 5. The correlation coefficient between NDVI and temperature in typical timberline area: (a) Map of correlation coefficient between NDVI and air temperature in the same year; (b) map of correlation coefficient between temperature and NDVI in the previous year.
Forests 10 01105 g005
Figure 6. Monthly NDVI and cumulative temperature correlation coefficient of typical timberline: (a) Monthly NDVI and cumulative temperature correlation coefficient map of Taibai Mountain timberline; (b) monthly NDVI and cumulative temperature correlation coefficient map of Niubeiliang timberline; (c) monthly NDVI of Bingjingding timberline and the correlated coefficient map of cumulative temperature.
Forests 10 01105 g006
Figure 7. Trend of correlation coefficient between temperature and vegetation with temperature in timberline area.
Forests 10 01105 g007
Figure 8. Trend chart of correlation coefficient between NDVI in April and cumulative temperature in the first 12 months along the Taibai Mountain timberline.
Forests 10 01105 g008
Figure 9. Trend of correlation coefficient between NDVI and temperature in coniferous forest and alpine meadow along timberline.
Forests 10 01105 g009
Table 1. SPOT-5 image interpretation mark.
Types of ObjectsImage CharacteristicsDistribution Situation
Accumulated snowWhite3400 m or above
Alpine shrubs and meadowsMagenta3400 m or above
Abies fargesiiDark green3100–3700 m
Larix chinensisCrimson, purple3100–3500 m scattered distribution
Coniferous forestDark purple2400–3200 m
Mixed coniferous and broad-leaved forestLavender1700–2400 m
Birch forestCyan green2300–3000 m
LakePinkDa Ye Hai and ER Ye Hai at the top of the mountain
River course, bare rock, stone seaPink, linearLow altitude valley area, patchy top
Non forest land, othersPink with whiteBoth sides of low altitude River
Table 2. The relationship between classification quality and kappa statistical value.
Kappa CoefficientClassification Quality
<0.00Very poor
0.00–0.2Poor
0.0–0.4Commonly
0.4–0.6Good
0.6–0.8Very good
0.8–1Excellent

