Article

Management Strategies for Conservation of Tanoak in California Forests Threatened by Sudden Oak Death: A Disease-Community Feedback Modelling Approach

1
Agriculture, School of Natural and Environmental Sciences, Newcastle University, Newcastle upon Tyne NE1 7RU, UK
2
Department of Plant Sciences, University of Cambridge, Cambridge CB2 3EA, UK
3
Department of Natural Resources and Environmental Science, California Polytechnic State University, San Luis Obispo, CA 93407, USA
4
Department of Plant Sciences, University of Cambridge, Cambridge CB2 3EA, UK
*
Author to whom correspondence should be addressed.
Forests 2019, 10(12), 1103; https://doi.org/10.3390/f10121103
Submission received: 18 September 2019 / Revised: 14 November 2019 / Accepted: 27 November 2019 / Published: 3 December 2019

Abstract

:
We use a new modelling approach to predict the cumulative impact of Phytophthora ramorum on the dynamic distribution of tanoak (Notholithocarpus densiflorus) and other tree species in coastal-Californian forest-communities. We explore the effectiveness of disease-management strategies for the conservation of tanoak at stand level. Forest resources are increasingly threatened by emerging pathogens such as P. ramorum, a generalist that kills hosts and has altered ecosystems in the USA and Europe. In coastal California, P. ramorum has the greatest impact on tanoak through leaf sporulation and lethal bole infections, but also sporulates on the common overstory-tree bay laurel (Umbellularia californica) without significant health impact. Such epidemiological differences impede host-species coexistence and challenge pathogen management. For most disease-impacted natural systems, however, empirical evidence is still insufficient to identify effective and affordable pathogen-control measures for retaining at-risk host populations. Yet, landscape-scale tree mortality requires swift actions to mitigate ecological impacts and loss of biodiversity. We apply a mathematical model of the feedback between disease and forest-community dynamics to assess the impacts of P. ramorum invasion on tanoak under stand-scale disease-management strategies by landowners aiming to retain tanoak and slow disease progression: (1) removal of inoculum through reduction of bay laurel abundance; (2) prevention of tanoak infection through chemical protection (acting epidemiologically like a vaccine); and (3) a combination strategy. The model results indicate that: (1) both bay laurel removal and tanoak protection are required to help maintain tanoak populations; (2) treatment effectiveness depends on forest composition and on threshold criteria; (3) sustainable tanoak conservation would require long-term follow-up of preventive treatments; (4) arresting basal sprouting upon tree removal may help to reduce inoculum. These findings suggest potential treatments for specific forest conditions that could be tested and implemented to reduce P. ramorum inoculum and disease and to conserve tanoak at stand level.

1. Introduction

Emerging tree pathogens and insect pests are an increasing threat to forest resources worldwide [1,2,3,4]. The introduction of these invasive organisms has been facilitated by expanding international trade, while their establishment and ecological impacts have been influenced by climate and environmental changes [1,5,6,7,8]. These outbreaks are notoriously difficult to control and manage [2] as illustrated by the cases of chestnut blight, Dutch elm disease, and white pine blister rust [1,9,10]. The epidemics of the non-native Phytophthora ramorum Werres, De Cock & Man in’t Veld in the western USA and Europe have caused significant economic losses in nursery trade and forest industries [6,11], requiring costly management and regulation [12,13], and threaten the stability of ecosystem functions and services [8,14]. In the west coast of the USA, P. ramorum causes sudden oak death disease (through the development of lethal bole cankers) on several Quercus species, especially coast live oak (Quercus agrifolia Née) and tanoak (Notholithocarpus densiflorus (Hook. & Arn.) Manos, Cannon & S.H. Oh), and non-lethal leaf blight on many trees and shrubs including bay laurel (Umbellularia californica (Hook. & Arn.) Nutt.). Since its emergence in the 1990s in California and Western Europe [15], P. ramorum has killed millions of trees in Californian forests [16] and has also impacted woodlands in Britain, Ireland, and northern France [17,18,19,20]. There are concerns that P. ramorum poses a risk elsewhere in the world, including China [21]. Tree mortality events at this scale are often accompanied by public and land-manager demand for ameliorative and pathogen-control measures. However, there is often insufficient epidemiological understanding of emerging diseases and insufficient field evaluation of treatment efficacy to identify management strategies that are effective and affordable at outbreak scales.
In this paper, we address the problem for P. ramorum; specifically, how to mitigate the sheer loss of tanoak in coastal California and Oregon forests caused by sudden oak death. Mortality from this disease is occurring at a scale and a rate comparable to the demise of American chestnut (Castanea dentata) [10]. The contrasting epidemiological characteristics of the main hosts drive the spread of P. ramorum and community change in California and Oregon forests. Tanoak, a common, native overstory tree, supports significant P. ramorum sporulation but is killed 2–8 years after infection [22]. Bay laurel, another common overstory tree in these forests, supports very high levels of leaf sporulation without suffering a health impact [23] and acts as persistent source and reservoir of the pathogen. In general, P. ramorum hosts have very different susceptibility, infectivity, and disease-induced mortality [24,25]. Therefore, community composition in these forests is a key determinant of P. ramorum impacts, such as loss of overstory tanoak, increased abundance of bay laurel and redwood (Sequoia sempervirens (D. Don) Endl.), and altered ecological function [14,26,27].
The risk to tanoak challenges forest managers tasked with conserving cultural and ecological resources. Tanoak is the sole acorn producing species and/or ectomycorrhizal host in many forests [24,28,29,30], and Californian Native American communities make regular use of tanoak products (acorns, traditional medicines) [31]. Phytothophora ramorum threatens these cultural resources and endemic biodiversity associated with tanoak [30]. Moreover, as infected tanoak are a source of inoculum, and inoculum can be further amplified by the prolific spread from bay laurel, the arrival of P. ramorum at previously uninvaded forests and regions throughout the tanoak range triggers economically costly quarantine and disease management [24,32]. Historically, however, tanoak management has focused on reducing competition with conifer species due to its low market value compared with other hardwood species [2,31].
Experiments on P. ramorum control have been implemented at different scales and settings with management goals ranging from reducing inoculum to retaining overstory tanoak. The removal (felling) of infected trees and pre-emptive reduction of host populations have been implemented in the western USA, UK, and Ireland to reduce local inoculum and pathogen spread [17,20,24,33]. Attempts to eradicate P. ramorum at the stand and landscape scales have been made in Oregon using intensive treatments [13,34]; but while they have reduced pathogen populations locally, landscape-level spread has continued [35,36] probably due to sustained dispersal from cryptic infections [37]. Another requisite for successful pathogen management involves marshalling maximum support and coordination among stakeholders [38]. On the other hand, phosphonate-based fungicides show some promise in increasing tanoak population resilience against P. ramorum [39,40]; we use the term ‘resilience’ here to refer to the forest composition and broad ecological functions associated with tanoak. However, while fungicides show potential as transitory protectants of uninfected trees, they have no curative effect on infected trees [41,42]. Moreover, the duration and efficacy of phosphonate protection are uncertain even at individual tree level, particularly one or two years after application [39,43]. Further experimentation is needed to test these treatments at tree and stand levels [40].
Identifying effective and affordable P. ramorum treatments is complicated by the cross-spatiotemporal characteristics that shape sudden oak death epidemiology. The associated management challenges [24,34,37,39] are accentuated by the coarse spatiotemporal grain and limited replication of the empirical data on the effectiveness of management treatments, as exemplified by attempts to assess phosphonate-based protection [40]. An alternative route to assess the effectiveness of disease management strategies is to use mathematical models of host–pathogen population dynamics. Previous modelling work demonstrated the importance of scale, timing, and method for controlling pathogen spread at landscape extents of 10–100 km [44]. Here, we propose a model for evaluating disease-reduction actions at smaller scales to inform local forest management aimed at conserving tanoak and associated ecological functions [24,30]. We use the model to examine options for locally-targeted management of stands or small privately-owned parcels taking into account that real forest management encompasses diverse determinants of treatment effectiveness such as host community composition, stakeholder adherence, and cultural resistance to chemical use. The models allow us to analyze the effectiveness of these treatments at scales ranging up to multiple stands.
We develop a spatial model of the dynamics of competing hosts and redwood under a P. ramorum epidemic parameterized from extensive field data [45] from longitudinal observations of individual trees located in plots across the range of the P. ramorum hosts. We use the model to address the following questions, motivated by a need to identify effective approaches to retain tanoak threatened by P. ramorum amid large uncertainty about treatment effects.
Q1: Forest composition: As this is known to affect disease impacts, such as inoculum production and host mortality [45]:
(a)
How does forest composition affect pathogen spread without management?
(b)
Can forest composition be modified to prevent or ameliorate disease outbreaks?
(c)
How does forest composition affect the effectiveness of management strategies?
Q2: Management strategies: What are the short and long-term disease impacts with:
(a)
no management?
(b)
removal of bay laurel to reduce pathogen spread, with and without herbicide application to prevent stump resprouting, and with and without follow-up removals?
(c)
preventive chemical protection of tanoak?
(d)
a combination of treatments b (pathogen-centred) and c (host-centred)?
We track these questions individually throughout the section headings and within the text. We anticipate epidemic threshold-behaviour can occur whereby pathogen invasion fails in stands with low host (e.g., bay laurel) density. Therefore, we expect that manipulation of host density or tanoak susceptibility in non-infested stands may shift this threshold and prevent pathogen outbreaks. In stands already infested, we expect the choice of the most effective management strategy to retain tanoak would depend on the stand composition and on the management resources available.

2. Materials and Methods

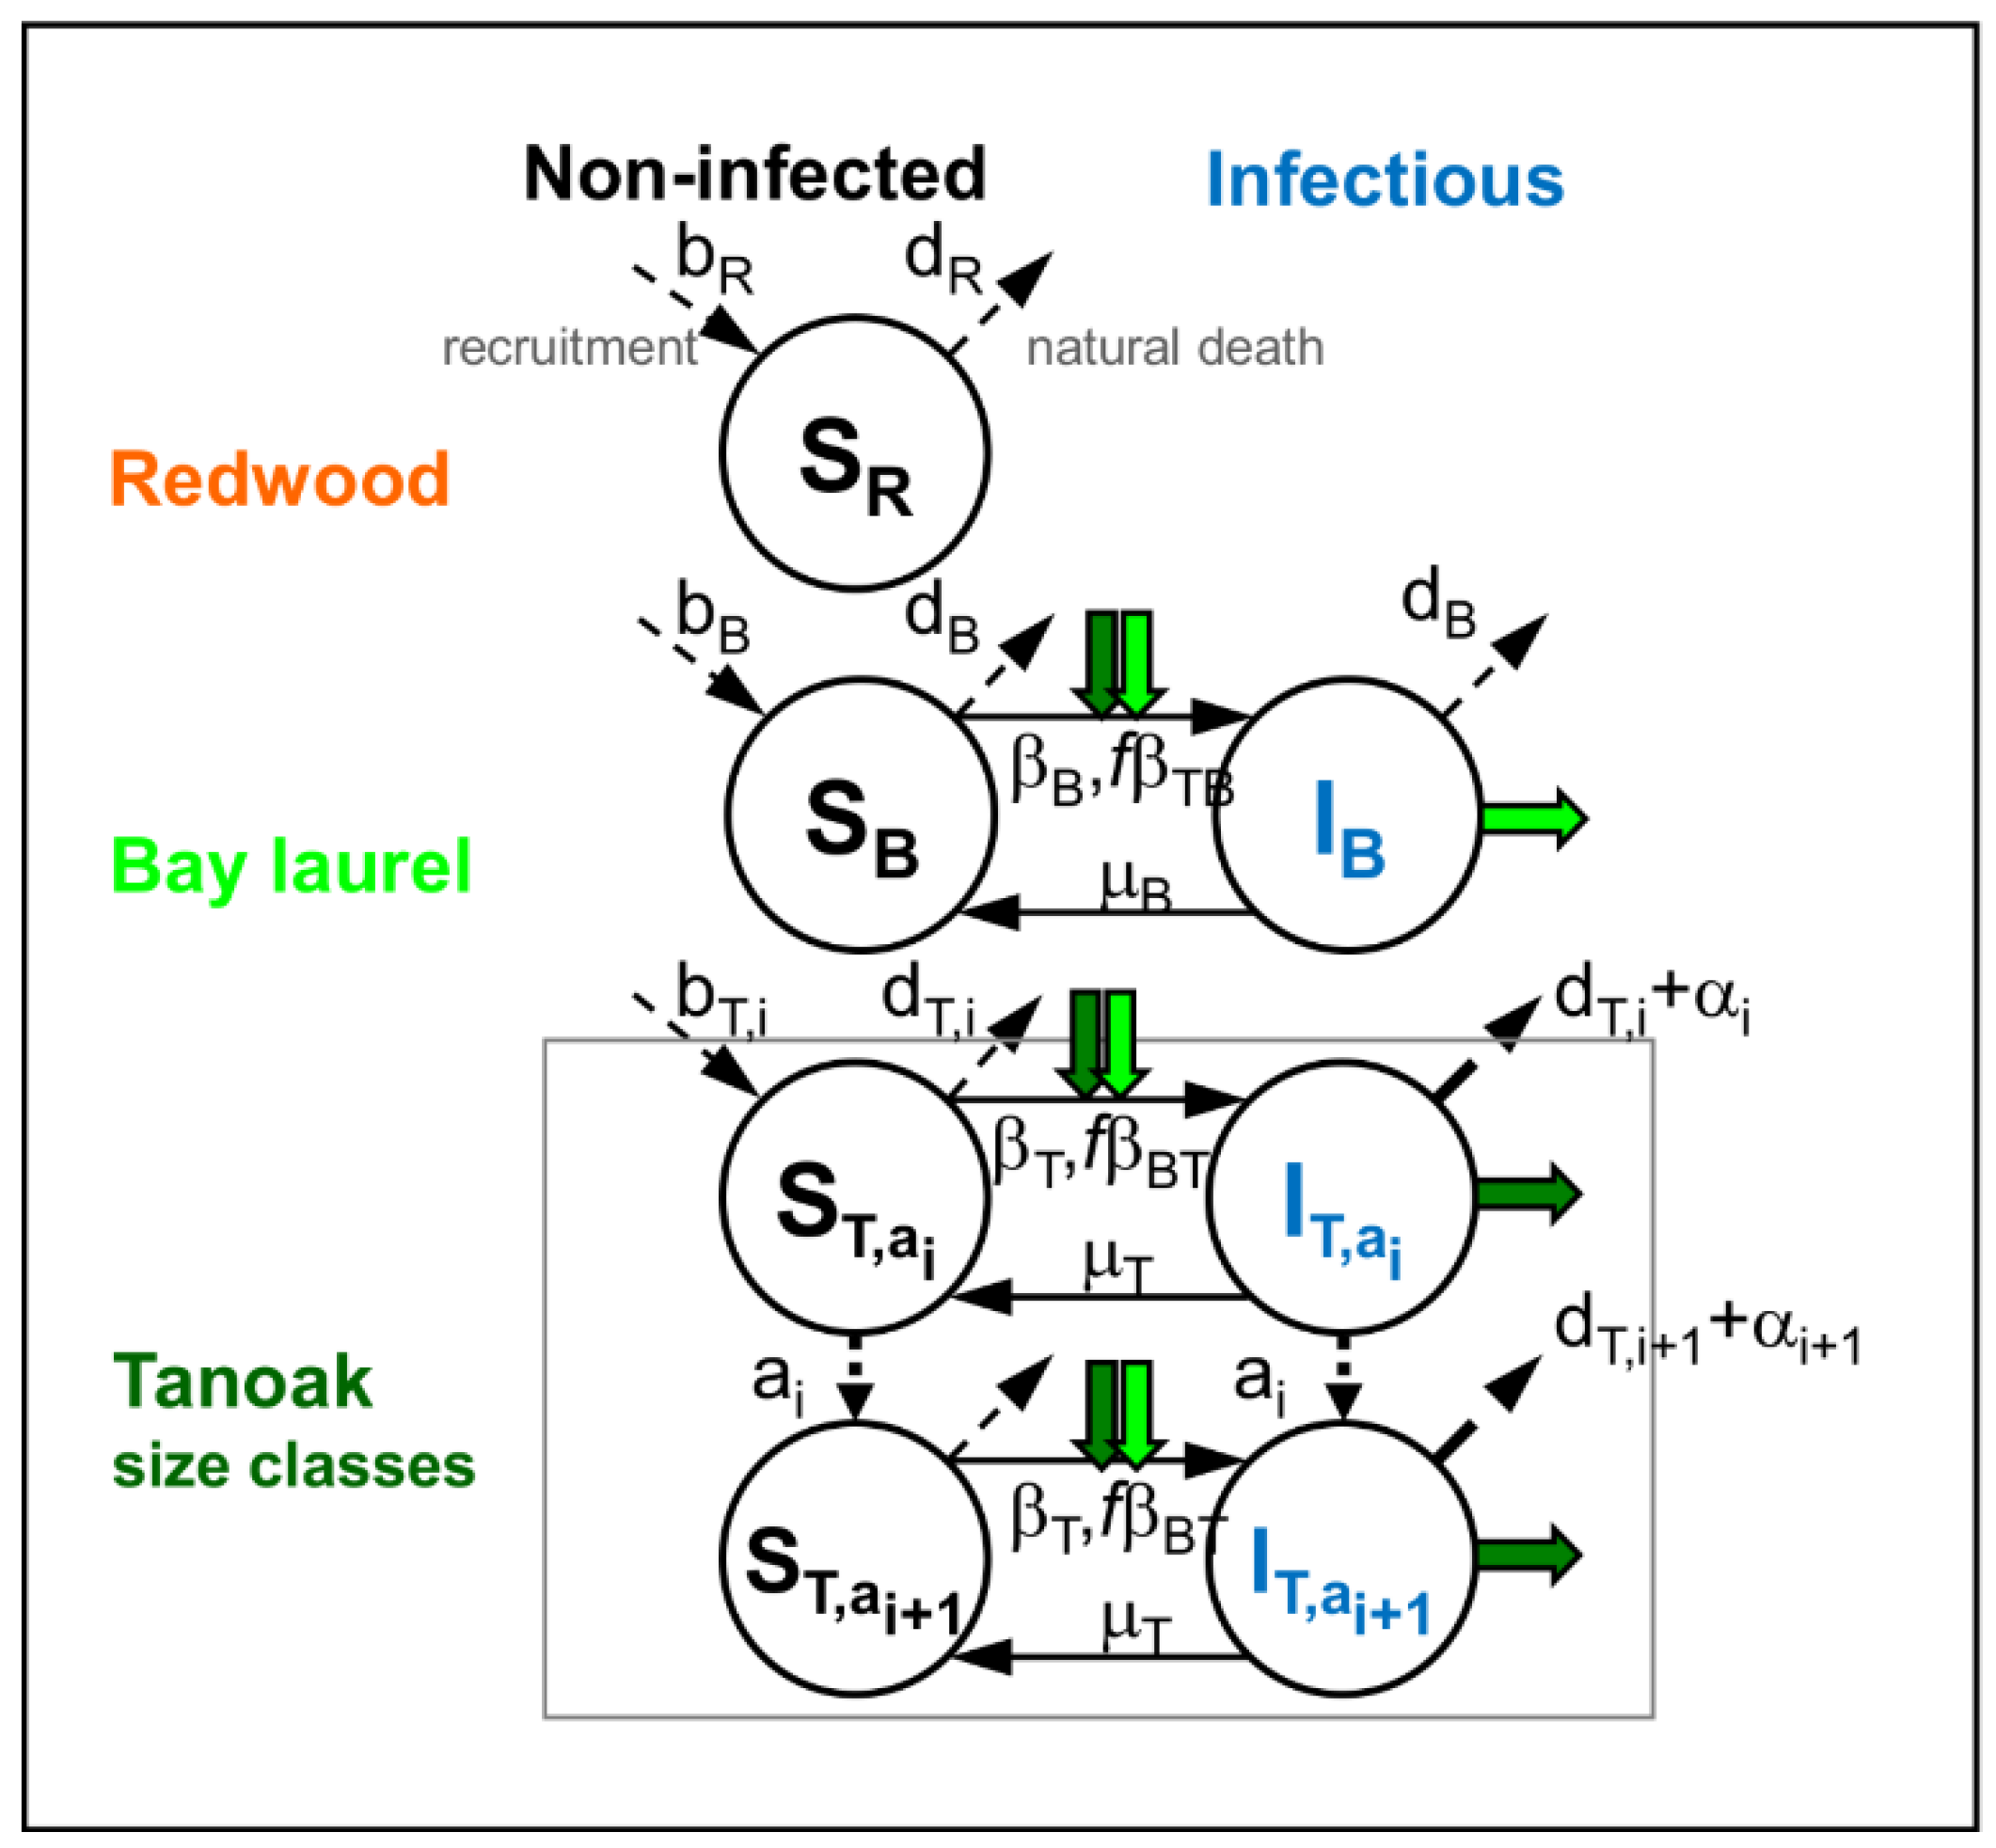
2.1. Model of Disease Impacts on the Community Dynamics with no Management (Q1a, Q2a)

We consider first a model to predict P. ramorum spread and impact on forest community composition in the absence of other disturbances such as disease management, timber harvesting, or wildfire. We use a spatially explicit community dynamics model [45] that we extend in the following section to include disease management. The model comprises three key species that embody the epidemiological and community responses of Californian coastal forests to P. ramorum disease and mortality: (1) Tanoak, which transmits and is killed by P. ramorum; (2) bay laurel, which transmits the pathogen but does not suffer health loss; and (3) “redwood”, a category dominated by S. sempervirens representing several species that are epidemiologically unimportant but which interact with the other two hosts via inter-specific competition. The model stand is a metapopulation where we track dynamic composition and pathogen level in each of 400 cells (each cell occupying 500 m2, 1/20 ha) distributed in a square lattice surrounded by host-free space (Figure 1a). The model includes natural and disease-induced mortality, recruitment via density-dependent seed establishment, and pathogen spread among hosts within and between cells [46], where we assume that rain-splash and local air currents are the principal spore dispersal processes within the canopy [22]. In addition, disease-killed tanoak develop basal sprouts and can produce new shoots. To reflect size specificity in tree susceptibility and disease-induced mortality [22], we divide the tanoak population in each cell into four size classes (1–2, 2–10, 10–30, and >30 cm diameter at breast height). This division also reflects differences in individual leaf, root, and stem biomass expected, or known to influence ecosystem function associated with tanoak [30]. However, while including the effects of tree size on disease spread, mortality, and competition leads to model results for each size class, the model results presented later aggregate all size classes and are for the whole tanoak population; this simplifies the presentation on multiple hosts and treatments while focusing on the persistence of tanoak as whole. We limit size division to tanoak due to lack of data for other host species; with the exception of redwood and Douglas fir (Pseudotsuga menziesii), the main overstory species in these forests have been poorly studied due to low timber-market value [47].
The model’s compartmental structure and dynamics within a lattice cell are summarised in Figure 1b and the corresponding equations and parameters described in Appendix A. The parameters were estimated in [45] using longitudinal observations (2002–2008) of individual trees located in a network of 205,500 m2 (1/20 ha) plots spanning the geographic range of the focal P. ramorum hosts [26,48]. We set the area of unit cell of the model to be 1/20 ha, as stated above, which matches the field plot size from which empirical data was derived. Additionally, with this unit cell size the model’s rate of spread of infection (based on the above assumptions about dispersal) matched independent field measures of the expected rate of spread [22]. By adjusting the number of cells in the model stand, we set its area to be 20 hectares, which is typical of a single-landowner stand. We model outbreaks in stands over 100 years because this time scale can supersede tree lifespan and allow for significant community change (see Q2), but the results also hold for shorter periods such 50 years.

2.2. Stand Spatial Composition before and after Disease

The model can track pathogen invasion in stands with heterogeneously distributed hosts. The snapshot in Figure 1a shows spatial epidemic spread (but not the associated species composition change) in a hypothetical 20 ha (450 × 450 m) stand with 400 cells. However, hereafter we consider scenarios where species composition and canopy structure are initially in a spatially-homogeneous dynamic-equilibrium state across the stand, but cease to be so when and where the pathogen is introduced [45], i.e., we focus on the heterogeneous spatio-temporal dynamics of pathogen spread and composition change across a stand from the point of pathogen arrival. In all scenarios, the pathogen arrives at time t = 0 on 50% of the hosts in a cell at the centre of the stand. However, while we use spatially-explicit modelling to represent local disease spread accurately [46], for convenience and brevity the results shown later are summaries for whole-stands with no explicit spatial representation. We make the assumptions above as the potential impact of pre-disease heterogeneity is not central to our assessment of disease management options. While many Californian coastal forests are neither homogeneous nor at dynamic equilibrium [49] due to harvesting or wildfire disturbance, our assumptions, and subsequent inclusion of management actions in the model, allow us to gain insights on treatment effectiveness without obscuring effects of specific pre-disease spatial heterogeneity and disturbance history. Such specificities would be arbitrary and lead to less general results on the impacts of disease management strategies. Another decisive factor is the limited availability of finely-resolved spatiotemporal data on community composition; we do, however, consider several contrasting pre-disease compositions.

Forest Composition Scenarios (Q1)

We assess the impacts of treatment against P. ramorum in three stand types representing redwood and mixed-evergreen communities in California [14,48]. Using data from non-infected communities across the redwood range [45], we estimate pre-disease composition as species prevalence (proportion of total stems) and as density (proportion of stand area occupied by each species) for three forest types, mixed, bay-laurel dominated, and tanoak-redwood. Both measures apply at stand (20 ha) and cell (1/20 ha) scales and relate via: (species density) = (species prevalence) × (average proportion of area occupied by trees), which holds under mild assumptions, and where the estimated average proportion of area occupied by trees is 76% [45]. The estimated composition by forest type is, in terms of prevalence: mixed (40% tanoak, 30% bay laurel, 30% redwood), bay-laurel dominated (30% tanoak, 50% bay laurel, 20% redwood), and tanoak-redwood (40% tanoak, 60% redwood); in terms of density: mixed (0.30 tanoak, 0.23 bay laurel, 0.23 redwood), bay-laurel dominated (0.23 tanoak, 0.38 bay laurel, 0.15 redwood), and tanoak-redwood (0.30 tanoak, 0.46 redwood). Density is the measure used in the results in Figures 3–5. As pathogen outbreak promotes spatially heterogeneous composition, a more accurate approach is to track model dynamics at the cell scale, which is equivalent to the size of the observed plots from which empirical observations were derived [45].

2.3. Model of Disease Impacts on the Community Dynamics with Management Strategies (Q1b,c, Q2b–d)

We consider the following treatments against P. ramorum: (1) removal of bay laurel, with and without application of herbicide to prevent cut-stump re-sprouting, and with or without follow-up; (2) chemical protection of tanoak, e.g., using phosphonate compounds [41]; and, (3) a combination of these treatments [44]. The removal of bay laurel reduces the density of inoculum-spreading hosts, while chemical protection reduces the susceptibility of non-infected tanoak to infection. Model scenarios involving phosphonate protection must be regarded as hypothetical as the efficacy and longevity of this treatment in the field remain to be established, particularly on large tanoak [40,41]. We aim to understand (1) the extent to which chemical protection (if proven efficacious at tree level) could help to control pathogen outbreak; and (2) whether a combination of treatments could be more effective than the individual treatments. These goals can help to set up expectations for field experiments and give insight into how much effort should be focused on these management approaches. In addition, we aim to identify optimal management strategies according to four parameters: (1) choice of treatment type (bay laurel removal, tanoak protection, or both); (2) number and frequency of treatment rounds (field applications); (3) population coverage of the treatments (proportion of hosts treated in each cell); and, (4) efficacy of treatment at tree level. Here, efficacy refers to the direct and often readily measured effect that treating one tree has on that individual, whereas effectiveness also includes the indirect effect of treatment on the community. To reflect budget and logistical constraints, we limit the amount of resources and effort that can be deployed per cell per treatment round (Figure 2). However, we allow for reallocation of resources from cells that did not reach maximum effort by re-applying treatment across the stand until resources have been exhausted. In addition, we account for delays in disease detection and treatment implementation by initiating treatments one year after pathogen arrival in the stand. See Appendix B for further details of this model of disease management, including equations and parameter values. We specify each treatment in turn.

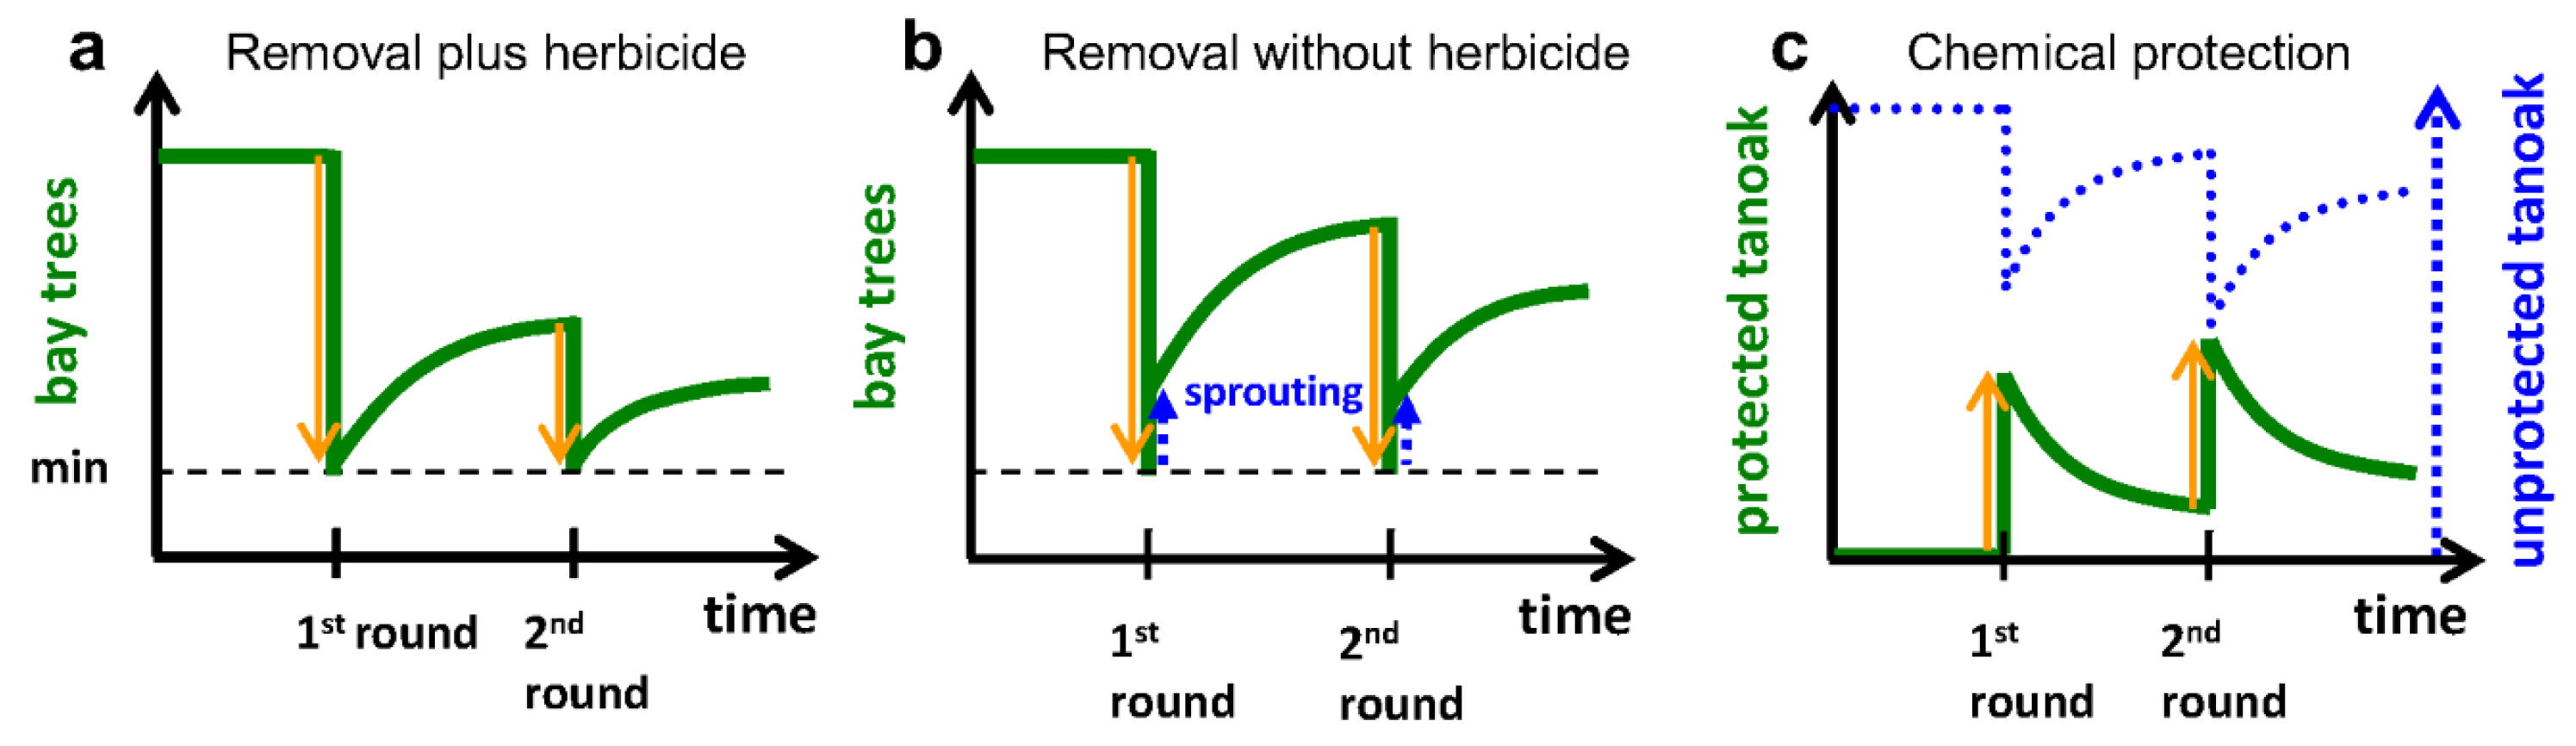
2.3.1. Removal of Bay Laurel (Q2b)

Bay laurel removal is simulated as a mechanical cutting of the tree stem. Here, we limit resource deployment by imposing a maximum coverage of removal of infected and susceptible trees per cell (Figure 2a,b). In addition, we attempt to retain biodiversity by disallowing reduction of bay laurel below a minimum density per cell (Figure 2a,b). We include two supplementary actions that may increase the effectiveness of bay laurel removal across different community compositions: (1) prevention of bay laurel basal sprouting through the application of herbicide to cut stems, and (2) follow-up treatments to remove basal sprouts and remove further bay laurel. We implement these actions in three bay laurel removal schemes:
  • Scheme (1) with no herbicide application and no follow-up (single round);
  • Scheme (2) with no herbicide application and with follow-up (two annual rounds, Figure 2b);
  • Scheme (3) with herbicide application and no follow-up (Figure 2a up to the indicated second round).
Herbicide treatment of cut stumps can be efficient in controlling sprouting in hardwood species such as tanoak [13,47]. Field trials show that herbicidal application disables sprouting on bay laurel cut stumps (and on whole trees, but subsequent tree death is slow), which suggests stump sprouting is avertable especially when herbicide is applied before sprouting [50]. The efficacy of Imazapyr has yet to be established [13,26,39], but treatment with Garlon [51] could be a suitable alternative. To explore the potential of joint stem removal and stump herbicidal treatment of bay laurel, we consider a hypothetical herbicide efficient in preventing bay laurel stump sprouting when applied promptly after stem cutting (Appendix B).

2.3.2. Chemical Protection of Tanoak (Q2c)

In our model, and increasingly in the field, protection of non-infected tanoak is implemented through tree-level application of chemical compounds. Phosphonate in the form of phosphate or phosphite compounds, for example in Agri-fos®, have been shown to be promising chemical treatments for Phytophthora-caused diseases. For sudden oak death, these treatments can reduce the susceptibility of individual non-infected tanoak to P. ramorum, when mixed with a surfactant and spayed topically on the bark or injected directly into the bole [39,41,42]. However, the level and duration of the effect in the field is not fully established resulting in problematic uncertainty in terms of the possible benefits. To increase the realism of our modelling experiments, we limit resource deployment by imposing a maximum density of tanoak trees that can be protected per cell per treatment round (Figure 2c). We represent the status of treated tanoak individuals via an additional compartment in which there is partial and waning protection against infection determined by assumed efficacy and longevity of treatment [44]. We avoid overoptimistic prediction of the model in two ways. First, tanoak trees are randomly selected for treatment, mimicking realistic scenarios where cryptically infected trees are selected for protective treatment that will not be effective. Second, the dynamic and declining level of protection after chemical application limits the impact of this treatment and mimics its observed variability [41]. This approach enhances realism by inducing a net coverage that is lower than the coverage of utilisation of the available resources across the individual tress.

2.3.3. Combination of Treatments (Q2d)

Both removal of bay laurel and chemical protection of tanoak are applied across the stand in the model. In this case, the number and frequency of treatments are as in the individual treatments but applied in conjunction (Appendix B).

2.3.4. Management Parameters (Q2b–d)

Each strategy is determined by the treatment type (removal of bay laurel, protection of tanoak, or combination) and implementation parameters (coverage, frequency, and efficacy). We used default values for these parameters (Appendix B: Table A2). Namely, for bay laurel removal: 70% population coverage, and a single round with herbicide or two herbicide-free rounds with a five-year gap. For chemical protection: 80% population coverage, 70% efficacy, and follow-up every two years. We also run the model for a wider range of coverage and efficacy values to gain a deeper understanding of how this uncertainty ultimately affects the success of management.

2.4. Management Evaluation

We assessed and compared the impacts of different management strategies by measuring two quantities: half-life of the tanoak population and tanoak density after a time lag. Half-life is the length of time after which the population declines to half of its size since pathogen invasion. Density after a time lag is the average density of the tanoak population across the stand 20 years after the start of pathogen invasion, which in our study is 19 years after the start of any treatments. To compare either of these quantities among management strategies, we applied a rescaling algorithm that produces unit-free quantities. Specifically, let S be a set of management strategies that differ with respect to two implementation parameters a and b that have possible values A = {ai, i = 1 … n} and B = {bi, i = 1 … m}; and let Sab be a given strategy in S. We define the relative half-life Tab associated with Sab through the rescaling
T ¯ a , b =   T a , b min   j B ( T a , j ) Δ T
Δ T = max   i A , j B ( T i , j ) min   i A , j B ( T i , j )
where the denominator ΔT is the range of values of T across the strategies in S. The numerator is such that the rescaled value is between 0 and 1 (i.e., when the half-life Tab is minimum and maximum, respectively). For example, consider strategies for implementation of chemical protection that have different coverage levels aA. For each strategy, we also consider scenarios where the protection efficacy takes values bA. Then, for each coverage and efficacy, we measure T in relation to its minimum across all protection efficacies, and rescale it by the range of T in the coverage and efficacy settings. We define relative tanoak density after a time lag similarly. Our method allows a comparison of management strategies that offers quantitative insight (relative magnitude and ranking), but avoids direct presentation of absolute values. Absolute quantities are part of the model output, but we caution that their values depend on the detail of the model assumptions and system-specific parameters. Rather, our comparison of strategies provides a set of testable expectations with some potential generality.

3. Results

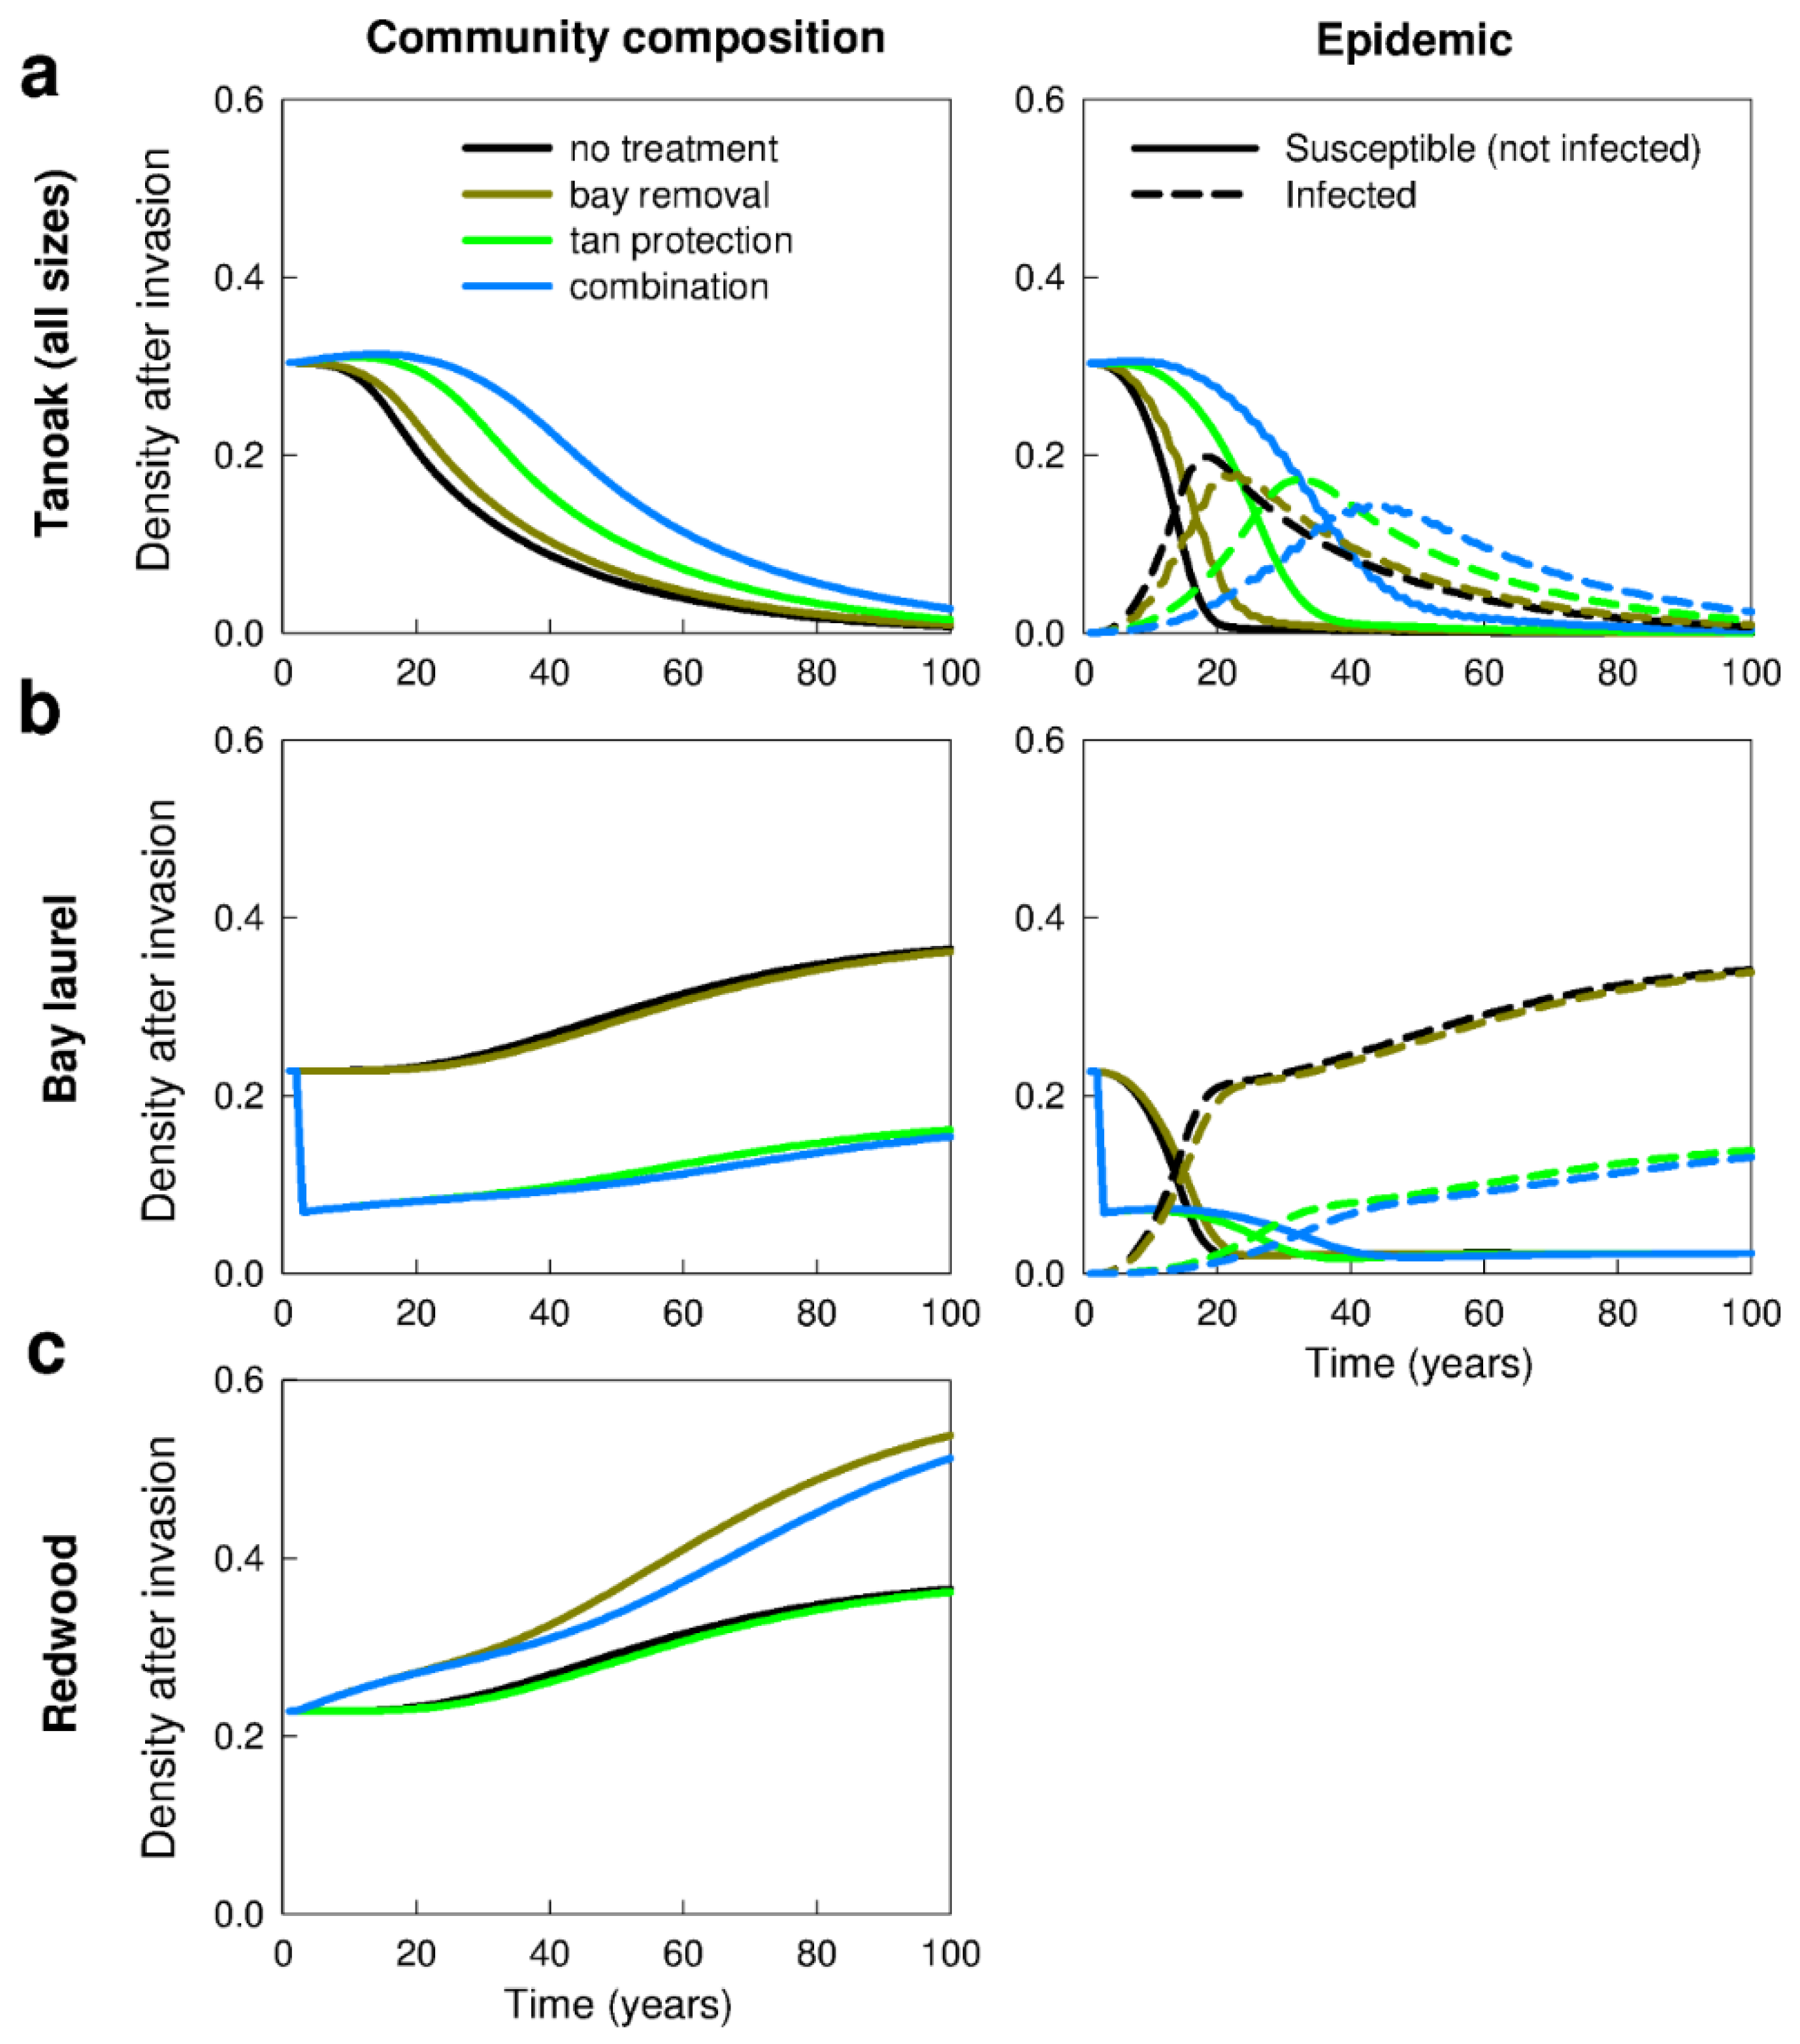
3.1. No Management—Disease Impacts and the Effect of Forest Composition (Q1a,b, Q2a)

In the absence of management, P. ramorum has the potential to spread through the model stand and cause decline and near elimination in the tanoak population (Figure 3 and Figure 4a) (Q2a). Pathogen invasion resulted in an outbreak for all stand compositions except those with very low tanoak and bay laurel densities (Q1a). For example, in forest stands without bay laurel there is a threshold tanoak density (proportion of stand area occupied by tanoak), ~0.15, below which incoming inoculum does not cause pathogen outbreak (Figure 3a). In forests with very low bay laurel prevalence (1.5%) this threshold is reduced (Figure 3b), and at higher bay laurel density the threshold is lost as bay laurel can sustain an epidemic. The existence of this threshold behaviour opens the possibility of preventing outbreak occurrence through modification of the host composition of the stand (Q1b).
In stands where outbreaks occur, disease leads to large tanoak losses, but the transient dynamics differ markedly among forest types (Q1a). In forests without bay laurel, the tanoak population decline is smaller and much slower; here, tanoak can sustain epidemics without being eliminated after 100 years (Figure 3a and Figure 4c). As the density of bay laurel increases, the pace of tanoak loss increases (Figure 4a). Moreover, soon after pathogen introduction, tanoak density decreases slowly because disease-induced mortality is counterbalanced by re-sprouting; but subsequently it decreases more rapidly as bay laurel and redwood colonize former tanoak habitat (Figure 4a,b).

3.2. Management Strategies—Effects on Disease Impacts (Q2b–d)

According to our model, in mixed-forest stands invaded by P. ramorum the disease management strategies had significant beneficial impacts on tanoak population size and longevity (Figure 5) (Q2). Additionally, the treatments influenced community composition directly, by reducing the bay laurel population, and indirectly, through subsequent increase in redwood recruitment. There is a clear ranking of the strategies in their effectiveness to reduce disease and retain tanoak, with the combination of treatments (tanoak protection and bay laurel removal) performing substantially better than the single-treatment strategies in the short and long terms (Figure 5a) (Q2b–d). For example, after 30 years, the tanoak population dropped by 1%, 10%, 50%, and 55% with combined treatments (Q2d), tanoak protection (Q2c), bay laurel removal (Q2b), and no treatment (Q2a), respectively. These results are illustrative; we extend below to a wider range of stand compositions and treatment parameters.

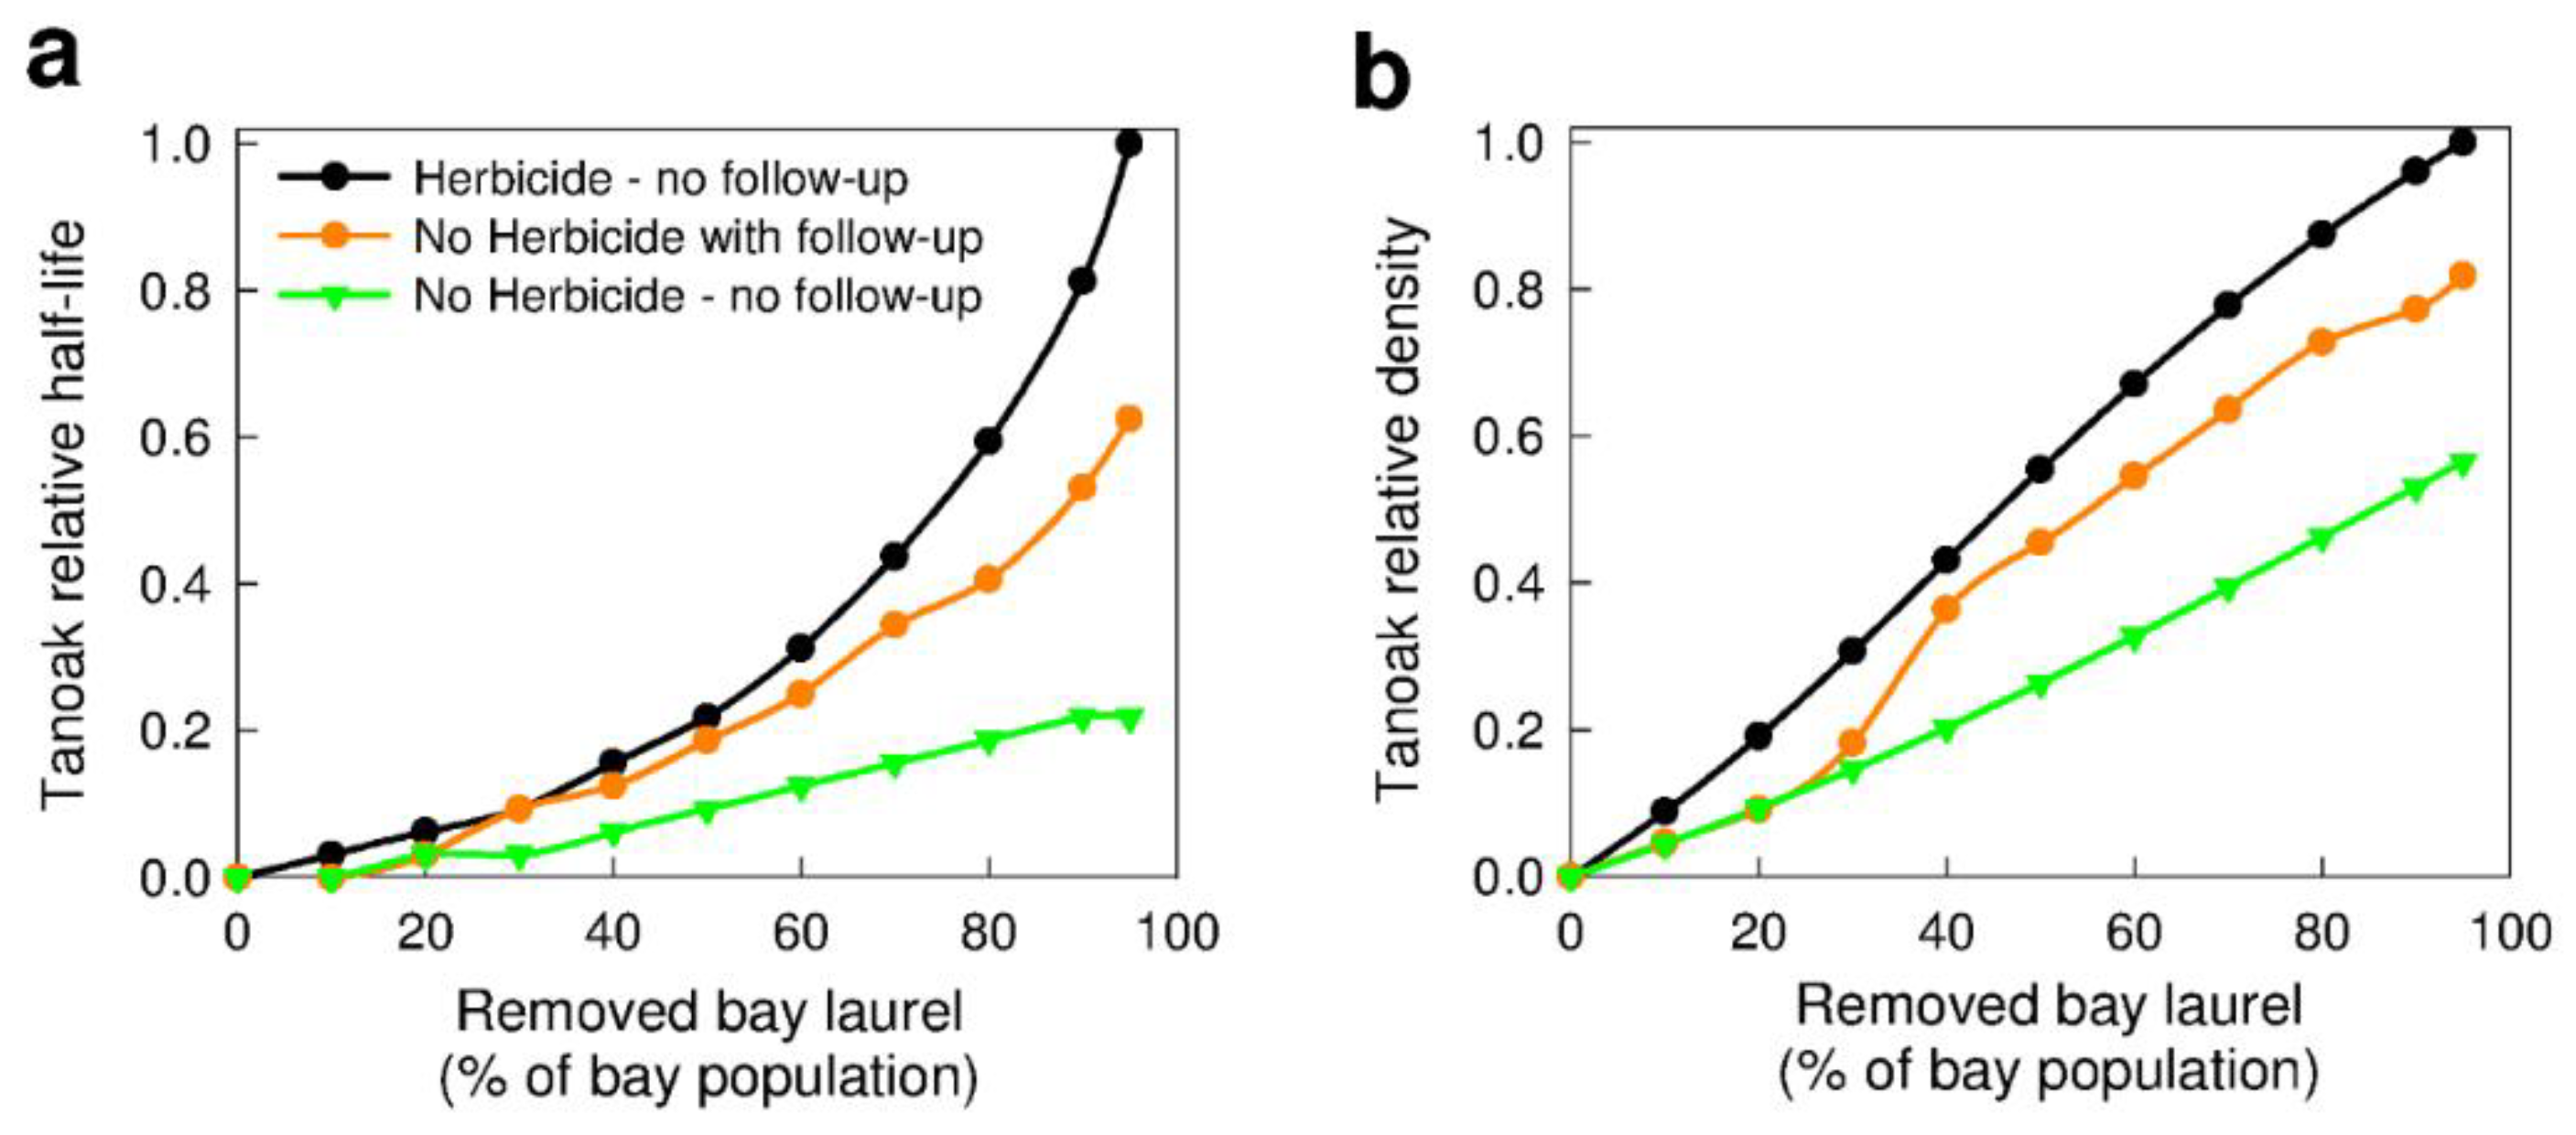
3.2.1. Removal of Bay Laurel (Q2b)

The removal of bay laurel delays epidemic progress and disease-caused decline of the tanoak population in the model, but only very slightly (Figure 5a). Two supplementary actions were tested that may increase the effectiveness of this treatment across different community compositions: the application of herbicide to prevent bay laurel basal sprouting, and follow-up mechanical removal of basal sprouts and further bay laurel. These actions were implemented through Schemes 1–3 (see Section 2.3.1).
In treatments without follow-up (Figure 6a,b), both measures of durability of the tanoak population (half-life, and stand-averaged density 20 years after pathogen invasion) show that application of an efficacious herbicide (Scheme 3) increases the durability of tanoak by 200% to 500% compared with solely cutting of bay laurel stems (Scheme 1), when the removal coverage is ≥50%. The magnitude of this benefit is greater when measured in terms of half-life and increases non-linearly with the removal coverage (Figure 6a). This outcome suggests there is a disproportionate advantage in investing resources to increase coverage of bay laurel removal when supplemented with herbicide application. Our other measure of tanoak durability indicates the benefit of using herbicide increases linearly with the level of coverage (Figure 6b). This measure assesses the tanoak population at a given time. However, as the rate of tanoak decline varies over time (e.g., accelerates in the first decades of pathogen invasion, Figure 4a,b) and we wish to capture the state of tanoak in the short and long terms; hereafter, we focus attention on the half-life measure.
Treatments with follow-up but with no herbicide application (Scheme 2, two rounds of mechanical removal, Figure 6a) also increase the benefit of bay laurel removal in relation to one sole removal (Scheme 1). The extra benefit of follow-up increases with the level of coverage; however, the relative magnitude of this increase is only half of that obtained with mechanical removal and herbicide application but without follow-up (Scheme 3). Even with the supplement of herbicide application or follow-up treatments to the bay laurel removal, the model still predicts substantial decline and even extinction of the tanoak population in the very long term (Figure 4a–c), suggesting that bay laurel removal treatments alone are inadequate for long-term tanoak conservation (Q2b).

3.2.2. Forest Composition—Effects on Removal of Bay Laurel (Q1c)

With either of the actions supplemented to the bay laurel removal treatment, we obtained very similar results when we considered a mixed forest with a tanoak-to-redwood ratio of 30%:40% rather than 40%:30% (results not shown; a 1/7 shift in relative compositions), suggesting there is a level of robustness in the model results over a range of host community compositions.

3.2.3. Chemical Protection of Tanoak (Q1b, Q2c)

Our earlier results suggest that in unmanaged forest stands with bay laurel (Figure 4a,b) tanoak declines rapidly upon P. ramorum invasion and is eliminated in the long term. However, the model also suggests P. ramorum invasion of the tanoak population is restrained or even precluded in stands with low density of bay laurel (Figure 3b and Figure 4c) provided that the density of susceptible tanoak is below a threshold. Therefore, if deployment of an efficacious chemical protection of tanoak trees were possible, it would have a similar epidemiological role to that of a vaccination [52] and thus would also protect untreated tanoak in communities with little or no bay laurel (Q1b).
In the model, chemical protection of tanoak every two years in stands without bay laurel increases the tanoak population durability substantially and non-linearly with the level of treatment coverage (Figure 7a) (Q2c). If the chemical protectant had high efficacy (≥50%) the model suggests it would be beneficial to invest resources to reach a protection coverage > 50%, depending on the cost of individual chemical applications. However, if the protectant efficacy were low (<50%) the benefit of treatment would also be low and would not increase much with coverage. Laboratory tests suggest the efficacy of phophonate protection on branch cuttings is >50% [41]; if a similar protection level were possible for whole trees, treatment at any level of coverage >50% could, according to the model, conserve uninfected tanoak against P. ramorum invasion in stands without bay laurel.
The frequency of follow-up treatment is another determinant of the effectiveness of chemical protection of tanoak. Exploration of the model indicates that if treatments were interrupted or applied less frequently the epidemic would re-emerge; in particular, the tanoak population half-life would decrease substantially (results not shown) if the frequency of follow-up were reduced below once every two years, the frequency assumed here. These model outcomes follow from our assumption that protected tanoak trees lose protection over time and can eventually become infected. Since it is unknown how long phosphonate protectants remain efficacious once applied, we assumed a conservative average of 1 year protection (Appendix B); but empirical values could be used once known, and if protection were more durable the estimated benefits would be magnified.

3.2.4. Forest Composition—Effects on Chemical Protection of Tanoak (Q1c)

The initial stand composition is a further limiting factor of the effectiveness of protection to increase the durability of tanoak populations. In stands with 20% bay laurel, any level of coverage of chemical protection yields negligible durability of tanoak upon pathogen invasion (Figure 7b), e.g., 10–30 times smaller than in stands without bay laurel. In fact, the gain in durability of tanoak resulting from this treatment decreases sharply when bay laurel prevalence in the stand is above 10% (density 0.08) prior to pathogen invasion (Figure 8).

3.2.5. Combination of Treatments (Q2d)

The previous results indicated that the potential management of P. ramorum invasion using tanoak chemical protection would only be effective in retaining tanoak in a narrow range of communities with zero to low density of bay laurel (Figure 7b and Figure 8). In addition, earlier results indicated that, in stand communities with abundant bay laurel, the removal of bay laurel would only delay moderately the decline of tanoak populations amid P. ramorum invasion (Figure 4b). Such modest benefits follow from the incomplete coverage of bay laurel removal and the limited duration of tanoak chemical protection, both of which permit subsequent infection of tanoak. However, applying the two treatment strategies in conjunction in mixed-forest stands increases the tanoak population half-life considerably more than applying each treatment alone (Figure 5a) (Q2d). The extra benefit of adding tanoak protection is low at moderate levels of bay laurel removal, but increases at a rising pace as this level of coverage increases (Figure 9a). The model suggests, therefore, that the maximum gain in a combination strategy results from providing the largest possible coverage of bay laurel removal. For example, in a population where 40% tanoak have been treated with chemical protectant (middle curve in Figure 9a), the relative half-life of tanoak increases fivefold (from 0.15 to 0.75) as the coverage of bay laurel removal increases from 50% to 95%. Conversely, the extra gain from removing bay laurel increases sharply with the addition of tanoak protection. For example, with 95% coverage of bay laurel removal, protecting 80% of the tanoak population doubles its half-life in relation to bay laurel removal without tanoak protection (Figure 9a). Our results further indicate that, in addition to the above benefits, there can be a synergistic return in combination strategies: the tanoak durability gained by applying treatments in combination is greater than the sum of the durability gains from applying each treatment alone (Figure 9b).

4. Discussion

We have developed a mathematical modelling approach to assess the effectiveness of current and proposed management strategies for stand-scale (1–20 ha) conservation of tanoak threatened by P. ramorum in coastal California. We used the model to formalise the current knowledge of the tanoak-P. ramorum system and its treatments and to address the specific questions relevant to disease management set out in full the Introduction. Essentially, the questions were:
Q1: Forest composition: (a) How does it affect pathogen spread without management? (b) Can it be modified to prevent or ameliorate disease outbreaks? (c) How does it affect the effectiveness of management strategies?
Q2: Management strategies: What are the short and long-term disease impacts with: (a) no management; (b) removal of bay laurel to reduce pathogen spread, with and without herbicide application to prevent stump resprouting, and with and without follow-up removals; (c) preventive chemical protection of tanoak; and (d) a combination of treatments b and c.
We discuss our findings below and make recommendations on which actions may be more effective and which field techniques and data are lacking to demonstrate them.

4.1. Forest Composition—Influence on Disease Impacts and Selection of Management Strategies (Q1a–c)

The model supports the expectations that disease impacts (Q1a) and the success of disease management to retain tanoak (Q1c) depend on the forest composition prior to pathogen invasion. The gains in durability of the tanoak population conferred by tanoak protection or bay laurel removal declined rapidly across scenarios of increasing bay-laurel prevalence in the stand before disease (Q1c). This outcome, and others showing modification of tanoak size distribution (results not shown), agree with empirical evidence that bay laurel is a key driver of tanoak disease and decline in unmanaged stands [14,26,48,53] (Q1a). Therefore, deciding how to treat a stand depends on its composition and on the main management goal, i.e., to retain tanoak within the stand or to prevent pathogen spread to tanoak in nearby stands (Figure 10).
In stands with bay laurel prevalence > 10% (density > 0.08), the model indicates that long-term retention of tanoak via chemical protection is not feasible. In stands with zero-to-low prevalence of bay laurel, the onset of pathogen outbreaks depends on whether the initial abundance of tanoak exceeds a threshold (Q1a). Manipulation of tanoak density via vegetation thinning or chemical protection (which act epidemiologically like a vaccine) reduced this threshold and thus the risk of disease outbreak in the model stand (Q1b). Threshold epidemic behaviour, where unprotected hosts may remain uninfected, is expected for transmissible pathogens through a process of ‘herd immunity’ [52]. Our threshold values are only illustrative as they are sensitive to the accuracy of the model and of the treatment parameters. Further field experimentation or analysis of field monitoring data are needed to quantify the efficacy and duration of the host-manipulation treatments and to demonstrate the threshold behaviour associated with stand composition and level of treatment coverage.

4.2. Management Strategies—Effects on Disease Impacts (Q2a,d)

The model results indicate that invasion of P. ramorum can lead to rapid and long-term decline in tanoak stand populations in the absence of management (Q2a). The results also indicate that the combination of curative and preventive treatments—i.e., removal of bay laurel to reduce inoculum and application of chemical protection of tanoak—is the most effective strategy to increase tanoak resilience to P. ramorum (Q2b–d). Moreover, according to the model, the benefit of combined treatments can be synergistic (greater than the sum of benefits from separate treatments). Additionally, this strategy is effective across a broader range of forest composition than those of the separate treatments whose benefits are maximised at contrasting ends of the composition spectrum. This strategy had a consistent advantage across model stands of differing tanoak density, and this was greatest in stands with low bay laurel density, where chemical protection is most effective.
There are limitations to the combination strategy and to the separate treatments. Firstly, the strategies are unlikely to succeed in retaining tanoak in stands with abundant bay laurel or already extensively invaded by P. ramorum. Where bay laurel density is higher, tree removal is critical to managing inoculum (Q2b) and deploying chemical protection resources would be a waste (Q2c,d). Moreover, the impact of removal on an abundant bay laurel population would only be justified where the aim were to prevent pathogen spread to nearby stands. Bay laurel, like tanoak, is part of the regional biodiversity and a valued cultural resource, although it does not currently face the same level of challenges as tanoak. Secondly, in comparison with vegetation removal or thinning, chemical protection of tanoak with Agri-fos® incurs considerably greater economic costs [43] and social and legal constraints to its implementation [38] (Q2c,d). While this and similar chemicals can be efficacious in preventing infection or disease from a range of Phytophthora [54], much remains unclear about their mode of action, interaction with the host genotype, and overall efficacy. A cost-effective coverage of chemical protection within stands is likely to be restricted by individual variation in treatment efficacy and variation in treatment costs. Moreover, as with vaccines, phosphonate protection of individual tanoak requires application prior to infection [24,55]. The community benefit (‘herd-immunity’) from protecting non-infected trees only occurs where at most a few trees are already infected, and not where high levels of inoculum are already present in tanoak or in bay laurel.
The management strategies are more likely to succeed in retaining tanoak in stands with little or no bay laurel (Q1c). However, in the less favourable conditions, resources may be prioritised or the benefits of a combined strategy or of a separate treatment may outweigh their costs. This will be the case where a management strategy is effective in retaining tanoak and the central goal is to protect tanoak for its ecological functions and cultural value; for example, in high-value at-risk stands [14,30,53], or where it is important to contain pathogen spreading to nearby forest areas [44]. In stands where chemical protection is not an option and bay laurel is present, the effectiveness of mechanical removal of bay laurel (Q2b) in preserving tanoak can be improved by suppressing bay laurel regeneration. The model indicates a large improvement is possible through supplementary herbicide application to prevent basal resprouting. However, while there are effective herbicidal suppressants of sprouting for tanoak [47], this is not yet proven for bay laurel despite encouraging early trials [50]. Moreover, herbicide treatments are not permitted on many tribal lands and state lands [39]. Where herbicide use is not an option, the model indicates that follow-up removal of stump sprouts (e.g., two annual rounds) is the next-most effective bay laurel removal approach for preserving tanoak. We summarise the prioritisation of all the above management options in Figure 10.

Factors Limiting the Effectiveness of Management

Several factors influence the effectiveness of strategies for the short and long-term conservation of tanoak in the model stands, including the initial stand composition (Q1), the efficacy of chemical treatments to prevent regeneration (Q2b) or to protect tanoak (Q2c,d), and the frequency of follow-up treatments (Q2b,c). Long-term protection of tanoak stands is likely to require a long-term commitment to vegetation management and phosphonate application; similar requirements were predicted for disease management at landscape scale [44]. Early action is also decisive to the effectiveness of management against pathogen outbreak as asymptomatic spread can cause pathogen populations to reach uncontrollable levels [44,56,57,58]. In our model, the success of treatments relied on relatively-early action, by assuming that a level of monitoring of the stand is in place that prompts intervention one year after pathogen invasion. Another key factor is the deployment of an adequate level of population coverage by curative or preventive treatments (partial resource allocation and landowner compliance). The minimum level of coverage required will depend on several of the above factors, including variation in treatment efficacy and duration across individual hosts, earliness with respect to the outbreak, and amount and type of resources available. In practice, it may be difficult to comply with a set level of coverage, and even more difficult to know the minimum level of coverage required for a given stand.
Our results indicate that there is a disproportionate increase in the benefits of management actions at high levels of coverage in the cases of removal of bay laurel with herbicide application (Q2b), chemical protection of tanoak (with efficacy >50%) (Q2c), and combination of treatments (Q2d). An adequate level of coverage has trade-offs with several of the factors above. It is vital, therefore, to collect data on efficacy and duration of treatments at individual level; on current pathogen prevalence in the stand; on stand vegetation composition and distribution; and on effectiveness of past trials. Lacking empirical data on treatment efficacy, a model sensitivity analysis may suggest which coverage levels are associated with acceptable management outcomes.

4.3. Model Assumptions and Extension

The model parameter values are based on empirical data from forest plots [26,45] that we assumed are representative of broad at-risk forest communities. We complemented these data by carrying out sensitivity analysis of model predictions to changes in the parameters characterising treatment strategies. Furthermore, the model is deterministic in two senses. First, all events in the stand (i.e., pathogen spread, vegetation dynamics, and treatment applications) were determined by parameters without an element of chance due to unknown factors [46]. Second, the stand cells are a first approximation to a spatial distribution and are not resolved enough to represent individual trees. A similar approach without management treatments was used in [45]. A stochastic implementation of the model could in theory lead to a better estimation of uncertainty in the temporal trends than a sensitivity analysis; it is also appropriate when pathogen or host prevalence are low enough that an outbreak may fail by chance. However, such implementation would require additional data and assumptions, and, given the complex model structure (Figure 1b) it would only be viable for some model components; this, and ignorance of the treatment parameters implies that a realistic estimation of uncertainty is unfeasible. In addition, interpretation of model output would be more technical. Therefore, a deterministic approach tracking trends in population change seems adequate for gaining and communicating first insight.
We have treated stands as disconnected forest parcels. While the pathogen spatial spread within the model stand mimics the below-canopy splash and aerial spore dispersal observed in detailed field studies [22], we have assumed that the import of external inoculum via long-distance aerial or human-mediated dispersal is sporadic [59] and would only trigger the initial outbreak. We have done so for two reasons. Firstly, this assumption aimed at simplifying the management strategies, as the intensity and temporal-variation of external inoculum will vary with stand location and conditions. In the case of high pathogen prevalence and host contiguity in the landscape [58,60], increased intensity of treatment could compensate for extra inoculum pressure from non-treated stands. Conversely, inoculum-reduction actions in the landscape could raise the effectiveness of stand treatments [44]. Secondly, the simplifying assumption on external inoculum also aimed at facilitating an understanding of the feedback between disease dynamics and community composition dynamics within a stand, which would be more complex if external as well as internal inoculum were involved. In fact, sudden oak death outbreaks are overwhelmingly sustained by inoculum produced within the stand (although triggered externally), which contrasts with outbreaks sustained by continuous import of inoculum where disease progression in the stand would be easier to understand by not relying on the production of inoculum by variable local vegetation. This feedback between disease and local community is often not included explicitly in dynamic landscape-scale disease models for short-term prediction, which treat communities as static to simplify computation [58,60], and in forest-community models for long-term prediction, which often treat communities as dynamic and disease as static (established). However, it is essential to include both dynamic layers in models of disease management for conservation. The reason is that the time-scales of disease, community dynamics, and treatments are close enough compared with the observation period for significant feedback to occur between them; that is also the case of prey-predator systems, where in general the dynamics of both variables need to be considered. A key next stage in modelling the management of sudden oak death and other forest diseases [2,24,61] is to include in this feedback-modelling approach epidemiological pathways between stands extending to situations where the epidemic landscape contributes to sustaining with-stand outbreak.
While the model suggests that further field trials on phosphonate protection efficacy would inform stand-level disease management [41], there are some suggestions that recently introduced P. ramorum lineages could develop tolerance to this treatment [62]. Our assumption of transitory chemical protection (1 year), led inevitably to a requirement of long-term follow-up treatments in the model (at two year frequency); a commitment that seems unfeasible except in the most highly managed areas such as arboretums or for important individual trees. However, both the management horizons estimated by the model and inferred from the field are in the order of decades [30,47]. A broader interpretation of the stand management strategies with or without chemical control is that the approach could buy time to develop and assess new prevention and management tools to increase tanoak resilience to P. ramorum [24,30,39,63,64], including the deployment of resistant tanoak varieties [25,65,66,67].

4.4. Experimental Testing and Extension to Other Systems

Limitations to testing and monitoring of forest disease management at significant spatial and temporal scales make mathematical modelling a useful resource to design and screen potential treatments ahead of field trials. By incorporating management and conservation options in a parameterised model of P. ramorum spread and forest-community dynamics at stand scale, we have generated a set of expectations on the community-level effects of these options, including the principle of combined disease prevention and therapy. These expectations are testable against field experiments and highlight influential parameter uncertainties, and, therefore, offer insights that could inform future research and practice of tree disease management and conservation. Our results are aimed at informing the management of P. ramorum in the Western USA, but could be leveraged to inform affected or at-risk areas in Western Europe and Eastern USA, and chemical protection strategies for other emerging Phytophthora worldwide [19,24,40,54]. Of course, an extension of this modelling effort, or similar de novo efforts require a careful examination of assumptions, and likely changes to those dictating dispersal, efficacy, and species-level infection and mortality dynamics.

5. Conclusions

Most mathematical models of pathogen or pest invasion predict either organismal invasion on a stationary host landscape or changes in a host landscape under a stationary invasive-organism population. We have used a new mathematical model that merges both population dynamics dimensions through a feedback between disease dynamics and forest-community dynamics. The application of the model to the spread of P. ramorum in forest-stand communities suggests that the goal of ameliorating P. ramorum impacts on tanoak in costal California could be accomplished through a combined application of potential chemical protectants and stand management. The results of the model indicate a range of alternative disease preventive and curative management strategies that could hold promise to achieve this goal, although the time-scales of the dynamics involved would require continued evaluation in long-term experiments and a better understanding of the interactions of host genetics with chemical protection. In the field, under specific stand community conditions, it is increasingly clear that approaches involving local reduction of P. ramorum inoculum and efficacious chemical protectants can achieve medium- to long-term conservation of tanoak.

Author Contributions

Conceptualization, J.A.N.F. and R.C.C.; Methodology, analysis and data curation, J.A.N.F. and M.S.; Software, M.S.; Investigation and validation, J.A.N.F., R.C.C., M.S., and C.A.G.; Resources, R.C.C. and C.A.G.; Funding acquisition, J.A.N.F., R.C.C., and C.A.G.; Writing—original draft preparation, J.A.N.F.; Writing—review and editing, J.A.N.F., R.C.C., M.S., and C.A.G.

Funding

This research received financial support from a USDA Forest Service Pacific Southwest Research Station competitive grant, DEFRA, NSF (through grant DEB EF-0622770 of the NSF-NIH Ecology of Infectious Disease program), the Agricultural Research Institute (ARI) of the California State University system, and the USDA National Institute of Food and Agriculture McIntire-Stennis program. M.S. received support from ENS.

Acknowledgments

We thank David Rizzo for helpful discussions and three anonymous reviewers for constructive comments on the original manuscript.

Conflicts of Interest

The authors declare no conflict of interest. The funders had no role in the design of the study; in the collection, analyses, or interpretation of data; in the writing of the manuscript, or in the decision to publish the results.

Appendix A. Model of the Unmanaged Community Dynamics

The equations governing the dynamics of the forest stand model under “natural” conditions (i.e., unmanaged) are presented elsewhere [45] together with the model parameters (many of which were estimated from field observations). The model is deterministic (see explanation in the Discussion) and the state variables vary across cells while the parameters are invariant. Most parameters are constant over time, but some vary over time. Here we summarise the model compartmental structure and dynamics (Figure 1b, and Figure A1 with parameter notation included) and reproduce the parameter values (Table A1).
Figure A1. Compartmental model of the unmanaged dynamics of P. ramorum in a forest stand. The epidemic is represented by susceptible (non-infected) (S) and infectious (I), and the species populations by redwood (R) and bay laurel (B) average-size and tanoak (T) canopy-size-class compartments in each cell i within the stand metapopulation. Transition dynamics: infection and recovery (full dark arrows), recruitment (broken, inward arrows), death (broken, outward arrows, thicker for disease-augmented mortality), ageing of tanoak (dotted arrows), contribution to infection rate (thick arrows). See Table A1. Similar to Figure 1a but with parameter notation.
Forests 10 01103 g0a1
Table A1. Parameters of the model of the unmanaged community dynamics, including pathogen-free species dynamics and P. ramorum infection dynamics [45].
ParameterMeaningUnitValues
Birth Rates
bTTanoak birth rateYear−10.0164
bBBay laurel birth rateYear−10.0833
bRRedwood birth rateYear−10.0833
Death Rates
dT,iTanoak death rate in size class i = 1, 2, 3, 4Year−10.0059, 0.0028, 0.001, 0.0315
dBBay laurel death rateYear−10.020
dRRedwood death rateYear−10.020
Tanoak Size-Transition Rates
aiFrom size class i to size class i + 1, i = 1, 2, 3Year−10.0504, 0.0167, 0.0134
Rates of Infection within a Plot
βT,iFrom tanoak to other tanoak in class i = 1, 2, 3, 4Year−10.38, 0.31, 0.34, 0.23
βBWithin bay laurelYear−11.33
βBTFrom bay laurel to tanoakYear−11.46
βTBFrom tanoak to bay laurelYear−10.3
fProportion of spores produced that are deposited within a plot0.5
Recovery Rates
μTTanoakYear−10.01
μBBay laurelYear−10.1
Rates of Diseased-Induced Death of Tanoak
αiTanoak in size class iYear−10.069, 0.076, 0.134, 0.468

Appendix B. Model of the Implementation of Management Strategies

Disease management actions are represented in the forest stand model by immediate changes in forest composition and infection status at the time of each round of treatment and in each stand cell (see explanation in the main text, and parameters in [44]).

Appendix B.1. Removal of Bay Laurel

Removal of bay laurel is represented through pulses in which a proportion c(1 − r(1 − h)) of the bay laurel population, both susceptible and infected, is removed, followed by instantaneous change in cell composition (including increase in the space available for species recruitment). Here, c is the population coverage, r the probability of stump re-sprouting, and h the effect of herbicide application on stump sprouting. As explained in the Methods, we assess the case of maximal herbicidal effect (h = 1). Following our earlier notation for compartments categorising the state of each tree in the population (Figure 1a and Figure A1), the changes in state variables (population proportion, or prevalence) in an arbitrary cell i upon removal of bay laurel are given by
S B , i ( T + ) = S B , i ( T ) [ 1 c   ( 1 r ( 1 h ) ) ] I B , i ( T + ) = I B , i ( T ) [ 1 c   ( 1 r ( 1 h ) ) ]
where, and T and T+ refer to the instants before and after treatment.

Appendix B.2. Protection of Tanoak

Protection of tanoak is represented through pulse applications of chemical protectants (phosphonates) to a proportion c of the tanoak population, susceptible and infected in all size classes, which change to a protected (non-susceptible) state (P) that has protection efficacy e, followed by instantaneous change in cell composition. Following the notation used for bay laurel removal, the changes in state variables (population proportion or prevalence) in an arbitrary cell i upon application of tanoak protection are given by
S T , i ( T + ) = S T , i ( T ) [ 1 c   e ] P T , i ( T + ) = P T , i ( T ) [ 1 c   e ]
The amount of protected tanoak at time t after given round of treatment (at time T) declines back to the susceptible state at rate γ, and is given by
P T , i ( t ) = P T , i ( T )   exp [ γ ( t T ) ] ,         t > T ,
Table A2. Parameters of the model of implementation of management strategies [44].
ParameterUnitValues
Removal of Bay Laurel
Coverage: proportion of initial average density 1 that can be cut in each cell, c0–1
Minimum density: trees that remain in each cell even when the coverage of the strategy allows further removal0–1
Time of first round of treatmentYear1
Time of optional second round of treatmentYear6
Probability of stump resprouting (without herbicide application), rYear−10.5
Chemical Protection of Tanoak
Coverage: proportion of initial average density to be protected in each cell, c0–1
Efficacy of protection, e, maximum value0.7–0.9
Rate of decay of protection, γYear−10.7
Frequency of treatmentYear−10.5
1 See definition of density in Methods.

References

  1. Brasier, C.M. The biosecurity threat to the UK and global environment from international trade in plants. Plant Pathol. 2008, 57, 792–808. [Google Scholar] [CrossRef]
  2. Loo, J.A. Ecological impacts of non-indigenous invasive fungi as forest pathogens. Biol. Invasions 2009, 11, 81–96. [Google Scholar] [CrossRef]
  3. Santini, A.; Ghelardini, L.; De Pace, C.; Desprez-Loustau, M.L.; Capretti, P.; Chandelier, A.; Cech, T.; Chira, D.; Diamandis, S.; Gaitniekis, T.; et al. Biogeographical patterns and determinants of invasion by forest pathogens in Europe. New Phytol. 2013, 197, 238–250. [Google Scholar] [CrossRef] [PubMed] [Green Version]
  4. Lovett, G.M.; Weiss, M.; Liebhold, A.M.; Holmes, T.P.; Leung, B.; Lambert, K.F.; Orwig, D.A.; Campbell, F.T.; Rosenthal, J.; McCullough, D.G.; et al. Nonnative forest insects and pathogens in the United States: Impacts and policy options. Ecol. Appl. 2016, 26, 1437–1455. [Google Scholar] [CrossRef] [PubMed]
  5. Liebhold, A.M. Forest pest management in a changing world. Int. J. Pest Manag. 2012, 58, 289–295. [Google Scholar] [CrossRef]
  6. Liebhold, A.M.; Brockerhoff, E.G.; Garrett, L.J.; Parke, J.L.; Britton, K.O. Live plant imports: The major pathway for forest insect and pathogen invasions of the US. Front. Ecol. Environ. 2012, 10, 135–143. [Google Scholar] [CrossRef]
  7. Thakur, M.P.; van der Putten, W.H.; Cobben, M.M.P.; van Kleunen, M.; Geisen, S. Microbial invasions in terrestrial ecosystems. Nat. Rev. Microbiol. 2019, 17, 621–631. [Google Scholar] [CrossRef]
  8. Boyd, I.L.; Freer-Smith, P.H.; Gilligan, C.A.; Godfray, H.C.J. The consequence of tree pests and diseases for ecosystem services. Science 2013, 342, 1235773. [Google Scholar] [CrossRef]
  9. Kinloch, B.B. White pine blister rust in North America: Past and prognosis. Phytopathology 2003, 93, 1044–1047. [Google Scholar] [CrossRef] [Green Version]
  10. Paillet, F.L. Chestnut: History and ecology of a transformed species. J. Biogeogr. 2002, 29, 1517–1530. [Google Scholar] [CrossRef] [Green Version]
  11. Grunwald, N.J.; Goss, E.M.; Press, C.M. Phytophthora ramorum: A pathogen with a remarkably wide host range causing sudden oak death on oaks and ramorum blight on woody ornamentals. Mol. Plant Pathol. 2008, 9, 729–740. [Google Scholar] [CrossRef] [PubMed]
  12. Frankel, S.J. Sudden oak death and Phytophthora ramorum in the USA: A management challenge. Australas. Plant Pathol. 2008, 37, 19–25. [Google Scholar] [CrossRef]
  13. Hansen, E.M.; Kanaskie, A.; Prospero, S.; McWilliams, M.; Goheen, E.M.; Osterbauer, N.; Reeser, P.; Sutton, W. Epidemiology of Phytophthora ramorum in Oregon tanoak forests. Can. J. For. Res. Rev. Can. Rech. For. 2008, 38, 1133–1143. [Google Scholar] [CrossRef]
  14. Metz, M.R.; Frangioso, K.M.; Wickland, A.C.; Meentemeyer, R.K.; Rizzo, D.M. An emergent disease causes directional changes in forest species composition in coastal California. Ecosphere 2012, 3, 23. [Google Scholar] [CrossRef]
  15. Grunwald, N.J.; LeBoldus, J.M.; Hamelin, R.C. Ecology and evolution of the sudden Oak death pathogen Phytophthora ramorum. Annu. Rev. Phytopathol. 2019, 57, 301–321. [Google Scholar] [CrossRef]
  16. Meentemeyer, R.K.; Rank, N.E.; Shoemaker, D.A.; Oneal, C.B.; Wickland, A.C.; Frangioso, K.M.; Rizzo, D.M. Impact of sudden oak death on tree mortality in the Big Sur ecoregion of California. Biol. Invasions 2008, 10, 1243–1255. [Google Scholar] [CrossRef]
  17. Brasier, C.; Webber, J. Plant pathology: Sudden larch death. Nature 2010, 466, 824–825. [Google Scholar] [CrossRef]
  18. Harris, A.R.; Webber, J.F. Sporulation potential, symptom expression and detection of Phytophthora ramorum on larch needles and other foliar hosts. Plant Pathol. 2016, 65, 1441–1451. [Google Scholar] [CrossRef] [Green Version]
  19. Jung, T.; Perez-Sierra, A.; Duran, A.; Jung, M.H.; Balci, Y.; Scanu, B. Canker and decline diseases caused by soil- and airborne Phytophthora species in forests and woodlands. Persoonia 2018, 40, 182–220. [Google Scholar] [CrossRef] [Green Version]
  20. O’Hanlon, R.; Choiseul, J.; Brennan, J.M.; Grogan, H. Assessment of the eradication measures applied to Phytophthora ramorum in Irish Larix kaempferi forests. For. Pathol. 2018, 48, e12389. [Google Scholar] [CrossRef]
  21. Xie, B.; Cao, C.; Chen, W.; Yu, B. Prediction and analysis of the potential risk of sudden oak death in China. J. For. Res. 2019, 30, 2357–2366. [Google Scholar] [CrossRef]
  22. Davidson, J.M.; Patterson, H.A.; Rizzo, D.M. Sources of inoculum for Phytophthora ramorum in a redwood forest. Phytopathology 2008, 98, 860–866. [Google Scholar] [CrossRef] [PubMed] [Green Version]
  23. Davidson, J.M.; Patterson, H.A.; Wickland, A.C.; Fichtner, E.J.; Rizzo, D.M. Forest type influences transmission of Phytophthora ramorum in California Oak Woodlands. Phytopathology 2011, 101, 492–501. [Google Scholar] [CrossRef] [PubMed] [Green Version]
  24. Rizzo, D.M.; Garbelotto, M.; Hansen, E.A. Phytophthora ramorum: Integrative research and management of an emerging pathogen in California and Oregon forests. Annu. Rev. Phytopathol. 2005, 43, 309–335. [Google Scholar] [CrossRef] [PubMed] [Green Version]
  25. Hayden, K.J.; Nettel, A.; Dodd, R.S.; Garbelotto, M. Will all the trees fall? Variable resistance to an introduced forest disease in a highly susceptible host. For. Ecol. Manag. 2011, 261, 1781–1791. [Google Scholar] [CrossRef]
  26. Cobb, R.C.; Meentemeyer, R.K.; Rizzo, D.M. Apparent competition in canopy trees determined by pathogen transmission rather than susceptibility. Ecology 2010, 91, 327–333. [Google Scholar] [CrossRef] [Green Version]
  27. Varner, J.M.; Kuljian, H.G.; Kreye, J.K. Fires without tanoak: The effects of a non-native disease on future community flammability. Biol. Invasions 2017, 19, 2307–2317. [Google Scholar] [CrossRef] [Green Version]
  28. Monahan, W.B.; Koenig, W.D. Estimating the potential effects of sudden oak death on oak-dependent birds. Biol. Conserv. 2006, 127, 146–157. [Google Scholar] [CrossRef]
  29. Bergemann, S.E.; Garbelotto, M. High diversity of fungi recovered from the roots of mature tanoak (Lithocarpus densiflorus) in northern California. Can. J. Bot. 2006, 84, 1380–1394. [Google Scholar] [CrossRef]
  30. Cobb, R.C.; Rizzo, D.M.; Hayden, K.J.; Garbelotto, M.; Filipe, J.A.N.; Gilligan, C.A.; Dillon, W.; Meentemeyer, R.K.; Valachovic, Y.S.; Goheen, E.; et al. Biodiversity conservation in the face of dramatic forest disease: An integrated conservation strategy for tanoak (Notholithocarpus densiflorus) threatened by sudden oak death. Madrono 2013, 60, 151–165. [Google Scholar] [CrossRef]
  31. Bowcutt, F. Tanoak target: The rise and fall of herbicide use on a common native tree. Environ. Hist. 2011, 16, 197–225. [Google Scholar] [CrossRef]
  32. Grunwald, N.J.; Garbelotto, M.; Goss, E.M.; Heungens, K.; Prospero, S. Emergence of the sudden oak death pathogen Phytophthora ramorum. Trends Microbiol. 2012, 20, 131–138. [Google Scholar] [CrossRef] [PubMed]
  33. Garbelotto, M.; Schmidt, D.; Swain, S.; Hayden, K.; Lione, G. The ecology of infection between a transmissive and a dead-end host provides clues for the treatment of a plant disease. Ecosphere 2017, 8, e01815. [Google Scholar] [CrossRef] [Green Version]
  34. Kanaskie, A.; Goheen, E.M.; Hansen, E.M.; Sutton, W.; Reeser, P.; Osterbauer, N. Monitoring the effectiveness of Phytophthora ramorum eradication treatments in southwest Oregon tanoak forests. In Proceedings of the Annual Meeting of the American-Phytopathology-Society, Portland, OR, USA, 1–5 August 2009; p. S61. [Google Scholar]
  35. Kanaskie, A.; Hansen, E.M.; Goheen, E.M.; Osterbauer, N.; McWilliams, M.; Laine, J.; Thompson, M.; Savona, S.; Timeus, H.; Wiese, R.; et al. Detection and eradication of Phytophthora ramorum from Oregon forests, 2001–2011. In Proceedings of the Sudden Oak Death Fifth Science Symposium, Petaluma, CA, USA, 19–22 June 2012; PSW-GTR-243. pp. 3–13. [Google Scholar]
  36. Peterson, E.; Hansen, E.M.; Kanaskie, A. Spatial relationship between Phytophthora ramorum and roads or streams in Oregon tanoak forests. For. Ecol. Manag. 2014, 312, 216–224. [Google Scholar] [CrossRef]
  37. Hansen, E.M.; Reeser, P.; Sutton, W.; Kanaskie, A.; Navarro, S.; Goheen, E.M. Efficacy of local eradication treatments against the sudden oak death epidemic in Oregon tanoak forests. For. Pathol. 2019, 49, e12530. [Google Scholar] [CrossRef]
  38. Alexander, J.; Lee, C. Lessons learned from a decade of sudden Oak death in California: Evaluating local management. Environ. Manag. 2010, 46, 315–328. [Google Scholar] [CrossRef] [Green Version]
  39. Valachovic, Y.; Lee, C.; Marshall, J.; Scanlon, H. Forest treatment strategies for Phytophthora ramorum. In Proceedings of the Sudden Oak Death Fourth Science Symposium, Santa Cruz, CA, USA, 15–18 June 2009; PSW-GTR-222. pp. 239–248. [Google Scholar]
  40. Kanaskie, A.; Hansen, E.M.; Sutton, W.; Reeser, P.; Choquette, C. Application of phosphonate to prevent sudden oak death in south-western Oregon tanoak (Notholithocarpus densiflorus) forests. N. Z. J. For. Sci. 2011, 41S, S177–S187. [Google Scholar]
  41. Garbelotto, M.; Schmidt, D. Phosphonate controls sudden oak death pathogen for up to 2 years. Calif. Agric. 2009, 63, 10–17. [Google Scholar] [CrossRef]
  42. Elliott, M.; Shamoun, S.F.; Sumampong, G.; James, D.; Masri, S.; Varga, A. Evaluation of several commercial biocontrol products on European and North American populations of Phytophthora ramorum. Biocontrol Sci. Technol. 2009, 19, 1007–1021. [Google Scholar] [CrossRef]
  43. Swiecki, T.J.; Bernhardt, E. Assessing methods to protect susceptible oak and tanoak stands from sudden oak death. In Proceedings of the Sudden Oak Death Fourth Science Composium, Santa Cruz, CA, USA, 2010; Available online: https://www.fs.usda.gov/treesearch/pubs/35024 (accessed on 3 December 2019).
  44. Filipe, J.A.N.; Cobb, R.C.; Meentemeyer, R.K.; Lee, C.A.; Valachovic, Y.S.; Cook, A.R.; Rizzo, D.M.; Gilligan, C.A. Landscape epidemiology and control of pathogens with cryptic and long-distance dispersal: Sudden oak death in northern Californian forests. PLoS Comput. Biol. 2012, 8, e1002328. [Google Scholar] [CrossRef]
  45. Cobb, R.C.; Filipe, J.A.N.; Meentemeyer, R.K.; Gilligan, C.A.; Rizzo, D.M. Ecosystem transformation by emerging infectious disease: Loss of large tan oak from California forests. J. Ecol. 2012, 100, 712–722. [Google Scholar] [CrossRef]
  46. Filipe, J.A.N.; Gibson, G.J. Comparing approximations to spatio-temporal models for epidemics with local spread. Bull. Math. Biol. 2001, 63, 603–624. [Google Scholar] [CrossRef] [PubMed]
  47. Harrington, T.B.; Tappeiner, J.C. Long-term effects of tanoak competition on Douglas-fir stand development. Can. J. For. Res. Rev. Can. Rech. For. 2009, 39, 765–776. [Google Scholar] [CrossRef]
  48. Maloney, P.E.; Lynch, S.C.; Kane, S.F.; Jensen, C.E.; Rizzo, D.M. Establishment of an emerging generalist pathogen in redwood forest communities. J. Ecol. 2005, 93, 899–905. [Google Scholar] [CrossRef]
  49. Lorimer, C.G.; Porter, D.J.; Madej, M.A.; Stuart, J.D.; Veirs, S.D.; Norman, S.P.; O’Hara, K.L.; Libby, W.J. Presettlement and modern disturbance regimes in coast redwood forests: Implications for the conservation of old-growth stands. For. Ecol. Manag. 2009, 258, 1038–1054. [Google Scholar] [CrossRef]
  50. Valachovic, Y.; Cobb, R.C.; Rizzo, D.M.; Twieg, B.; Lee, C.; Glebocki, R. Is stump sprout treatment necessary to effectively control Phytophthora ramorum in California’s wildlands? In Sudden Oak Death Fourth Science Composium; Us Dept Agr, Forest Serv Pacific Sw Forest & Range Exptl Stn: Petaluma, CA, USA, 2013; Volume 243, pp. 114–117. [Google Scholar]
  51. Ballard, B.D.; Nowak, C.A. Timing of cut-stump herbicide applications for killing hardwood trees on power line rights-of-way. Arboric. Urban For. 2006, 32, 118–125. [Google Scholar]
  52. Anderson, R.M.; May, R.M. Vaccination and herd-immunity to infectious-diseases. Nature 1985, 318, 323–329. [Google Scholar] [CrossRef]
  53. Brown, L.B.; Allen-Diaz, B. Forest stand dynamics and sudden oak death: Mortality in mixed-evergreen forests dominated by coast live oak. For. Ecol. Manag. 2009, 257, 1271–1280. [Google Scholar] [CrossRef]
  54. Horner, I.J.; Hough, E.G.; Horner, M.B. Forest efficacy trials on phosphite for control of kauri dieback. N. Z. Plant Prot. 2015, 68, 7–12. [Google Scholar] [CrossRef] [Green Version]
  55. Garbelotto, M.; Schmidt, D.J.; Harnik, T.Y. Phosphite injections and bark application of phosphite + Pentrabark™ control sudden oak death in coast live oak. Arboric. Urban For. 2007, 33, 309–317. [Google Scholar] [CrossRef]
  56. Gilligan, C.A. Sustainable agriculture and plant diseases: An epidemiological perspective. Philos. Trans. R. Soc. B Biol. Sci. 2008, 363, 741–759. [Google Scholar] [CrossRef] [PubMed]
  57. Peterson, E.K.; Hansen, E.M.; Kanaskie, A. Temporal epidemiology of sudden Oak death in Oregon. Phytopathology 2015, 105, 937–946. [Google Scholar] [CrossRef] [PubMed]
  58. Cunniffe, N.J.; Cobb, R.C.; Meentemeyer, R.K.; Rizzo, D.M.; Gilligan, C.A. Modeling when, where, and how to manage a forest epidemic, motivated by sudden oak death in California. Proc. Natl. Acad. Sci. USA 2016, 113, 5640–5645. [Google Scholar] [CrossRef] [PubMed] [Green Version]
  59. Mascheretti, S.; Croucher, P.J.P.; Vettraino, A.; Prospero, S.; Garbelotto, M. Reconstruction of the sudden Oak death epidemic in California through microsatellite analysis of the pathogen Phytophthora ramorum. Mol. Ecol. 2008, 17, 2755–2768. [Google Scholar] [CrossRef]
  60. Meentemeyer, R.K.; Cunniffe, N.J.; Cook, A.R.; Filipe, J.A.N.; Hunter, R.D.; Rizzo, D.M.; Gilligan, C.A. Epidemiological modeling of invasion in heterogeneous landscapes: Spread of sudden Oak death in California (1990–2030). Ecosphere 2011, 2, art17. [Google Scholar] [CrossRef]
  61. Maloy, O.C. White pine blister rust control in North America: A case history. Annu. Rev. Phytopathol. 1997, 35, 87–109. [Google Scholar] [CrossRef]
  62. Hunter, S.; Williams, N.; McDougal, R.; Scott, P.; Garbelotto, M. Evidence for rapid adaptive evolution of tolerance to chemical treatments in Phytophthora species and its practical implications. PLoS ONE 2018, 13, e0208961. [Google Scholar] [CrossRef]
  63. Swiecki, T.J.; Quinn, M.; Sims, L.; Bernhardt, E.; Oliver, L.; Popenuck, T.; Garbelotto, M.M. Three new Phytophthora detection methods, including training dogs to sniff out the pathogen, prove reliable. Calif. Agric. 2018, 72, 217–225. [Google Scholar] [CrossRef] [Green Version]
  64. Kalantarzadeh, M.; Mulholland, D.A.; De Leij, F.A.A.M.; Webber, J.F. Induced antimicrobial activity in heat-treated woodchips inhibits the activity of the invasive plant pathogen Phytophthora ramorum. Plant Pathol. 2019, 68, 889–900. [Google Scholar] [CrossRef]
  65. Woodcock, P.; Cottrell, J.E.; Buggs, R.J.A.; Quine, C.P. Mitigating pest and pathogen impacts using resistant trees: A framework and overview to inform development and deployment in Europe and North America. Forestry 2018, 91, 1–16. [Google Scholar] [CrossRef] [Green Version]
  66. Cobb, R.C.; Ross, N.; Hayden, K.J.; Eyre, C.A.; Dodd, R.S.; Frankel, S.J.; Garbelotto, M.; Rizzo, D.M. Promise and pitfalls of endemic resistance for cultural resources threatened by Phytophthora ramorum. Phytopathology 2019, 109, 760–769. [Google Scholar] [CrossRef] [PubMed] [Green Version]
  67. Conrad, A.O.; McPherson, B.A.; Lopez-Nicora, H.D.; D’Amico, K.M.; Wood, D.L.; Bonello, P. Disease incidence and spatial distribution of host resistance in a coast live oak/sudden oak death pathosystem. For. Ecol. Manag. 2019, 433, 618–624. [Google Scholar] [CrossRef]
Figure 1. Model of community composition and pathogen invasion. (a) Illustrative spatial dynamics of an epidemic spreading from the centre of a model stand that represents a single-landowner forest plot of 20 ha. The stand is a spatial lattice of 400 cells, each with approximately 2.5 m × 2.5 m and with specific and changing tree composition and canopy structure (different shadings). The figure shows increasing pathogen level in the cells invaded from the introduction point (stripping), but not the associated changes in densities of host species. Here, species have heterogeneous densities across the stand before and after pathogen invasion to illustrate the model’s generic scope; the results shown later refer to stands that are heterogeneous after but homogeneous before disease in order to simplify interpretation of the impacts of disease management actions. (b) Compartmental model of the unmanaged dynamics of the stand (circles and transition arrows) defined by epidemic and species-density states in each cell i [45]. Epidemic state is represented by susceptible (non-infected) (S) and infectious (I) compartments, and the species populations by redwood (R) and bay laurel (B) average-size and tanoak (T) canopy-size-class (ai) compartments. Infected cells contribute according to relative distance (thick horizontal arrows, species-specific tone) to the force of infection (thick vertical arrows) on each non-infected host in cell i. Species have mortality and density-dependent birth (thin-arrows). See Appendix A for more detail on the model dynamics.
Forests 10 01103 g001
Figure 2. Schematic illustration of the application of treatments to P. ramorum hosts over time: removal of bay laurel and chemical protection of tanoak. Vertical axes represent amounts of bay laurel and protected and unprotected tanoak in the stand before and after treatments: (a,b) After removal, there is natural recovery in the bay laurel population. (c) After chemical protection, tanoak trees lose protection gradually. Herbicide: (a) Illustration of herbicide application to prevent re-sprouting (Scheme 2 corresponds to the period prior to the second round). (b) If herbicide is not applied after cutting, bay laurel trees can re-sprout; this rebound is represented by an instantaneous increase in the number of non-infected bay laurel stems in each cell (Scheme 3 corresponds to the full time line). Constraints on treatment coverage: (a,b) There is a cap on the amount of bay laurel that can be removed in each cell and treatment round, corresponding to a maximum effort. Moreover, for conservation purposes, we do not allow the bay laurel population to drop below a minimum density (‘min’); hence, in some cells fewer removal resources are used than their available maximum. (c) There is a maximum density of tanoak that can receive chemical application in each cell and treatment round.
Forests 10 01103 g002
Figure 3. Epidemic thresholds in tanoak density (proportion of stand area occupied by species) in unmanaged forest stands: tanoak proportion infected and density in the stand 100 years after P. ramorum invasion across scenarios where tanoak density prior to invasion ranges from 0 and 0.6 and, (a) without bay laurel, or (b) with 1.5% prevalence (proportion of total stems) of bay laurel. For very low bay laurel density, a threshold tanoak density exists below which the pathogen does not cause epidemics; for higher bay laurel density this threshold ceases to exist. See Figure 4c for examples of epidemic trajectories on tanoak and bay laurel up to the current point after pathogen invasion. An epidemic threshold is a minimum number or density of susceptible hosts necessary for an epidemic to occur; reducing the density of susceptible hosts below this minimum is the underlying principle of vaccination [52]. The tanoak density comprises all tanoak size classes.
Forests 10 01103 g003
Figure 4. Temporal change in forest composition of an unmanaged stand invaded by P. ramorum: change by species spatial-averaged density (left) and epidemic progress in the host populations (right). Forest type: (a) mixed, (b) dominated by bay laurel, (c) without bay laurel. The outbreak starts at time 0. The initial and final tanoak densities in c correspond to those in Figure 3a. Tanoak density aggregates all size classes.
Forests 10 01103 g004
Figure 5. Impact of treatments on the pace of composition change (species density—left) and epidemic progress (densities of susceptible and infectious tanoak and bay laurel—right) in a mixed-forest stand from the time of invasion by P. ramorum. All quantities are spatial totals of the spatially heterogeneous epidemic in the stand (see Methods). Treatments applied one year after invasion: no treatment, removal of bay laurel (single round with herbicide application), chemical protection of tanoak (“tan protection”), and combination strategy. Impacts on: (a) tanoak (all size classes), (b) bay laurel, and (c) redwood (this category represents all epidemiologically non-significant species in our study area, of which redwood (S. sempervirens) is the most common). In mixed-forest stands, the impact of tanoak protection alone is weak because of high abundance of bay laurel (prevalence 30%, density 23%).
Forests 10 01103 g005
Figure 6. Comparison of how much herbicide application or follow-up of treatment enhance the ability of bay laurel removal to increase the durability of tanoak populations in mixed-forest stands invaded by P. ramorum. (a) Tanoak relative half-life; and (b) tanoak relative density (space-averaged) 20 years after invasion, in three strategies of implementation of removal (one round with herbicide application, and one round or two rounds (in 5 years) without herbicide application) initiated one year after invasion across the range of population coverage levels. We obtained similar results (not shown) in a mixed forest with more redwood than tanoak (40% and 30%, rather than 30% and 40%). Relative measures of durability are defined in Methods. Results rely on model accuracy up to time considered, e.g., half-life, not up to the considerably longer 100 year horizon in Figure 4 and Figure 5.
Forests 10 01103 g006
Figure 7. Potential of chemical protection to increase the durability of a tanoak population invaded by P. ramorum, in a forest with 60% tanoak and (a) without bay laurel (40% redwood) (time relative to this forest type only), and (b) without bay laurel or with 20% bay laurel (20% redwood) (time relative to both forest types, natural-log scale), over the range of coverage strategies for three chemical protectants (efficacy 30%, 50%, and 80%; see text for details) applied biennially across the stand one year after invasion of P. ramorum. Here, relative half-life is the period after which 20% (not 50%) of the initial tanoak has been lost since invasion.
Forests 10 01103 g007
Figure 8. How bay laurel limits the effectiveness of chemical protection of tanoak against P. ramorum infection in mixed forests with differing initial prevalence (% of stems) of bay laurel and redwood and 40% prevalence of tanoak. Chemical treatment is as in Figure 7, but with default coverage (80%) and efficacy (70%). The relative half-life is in the sense of Figure 7.
Forests 10 01103 g008
Figure 9. Benefits of combination strategies. (a) Potential of combination strategies to increase the durability of the tanoak population in a mixed-forest stand, for a variety of strategies differing in the levels of coverage of bay laurel removal (0–95%) and coverage of tanoak chemical protection (0%, 40%, 80%). Treatments: removal of bay laurel (single round with herbicide) and chemical protection (75% efficacy, as in Figure 7) initiated one year after pathogen invasion. Note that the efficacy of chemical protection is lower than that documented for phosphonate treatments against P. ramorum [41]. (b) Contrast of the impacts of combined- and single-treatment management strategies on the density of tanoak since the start of the epidemic. There is a synergistic effect in the combination strategy as it yields a tanoak abundance that exceeds the sum of the abundances in the separate strategies (‘sum of parts’). Treatments are as in A and Figure 6, but coverage of bay removal is 70%.
Forests 10 01103 g009
Figure 10. Diagram of options of disease management for tanoak conservation in a forest stand. Species prevalence is the proportion of the total stems; species density is the proportion of the stand area occupied by the species.
Forests 10 01103 g010

