Article

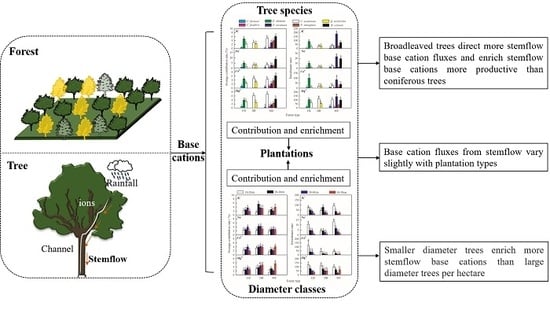
Base Cation Fluxes from the Stemflow in Three Mixed Plantations in the Rainy Zone of Western China

1
School of Life Science, Taizhou University, Taizhou 318000, China
2
Key Laboratory of Ecological Forestry Engineering in the Upper Reaches of Yangtze River, Institute of Ecology and Forestry, Sichuan Agricultural University, Chengdu 611130, China
*
Author to whom correspondence should be addressed.
Forests 2019, 10(12), 1101; https://doi.org/10.3390/f10121101
Submission received: 8 October 2019 / Revised: 27 November 2019 / Accepted: 28 November 2019 / Published: 2 December 2019
(This article belongs to the Special Issue Ecologically Sustainable Forest Management)

Abstract

:
Base cation transfer from stemflow is an important process for nutrient transfer and plays a key role in maintaining the balance of soil nutrient pools. To research the differences of stemflow chemistry in mixed plantations, we conducted a continuous field experiment in the rainy zone of Western China from December 2016 to November 2017. Three representative mixed plantations, including a conifer–broadleaved mixed plantation, a deciduous broadleaved mixed plantation and a multispecies mixed plantation, were selected to investigate the concentration and flux characteristics of K+, Na+, Ca2+ and Mg2+ in stemflow. The results showed that: (1) the K+, Na+, Ca2+ and Mg2+ fluxes ranged from 1.75 to 2.44 kg ha−1 year−1, 0.14 to 0.24 kg ha−1 year−1, 1.25 to 2.11 kg ha−1 year−1, and 0.40 to 0.60 kg ha−1 year−1 in these mixed plantations during the one-year observation, and the annual or seasonal (i.e., rainy or dry season) base cation fluxes in the stemflow varied slightly with the plantation types; (2) broadleaved trees had a higher average stemflow base cation contribution rate and flux-based enrichment ratio than coniferous trees, and the enrichment ratios showed a decreasing tendency with increasing trunk diameter; (3) the stemflow base cation concentration was higher in the dry season, while flux was observed to be higher in the rainy season. These results suggested that increasing the proportion of broadleaved species in mixed plantations might improve soil nutrient content and benefit material cycling in subtropical forest ecosystems.

Graphical Abstract

1. Introduction

Stemflow plays a fundamental role in maintaining forest productivity and regulating the biogeochemical cycles of water and nutrients [1,2,3]. Although stemflow only occupies a small portion of bulk precipitation compared to throughfall, it can enrich base cations and generate multiple nutrient points in forest ecosystems (Figure 1) [2,4,5], and these nutrient ions existing in the near-stem soil can be directly absorbed and utilized by the vegetation [6]. They can also form complexes with the litter layer or organic matter which are generally abundant in forest ecosystems and indirectly supply nutrients to the vegetation. Besides, stemflow has strong effects on the microhabitats around tree bases and the understory vegetation distribution patterns [7,8], soil physicochemical properties, and soil fertility [9,10,11,12]. Therefore, understanding stemflow nutrient transportation patterns will provide a scientific basis for sustainable forest management.
Mixed plantations with different tree species have generally been considered to behave better in ecosystem functioning than monodominant plantations [13]. Different trees can create different biogeochemical hotspots in forest ecosystems [14]. Firstly, tree species substantially affect stemflow chemistry [14]. Tree canopy changes with the seasons offers different available areas for deposition interception and ionic exchange. Previous studies found that deciduous trees often had a high canopy exchange of K+, Ca2+ and Mg2+, while coniferous trees always captured dry deposition effectively [15,16]. However, it is not known how tree species impact stemflow chemistry in mixed plantations. Secondly, tree bark can show different abilities to change stemflow chemistry, leading to interspecific differences in stemflow. Levia and Herwitz [17] found that furrowed bark of northern red oak (Quercus rubra) generated large stemflow solute inputs, and thinner bark was reported to be more favorable to ionic exchange by André [18]. Additionally, tree diameter (which determines the contacted area between the trunk and water) also impacts stemflow greatly, and trees with a large diameter always produce high solute fluxes [18,19]. Based on this, stands composed of diverse species may produce varied stemflow nutrient flux, thus leading to different stemflow chemistry among mixed plantations, which is also important for nutrient cycling in the forest ecosystem. Furthermore, the dynamics of base cations (K+, Na+, Ca2+ and Mg2+) in stemflow change due to seasonal precipitation patterns and canopy morphology changes [17,20,21], but the actual processes remain unclear.
Therefore, we hypothesized that stemflow base cation flux varied among different mixed plantations, especially in the rainy season. The stemflow chemistry of three representative mixed plantations in the rainy zone of Western China was assessed to test our hypothesis by addressing the following questions: (i) how do the annual/seasonal concentrations/fluxes of the base cations (K+, Na+, Ca2+ and Mg2+) in stemflow vary among the mixed plantations? (ii) Do the base cations in stemflow follow a seasonal trend between the rainy and dry season? (iii) How do tree species and diameter classes affect the base cation flux in stemflow? Answers to these questions will provide a scientific basis for forest management in subtropical regions and serve as a reference for the evaluation system of mixed plantations.

2. Materials and Methods

2.1. Site Description

The study was conducted in the Monitoring Station for Eco-Environment in the rainy zone of Western China (31°01′–31°01′ N, 103°34′–103°36′ E), which is located in Dujiangyan city at the western edge of the Sichuan Basin (Figure 2). The mean annual precipitation at the study site is 1243 mm. The rainy season ranges from May to October, and the dry season ranges from November to April [22]. The mean annual temperature is 15.2 °C, and the mean monthly temperature ranges from −1.4 °C (January) to 31.6 °C (July). The soil is classified as ferralsol with old alluvial yellow loam according to the Chinese Soil Taxonomy (Cooperative Research Group on Chinese Soil Taxonomy 2001). The concentrations of C, N and P in 0–20 cm soil samples were 15.76 g kg−1, 1.92 g kg−1 and 0.32 g kg−1, respectively, and the soil pH in this region was 5.73 [23]. In the 1950s, the Forestry Department of Sichuan University planted different mixed forests in this area, and the typical vegetation types include Cryptomeria fortunei, Quercus acutissima, Phoebe zhennan, Camptotheca acuminate, etc. These forests received little human disturbance in nearly 20 years. Most trees in the forest flower in succession in approximately April and fruit from August to October.

2.2. Plot Design

Three plots (15 m × 15 m) were established in the following three plantations (gradient 10°–15°) (Figure 2): a conifer–broadleaved mixed plantation (CB), a deciduous broadleaved mixed plantation (DB) and a multispecies mixed plantation (MS). The species and tree diameter at breast height (DBH) in the plots were investigated, and the trees were divided into 6 DBH classes at intervals of 10 cm (10–20 cm, 20–30 cm, 30–40 cm, 40–50 cm, 50–60 cm and 60–70 cm) (Table 1). The total number of trees in the plots in CB, DB and MS were 34, 30 and 42, respectively (Table 2).

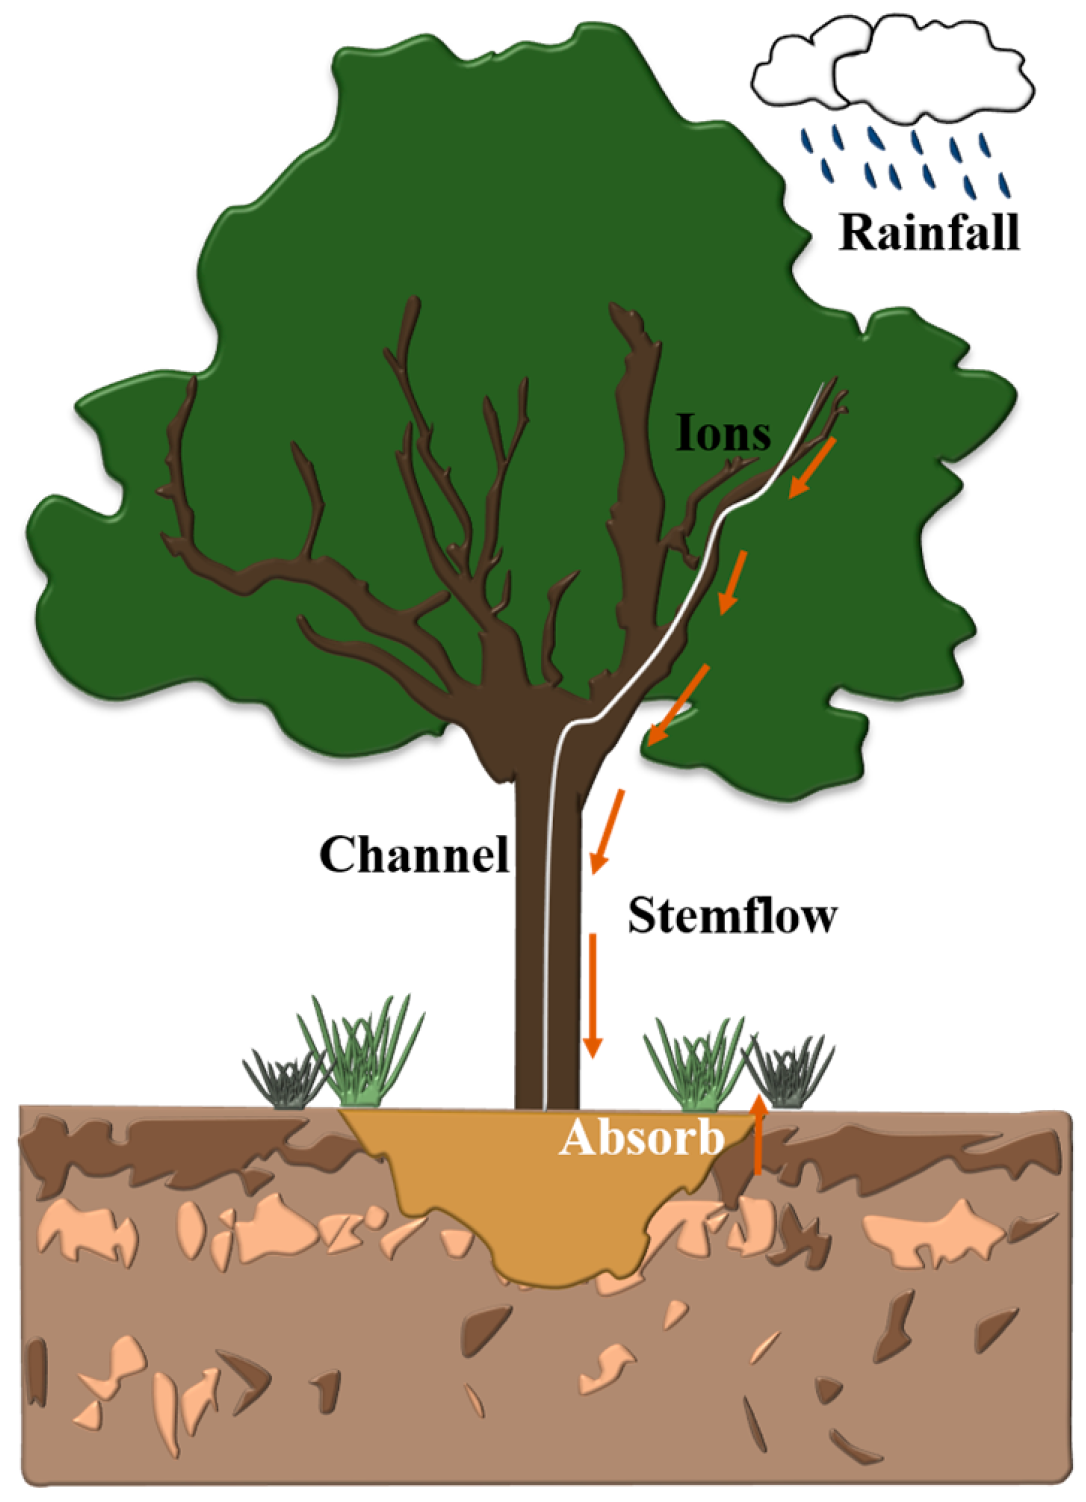
2.3. Stemflow and Rainfall Collection

To evaluate stand stemflow accurately, we randomly selected three trees of the same species in each diameter class to measure and sample the stemflow, and the trees with fewer than three individuals were all selected to measure stemflow. The total number of trees fitted with stemflow collectors in the plots in CB, DB and MS were 23, 20 and 33, respectively (Table 2). The stemflow of the remaining trees in the plots was averaged from trees of the same species in each diameter class.
The trunks of the selected trees were equipped with flexible tubes that were cut longitudinally and wrapped around the tree trunks at a height of 1.3 m. The tubes and tree trunks were fixed tightly with iron nails, and silicone sealant was applied to seal the nail and plug nail head gaps [25]. The end of each tubing was connected to a 15 L polyethylene bucket through the lid, and the lid and tubing gaps were sealed with silicone sealant to minimize the interference from dry deposition.
Early precipitation monitoring suggested that it was insufficient to collect stemflow when the precipitation amount was less than 10 mm. Hence, stemflow samples were immediately collected during December 2016 to November 2017 after every rainfall event that reached 10 mm, and the collection was taken every 15 days if it did not reach 10 mm after several rainfall events. We used a weather station (HOBO U30-NRC, Onset Computer Corporation, Bourne, MA, USA) to record precipitation. Meanwhile, three man-made rainfall collectors (a 17.5 cm diameter plastic bucket connected to a 5 L plastic bucket) were also installed in the open area to sample rainfall water. However, there were 5 rainstorms that led to overflowing stemflow and underestimated volumes. There was a significant linear relationship between rainfall and stemflow volume. Thus, we fit a curve equation of precipitation and stemflow (mm) to estimate the unanticipated cases (Table 3) and calculate the base cation fluxes during rainstorm events.
All stemflow samples were weighed at study site, collected (250 mL) and transported to the laboratory for chemical analysis. The water samples were filtered through 0.45 μm membranes (Jiangsu Green Union Science Instrument Co., Jiangsu, China) and used for chemical analysis as soon as possible. The concentrations of K+, Na+, Ca2+ and Mg2+ were measured using an atomic absorption spectrophotometer (AA-7000, SHIMADZU, Kyoto, Japan).

2.4. Data Calculations and Statistical Analyses

The average stemflow base cation contribution rates of trees were used to evaluate the tree contribution to the forest for every tree species or diameter class. Stemflow enrichment ratios standardize stemflow base cation inputs per unit area and indicate how relevant stemflow can be for forest nutrient cycling compared to open areas. The stemflow volume of plot i (VSF,i, mm), base cation fluxes of stemflow in the plantations (FluxSF, kg ha−1), and average base cation contribution rates of the tree species or diameter classes (I, %) to stand stemflow and stemflow enrichment ratios (E) [26] were calculated as follows:
VSF,i = Vt,i/Si
F l u x S F = ( i = 1 n ( C S F , i ) × V S F , i × 0.01 ) / n
I = (Fluxs/Fluxt) × 100%/q
E = (Ci × Vi)/(Cp × P × B)
where VSF,i (mm) and Vt,i (L) are stemflow volumes in plot i; Si (m2) and n are the plot area and tree quantity, respectively; CSF,i (mg L−1) is the base cation concentration of stemflow in plot i; Fluxs (g ha−1) is the base cation flux in stemflow for a specific tree species or diameter class; Fluxt (g ha−1) is the total stemflow base cation flux of all trees in the three plots; q is the tree quantity of the corresponding Fluxs; Ci is the base cation concentration in the stemflow of trees (mg L−1); Vi is the stemflow volume (L); Cp is the base cation concentration of the gross precipitation (mg L−1); P is the depth of gross precipitation (mm); and B is the trunk basal area (m2). In order to ensure repeatability, the enrichment ratios and average base cation contribution rates were calculated only for the tree species and diameter classes with more than three individuals in the stand plots.
The differences in base cation concentration and flux among plantations were tested by one-way analysis of variance (ANOVA) followed by Duncan’s multiple range test. We also used ANOVA to determine whether the effects of diameter and species on base cation enrichment and contribution ratios in the three plantations were significant. Besides, as there were only two studied tree species in the DB plantation, we conducted student’s t-test to identify the differences instead. To observe seasonal changes in the stemflow base cations in the three plantations, student’s t-test was performed to assess the differences in concentration and flux between the rainy and dry season. All statistical tests were considered significant at the p < 0.05 level and performed by using the Software Statistical Package for the Social Sciences (SPSS) version 20.0 (IBM SPSS Statistics Inc, Chicago, IL, USA).

3. Results

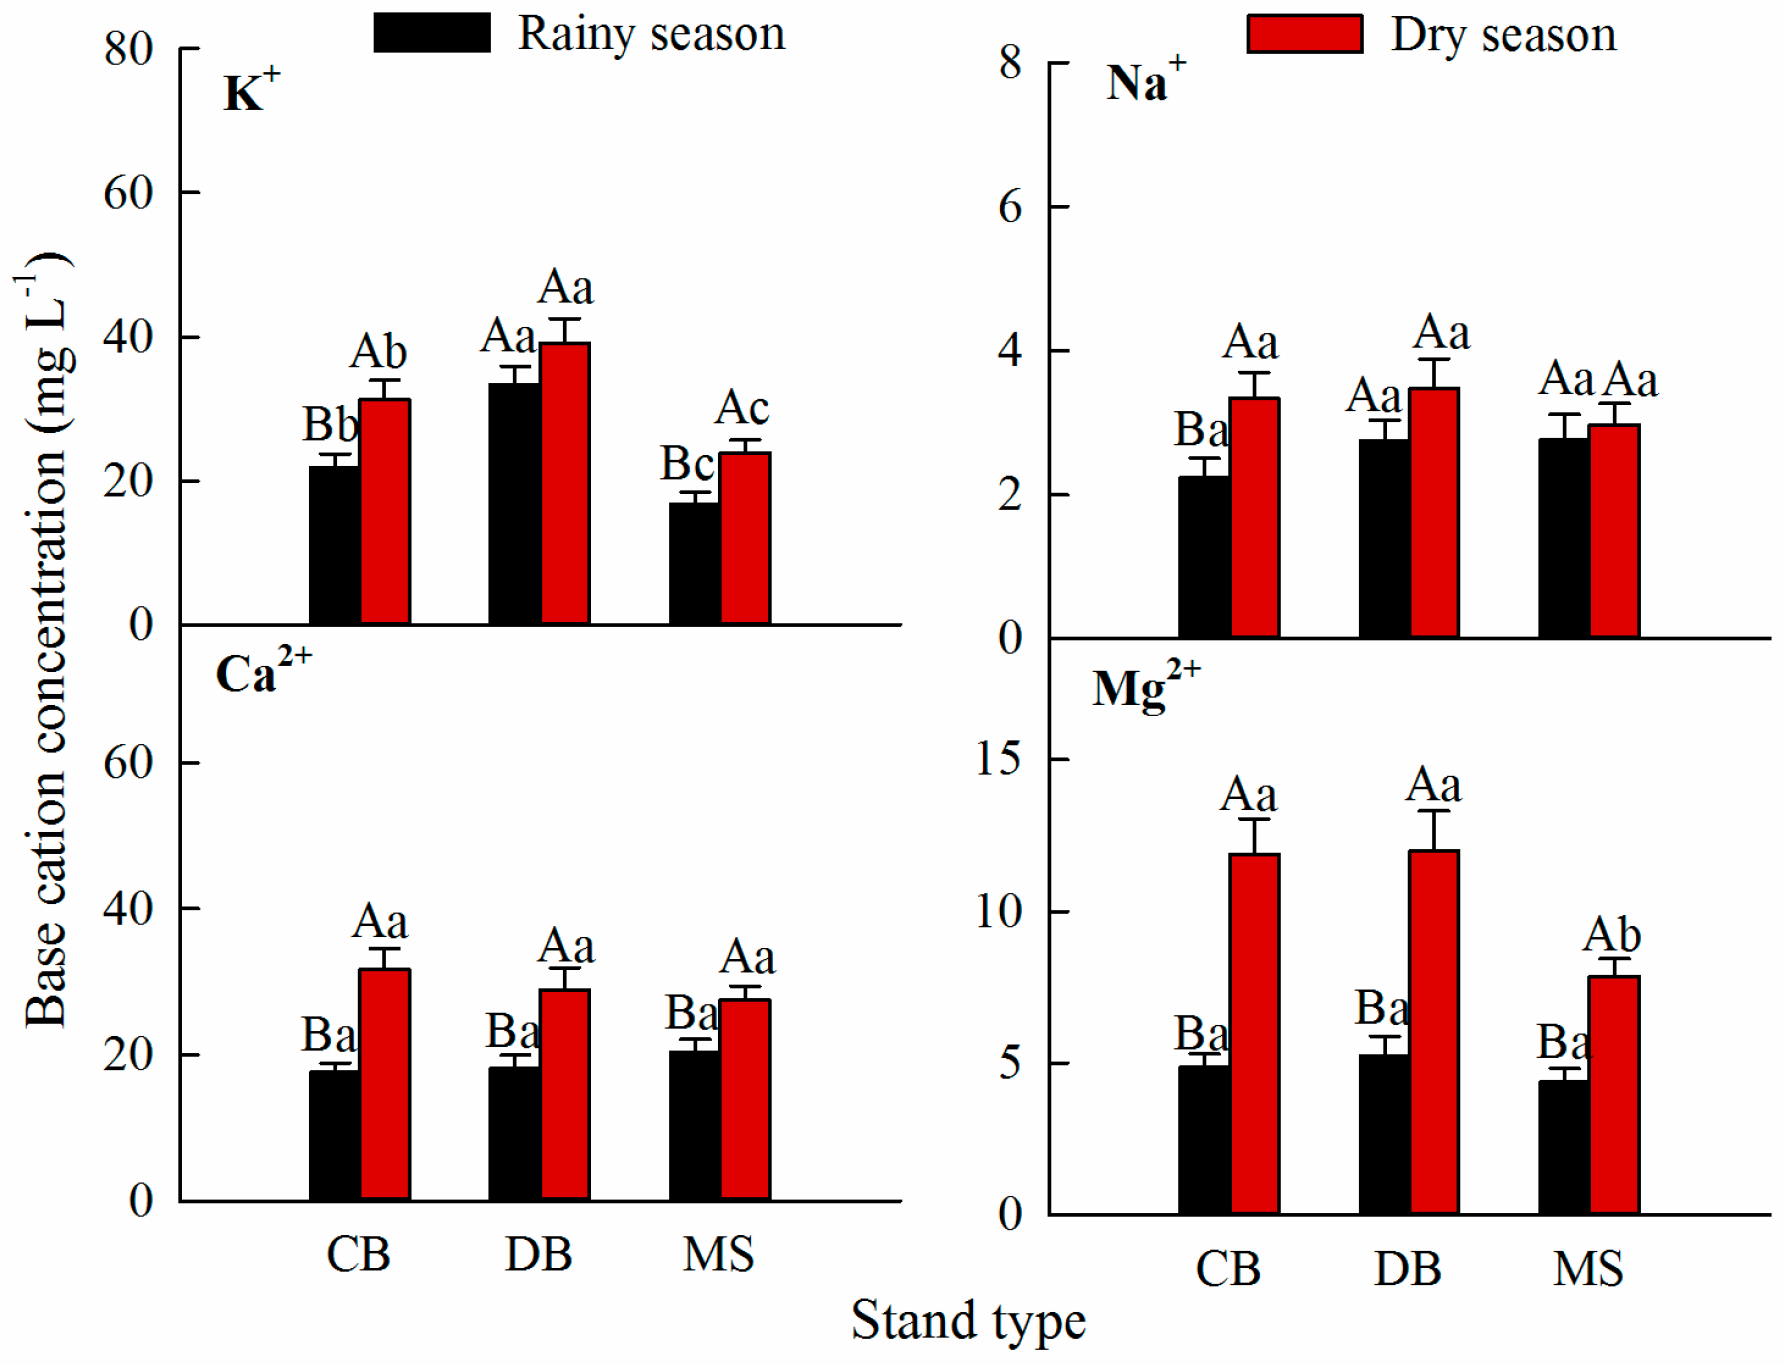
3.1. Base Cation Concentrations in Stemflow

The annual average concentration of all the base cations (K+, Na+, Ca2+ and Mg2+) in rainfall was significantly lower (p < 0.05) than those in the stemflow. The annual average K+ concentration in the stemflow in the DB was significantly higher (p < 0.05) than that in the CB and MS (Figure 3). The concentrations of Na+ and Ca2+ varied slightly with plantation type. The lowest concentration of Mg2+ in the stemflow was observed in the MS (Figure 3). The seasonal base cation concentrations in the stemflow among the plantations were similar to the variation in the annual average concentrations. As expected, concentrations of all the base cations in the stemflow in the rainy season were significantly lower than those in the dry season (except for K+ and Na+ in the DB and Na+ in the MS) (Figure 4).

3.2. Base Cation Fluxes in the Stemflow

The annual fluxes of all the base cations in the rainfall were significantly higher (p < 0.05) than those in the stemflow. The annual fluxes of K+, Na+, Ca2+ and Mg2+ in the rainfall reached 25.45 kg ha−1 year−1, 21.63 kg ha−1 year−1, 102.04 kg ha−1 year−1, and 3.93 kg ha−1 year−1, respectively. No significant differences in annual base cation flux in stemflow were detected among different plantations (Figure 5). Additionally, no significant differences were observed among plantations in either dry or rainy seasons (Figure 6). The annual flux of K+, Na+, Ca2+ and Mg2+ in the stemflow ranged from 1.75 to 2.44 kg ha−1 year−1, 0.14 to 0.24 kg ha−1 year−1, 1.25 to 2.11 kg ha−1 year−1, and 0.40 to 0.60 kg ha−1 year−1 in the plantations. The base cation fluxes in the stemflow in the rainy season were relatively higher than those in the dry season (except Mg2+ in the MS), and K+ and Na+ of stemflow in the DB showed significant variations (p < 0.05) (Figure 6). The inputs of K+, Na+, Ca2+ and Mg2+ in stemflow in the rainy season accounted for 57%–74%, 62%–69%, 62%–66% and 49%–55% of the annual flux, respectively.

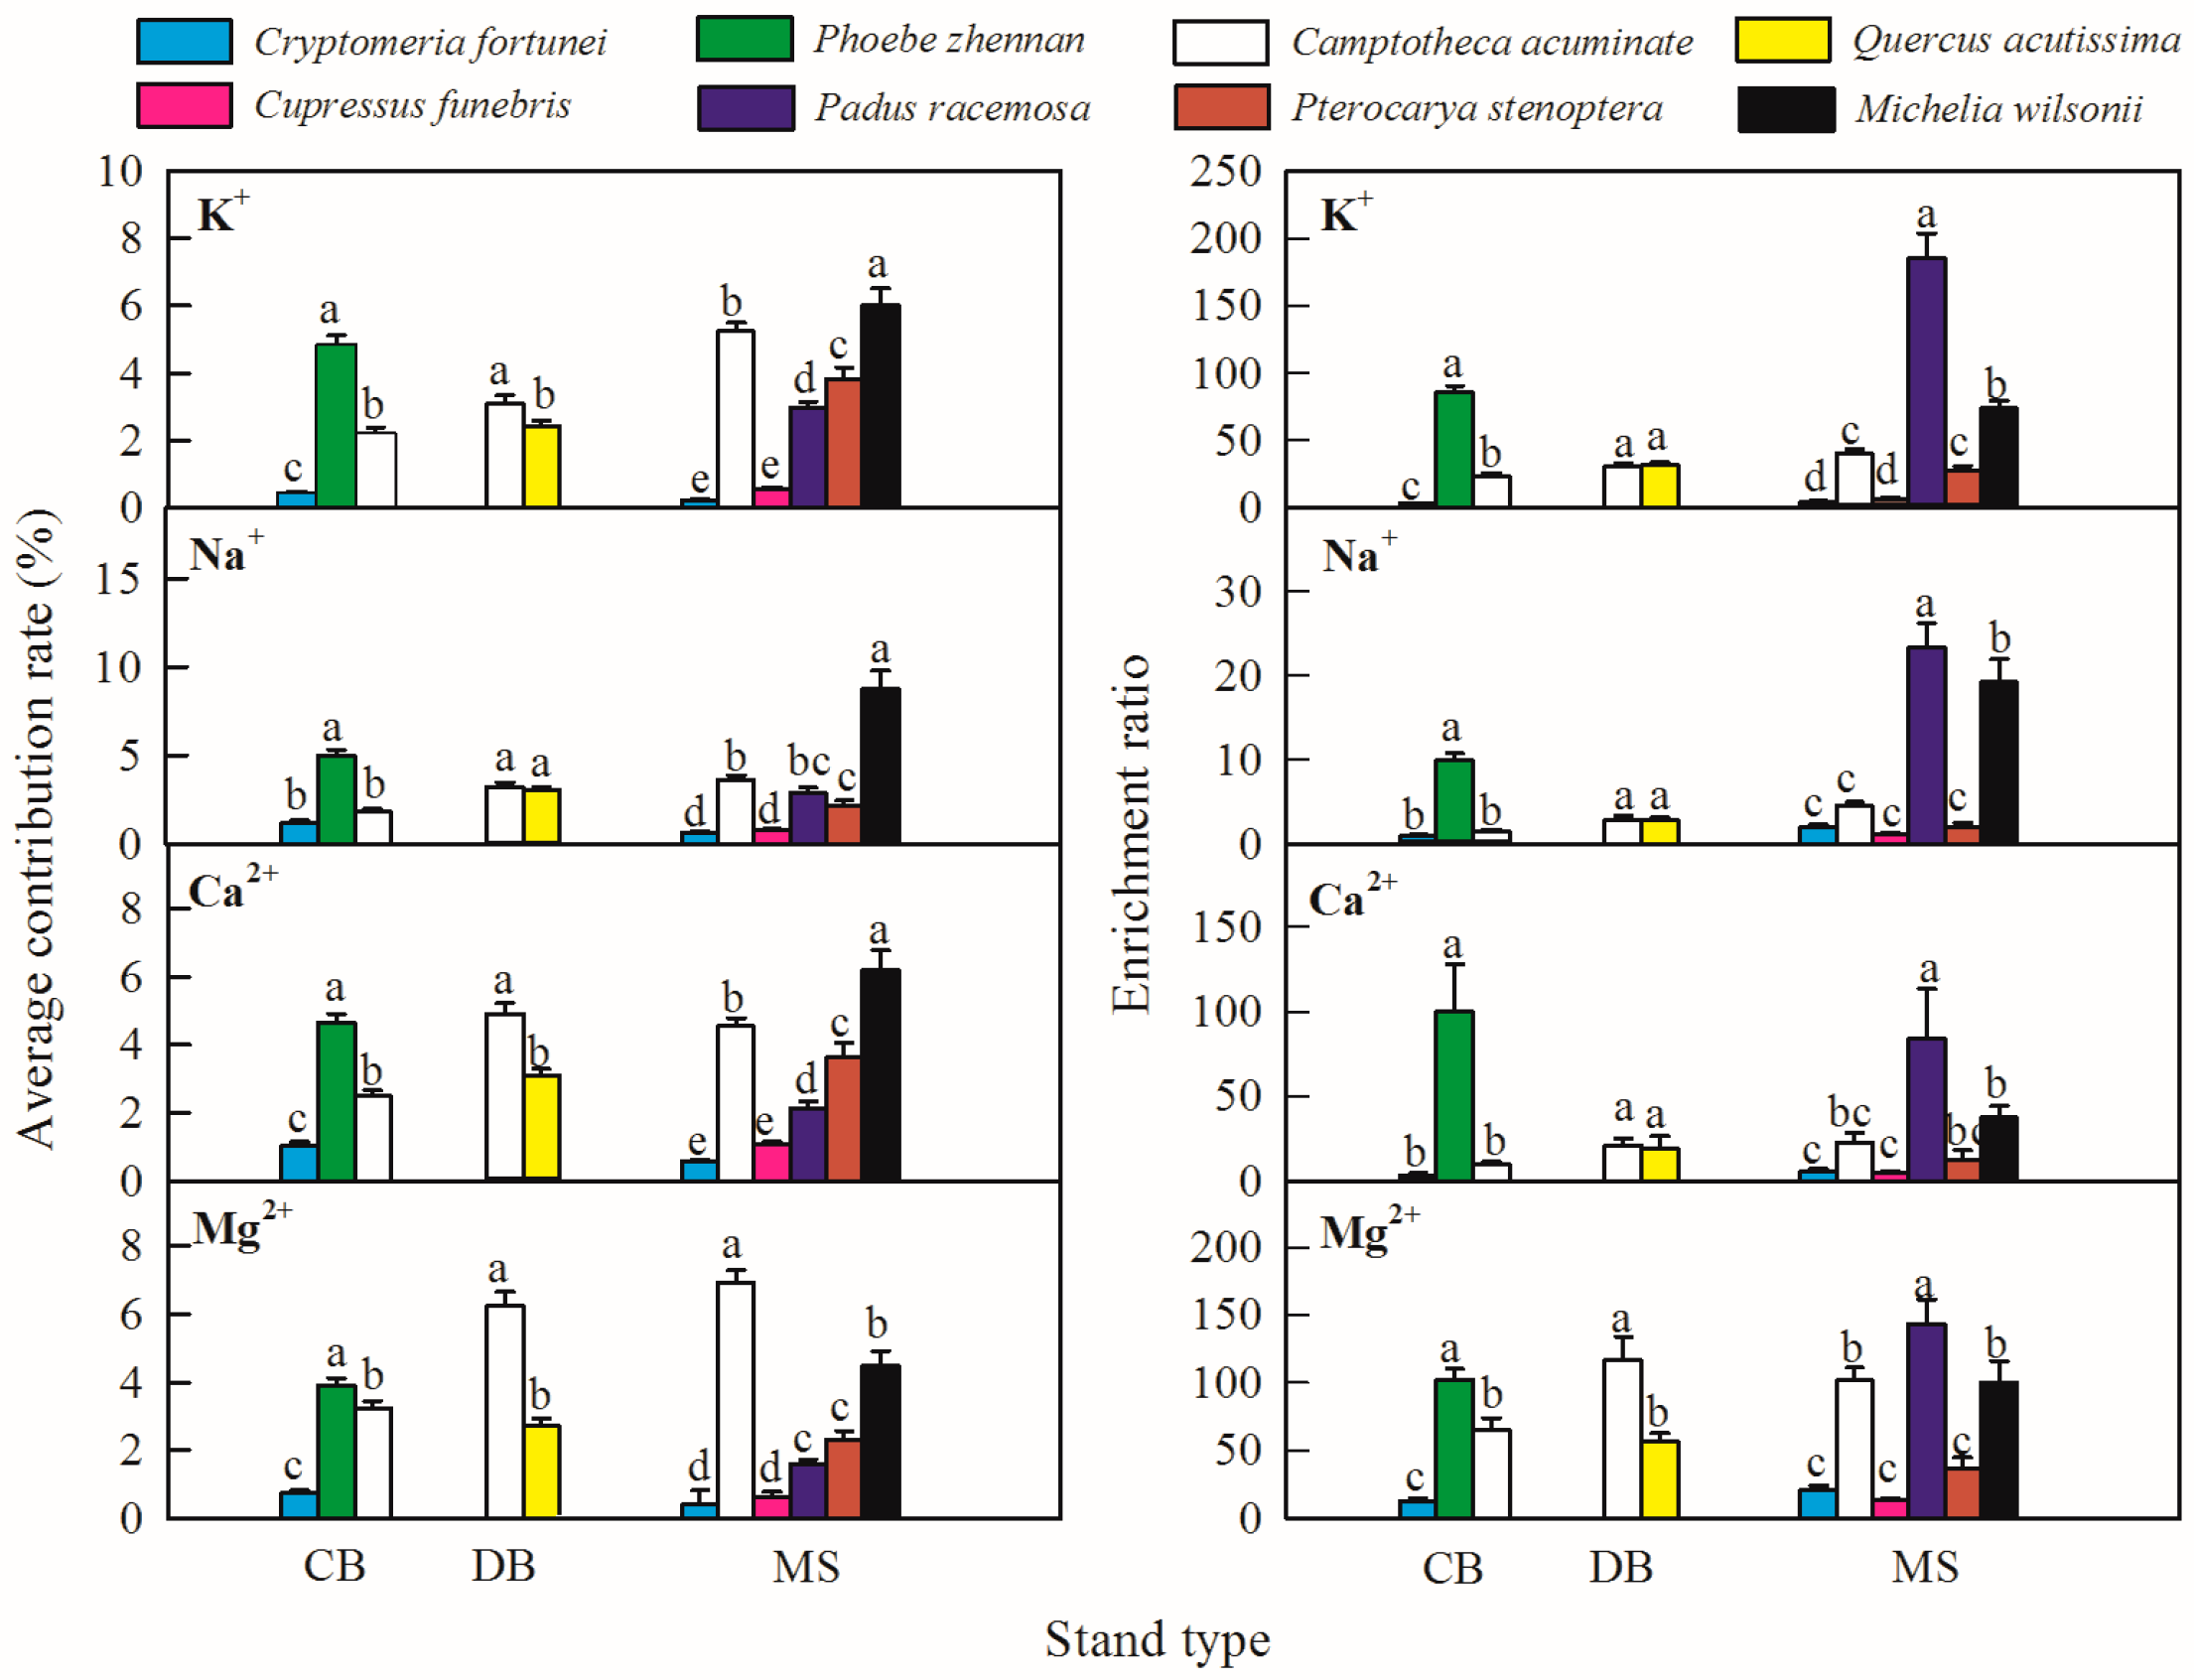
3.3. The Contribution and Enrichment Effects of the Afforestation Trees

In the CB, Phoebe zhennan had the highest average contribution rate and enrichment ratio of all the base cations (K+, Na+, Ca2+ and Mg2+) in the stemflow, followed by Camptotheca acuminate, and Cryptomeria fortunei had the lowest. C. acuminata had significantly higher (p < 0.05) average contribution rates of K+, Ca2+ and Mg2+ in the stemflow but a lower enrichment ratio of Mg2+ than Quercus acutissima in the DB. In the MS, all the average base cation contributions of C. fortune and Cupressus funebris were significantly lower (p < 0.05) than those of the other tree species, and the enrichment ratios were also lower. These results indicate that the average base cation contribution rates and flux-based enrichment ratios in the stemflow in broadleaved trees (i.e., Padus racemosa, Pterocarya stenoptera, Michelia wilsonii, C. acuminate, Q. acutissima, and P. zhennan) were higher than those in coniferous trees (i.e., C. funebris and C. fortunei) (Figure 7). Moreover, tree diameter had significant effects (p < 0.05) on the tree contributions of base cations in the stemflow but varied inconsistently in the three mixed plantations. However, the enrichment ratios showed a decreasing tendency with increasing trunk diameter (Figure 8).

4. Discussion

Inconsistent with our hypothesis that stemflow base cation flux varied significantly among different mixed plantations, we found that the annual and seasonal base cation (K+, Na+, Ca2+ and Mg2+) flux in stemflow varied slightly with stand type. The base cation flux from stemflow in the three mixed plantations were relatively higher in the rainy season than in the dry season, which agreed with our hypothesis. Moreover, we also found that the stemflow base cation contribution rate and flux-based enrichment ratio in broadleaved trees were higher than those in coniferous trees, and they varied greatly with trunk diameter.
The annual fluxes of K+, Na+, Ca2+ and Mg2+ in stemflow respectively ranged from 1.75 to 2.44 kg ha−1 year−1, 0.14 to 0.24 kg ha−1 year−1, 1.25 to 2.11 kg ha−1 year−1, and 0.40 to 0.60 kg ha−1 year−1 in our studied mixed plantations. However, studies conducted in other regions showed different results, which range from 1.1 to 14.5 kg ha−1 year−1, 0.06 to 0.9 kg ha−1 year−1, 0.3 to 6.0 kg ha−1 year−1 and 0.1 to 1.7 kg ha−1 year−1 for K+, Na+, Ca2+ and Mg2+, respectively [27,28,29]. By comparison, our annual K+, Na+ and Mg2+ fluxes were relatively lower, and the Ca2+ flux was higher than that in the other studies. The differences in stemflow base cation flux were attributed to many factors, such as geographic location, atmospheric environment, stand density, soil properties and tree species composition [14,30,31]. High atmospheric deposition in the rainy zone of western China [32] increased base cation deposition into stemflow, especially for Ca2+, whose wet deposition reached 102 kg ha−1 year−1 in our study. Because of the active mobility of K+ [33], high deposition of Ca2+, K+ and Ca2+ in the stemflow were more abundant than Na+ and Mg2+.
Our results indicated that the annual and seasonal fluxes of base cations in stemflow were not significantly different in the three mixed plantations. However, significant differences in the base cation flux of stemflow were found among the trees in the stands. Both the average contribution rate and stemflow enrichment ratio of C. funebris and C. fortunei were lower than those of other species in the CB and MS, indicating coniferous trees were not good at enriching base cations and furthermore contribute less to stands. This could be attributed to the differences in bark morphology. The thick, fibrous bark of C. funebris and C. fortunei favors water storage that impedes stemflow generation and ion transportation [17,34]; thick bark did not allow stemflow to access the inner bark and limited ionic exchange between the stemflow and trunk [18,35]. Thus, less stemflow base cation flux was produced by coniferous trees, while the thinner bark of P. zhennan and M. wilsonii were more conductive to this. Secondly, the furrowed bark of C. acuminata, Q. acutissima and P. stenoptera had a drainage function, which was better at stemflow nutrient transportation than C. funebris and C. fortunei. The similar bark morphology of northern red oak (Q. rubra) also produced larger stemflow solute inputs in the study of Levia and Herwitz [17]. Furthermore, the differences in stemflow nutrient inputs among the tree species were partly attributable to the nutrient status [36]. Needle species had a lower ability than the fresh foliage of broadleaved species to concentrate Ca2+, Mg2+ and K+ [37], thus the base cations status of coniferous trees may be lower than that of broadleaved trees, which limits the leachate producing stemflow solutes. These findings suggested that stemflow solutes of tree species were decided by the trunk more than the leaves.
For diameter classes, trees did not express a consistent trend of average contribution rate of stemflow base cation in the three mixed plantations. However, larger class size trees and palms produced higher solute flux in stemflow in an Amazonian rainforest [19]. The difference was that we used mixed species in this research while the results in the Amazonian rainforest were carried out on the same species. As we showed above, tree species had a significant impact on stemflow chemical fluxes, which may disturb the regularity of the tree diameters on the base cation contribution. It suggested that tree species may exert a more influential effect than tree diameter. The stemflow enrichment of small-diameter trees tended to be higher than that of large-diameter trees. This was similar to the result found by Schooling et al. [38] for urban park trees in British Columbia, Canada, reporting smaller trees (<20 cm DBH) had larger flux-based enrichment ratios than larger trees. These findings indicate that small-diameter trees contribute more stemflow base cations to stand stemflow per hectare, and they also promote a more favorable condition for the growth of small-diameter trees when competing with large-diameter trees. This phenomenon could be largely attributed to the small basal area, as the enrichment ratio was calculated by the unit area.
The proportions of coniferous trees in the DB, CB and MS were 0%, 18% and 50%, respectively. C. funebris and C. fortunei accounted for 50% of the MS, while the contribution rate of base cation fluxes in the stemflow was only 9–18%. However, the large proportion of coniferous trees in the MS did not lower the base cation fluxes in the stand stemflow compared with the results in the DB and CB. This finding may result from the higher stand density in the MS which had more stemflow chemical input points to enhance the fluxes. Understandably, the increasing effect of the higher stand density and decreasing effect of the major inefficient stemflow solute producers balanced the base cation flux in the stand stemflow. In the CB, the large proportion of evergreen broadleaved trees, mainly P. zhennan (44%), neutralized the impact of coniferous trees and improved the fluxes. Briefly, two opposite effects determined the difference between the forests. Neary and Gizyn [39] suggested that K+ primarily leached from the canopy during senescence and from the tree trunk primarily during the dormant stage. DB with a coniferous tree proportion of 0% was advantageous in both ways. Nevertheless, the DB had the highest stemflow concentration of K+ (Figure 3) but the lowest stemflow volume (Figure 9) and did not express obviously higher ionic fluxes. Moreover, the concentrations of Na+ and Ca2+ in the stemflow varied slightly with stand type. Mg2+ was marginally significant (Figure 3 and Figure 4), while the stemflow volume among the different stand types was insignificant (Figure 9). Thus, the fluxes did not vary greatly with stand type. Additionally, the difference in interspecific stemflow solute fluxes at the stand scale was also narrowed due to the spread of tree stemflow in the stand.
Seasonal variations in base cation concentration and flux were observed in the studied plantations. The results showed that higher concentrations of stemflow base cations were observed in the dry season. Greater dry season stemflow base cation concentration may be partly attributed to increasing deposition accumulated during long antecedent dry periods, and a small amount of rainfall adequately coming in contact with the trunk [2,20]. However, the rainy season shortened the contact time and was more effectively diluted due to the increased precipitation intensity and frequency [33,40]. Relatively higher base cation fluxes in the stemflow were found in the rainy season, this is attributable to large water volumes in the rainy season. Water volume is the foremost factor in deposition rates [41,42], and the wet deposition of K+, Na+ and Ca2+ in the rainy season accounted for 71–79% (data not displayed) of the annual wet deposition, contributing more to stemflow. In addition, based on early observations of the flora in China, most trees flower and fruit in the studied forest during the rainy season, which may attract more animals (e.g., birds, pollinators and insects) during this period. Animal activity increases the production of excrement and damages leaves and fruits, and these nutrients are likely to be washed off into the soil by rainwater [20]. Even so, K+ and Na+ showed a significant difference in seasons only in the DB. This may be explained by the fact that deciduous forests reduce canopy surface area in the dry season, intercepting less dry deposition due to leaf abscission. The higher base cation inputs in the rainy season suggested the driving effect of bulk precipitation on the forest nutrient cycle, and abundant precipitation could provide nutrients for forest growth during this period.

5. Conclusions

We conclude that both the annual and seasonal base cation flux varied slightly in the three mixed plantations, while the annual average concentrations of K+ and Mg2+ were significantly different among the plantations. The base cation concentrations in stemflow were generally high in the dry season, but relatively abundant fluxes were input to the stands in the rainy season. The flux of concentrated base cations to the near-stem soil via stemflow in the mixed plantations was apparently different. Both the average contribution rates and enrichment ratios of the broadleaved trees were higher than those of the coniferous trees in our study, which were not good at enriching stemflow base cations and had lower nutrient input capacity, but this still needs to be extensively studied in more coniferous species. Small-diameter class trees could enrich more stemflow base cations than large-diameter class trees per hectare. These findings suggested that increasing the proportion of broadleaved species in mixed plantations might improve soil nutrient content and benefit material cycling in subtropical forest ecosystems.

Author Contributions

W.Y. conceived and designed the experiment; L.J. collected samples; W.Y. and B.T. contributed resources; Y.L. completed the experiment; Y.L., and W.Y. wrote the paper; B.T., H.L., C.Y. and S.T. participated in field survey.

Funding

This research was funded by the National Natural Science Foundation of China, grant number 31570445.

Acknowledgments

We are grateful to Rui Cao and Yu Zhang for their help with the suggestions of data analysis.

Conflicts of Interest

The authors declare no conflict of interest.

References

  1. Mahendrappa, M.K. Partitioning of rainwater and chemicals into throughfall and stemflow in different forest stands. For. Ecol. Manag. 1990, 30, 65–72. [Google Scholar] [CrossRef]
  2. Levia, D.F.; Frost, E.E. A review and evaluation of stemflow literature in the hydrologic and biogeochemical cycles of forested and agricultural ecosystems. J. Hydrol. 2003, 274, 1–29. [Google Scholar] [CrossRef]
  3. Van Stan, J.T.; Gordon, D.A. Mini-Review: Stemflow as a resource limitation to near-stem soils. Front. Plant Sci. 2018, 9. [Google Scholar] [CrossRef] [PubMed]
  4. Zhang, Y.; Wang, X.; Hu, R.; Pan, Y.; Zhang, H. Stemflow in two xerophytic shrubs and its significance to soil water and nutrient enrichment. Ecol. Res. 2013, 28, 567–579. [Google Scholar] [CrossRef]
  5. Tan, S.; Zhao, H.; Yang, W.; Tan, B.; Ni, X.; Yue, K.; Zhang, Y.; Wu, F. The effect of canopy exchange on input of base cations in a subalpine spruce plantation during the growth season. Sci. Rep. UK 2018, 8, 9373. [Google Scholar] [CrossRef]
  6. Eaton, J.S.; Likens, G.E.; Bormann, F.H. Throughfall and stemflow chemistry in a northern hardwood forest. J. Ecol. 1973, 61, 495–508. [Google Scholar] [CrossRef]
  7. Crozier, C.R.; Boerner, R.E.J. Correlations of understory herb distribution patterns with microhabitats under different tree species in a mixed mesophytic forest. Oecologia 1984, 62, 337–343. [Google Scholar] [CrossRef]
  8. Falkengren-Grerup, U. Effect of stemflow on beech forest soils and vegetation in Southern Sweden. J. Appl. Ecol. 1989, 26, 341–352. [Google Scholar] [CrossRef]
  9. Whitford, W.G.; Anderson, J.; Rice, P.M. Stemflow contribution to the “fertile island” effect in creosotebush, Larrea tridentata. J. Arid Environ. 1997, 35, 451–457. [Google Scholar] [CrossRef]
  10. Aboal, J.R.; Saavedra, S.; Hernández-Moreno, J.M. Edaphic heterogeneity related to below-canopy water and solute fluxes in a Canarian laurel forest. Plant Soil 2014, 387, 177–188. [Google Scholar] [CrossRef]
  11. Lei, S.; Xu, W.; Zhao, C.; Xie, Z.; Ju, H. Inter- and intra-specific variation in stemflow for evergreen species and deciduous tree species in a subtropical forest. J. Hydrol. 2016, 537, 1–9. [Google Scholar]
  12. Jian, S.; Zhang, X.; Li, D.; Wang, D.; Wu, Z.; Hu, C. The effects of stemflow on redistributing precipitation and infiltration around shrubs. J. Hydrol. Hydromech. 2018, 66, 79–86. [Google Scholar] [CrossRef]
  13. Ellison, D.; Morris, C.E.; Locatelli, B.; Sheil, D.; Cohen, J.; Murdiyarso, D.; Gutierrez, V.; Noordwijk, M.; Creed, I.F.; Pokorny, J.; et al. Trees, forests and water: Cool insights for a hot world. Glob. Environ. Chang. 2017, 43, 51–61. [Google Scholar] [CrossRef]
  14. Levia, D.F.; Germer, S. A review of stemflow generation dynamics and stemflow-environment interactions in forests and shrublands. Rev. Geophys. 2015, 53, 673–714. [Google Scholar] [CrossRef]
  15. Schrijver, A.D.; Geudens, G.; Augusto, L.; Staelens, J.; Mertens, J.; Wuyts, K.; Gielis, L.; Verheyen, K. The effect of forest type on throughfall deposition and seepage flux: A review. Oecologia 2007, 153, 663–674. [Google Scholar] [CrossRef]
  16. Robertson, S.M.C.; Hornung, M.; Kennedy, V.H. Water chemistry of throughfall and soil water under four tree species at Gisburn, northwest England, before and after felling. For. Ecol. Manag. 2000, 129, 101–117. [Google Scholar] [CrossRef]
  17. Levia, D.F.; Herwitz, S.R. Interspecific variation of bark water storage capacity of three deciduous tree species in relation to stemflow yield and solute flux to forest soils. Catena 2005, 64, 117–137. [Google Scholar] [CrossRef]
  18. André, F.; Jonard, M.; Ponette, Q. Effects of biological and meteorological factors on stemflow chemistry within a temperate mixed oak-beech stand. Sci. Total Environ. 2008, 393, 72–83. [Google Scholar] [CrossRef]
  19. Germer, S.; Zimmermann, A.; Neill, C.; Krusche, A.V.; Elsenbeer, H. Disproportionate single-species contribution to canopy-soil nutrient flux in an Amazonian rainforest. For. Ecol. Manag. 2012, 267, 40–49. [Google Scholar] [CrossRef]
  20. Tobón, C.; Sevink, J.; Verstraten, J.M. Solute fluxes in throughfall and stemflow in four forest ecosystems in northwest Amazonia. Biogeochemistry 2004, 70, 1–25. [Google Scholar] [CrossRef]
  21. Van Stan, J.T.; Levia, D.F.; Inamdar, S.P.; Lepori-Bui, M.; Mitchell, M.J. The effects of phenoseason and storm characteristics on throughfall solute washoff and leaching dynamics from a temperate deciduous forest canopy. Sci. Total Environ. 2012, 430, 48–58. [Google Scholar] [CrossRef] [PubMed]
  22. Cai, C.; Huang, J. Seasonal dynamics of soil N pools under Phoebe zhennan, Cunninghamia lanceolata (Lamb.) and evergreen broad-leaved forests in Dujiangyan Region, Sichuan, China. Acta Ecol. Sin. 2006, 26, 2540–2548. (In Chinese) [Google Scholar]
  23. Liu, Q.; Zhuang, L.Y.; Ni, X.Y.; You, C.M.; Yang, W.Q.; Wu, F.Z.; Tan, B.; Yue, K.; Liu, Y.; Zhang, L.; et al. Nitrogen additions stimulate litter humification in a subtropical forest, southwestern China. Sci. Rep. UK 2018, 8. [Google Scholar] [CrossRef] [PubMed]
  24. Zhuang, P. The concept of the rainy zone of west China and its significance to the biodiversity conservation in China. Chin. Biodivers. 2002, 10, 339–344. (In Chinese) [Google Scholar]
  25. Nakanishi, A.; Shibata, H.; Inokura, Y.; Nakao, T.; Toda, H.; Satoh, F.; Sasa, K. Chemical characteristics in stemflow of Japanese Cedar in Japan. Water Air Soil Pollut. 2001, 130, 709–714. [Google Scholar] [CrossRef]
  26. Levia, D.F.; Herwitz, S.R. Physical properties of water in relation to stemflow leachate dynamics: Implications for nutrient cycling. Can. J. For. Res. 2000, 30, 662–666. [Google Scholar] [CrossRef]
  27. Hölscher, D.; Köhler, L.; Leuschner, C.; Kappelle, M. Nutrient fluxes in stemflow and throughfall in three successional stages of an upper montane rain forest in Costa Rica. J. Trop. Ecol. 2003, 19, 557–565. [Google Scholar] [CrossRef]
  28. Hofhansl, F.; Wanek, W.; Drage, S.; Huber, W.; Weissenhofer, A.; Richter, A. Controls of hydrochemical fluxes via stemflow in tropical lowland rainforests: Effects of meteorology and vegetation characteristics. J. Hydrol. 2012, 452–453, 247–258. [Google Scholar] [CrossRef]
  29. Liu, W.; Fox, J.E.D.; Xu, Z. Nutrient fluxes in bulk precipitation, throughfall and stemflow in montane subtropical moist forest on Ailao Mountains in Yunnan, South-West China. J. Trop. Ecol. 2002, 18, 527–548. [Google Scholar] [CrossRef]
  30. Olson, R.K.; Reiners, W.A.; Cronan, C.S.; Lang, G.E. The chemistry and flux of throughfall and stemflow in subalpine balsam fir forests. Ecography 1981, 4, 291–300. [Google Scholar] [CrossRef]
  31. Corti, G.; Agnelli, A.; Cocco, S.; Cardelli, S.; Masse, J.; Courchesne, F. Soil affects throughfall and stemflow under Turkey oak (Quercus cerris L.). Geoderma 2019, 333, 43–56. [Google Scholar] [CrossRef]
  32. Xu, Z.; Tu, L.; Hu, T.; Schädler, M. Implications of greater than average increases in nitrogen deposition on the western edge of the Szechwan Basin, China. Environ. Pollut. 2013, 177, 201–202. [Google Scholar] [CrossRef] [PubMed]
  33. Scheer, M.B. Mineral nutrient fluxes in rainfall and throughfall in a lowland Atlantic rainforest in southern Brazil. J. For. Res. 2011, 16, 76–81. [Google Scholar] [CrossRef]
  34. Reid, L.M.; Lewis, J. Rates, timing, and mechanisms of rainfall interception loss in a coastal redwood forest. J. Hydrol. 2009, 375, 459–470. [Google Scholar] [CrossRef]
  35. Crockford, R.H.; Richardson, D.P.; Sageman, R. Chemistry of rainfall, throughfall and stemflow in a eucalypt forest and a pine plantation in south-eastern Australia: 3. Stemflow and total inputs. Hydrol. Process. 1996, 10, 25–42. [Google Scholar] [CrossRef]
  36. De Balieiro, F.C.; Franco, A.A.; Fontes, R.L.F.; Dias, L.E.; Campello, E.F.C.; de Faria, S.M. Evaluation of the throughfall and stemflow nutrient contents in mixed and pure plantations of Acacia mangium, Pseudosamenea guachapele and Eucalyptus grandis. Rev. Árvore 2007, 31, 339–346. [Google Scholar] [CrossRef] [Green Version]
  37. Carnol, M.; Bazgir, M. Nutrient return to the forest floor through litter and throughfall under 7 forest species after conversion from Norway spruce. For. Ecol. Manag. 2013, 309, 66–75. [Google Scholar] [CrossRef]
  38. Schooling, J.T.; Levia, D.F.; Carlyle-Moses, D.E.; Dowtin, A.L.; Brewer, S.E.; Donkor, S.A.; Borden, S.A.; Grzybowski, A.A. Stemflow chemistry in relation to tree size: A preliminary investigation of eleven urban park trees in British Columbia, Canada. Urban For. Urban Green. 2017, 21, 129–133. [Google Scholar] [CrossRef]
  39. Neary, A.J.; Gizyn, W.I. Throughfall and stemflow chemistry under deciduous and coniferous forest canopies in south-central Ontario. Can. J. For. Res. 1994, 24, 1089–1100. [Google Scholar] [CrossRef]
  40. Levia, D.F. Winter stemflow leaching of nutrient-ions from deciduous canopy trees in relation to meteorological conditions. Agric. For. Meteorol. 2003, 117, 39–51. [Google Scholar] [CrossRef]
  41. Levia, D.F.; Frost, E.E. Variability of throughfall volume and solute inputs in wooded ecosystems. Prog. Phys. Geogr. 2006, 30, 605–632. [Google Scholar] [CrossRef]
  42. Macinnis-Ng, C.M.O.; Flores, E.E.; Müller, H.; Schwendenmann, L. Rainfall partitioning into throughfall and stemflow and associated nutrient fluxes: Land use impacts in a lower montane tropical region of Panama. Biogeochemistry 2012, 111, 661–676. [Google Scholar] [CrossRef]
Figure 1. The formation of stemflow in forests.
Forests 10 01101 g001
Figure 2. Locations of the rainy zone of western China and the study site in Dujiangyan City, Sichuan Province. The gray area represents the rainy zone of western China [24]. Three 15 m × 15 m plots were chosen in the conifer–broadleaved mixed plantation (CB), deciduous broadleaved mixed plantation (DB) and multispecies mixed plantation (MS), respectively.
Forests 10 01101 g002
Figure 3. Dynamics of base cation concentration in the stemflow during the rainy and dry season in the rainy zone of western China. Gray shadow represents the rainy season. OA = base cation concentration in the rainfall; CB, DB and MS = stemflow base cation concentration in the plantations. The bar charts represent the annual average concentration (mg L−1) of rainwater of corresponding colors. Different lower case letters are significant differences of rainwater base cation concentration among different areas as evaluated by ANOVA followed by Duncan’s multiple range test.
Forests 10 01101 g003
Figure 4. Seasonal concentrations of base cations in the stemflow during the rainy and dry season. Different capital letters are significant differences between dry and rainy season stemflow base cation concentration as evaluated by student’s t-test. Different lower case letters are significant differences in stemflow base cation concentration among different stands during the same season as evaluated by ANOVA followed by Duncan’s multiple range test.
Forests 10 01101 g004
Figure 5. Dynamics of base cation flux in the stemflow during the rainy and dry season in the rainy zone of western China. Gray shadow represents the rainy season. OA = base cation flux in the rainfall; CB, DB and MS = stemflow base cation flux in the plantations. The bar charts represent the annual input (kg−1 ha−1 year−1) of the rainwater of corresponding colors. Different lower case letters are significant differences in rainwater base cation flux among different areas as evaluated by ANOVA followed by Duncan’s multiple range test.
Forests 10 01101 g005
Figure 6. Seasonal fluxes of base cations in the stemflow during the rainy and dry season. Different capital letters are significant differences in dry and rainy season stemflow base cation flux as evaluated by student’s t-test. Different lower case letters are significant differences of stemflow base cation flux among different stands during the same season as evaluated by ANOVA followed by Duncan’s multiple range test.
Forests 10 01101 g006
Figure 7. Average base cation contribution rates and enrichment ratios of different tree species in the stemflow in mixed plantations. Different lower case letters are significant differences in the average contribution rate or enrichment ratio among different tree species in the CB or MS as evaluated by ANOVA followed by Duncan’s multiple range test, and those between tree species in the DB were evaluated by student’s t-test.
Forests 10 01101 g007
Figure 8. Average base cation contribution rates and enrichment ratios of trees with different DBH classes in the stemflow in mixed plantations. Different lower case letters are significant differences of average contribution rate or enrichment ratio among trees with different diameter classes in the plantations as evaluated by ANOVA followed by Duncan’s multiple range test.
Forests 10 01101 g008
Figure 9. Annual and seasonal stemflow volume in the three mixed plantations. Different capital letters show significant differences of stemflow volume among different stands as evaluated by ANOVA followed by Duncan’s multiple range test.
Forests 10 01101 g009
Table 1. Stand characteristics of the conifer–broadleaved mixed plantation (CB), deciduous broadleaved mixed plantation (DB) and multispecies mixed plantation (MS). DBH = diameter at breast height.
Stand TypeAltitude (m)Canopy DensityStand Density (Trees ha−1)Smallest DBH (cm)Largest DBH (cm)Total Basal Area (m2 ha−1)Tree Species Composition (Proportion)Proportion of Coniferous Tree SpeciesDiameter Classes Composition (Proportion)
CB10090.75504 ± 3014.049.040.92 ± 6.34Cryptomeria fortune (18%), Phoebe zhennan (44%), Camptotheca acuminate (38%)18%10–20 cm (12%), 20–30 cm (38%), 30–40 cm (26%), 40–50 cm (24%)
DB10270.85444 ± 2616.847.229.73 ± 4.87Quercus acutissima (70%), Phoebe zhennan (7%), Camptotheca acuminate (23%)0%10–20 cm (13%), 20–30 cm (54%), 30–40 cm (20%), 40–50 cm (13%)
MS9110.85622 ± 4410.161.847.23 ± 6.21Cupressus funebris (29%), Padus racemosa (10%), Pterocarya stenoptera (7%), Michelia wilsonii (10%), Cryptomeria fortune (21%), Alnus cremastogyne (4%), Camptotheca acuminate (19%)50%10–20 cm (21%), 20–30 cm (41%), 30–40 cm (24%), 40–50 cm (7%), 50–60 cm (5%), 60–70 cm (2%)
Table 2. Quantities of total trees and species fitted with stemflow collectors in each diameter class in the three mixed plantations.
Stand TypeTotal Trees in the PlotsTotal Trees Sampled in the Plots
Tree Species and Quantities (Brackets) in Each Diameter ClassTotal QuantityTree Species And Quantities (Brackets) in Each Diameter ClassTotal Quantity
CBP. zhennan: 10–20 cm (4), 20–30 cm (8), 30–40 cm (3);
C. acuminate: 20–30 cm (2), 30–40 cm (4), 40–50 cm (7);
C. fortune: 20–30 cm (3), 30–40cm (2), 40–50 cm (1).
34P. zhennan: 10–20 cm (3), 20–30 cm (3), 30–40 cm (3);
C. acuminate: 20–30 cm (2), 30–40 cm (3), 40–50 cm (3),
C. fortune: 20–30 cm (3), 30–40cm (2), 40–50 cm (1)
23
DBC. acuminate: 10–20 cm (1), 20–30 cm (3), 30–40 cm (1), 40–50 cm (2);
Q. acutissima: 10–20 cm (3), 20–30 cm (11), 30–40 cm (5), 40–50 cm (2);
P. zhennan: 20–30 cm (2).
30C. acuminate: 10–20 cm (1), 20–30 cm (3), 30–40 cm (1), 40–50 cm (2);
Q. acutissima: 10–20 cm (3), 20–30 cm (3), 30–40 cm (3), 40–50 cm (2);
P. zhennan: 20–30 cm (2).
20
MSA. cremastogyne: 10–20 cm (1), 40–50 cm (1);
C. acuminate: 20–30 cm (4), 30–40 cm (1), 40–50 cm (2), 50–60 cm (1);
C. fortune: 10–20 cm (3), 20–30 cm (2), 30–40 cm (4);
C. funebris: 20–30 cm (8), 30–40 cm (4);
M. wilsonii: 10–20 cm (1), 20–30 cm (2), 30–40 cm (1);
P. racemose: 10–20 cm (4);
P. stenoptera: 20–30 cm (1), 50–60 cm (1), 60–70 cm (1).
42A. cremastogyne: 10–20 cm (1), 40–50 cm (1);
C. acuminate: 20–30 cm (3), 30–40 cm (1), 40–50 cm (2), 50–60 cm (1);
C. fortune: 10–20 cm (3), 20–30 cm (2), 30–40 cm (3);
C. funebris: 20–30 cm (3), 30–40 cm (3);
M. wilsonii: 10–20 cm (1), 20–30 cm (2), 30–40 cm (1);
P. racemose: 10–20 cm (3);
P. stenoptera: 20–30 cm (1), 50–60 cm (1), 60–70 cm (1).
33
Table 3. Curve equation of precipitation and stemflow volume (mm) in plantations (n = 34).
Stand TypeCurve EquationR2p Value
CBY = 0.0066x − 0.0210.5980.000
DBY = 0.0047x − 0.04230.6230.000
MSY = 0.0053x + 0.03610.4800.000
Bold values indicate the effects of precipitation volume on the stemflow volume are significant (p < 0.05).

