Article

Elevation Gradient Altered Soil C, N, and P Stoichiometry of Pinus taiwanensis Forest on Daiyun Mountain

1
College of Forestry, Fujian Agriculture and Forestry University, Fuzhou 350002, China
2
Key Lab of Ecology and Resources Statistics of Fujian Colleges, Fuzhou 350002, China
3
Cross–Strait Nature Research Center of Fujian Agriculture and Forestry University, Fuzhou 350002, China
*
Author to whom correspondence should be addressed.
Forests 2019, 10(12), 1089; https://doi.org/10.3390/f10121089
Submission received: 6 November 2019 / Revised: 28 November 2019 / Accepted: 29 November 2019 / Published: 1 December 2019
(This article belongs to the Section Forest Ecology and Management)

Abstract

:
Researches focused on soil carbon (C), nitrogen (N), and phosphorus (P) content and the stoichiometry characteristics along elevation gradients are important for effective management of forest ecosystems. Taking the soil of different elevations from 900 to 1700 m on Daiyun Mountain as the object, the elevation distribution of total C, N, and P in soil and their stoichiometry characteristics were studied. Also, the driving factors resulting in the spatial heterogeneity of soil stoichiometry are presented. The results show the following: (1) The average soil C and N content was 53.03 g·kg−1 and 3.82 g·kg−1, respectively. The content of C and N at high elevation was higher than that of at low elevation. Soil phosphorus fluctuated with elevation. (2) With increasing elevation, soil C:N ratio increased initially to 17.40 at elevation between 900–1000 m, and then decreased to 12.02 at elevation 1600 m. The changing trends of C:P and N:P were similar, and they all fluctuated with elevation. (3) Elevation, soil bulk density, and soil temperature were the main factors influencing the variation of soil C, N, and C:N. Soil pH and slope position were the driving factors for soil P, C:P, and N:P. The soil is rich in C and N, and has less total phosphorus on Daiyun Mountain. Raising the level of phosphate fertilizer appropriately can help to improve soil fertility and promote plant growth as well. In light of this information, in the near future, it will be necessary to conduct separation management of C, N, and P with regular monitoring systems to maintain favorable conditions for soil.

1. Introduction

Soil is an important component and nutrient pool of ecosystems. Carbon (C), nitrogen (N), and phosphorus (P) in soil play essential roles in the growth of plants. However, even if the content of a single nutrient in soil is sufficient, it may not meet the requirements of plant growth. Only the proper stoichiometric ratio of nutrient elements is beneficial for the growth of plants [1]. Ecological stoichiometry can clarify soil nutrient abundance, plant nutrient availability, and reveal the main soil elements for limitation the community productivity [2]. Ecological stoichiometry focuses on the balance of multiple chemical elements in ecological processes, such as nutrient cycling and organic matter decomposition [3]. Carbon, nitrogen, and phosphorus are the fundamental chemical elements of life on the earth, and are also the main elements of ecological stoichiometry [4]. The contents of these elements and their ratios affect the main ecosystem processes [5]. For example, nitrogen is the basic element of plant photosynthetic organs, and there is a positive correlation between leaf nitrogen content and maximum net photosynthetic efficiency [6]. The nitrogen content of canopy leaves in the forest canopy can represent the photosynthetic capacity of the community to a certain extent, which determines ecosystem productivity [7]. In fact, ecological stoichiometry has been widely used in the study of plant growth, trace element determination, ecosystem stability, and biogeochemical cycling [8]. Recently, many studies have drawn attention to the traits of soil nutrient [8]. These researches found that soil stoichiometry has significant differences in grassland with various degradation [9], different forest types [10], and different succession stages [11]. In the Qinghai–Tibet Plateau, grazing cattle increase soil total carbon content and soil C:P, and total phosphorus content is decreased, while grazing sheep decrease soil C:P [9]. In the southwestern karst region of China, soil C:P and N:P are significantly lower in secondary forest than in natural forest, shrub, and grassland [10]. Soil C:N will also gradually decrease as the ecosystem succession progresses, which in turn will increase the ecosystem’s multifunctionality [11]. These researches are of vital significance and are substantially effective for the management of local soil and even the sustainable operation of forest ecosystems.
On the small scale, the main environmental factor affecting soil nutrient distribution is topography. Because mountains usually have large elevation differences, environmental factors such as light, precipitation, temperature, and soil nutrients will change drastically, forming a clear sequential gradient [12]. Thus, elevation is a particularly key factor among many topographical factors, and it has become an essential and basic window for environmental change response research. Along elevation gradients, heterogeneous habitat conditions cause differences in species composition, litter quality, and microbial communities of a forest. The combined effects of various factors affect the material and energy exchange between soil and environment, and thus change the nutrient flux in forest soil. Finally, there is an influence on the distribution and accumulation of soil nutrients [13]. At present, most studies on soil stoichiometry focus on large-scale latitude and longitude patterns [14], stoichiometry changes in different succession stages [11], and variations in vegetation types [10]. Small-scale elevation gradient studies are relatively rare. In the existing research, the stoichiometry ratios of soil nutrients do not change uniformly along elevation gradients. With increased elevation, soil C:P and N:P in the Dongting Lake area gradually increase [15], but gradually decrease on Taibai Mountain [16]. Soil C:N gradually decreases in the Himalayas with increased elevation [17], while in the Chinese subtropical region, soil C:N increases with elevation [18]. Geographic location, climate, precipitation, and micro-topography can all lead to different outcomes. Therefore, it is necessary to study soil stoichiometry along elevation gradients to identify the key factors affecting its distribution. It is beneficial to accumulate data for in-depth research of soil stoichiometry, and to promote the development of ecological stoichiometry application in theory and practice.
The Daiyun Mountain National Nature Reserve is located in the transitional zone between the southern subtropics and the middle subtropics. It preserves the typical southeastern coastal mountainous forest ecosystem of China. It is a refuge for ancient relic plants, acting as a natural biodiversity center, and is also one of the largest gene pools for studying biodiversity in Fujian Province [19]. The key protection target on Daiyun Mountain is the native Pinus taiwanensis Hayata community, with an area of 64 km2, which is also the southernmost, largest, and best preserved native P. taiwanensis community in the Chinese mainland [20]. Although some researchers have carried out related research on the soil of Daiyun Mountain, those studies were only aimed at the physical properties of soil water and spatial variation of nutrients [21,22], and most of them only described phenomena. They lacked discussions about intrinsic driving forces of soil stoichiometry. Therefore, based on previous research, we raised the following questions: What are the distribution characteristics of C, N, and P stoichiometry along elevation gradients? What is the main driving force affecting this distribution? These problems are the key to studying the soil stoichiometry of Daiyun Mountain. Revealing these problems can provide a theoretical basis for the effective management of mountain soil resources.

2. Materials and Methods
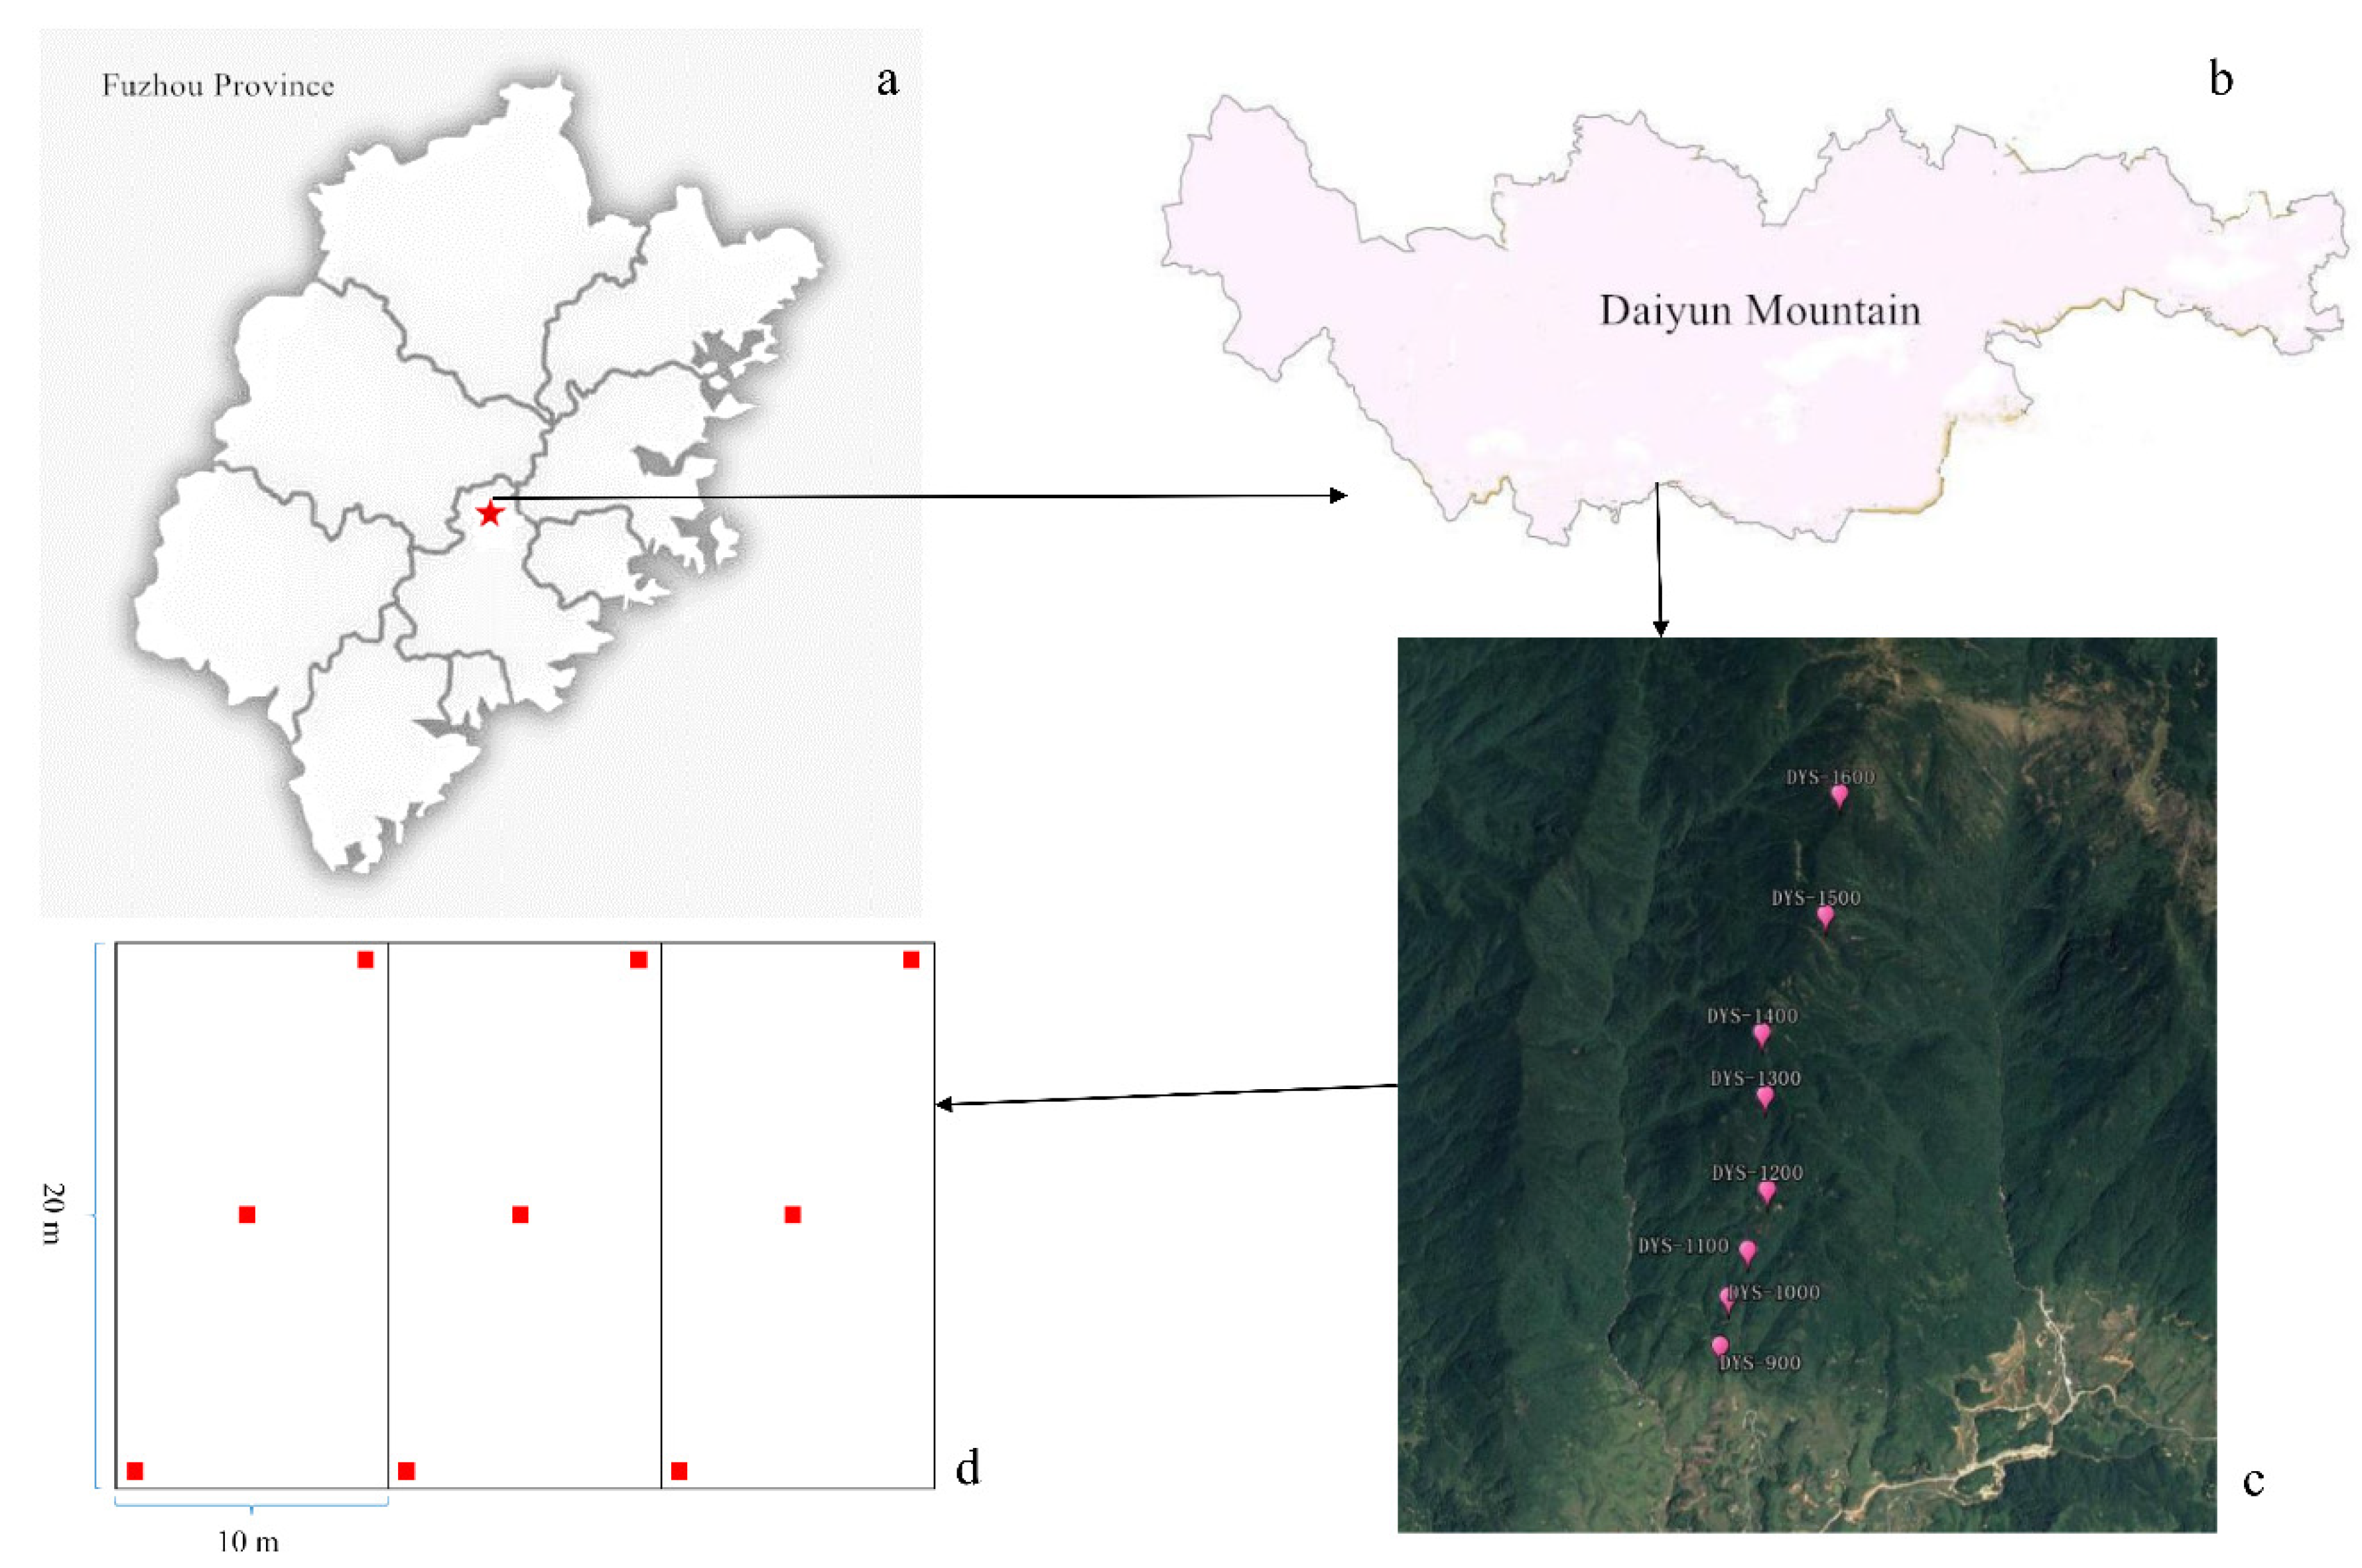
2.1. Study Site

Daiyun Mountain National Nature Reserve (25°38′07″–25°43′40″ N, 118°05′22″–118°20′15″ E) is located in Dehua County, Fujian Province, China. The highest peak of the mountain has a maximum elevation of 1856 m. The total area of the reserve is 134.72 km2. The study site has a southern subtropical and mid-subtropical climate with an average annual temperature of 15.6–19.5 °C [19]. The extreme minimum temperature is −16.8 °C, and extreme maximum temperature is 36.6 °C. The average annual precipitation is about 1700–2000 mm, along with average annual relative humidity of 80%. According to the World Reference Base for Soil Resources [23], the main type of soil in Daiyun Mountain is mountain Ferric acrisols soil. Daiyun Mountain is rich in plant resources that are distributed widely and randomly. The forest coverage rate is 93.4%. The typical vegetation types are coniferous and evergreen broad-leaved forest (CEBF) and coniferous forest (CF) [19].

2.2. Sample Plot Setting

At an elevation of 900–1700 m on the southern slope of Daiyun Mountain, we divided the elevation range into eight gradients with intervals of 100 m. Eight permanent sample plots were established at each elevation point (Figure 1c), away from areas already struck by natural disturbances or with obvious clues of artificial interference. Further, communities in those selected plots were expected to be representative (Table 1). A 20 × 30 m plot was set in each elevation gradient, and each plot was divided into three 10 × 20 m quadrats. Each quadrat had three repetitions of soil samples. There was a total of 72 soil samples, which were collected at the soil layer of 0–20 cm. General information of these plots are shown in Table 1. Considering the influence of vegetation types for the distribution of soil stoichiometry, we also calculated the alpha diversity of species in each plot. Species alpha diversity were calculated by Margalef, Simpson, Shannon–Wiener, and Pielou indices [24]. The calculation method referred to the study by Zhu et al. [24]. The diversity results showed in Table A1.

2.3. Data Collection

Soil temperature measurement: Soil temperature monitoring was done with an iButton temperature recorder (DS1922L-F50) produced by the Maxim Company, American. Its measurable amplitude is −20 to +85 °C, measurement accuracy is ±0.1%, and maximum temperature recording number is 4096. For field monitoring, the iButton temperature recorder was buried 10 cm below the ground and the data were set to be recorded every 2 h.
Measurement of soil physical and chemical properties: In the field, the soil profile was scraped at each soil sampling point. After removing the litter and organic matter from the upper layer of the soil section, we used a cutting ring to get soil cores at the 0–20 cm soil layer. A total of 72 soil core samples were collected. These soil core samples were used to measure soil water content (SWC) and soil bulk density (BD). Meanwhile, regular soil samples of the 0–20 cm soil layer were excavated by shovel. There were also 72 regular soil samples. After taking these soil samples back to the laboratory, we air-dried them for 12 days and ground them finely to pass through a 100-mesh sieve. The sieved samples were used to measure soil chemical properties: pH, total carbon (C), total nitrogen (N), total phosphorus (P), and soil C:N, C:P, and N:P ratios. The pH was measured by potentiometry. Total carbon and total nitrogen were determined by an elemental analyzer (vario MAX CN Elementar, Germany). Total phosphorus was determined by molybdenum antimony colorimetric method. The details of all of these methods refer to forest soil analysis methods [25].

2.4. Data Analysis

First, one-way analysis of variance (ANOVA) was used to analyze the differences in nutrient content along elevation gradients. Since the soil phosphorus content data did not fit for the normal distribution, the logarithm of soil phosphorus content was converted to conduct ANOVA analysis. Duncan test was used for multiple comparisons. Before multiple comparisons, in order to reduce the probability of class I error, the p-value was adjusted according to Bonferroni correction. The adjusted p-value is the original p-value multiplied by the number of multiple comparisons (n = 28). Adjusted p-value less than alpha-level as 0.05 indicates a significant difference. Pearson correlation analysis was used to study the correlations between soil stoichiometry. Second, redundancy analysis (RDA) was used to give an interpretation of environmental factors on soil carbon, nitrogen, and phosphorus and their stoichiometric distribution, and to determine the significant environmental factors that contribute to soil stoichiometry. Finally, stepwise regression analysis was used to explore the main environmental factors that affect the variation of single stoichiometry. ANOVA analysis was done in SPSS 17.0, and RDA and stepwise regression analysis were achieved with the vegan package of R 3.5.1 [26].

3. Results

3.1. Distribution Characteristics of Soil Physical and Chemical Properties

There was no significant difference in soil carbon and nitrogen among different elevations (adjusted p > 0.05) (Table 2). Soil carbon content on Daiyun Mountain varied from 39.18 to 74.11 g·kg−1 (Table 2). It was highest at elevation of 1000 m and lowest at 1200 m. The soil carbon content had large fluctuation from 39.18 to 74.11 g·kg−1 at low and middle elevation from 900 to 1300 m, while a tiny variation from 41.24 to 56.56 g·kg−1 at high elevation from 1400 to 1600 m. The soil nitrogen content varied from 3.12 to 4.57 g·kg−1, and was highest at elevation of 1500 m and lowest at 1200 m. In general, the contents of soil carbon and nitrogen were higher at high elevation between 1400 and 1600 m than at low and middle elevation between 900 and 1300 m. Soil phosphorus content fluctuated widely between elevations. The logarithm of soil phosphorus content on Daiyun Mountain ranged from −0.74 to −0.24 g·kg−1, with an average of −0.49 g·kg−1. The coefficient of variation (CV) of C and N was 38.3% and 31.58%, respectively, which was relative lower. However, the coefficient of variation of logarithm of phosphorus was larger, reaching 77.77%, which indicated that carbon and nitrogen were relatively stable, while phosphorus had larger variation. The soil of Daiyun Mountain was strongly acidic, with an average pH of 3.71, and the variation of soil pH coefficient was the smallest, only 4.03%. The soil water content increased between 900 and 1500 m and then decreased between 1500 and 1600 m. The average water content was 44.41%; the highest was 53.33% at 1500 m and the lowest was 35.56% at 900 m. Soil bulk density also fluctuated with elevation. Soil temperature gradually decreased with elevation, from 23.2 °C at 900 m to 19.0 °C at 1600 m.

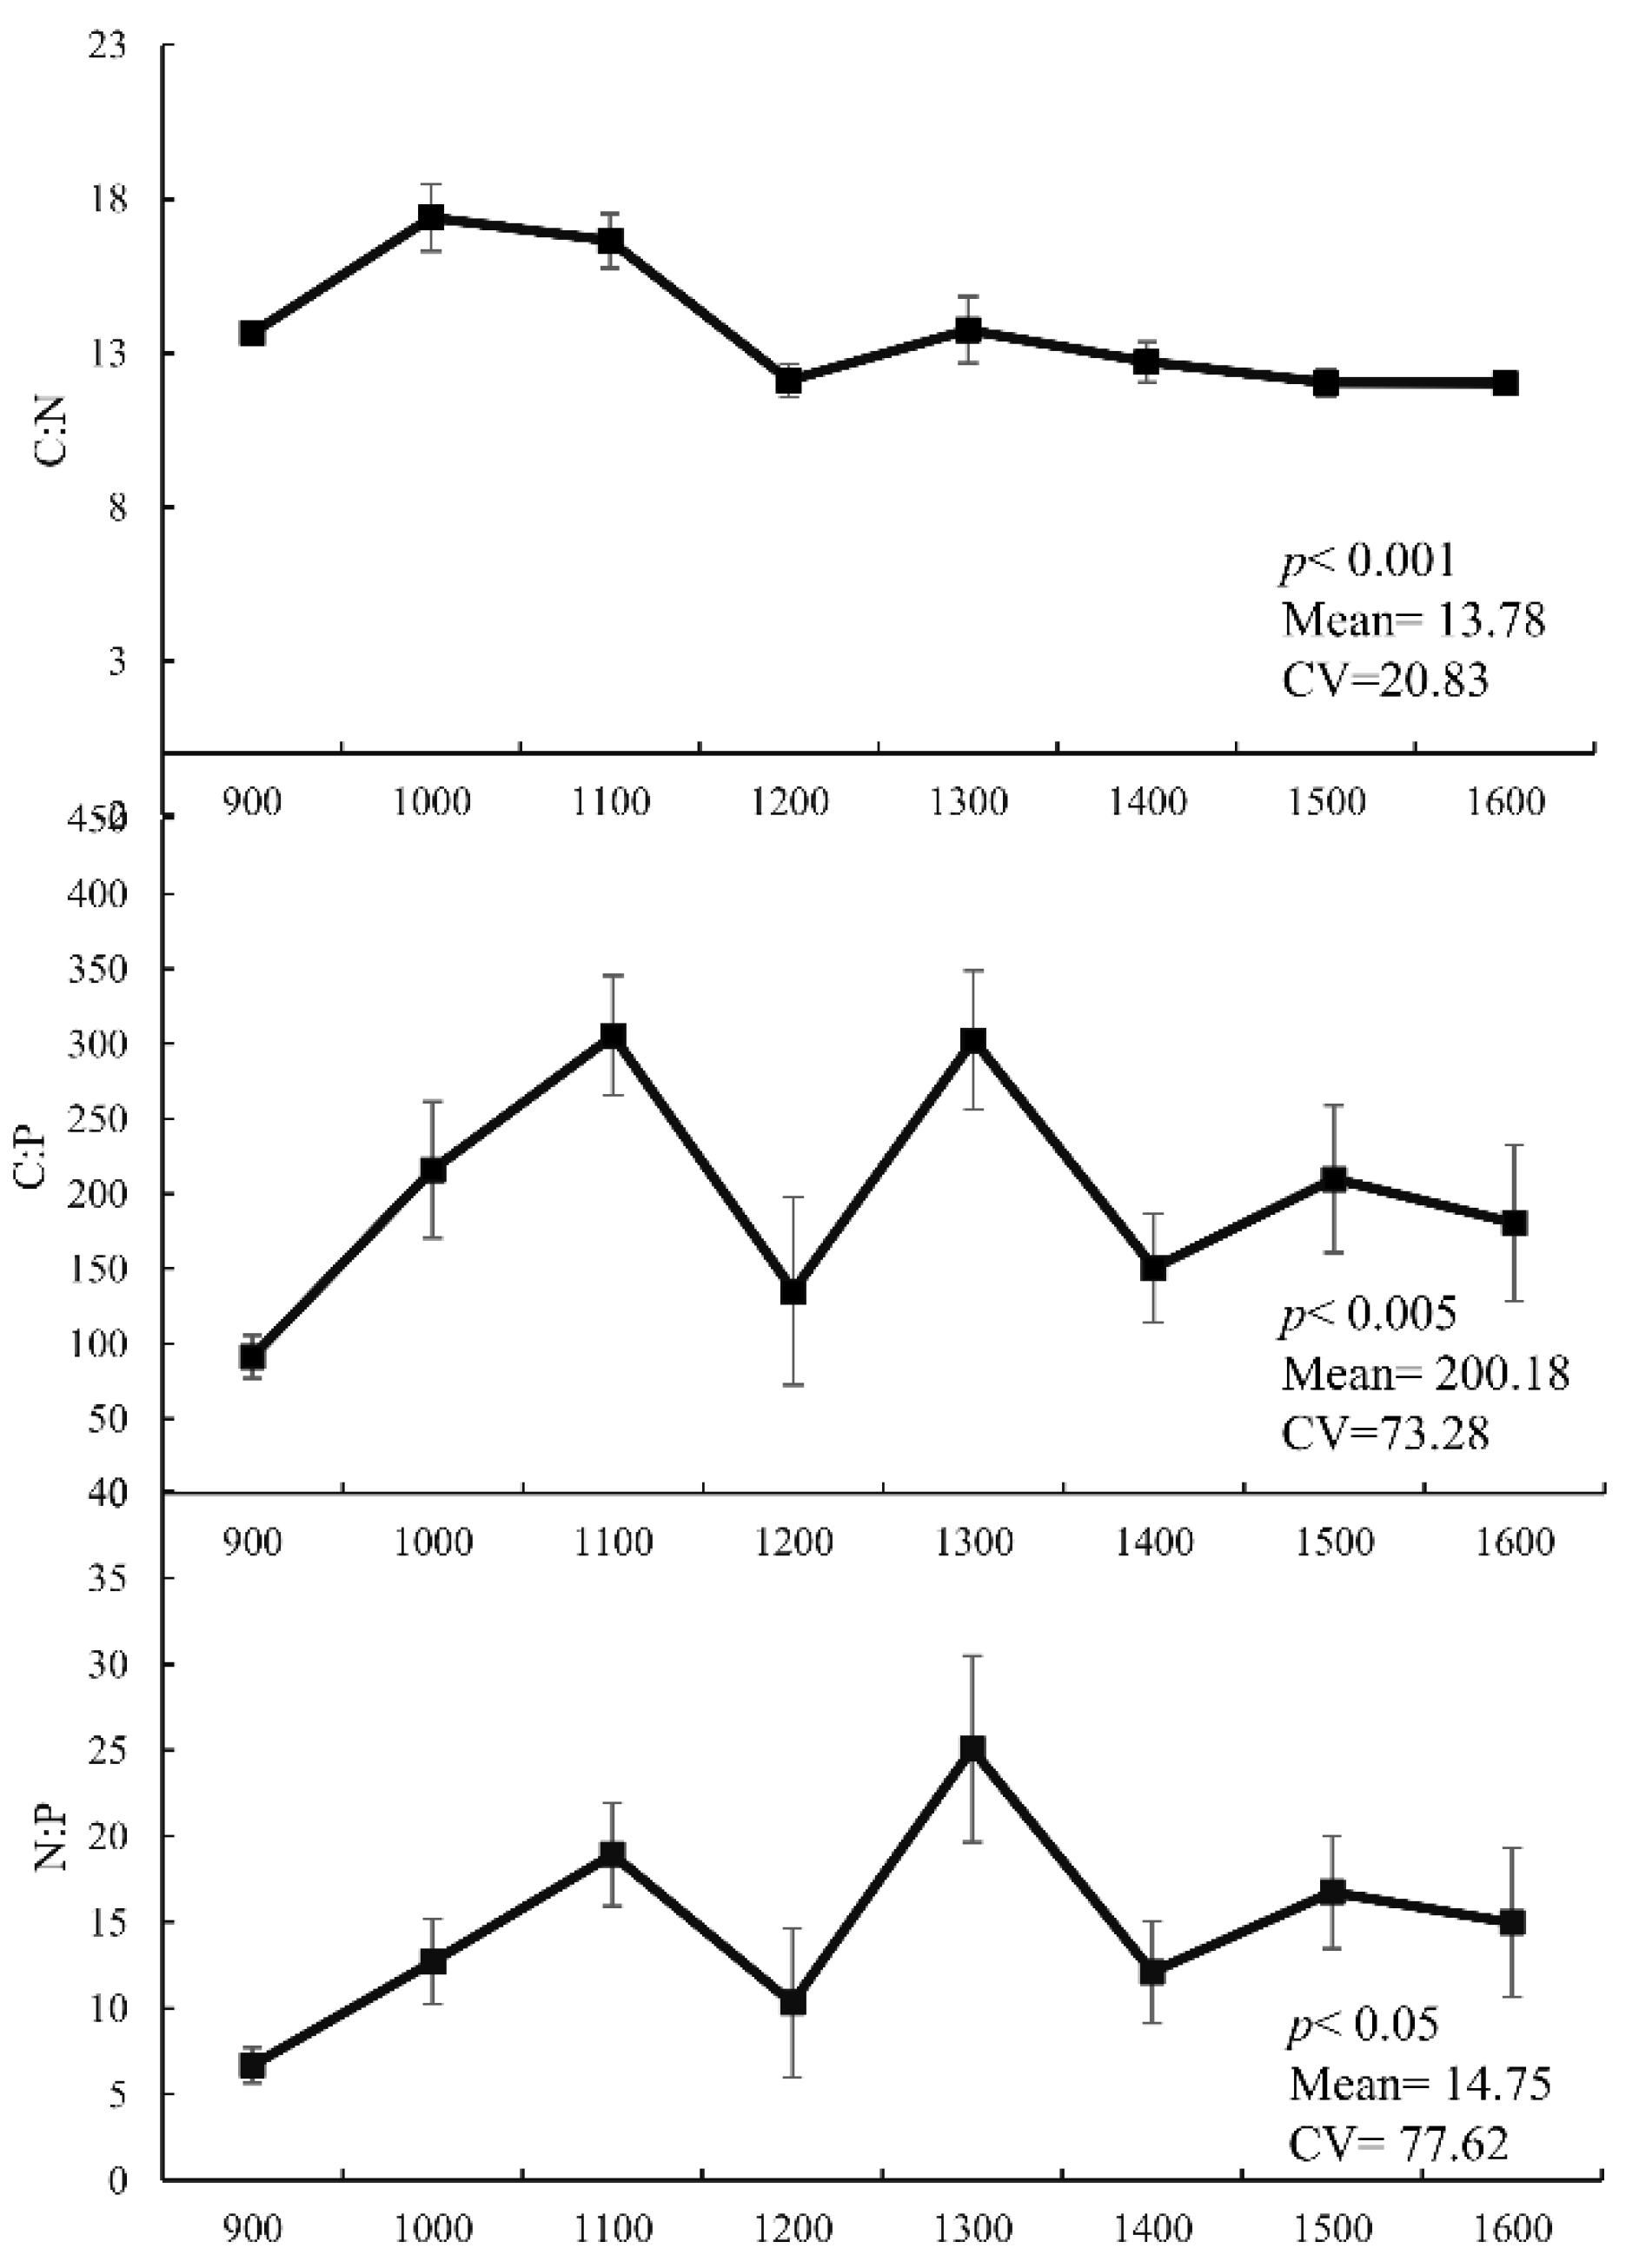
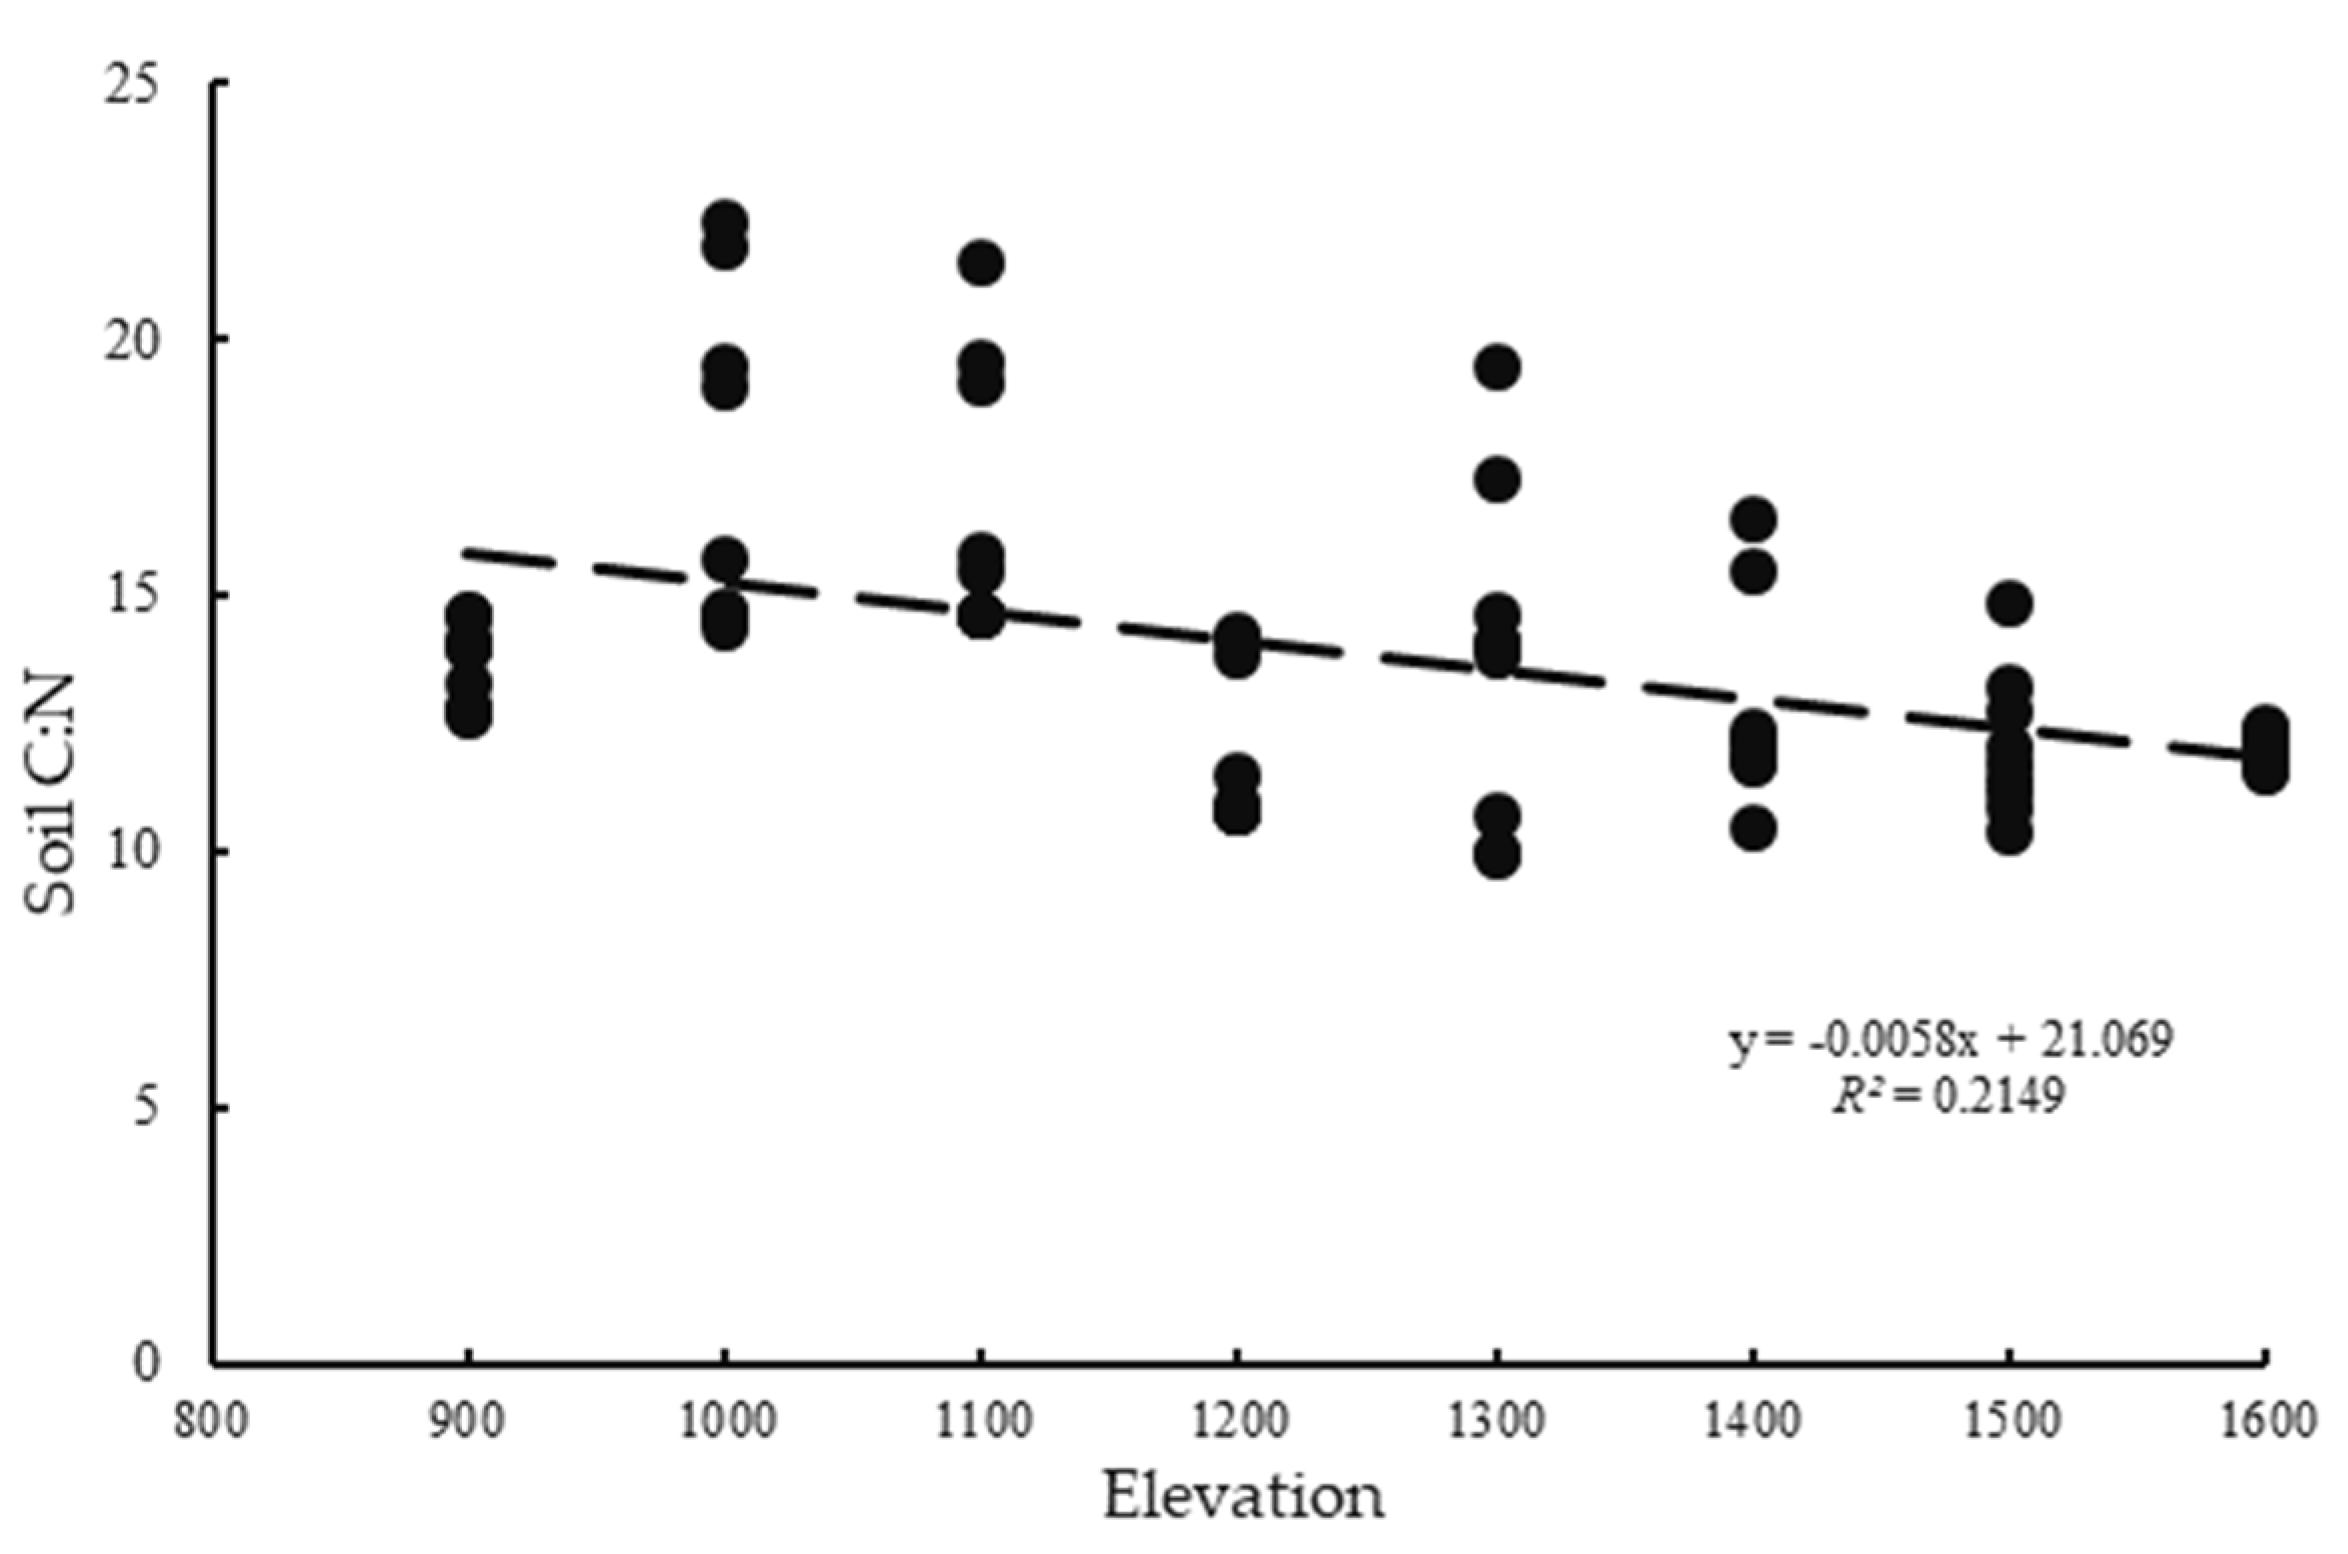
3.2. Soil C, N, and P and Their Stoichiometry Changes Along Elevation Gradients

The soil C:N of Daiyun Mountain varied from 11.96 to 17.40, and the coefficient of variation was 20.83% (Figure 2). The variation of C:N between different elevations was small, indicating that C:N was relatively stable on Daiyun Mountain. Soil C:N had a significant positive correlation with elevation (R2 = 0.215, p < 0.01; Figure A1). The trends of C:P and N:P were consistent with increased elevation, and both fluctuated with elevation. However, soil C:P and N:P were not correlated with elevation (p > 0.05; Table A2). Changes of soil stoichiometry can reflect the situation of soil nutrients. The values of C:P and N:P at 1300 m on Daiyun Mountain indicated that the carbon and nitrogen contents were relatively high, and the phosphorus content was relatively low. This means that soil phosphorus was the limiting element at 1300 m. Similarly, elevations of 1100 and 1600 m were also limited by soil phosphorus. In general, the effects of elevation on stoichiometry of carbon, nitrogen, and phosphorus were different. Soil C:N was relatively stable at various elevation gradients, and soil phosphorus remained the major limiting element on Daiyun Mountain. The difference of soil stoichiometry along elevation gradients related to different species composition and diversity. All species α-diversity indicators reflected that species diversity of P. taiwanensis community in elevation of 1200 m was highest (Table A1). Soil C:N, C:P, and N:P had a significant decline in elevation of 1200 m. These results indicate that biodiversity played an important role in distribution of soil stoichiometry.

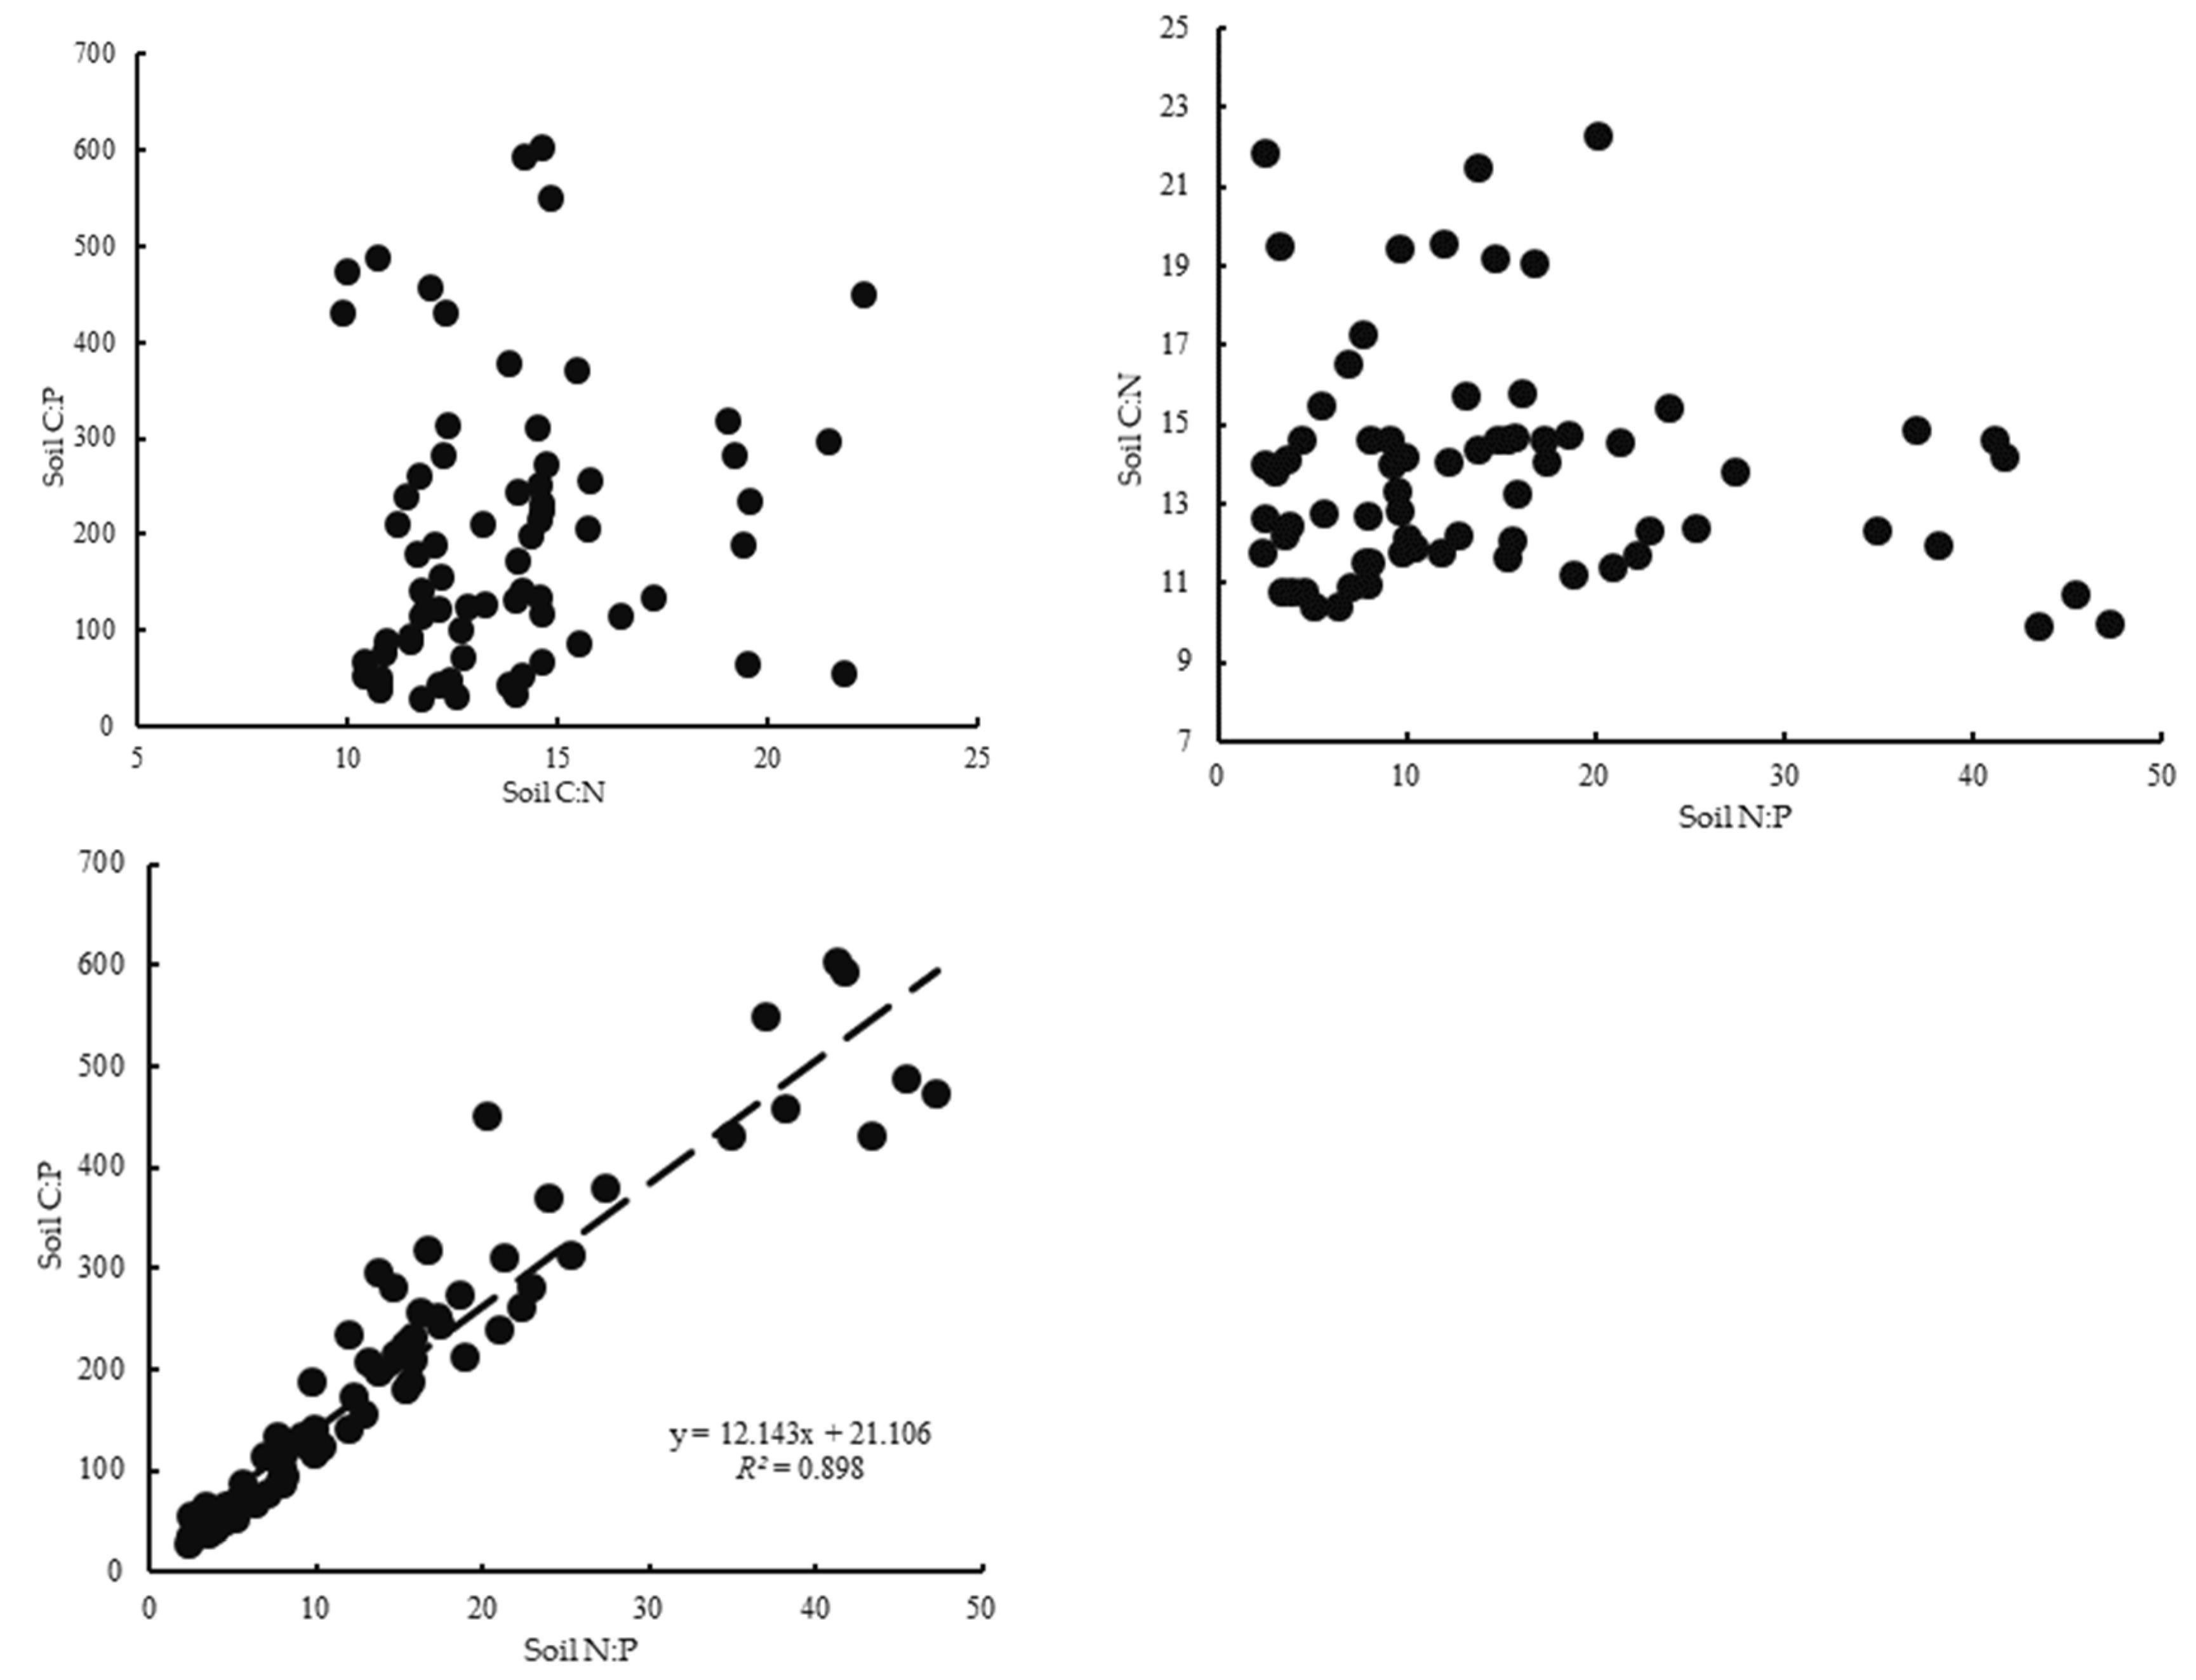
3.3. Correlation Analysis Between Soil Nutrient Elements and Soil Stoichiometry

There was a significant positive correlation between C and N on Daiyun Mountain (p < 0.01; Table 3). There was no significant correlation between P and C, or N and C:N (p > 0.05). However, there was a significant correlation between P and C:P, and P and N:P (p < 0.01). The results show that there was a strong negative correlation between P and C:P, P and N:P, and C:P and N:P, but the correlation between P and C, and P and N were weak. In terms of stoichiometry, there was a significant correlation between C:P and N:P (p < 0.01; Figure A2). Due to the strong correlation between carbon and nitrogen, there was a general positive correlation between the elements or stoichiometry containing carbon and nitrogen. However, phosphorus only correlated with stoichiometry containing phosphorus.

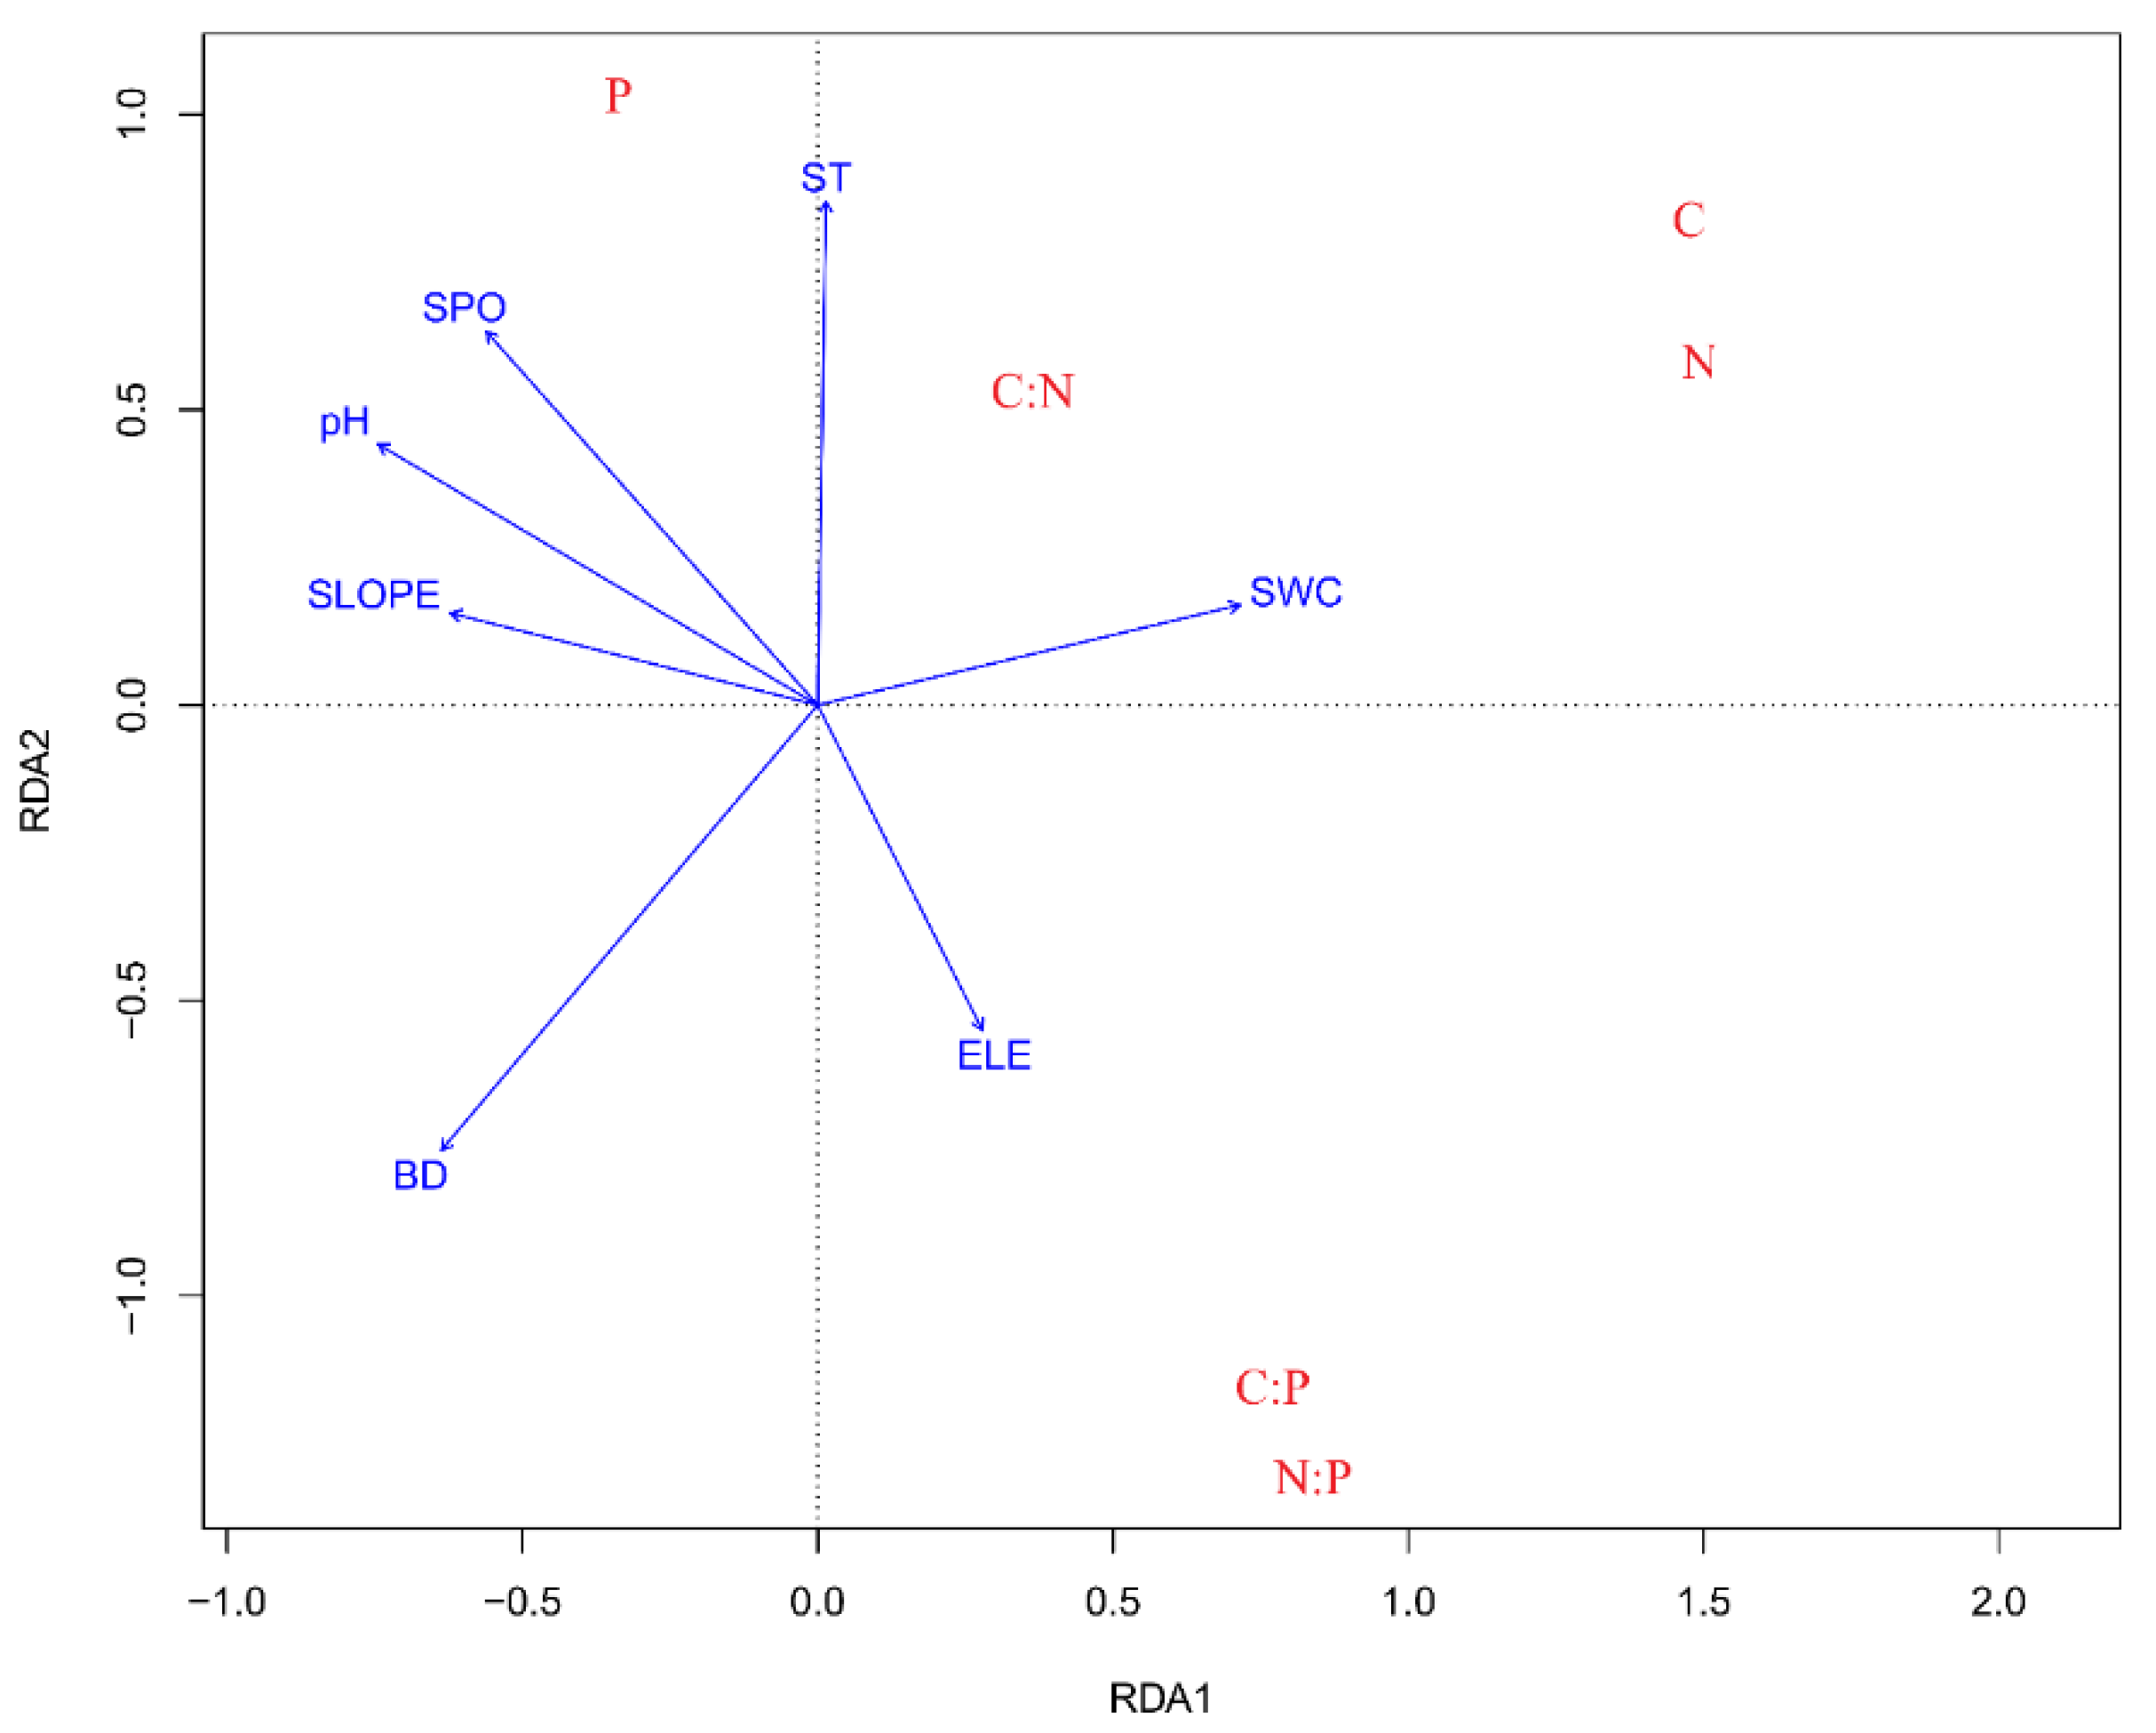
3.4. Correlation Between Soil Stoichiometry and Environmental Factors

The effects of seven environmental factors on soil nutrients and stoichiometry along elevation gradients on Daiyun Mountain were analyzed by the ordination method. By detrended correspondence analysis (DCA) calculation, the maximum axial length was 1.2512. This result suggests that the next analysis would seem to be more appropriate in RDA (Table 4). The cumulative variance percentage of the first two axes in RDA was 71.28%, which contains most of the information of the RDA ordination. Thus, RDA ordination can be analyzed with the first two axes. The interpretation of seven soil environmental factors for the distribution of soil stoichiometry along elevation gradients was 21.80%. Monte Carlo displacement test showed a significant correlation between environmental factors and soil stoichiometry (p = 0.001) (Table 4).
The first axis of the ordination mainly reflected the change of soil water content and slope (Figure 3). From left to right along the first axis, the terrain changed from a steep slope to flat terrain, and the soil water content gradually increased. At the habitat in flat terrain with high soil water content, the soil acid was stronger and the content of soil carbon and nitrogen was higher. The second ordination axis mainly reflected the change of soil temperature and soil bulk density. Soil C:N was mainly distributed in areas with low soil bulk density and high temperature. Soil carbon and nitrogen content was in relation to soil water content, mainly distributed in areas with high soil water content. Soil C:P and N:P were highly correlated with elevation, pH, and slope position. In the environment of low elevation and high soil acidity, soil C:P and N:P were relatively higher.
The results of the environmental factor significance test showed that bulk density was the main environmental factor affecting the distribution of soil nutrients and stoichiometry along elevation gradients (Table A3). The ranking of environmental factors from large to small is as follows: Soil bulk density (BD) > soil temperature (ST) > soil pH (pH) > slope position (SPO) > soil water content (SWC) > slope (SLOPE) > elevation (ELE).
Stepwise regression was applied to analyze the primary impact factors for each response variable. The environmental factors affecting the spatial distribution of soil carbon and nitrogen on Daiyun Mountain were the same, which were elevation (ELE), soil bulk density (BD), and soil temperature (ST) (Table 5). The impact factors for soil C:N were elevation and soil pH. Slope position (SPO) and soil pH were the main environmental factors affecting soil phosphorus, C:P, and N:P. The impact factors for soil carbon, nitrogen, and C:N were different from those of phosphorus, C:P, and N:P. Elevation, soil bulk density, and soil temperature may affect soil carbon and nitrogen content by affecting nutrient decomposition. Slope position and soil pH may affect stoichiometry related to phosphorus by changing soil phosphorus content.

4. Discussion

4.1. Elevation Heterogeneity of Soil Stoichiometry

Soil C:N is an important indicator to measure soil quality and the balance of carbon and nitrogen, and ultimately affects carbon and nitrogen cycles [27]. Soil C:N on Daiyun Mountain varied from 11.96 to 17.40, with an average of 13.78. Soil C:N was higher than that of average in China (12.3) [28], but lower than that of average of global ferralsols (14.3) [29]. According to a previous study, when soil C:N is less than 25:1, soil nitrogen is sufficient and organic carbon conversion happens more easily [30]. The C:N on Daiyun Mountain lower than 25:1 indicates that the soil carbon and nitrogen content is sufficient, and microbes utilize organic matter highly effectively, which is beneficial to local plant growth and nutrient cycling. Soil C:P reflects the effectiveness of phosphorus utilization, and lower C:P indicates higher soil phosphorus availability [31]. The average C:P of soil in China is 52.70 [28], and the average C:P of soil on Daiyun Mountain is 149.96, which is much higher. The soil C:P in India and Ghana was 82 and 116, respectively [32]. This indicates that soil phosphorus availability on Daiyun Mountain is relatively low, and the decomposition of organic matter by microorganisms is restricted by soil phosphorus content, which is not conducive to plant growth [33]. Soil N:P is often used for the diagnosis of nitrogen saturation and nutrient limitation of soil nitrogen and phosphorus. The average soil N:P on Daiyun Mountain is 15.31, much higher than the average in China (3.9) [29]. This indicates that the soil nitrogen content on Daiyun Mountain is higher and the phosphorus content is insufficient. In general, soil carbon and nitrogen on Daiyun Mountain is higher, and the soil is restricted by the total phosphorus. For the distribution of soil stoichiometry along elevation gradients, the soil C:N was higher at lower elevation, and C:P and N:P were higher at elevations of 1100 and 1300 m. These results show that the soil stoichiometry has elevation heterogeneity. Organic carbon at low elevation converts faster and soil carbon utilization efficiency is higher. At elevations of 1100 and 1300 m, soil is most severely restricted by phosphorus. In the future, phosphate fertilizer should be properly supplemented at these elevations.

4.2. Relationship of Soil Nutrients and Stoichiometry on Daiyun Mountain

There was no significant correlation between soil phosphorus and soil carbon or nitrogen on Daiyun Mountain. However, there was a significant correlation between soil carbon and nitrogen. The results show that there was a strong correlation between soil Pand C:P, and P and N:P, while soil C had a strong correlation with N and C:N. Soil carbon and nitrogen have consistent responses to environmental changes, and the relationship between C and N can remain stable in different ecosystems [34]. The study in Picea schrenkiana forest of Taishan Mountain [35] and northern grasslands of China [36] also showed the strong correlation between carbon and nitrogen of soil. The strong correlation between C and N is mainly due to the simultaneous release of carbon and nitrogen elements during the process of nutrient decomposition by microorganism [37,38,39]. Soil carbon and nitrogen are structural elements, mainly derived from nutrient return from litter decomposition [37]. Because the source of nitrogen is the organic matter synthesized by litter [38], soil microbes must first destroy the carbon skeleton, and then they can release nitrogen [39]. Therefore, there is a close relationship between soil nitrogen and carbon content. The correlation between soil phosphorus and carbon or nitrogen on Daiyun Mountain was weak, indicating that phosphorus was not synchronized with carbon and nitrogen with environmental changes. This may be related to the various sources of soil elements. The sources of carbon and nitrogen are associated with biological factors; both are derived from litter decomposition and organic matter content, so they are synchronic in response to environmental changes [34]. Soil phosphorus is a sedimentary element, mainly from rock weathering [40], which leads to weak correlation between phosphorus and soil carbon and nitrogen. In the future forest management of Daiyun Mountain, soil carbon, nitrogen, and phosphorus can be managed separately, with particular attention given to the dynamics of phosphorus.

4.3. Environmental Factors Affecting Differences in Soil Stoichiometry Along Elevation Gradients

The trend of soil stoichiometry along elevation gradients varies in different regions [16,17,18,19,20,21,22,23,24,25,26,27,28,29,30,31,32,33,34,35,36,37,38,39,40,41]. In Daiyun Mountain, soil C:N showed that a skewed (hump-shaped) pattern with the increase of elevation, with the peak at 1000 m a.s.l. It is similar to the trend of C:N in Taibai Mountain [16], but soil C:N in Dinghu Mountain [18] and Tibetan Plateau [41] gradually increased along elevation gradients. Soil C:P and N:P showed pattern of double peak along elevation gradients in Daiyun Mountain, which was different from other regions. In these regions, soil C:P and N:P are characterized by a gradual decline [16], rising [41] or unimodal pattern [18] along elevation gradients. The soil phosphorus is also different from other regions, and revealed a trend of fluctuations with increased elevation in our study, while phosphorus in Mauna Loa [42], Peruvian Andes [43], and Tropical montane forest [44] increased with increasing elevation gradients. There are various factors for the differences in elevational soil stoichiometric distribution pattern in different regions, such as microhabitat conditions, vegetation types, elevation ranges, soil parent materials, microorganism activity, and topographic differences. In this study, we explored the effects of topography and soil properties on soil stoichiometry distribution. There was 21.80% variability of soil stoichiometry that could be explained by topography and soil properties in Daiyun Mountain. Environmental factors (i.e., ELE, BD, and ST) were the main factors to affect the distribution of soil C, N, and C:N, whereas SPO and pH were the main environmental factors to drive the variability of soil P, C:P, and N:P. Soil carbon and nitrogen are not easily lost, and their content is affected by elemental sources. Sources of soil carbon and nitrogen include soil formation, litter return, and microbial decomposition [45]. At high elevation, air and soil temperatures are low, and the biological and chemical effects in the process of soil formation are weakened. Thus, there is obvious bioaccumulation on Daiyun Mountain. Meanwhile, soil microbial activity is weakened by low temperature, and the process of litter mineralization decomposition and transformation accumulation slows down. Mineralization, fixation, nitrification, and denitrification processes are also reduced, which influences the accumulation of carbon and nitrogen in the soil. Therefore, higher soil carbon and nitrogen is found at high elevation rather than at low elevation [46]. Soil bulk density is an important indicator reflecting soil compaction. Soil with high bulk density has low porosity, high compaction, and poor ventilation, hinders plant uptake and return of soil nutrients, and finally affects litter decomposition and inhibits nutrient accumulation [47]. The level of phosphorus in the soil depends on the source and the relative strength of the loss. Phosphorus is mainly produced from rock weathering, which is determined by the weathering rate. The loss of phosphorus is affected by factors such as topography, precipitation, and vegetation closure [16]. Precipitation will accelerate the leaching process of phosphorus, resulting in decreased soil phosphorus content. Slope position affects surface runoff intensity. The higher the slope position, the larger the surface runoff, and phosphorus is easily leached and lost. Soil pH of Daiyun Mountain is 3.71, which is acidic. The activity of iron and aluminum in acid soil is high, forming insoluble iron phosphorus and aluminum phosphorus. This leads to a lack of soil phosphorus and lower availability of nutrients, which makes it difficult for plants to absorb nutrients [46]. Different types of vegetation are also a possible reason for the variation of soil stoichiometry at different elevations [47]. Studies on P. sylvestris var. mongolica belt-mixed forests have shown that phosphorus content in the soil of pure forest was lower than in mixed forests [48,49]. At an elevation of 1100 m, C. lanceolata dominated. The forest was scattered with a small number of broad-leaved tree species such as Castanopsis. eyrei and Schima superba. The single type of vegetation may have resulted in a lower soil phosphorus content at 1100 m than at other elevations. In addition, the slope at 1100 m was the largest, which aggravates the leaching loss of phosphorus, resulting in higher soil C:P and N:P. Studies have shown that the soil carbon and nitrogen content of mixed forests is significantly higher than that of pure forests [40]. At an elevation of 1300 m, there is coniferous and broad-leaved mixed forest with high species richness and flat terrain, which is conducive to the retention of nutrients. As a result, soil carbon (63.57 g·kg−1) and nitrogen (4.39 g·kg−1) are higher at this elevation, phosphorus content is relatively lower, and soil C:P and N:P are higher. In the future, forest management of Daiyun Mountain can improve soil conditions by appropriately closing mountains for afforestation and increasing vegetation coverage. Soil physicochemical properties and topography have a low total value of soil stoichiometric altitude distribution, only 21.80% (Table 4), indicating that in addition to physical and chemical properties and topography, soil stoichiometry is also affected by other factors. Community structure, litter composition, and microbial composition may explain the changes in soil stoichiometry. These could be researched in the future.

5. Conclusions

Soil carbon and nitrogen contents on Daiyun Mountain are rich, but phosphorus is lacking. Environmental factors in topography and soil account for 21.80% of the distribution of soil stoichiometry along elevation gradients on Daiyun Mountain. Soil C, N, and C:N can be considered as one category; their distribution is affected by elevation, bulk density, and soil temperature. Soil P, C:P, and N:P are classified as another category; their distribution is influenced by soil pH and slope position. Soil conditions can be improved by supplementing with phosphate fertilizer, increasing species richness, and closing hillsides for afforestation, especially at elevations of 1100 and 1300 m, where the limited phosphorus is most serious.

Author Contributions

Conceptualization, L.J.; methodology, L.J. and Z.H.; software, L.J.; validation, J.L.; formal analysis, C.X. and X.G.; investigation, C.X., X.G., C.W., J.Z., and X.W.; data curation, L.J. and Z.H.; writing—original draft preparation, L.J.; writing—review and editing, L.J. and Z.H.; visualization, L.J., C.X., X.G., C.W., J.Z., and X.W.; supervision, J.L. and Z.H.; funding acquisition, J.L. and Z.H.

Funding

This research was funded by the National Natural Science Foundation of China (NSFC), grant numbers 31700550 and 31770678; the Science and Technology Promotion of Project Forestry Bureau of Fujian Province, grant number 2018TG14-2; the Nature Science Fund of Fujian Province Science and Technology of China, grant number 2019J01367; and the Daiyun Mountain Nature Reserve Administration Project, grant number KH1401450.

Acknowledgments

The authors wish to express their thanks for the support received from the Daiyun Mountain Nature Reserve in Dehua City, Fujian Province to allow them to collect samples. The authors would like to thank Minjie Lin, Ziyang Zhang, Shaogang Su, and Yuanzhi Wu for the field work. The authors also record sincere appreciation for helpful and constructive comments made by the reviewers of the draft manuscript.

Conflicts of Interest

The authors declare no conflicts of interest.

Appendix A

Figure A1. Linear regression between soil C:N and elevation.
Forests 10 01089 g0a1
Table A1. α diversity along the elevation gradients in Daiyun Mountain.
ElevationMargalef Simpson Shannon–WienerPielou
9004.904 0.8382.525 0.722
10005.739 0.8492.665 0.738
11004.449 0.8312.390 0.717
12006.094 0.9212.973 0.830
13004.779 0.9152.856 0.817
14004.483 0.8742.643 0.763
15003.549 0.8612.558 0.795
16002.792 0.8452.345 0.770
Table A2. The statistic parameters of linear regression.
R2F-Valuep-ValueSlopeIntercept
C:N-elevation0.21518.6150−0.00621.069
C:P-elevation0.0030.2350.629
N:P-elevation0.0322.2280.14
Table A3. Significance test for environmental factors.
RDA1RDA2R2p
SPO−0.69740.71670.05410.152
pH−0.90350.42870.05850.145
ST0.11240.99370.05870.147
SLOPE−0.98950.14460.03380.328
ELE0.4424−0.89680.02890.398
SWC0.96090.27690.04820.186
BD−0.6941−0.71990.08770.047 *
* Significance at the 0.05 level.
Figure A2. Regression relationship between soil stoichiometry.
Forests 10 01089 g0a2

References

  1. Unteregelsbacher, S.; Hafner, S.; Guggenberger, G.; Miehe, G.; Xu, X.L.; Liu, J.Q.; Kuzyakov, Y. Response of long-, medium- and short-term processes of the carbon budget to overgrazing-induced crusts in the Tibetan Plateau. Biogeochemistry 2012, 111, 187–201. [Google Scholar] [CrossRef]
  2. Wassen, M.J.; Venterink, H.O.; Swart, E.A. Nutrient Concentrations in Mire Vegetation as a Measure of Nutrient Limitation in Mire Ecosystems. J. Veg. Sci. 1995, 6, 5–16. [Google Scholar] [CrossRef]
  3. Reich, P.B.; Tjoelker, M.G.; Machado, J.L.; Oleksyn, J. Universal scaling of respiratory metabolism, size and nitrogen in plants. Nature 2006, 439, 457–461. [Google Scholar] [CrossRef]
  4. Mao, R.; Zhang, X.H.; Li, S.Y.; Song, C.C. Long-term phosphorus addition enhances the biodegradability of dissolved organic carbon in a nitrogen-limited temperate freshwater wetland. Sci. Total Environ. 2017, 332–336. [Google Scholar] [CrossRef] [PubMed]
  5. Zhang, Z.C.; Hou, G.; Liu, M.; Wei, T.X.; Sun, J. Degradation induces changes in the soil C:N:P stoichiometry of alpine steppe on the Tibetan Plateau. J. Mt. Sci. 2019, 16, 2348–2360. [Google Scholar] [CrossRef]
  6. Evans, J.R. Photosynthesis and nitrogen relationships in leaves of C3 plants. Oecologia 1989, 78, 9–19. [Google Scholar] [CrossRef]
  7. He, J.S.; Han, X.G. Ecological stoichiometry: Searching for unifying principles from individuals to ecosystems. Chin. J. Plant Ecol. 2010, 34, 2–6. [Google Scholar]
  8. Li, T.Y.; Wang, C.Y.; He, B.H.; Liang, C.; Zhang, Y.; Zhang, Y.Q. Soil nutrient concentrations and stoichiometry under different tree-cropping systems in a purple hillslope in southwestern China. Arch. Agron. Soil Sci. 2019, 65, 741–754. [Google Scholar] [CrossRef]
  9. Yang, X.X.; Dong, Q.M.; Chun, H.; Ding, C.X.; Yu, Y.; Zhang, C.P.; Zhang, Y.F.; Yang, Z.Z. Different responses of soil element contents and their stoichiometry (C:N:P) to yak grazing and Tibetan sheep grazing in an alpine grassland on the eastern Qinghai-Tibetan Plateau. Agric. Ecosyst. Environ. 2019, 285, 106628. [Google Scholar] [CrossRef]
  10. Su, L.; Du, H.; Zeng, F.P.; Peng, W.X.; Rizwan, M.; Núnez-Delgado, A.; Zhou, Y.Z.; Zhou, Y.Y.; Song, T.Q.; Wang, H. Soil and fine roots ecological stoichiometry in different vegetation restoration stages in a karst area, southwest China. J. Environ. Manag. 2019, 252, 109694. [Google Scholar] [CrossRef]
  11. Lucas-Borja, M.E.; Delgado-Baquerizo, M. Plant diversity and soil stoichiometry regulates the changes in multifunctionality during pine temperate forest secondary succession. Sci. Total Environ. 2019, 697, 134204. [Google Scholar] [CrossRef] [PubMed]
  12. Zhang, B.; Xue, K.; Zhou, S.T.; Che, R.X.; Du, J.Q.; Tang, L.; Pang, Z.; Wang, F.; Wang, D.; Cui, X.Y.; et al. Phosphorus mediates soil prokaryote distribution pattern along a small-scale elevation gradient in Noijin Kangsang Peak, Tibetan Plateau. FEMS Microbiol. Ecol. 2019, 95, fiz076. [Google Scholar] [CrossRef] [PubMed]
  13. Zhang, M.; Zhang, X.K.; Liang, W.J.; Jiang, Y.; Dai, G.H.; Wang, X.G.; Han, S.J. Distribution of Soil Organic Carbon Fractions Along the Altitudinal Gradient in Changbai Mountain, China. Pedosphere 2011, 21, 615–620. [Google Scholar] [CrossRef]
  14. Zhao, F.; Li, D.D.; Jiao, F.; Yao, J.; Du, H.T. The Latitudinal Patterns of Leaf and Soil C:N:P Stoichiometry in the Loess Plateau of China. Front. Plant Sci. 2019, 10. [Google Scholar]
  15. Hu, C.; Li, F.; Xie, Y.H.; Deng, Z.M.; Chen, X.S. Soil carbon, nitrogen, and phosphorus stoichiometry of three dominant plant communities distributed along a small-scale elevation gradient in the East Dongting Lake. Phys. Chem. Earth 2017, 103, 28–34. [Google Scholar] [CrossRef]
  16. Zhang, Y.; Li, C.; Wang, M.L. Linkages of C: N: P stoichiometry between soil and leaf and their response to climatic factors along altitudinal gradients. J. Soils Sediments 2018, 19, 1820–1829. [Google Scholar] [CrossRef]
  17. Muller, M.; Yvonne, O.; Schickhoff, U.; Bohner, J.; Scholten, T. Himalayan treeline soil and foliar C:N:P stoichiometry indicate nutrient shortage with elevation. Geoderma 2017, 291, 21–32. [Google Scholar] [CrossRef]
  18. He, X.J.; Hou, E.Q.; Liu, Y.; Wen, D.Z. Altitudinal patterns and controls of plant and soil nutrient concentrations and stoichiometry in subtropical China. Sci. Rep. 2016, 6, 24261. [Google Scholar] [CrossRef]
  19. Xu, D.W.; Liu, J.F.; Peter, M.; He, Z.S.; Zheng, S.Q. Leaf litter decomposition dynamics in unmanaged Phyllostachys pubescens stands at high elevations in the Daiyun Mountain National Nature Reserve. J. Mt. Sci. 2017, 14, 2246–2256. [Google Scholar] [CrossRef]
  20. Su, S.J.; Liu, J.F.; He, Z.S.; Zheng, S.Q.; Hong, W.; Xu, D.W. Ecological species groups and interspecific association of dominant tree species in Daiyun Mountain National Nature Reserve. J. Mt. Sci. 2015, 12, 637–646. [Google Scholar] [CrossRef]
  21. Su, S.J.; Liu, J.F.; Chen, W.W.; Kuang, K.J.; Tang, R.; Hong, W. Spatial Variability and Patterns of Soil Moisture Physical Properties in Pinus taiwanensis Forest Based on Geostatistics and GIS. Resour. Sci. 2014, 36, 2423–2430. (In Chinese) [Google Scholar]
  22. Liu, J.F.; Zhu, D.H.; Lan, S.R.; Hong, W.; Zheng, S.Q.; He, Z.S.; Xu, D.W. Association between environment and community of Pinus taiwanensis in Daiyun Mountain. Acta Ecol. Sin. 2013, 33, 5731–5736. (In Chinese) [Google Scholar]
  23. Deckers, J.; Driessen, P.; Nachtergaele, F.O.; Spaargaren, O. World Reference Base for Soil Resources. Eppo Bull. 1998, 1446–1451. [Google Scholar]
  24. Zhu, J.J.; Mao, Z.H.; Hu, L.L.; Zhang, J.X. Plant diversity of secondary forests in response to anthropogenic disturbance levels in montane regions of northeastern China. J. For. Res. 2007, 12, 403–416. [Google Scholar] [CrossRef]
  25. People’s Republic of China Forestry Industry Standard. Forest Soil Analysis Method; The State Forestry Administration of the People’s Republic of China: Beijing, China, 1999; pp. 71–113. (In Chinese)
  26. R Core Team. R: A Language and Environment for Statistical Computing; R Foundation for Statistical Computing: Vienna, Austria, 2017; Available online: http://www.R-project.org/ (accessed on 4 July 2018).
  27. Paul, K.I.; Polglase, P.J.; Nyakuengama, J.G.; Khanna, P.K. Change in soil carbon following afforestation. For. Ecol. Manag. 2002, 168, 241–257. [Google Scholar] [CrossRef]
  28. Tian, H.Q.; Chen, G.S.; Zhang, C.; Melillo, J.M.; Hall, C.A. Pattern and variation of C:N:P ratios in China’s soils: A synthesis of observational data. Biogeochemistry 2010, 98, 139–151. [Google Scholar] [CrossRef]
  29. Batjes, N.H. Total carbon and nitrogen in the soils of the world. Eur. J. Soil Sci. 2010, 47, 151–163. [Google Scholar] [CrossRef]
  30. Tessier, J.T. Vernal Photosynthesis and Nutrient Retranslocation in Dryopteris intermedia. Am. Fern J. 2001, 91, 187–196. [Google Scholar] [CrossRef]
  31. Mcgroddy, M.E.; Daufresne, T.; Hedin, L.O. Scaling of C:N:P stoichiometry in forest worldwide: Implications of terrestrial Redfield-type ratios. Ecology 2004, 85, 2390–2401. [Google Scholar] [CrossRef]
  32. Acquaye, D.K.; Kang, B.T. Sulfur status and forms in some surface soils of Ghana. Soil Sci. 1987, 144, 43–52. [Google Scholar] [CrossRef]
  33. Potapov, A.M.; Goncharov, A.A.; Semenina, E.E.; Korotkevich, A.Y.; Tsurikov, S.M.; Rozanova, O.L.; Akichkin, A.E.; Zuev, A.G.; Symcylova, E.S.; Semenyuk, L.L.; et al. Arthropods in the subsoil: Abundance and vertical distribution as related to soil organic matter, microbial biomass and plant roots. Eur. J. Soil Biol. 2017, 82, 88–97. [Google Scholar] [CrossRef]
  34. Cleveland, C.C.; Liptzin, D. C:N:P Stoichiometry in Soil: Is There a “Redfield Ratio” for the Microbial Biomass? Biogeochemistry 2007, 85, 235–252. [Google Scholar] [CrossRef]
  35. Cao, Y.E.; Wang, Y.; Xu, Z.L. Soil C:P Ratio along Elevational Gradients in Picea schrenkiana Forest of Tianshan Mountains. Pol. J. Ecol. 2019, 66, 325–336. [Google Scholar] [CrossRef]
  36. Zhang, X.Y.; Liu, M.Z.; Zhao, X.; Li, Y.Q.; Zhao, W.; Li, A.; Chen, S.; Chen, S.P.; Han, X.G.; Huang, J.H. Topography and grazing effects on storage of soil organic carbon and nitrogen in the northern China grasslands. Ecol. Indic. 2018, 93, 45–53. [Google Scholar] [CrossRef]
  37. Yang, Y.H.; Luop, Y.Q. Carbon: Nitrogen stoichiometry in forest ecosystems during stand development. Glob. Ecol. Biogeogr. 2011, 20, 354–361. [Google Scholar] [CrossRef]
  38. Li, L.; Chang, Y.P.; Xu, Z.L. Stoichiometric characteristics of Picea schrenkiana forests with a hydrothermal gradient and their correlation with soil physicochemical factors on Tianshan Mountain. Acta Ecol. Sin. 2018, 38, 8139–8148. [Google Scholar]
  39. Olander, L.P.; Vitousek, P.M. Regulation of soil phosphatase and chitinase activity by N and P availability. Biogeochemistry 2000, 49, 175–190. [Google Scholar] [CrossRef]
  40. Cheng, M.; An, S.S. Responses of soil nitrogen, phosphorous and organic matter to vegetation succession on the Loess Plateau of China. J. Arid Land 2015, 7, 216–223. [Google Scholar] [CrossRef]
  41. Tian, L.M.; Zhao, L.; Wu, X.D.; Fang, H.B.; Zhao, Y.H.; Hu, G.J.; Yue, G.Y.; Sheng, Y.; Wu, J.C.; Chen, J.; et al. Soil moisture and texture primarily control the soil nutrient stoichiometry across the Tibetan grassland. Sci. Total Environ. 2017, 622–623, 192–202. [Google Scholar] [CrossRef]
  42. Vitousek, P.M.; Aplet, G.H.; Turner, D.R.; Lockwood, J.J. The Mauna Loa environmental matrix: Foliar and soil nutrients. Oecologia 1992, 89, 372–382. [Google Scholar] [CrossRef]
  43. Fisher, J.B.; Malhi, Y.; Torres, I.C.; Metcalfe, D.B.; Weg, M.J.; Meir, P.; Silva-Espejo, J.E.; Huasco, W.H. Nutrient limitation in rainforests and cloud forests along a 3,000-m elevation gradient in the Peruvian Andes. Oecologia 2013, 172, 889–902. [Google Scholar] [CrossRef] [PubMed]
  44. Unger, M.; Leuschner, C.; Homeier, J. Variability of indices of macronutrient availability in soils at different spatial scales along an elevation transect in tropical moist forests. Plant Soil 2010, 336, 443–458. [Google Scholar] [CrossRef] [Green Version]
  45. Tipping, E.; Somerville, C.J.; Luster, J. The C:N:P:S stoichiometry of soil organic matter. Biogeochemistry 2016, 130, 117–131. [Google Scholar] [CrossRef] [Green Version]
  46. Buchkowski, R.W.; Schmitz, O.J.; Bradford, M.A. Microbial stoichiometry overrides biomass as a regulator of soil carbon and nitrogen cycling. Ecology 2015, 96, 1139–1149. [Google Scholar] [CrossRef] [Green Version]
  47. Wang, H.; Liu, S.R.; Wang, J.X.; Shi, Z.M.; Xu, J.; Hong, P.Z.; Ming, A.G.; Yu, H.L.; Chen, L.; Lu, L.H.; et al. Differential effects of conifer and broadleaf litter inputs on soil organic carbon chemical composition through altered soil microbial community composition. Sci. Rep. 2016, 6, 27097. [Google Scholar] [CrossRef]
  48. Wang, K.; Lei, H.; Shi, L.; Zhang, R.S.; Song, L.N. Soil carbon, nitrogen and phosphorus stoichiometry characteristics of Pinus sylvestris var mongolica belt-mixed forests. Chin. J. Appl. Ecol. 2019, 30, 2883–2891. (In Chinese) [Google Scholar]
  49. Giardina, C.P.; Huffman, S.; Binkley, D.; Caldwell, B.A. Alders increase soil phosphorus availability in a Douglas-fir plantation. Can. J. For. Res. 1995, 25, 1652–1657. [Google Scholar] [CrossRef]
Figure 1. The general information of sample plots in Daiyun Mountain. (a) The map of Fujian Province, China. The star in (a) is the location of Daiyun Mountain. (b) The area of Daiyun Mountain. (c) The eight permanent plots along the elevation gradients. (d) One permanent plot divided into three sample quadrats of 10 × 20 m. The red dots in (d) indicate three repetitions of soil sample in each quadrat. A total of 72 soil samples were collected in Daiyun Mountain.
Forests 10 01089 g001
Figure 2. The variation of soil stoichiometry along elevations in Daiyun Mountain. p is the p-value by Duncan test of multiple comparisons. Mean is the average value.
Forests 10 01089 g002
Figure 3. RDA analysis of soil carbon, nitrogen, phosphorus and their stoichiometry in Daiyun Mountain. Note: ELE, elevation; SLOPE, slope; SPO, slope position; pH, soil pH value; SWC, soil water content; BD, bulk density; ST, soil temperature.
Forests 10 01089 g003
Table 1. General information of plant communities on the southern slope in Daiyun Mountain.
Plot NumberElevationLongitudeLatitudeVegetation Type [18]Dominant SpeciesSlopeSlope Position
DYS-900915118°10′36″25°38′46″CEBFCyclobalanopsis glauca; Cunninghamia lanceolata28~38mid-slope
DYS-10001001118°10′38″25°38′51″CEBFC. lanceolata; C. glauca35~35upper-slope
DYS-11001091118°10′43″25°38′57″CEBFC. lanceolata; C. glauca35~50mid-slope
DYS-12001201118°10′53″25°39′06″CEBFC. lanceolata; Machilus thunbergii15~33mid-slope
DYS-13001321118°10′55″25°39′22″CEBFEurya rubiginosa var. attenuate; Pinus taiwanensis14~27down-slope
DYS-14001411118°10′58″25°39′32″CEBFP. taiwanensis; E. rubiginosa var. attenuate26~31upper-slope
DYS-15001501118°10′57″25°39′47″CFP. taiwanensis22~34down-slope
DYS-16001613118°11′05″25°40′06″CFP. taiwanensis31~32mid-slope
CEBF stands for coniferous and evergreen broad-leaved forest, CF stands for coniferous forest.
Table 2. The variation of soil physical and chemical properties along the elevations of Daiyun Mountain.
ElevationC (g·kg−1)N (g·kg−1)Log P (g·kg−1)pHSoil Water Content (%)Soil Bulk Density (g·cm−3)Soil Temperature (°C)
90046.28 ± 1.843.38 ± 0.08−0.24 ± 0.093.82 ± 0.02 a35.56 ± 1.910.7 ± 0.04 c,d23.2 ± 0.2 a
100074.11 ± 4.94.31 ± 0.25−0.37 ± 0.113.65 ± 0.05 c41.85 ± 2.940.64 ± 0.03 d22.6 ± 0.2 b
110052.63 ± 1.533.21 ± 0.1−0.74 ± 0.053.7 ± 0.05 a,b,c43.9 ± 1.920.68 ± 0.04 c,d21.5 ± 0.1 c
120039.18 ± 7.293.12 ± 0.44−0.35 ± 0.113.83 ± 0.02 a44.25 ± 2.140.8 ± 0.03 a,b,c21.4 ± 0.1 c
130063.57 ± 10.314.39 ± 0.55−0.59 ± 0.193.61 ± 0.03 c47.83 ± 4.510.76 ± 0.06 b,c,d21.2 ± 0.2 c
140041.24 ± 4.43.36 ± 0.41−0.72 ± 0.143.58 ± 0.04 c43.69 ± 6.580.86 ± 0.03 a,b20.4 ± 0.1 d
150056.56 ± 8.194.57 ± 0.53−0.52 ± 0.083.8 ± 0.05 a,b53.33 ± 5.510.77 ± 0.07 b,c,d19.8 ± 0.1 e
160050.7 ± 3.544.21 ± 0.28−0.39 ± 0.153.68 ± 0.05 b,c44.54 ± 2.370.92 ± 0.05 a19.0 ± 0.1 f
Mean ± SE53.03 ± 2.393.82 ± 0.14−0.49 ± 0.053.71 ± 0.0244.41 ± 1.300.77 ± 0.0221.1 ± 0.2
CV38.3031.5877.774.0320.2420.836.50
F3.7692.5872.0734.1175.2681.682108.808
p0.0020.0210.0590.0010.0000.1410.000
p-adjusted0.0560.5881.6520.0280.0003.9480.000
The Duncan test was selected for multiple comparisons between indicators at different elevations, and the p-value was adjusted according to Bonferroni correction. The adjusted p-value is the original p-value multiplied by the number of multiple comparisons (n = 28). Adjusted p-value less than 0.05 indicates a significant difference. The different letters in the same column meant significant differences among treatments (p-adjusted <0.05). Since the soil phosphorus content data did not fit for the normal distribution, the logarithm of soil phosphorus content was converted to conduct ANOVA analysis. Mean ± standard error (SE) was the average ± SE. CV was coefficient of variation. The same below.
Table 3. Correlation analysis of soil nutrients and stoichiometry in Daiyun Mountain.
CNPC:NC:PN:P
CPearson Correlation10.869 **0.1620.580 **0.245 *0.064
Sig. (2-tailed)0.0000.0000.1770.0000.0410.596
NPearson Correlation0.869 **10.1060.1260.2050.137
Sig. (2-tailed)0.0000.0000.3780.2910.0890.258
PPearson Correlation0.1620.10610.1080.591 **0.575 **
Sig. (2-tailed)0.1770.3780.0000.3700.0000.000
C:NPearson Correlation0.580 **0.1260.10810.140−0.122
Sig. (2-tailed)0.0000.2910.3700.0000.2490.315
C:PPearson Correlation0.245 *0.205−0.591 **0.14010.948 **
Sig. (2-tailed)0.0410.0890.0000.2490.0000.000
N:PPearson Correlation0.0640.137−0.575 **−0.1220.948 **1
Sig. (2-tailed)0.5960.2580.0000.3150.0000.000
** and * correlation is significant at the 0.01 and 0.05 level, respectively (2-tailed).
Table 4. Ordination analysis of soil nutrient and stoichiometry in Daiyun Mountain.
Ordination InformationValue
The largest axis length of DCA0.9747
The sum of first two axis of RDA0.9323
The sum of eigenvalues for constrained axes in RDA1.308
Cumulative percentage of stoichiometry environment variation the first two axes in RDA71.28%
Total eigenvalues of RDA6.0000
Total explanatory proportion of environmental factors21.80%
Significance test for all axesp = 0.001
Table 5. Stepwise regression of main factors affecting soil stoichiometry in Daiyun Mountain.
AICBICEnvironmentEstimateStd.Errort-Valuep
C614626ELE0.0780.0282.7900.0069
BD−37.60115.666−2.4000.0192
ST12.3194.5342.7170.0084
N215227ELE0.0060.0023.7850.0003
BD−2.1380.906−2.3590.0212
ST0.7380.2622.8130.0065
P71.980.9SPO0.1170.0572.0520.0441
pH0.6470.3461.8730.0654
C:N333342pH−0.0060.001−4.4320.0000
ELE−5.8562.213−2.6460.0101
C:P895904SPO−49.9520.35−2.4550.0167
pH−281.87123.24−2.2870.0254
N:P539548SPO−3.341.608−2.0800.0414
pH−21.139.739−2.170.0336
Note: AIC and BIC are indicators for measuring the degree of fitness of the model. AIC is Akaike information criterion and BIC is Bayesian information criterion. The smaller the AIC and BIC, the better the model fit. The table shows the minimum AIC and BIC fitted.

