Article

Species Differences in Nitrogen Acquisition in Humid Subtropical Forest Inferred From 15N Natural Abundance and Its Response to Tracer Addition

1
Vegetation Restoration and Management of Degraded Ecosystems and Guangdong Provincial Key Laboratory of Applied Botany, South China Botanical Garden, Chinese Academy of Sciences, Guangzhou 510650, China
2
Department of Geosciences and Natural Resource Management, University of Copenhagen, Rolighedsvej 23, DK-1958 Frederiksberg C, Denmark
3
Sino-Danish Centre for Education and Research (SDC), Niels Jensens Vej 2, DK-8000 Aarhus C, Denmark
4
CAS key Laboratory of Forest Ecology and Management, Institute of Applied Ecology, Chinese Academy of Sciences, Shenyang 110164, China
5
Key Laboratory of Stable Isotope Techniques and Applications, Shenyang 110016, China
*
Authors to whom correspondence should be addressed.
Forests 2019, 10(11), 991; https://doi.org/10.3390/f10110991
Submission received: 13 October 2019 / Revised: 31 October 2019 / Accepted: 4 November 2019 / Published: 6 November 2019
(This article belongs to the Special Issue Stable Isotopes in Forest Ecosystem Research)

Abstract

:
Differences in nitrogen (N) acquisition patterns between plant species are often reflected in the natural 15N isotope ratios (δ15N) of the plant tissues, however, such differences are poorly understood for co-occurring plants in tropical and subtropical forests. To evaluate species variation in N acquisition traits, we measured leaf N concentration (%N) and δ15N in tree and understory plant species under ambient N deposition (control) and after a decade of N addition at 50 kg N ha−1 yr−1 (N-plots) in an old-growth subtropical forest in southern China. We also measured changes in leaf δ15N after one-year of 15N addition in both the control and N-plots. The results show consistent significant species variation in leaf %N in both control and N-plots, but decadal N addition did not significantly affect leaf %N. Leaf δ15N values were also significantly different among the plant species both in tree and understory layers, and both in control and N-plots, suggesting differences in N acquisition strategies such as variation in N sources and dominant forms of N uptake and dependence on mycorrhizal associations among the co-occurring plant species. Significant differences between the plant species (in both control and N-plots) in changes in leaf δ15N after 15N addition were observed only in the understory plants, indicating difference in access (or use) of deposited N among the plants. Decadal N addition had species-dependent effects on leaf δ15N, suggesting the N acquisition patterns of these plant species are differently affected by N deposition. These results suggest that co-occurring plants in N-rich and subtropical forests vary in their N acquisition traits; these differences need to be accounted for when evaluating the impact of N deposition on N cycling in these ecosystems.

Graphical Abstract

1. Introduction

Enhanced atmospheric nitrogen (N) deposition into forest ecosystems from increased anthropogenic emissions of reactive N [1] has several cascading negative ecological effects on the forest ecosystems including increased N leaching to waters, soil acidification, increased N gas losses from soil and changes in biodiversity [2]. Tropical forests have a disproportionately large effect on the global carbon (C) and N cycles, and enhanced N deposition is likely to have rapid and deleterious effects on these ecosystems that are naturally regarded as N-rich [3]. The responses of forest ecosystems to N deposition greatly depend on N status of the forests [4]. Plant species can affect N status of forest ecosystems through direct mechanisms including fixing atmospheric N2, sequestering varying amounts of N in plant biomass, altering the distribution of N to aboveground and belowground plant parts [5,6], and controlling the chemical quality of the litter produced [7]. While study of effects of individual tree species on soil processes using pure stands (plantation forest) of the individual tree species is important to minimize bias due to species interaction [8,9], it may not reveal the species effects that occur when the species co-exist and interact with each other, as in the case of many natural forests. For example, in old-growth forests with multiple co-occurring species in subtropical monsoon climates, the effects of individual species on soil processes are difficult to assess due to the aforementioned species interactions although the functional diversity of these ecosystems has an implication for below- and above-ground processes [10]. On the other hand, there is a need to understand how these ecosystems respond to global change factors such increased N deposition, which is a recognized threat to plant diversity [11] in part through imbalanced nutrition. Ecosystems thought of as not N-limited, such as (sub)tropical systems, may be more vulnerable, and one way to understand and predict how these ecosystems with high taxonomic diversity respond to changes in N deposition is to investigate the effects of N deposition on N cycling traits (e.g., N acquisition) of the co-occurring plant species in the forests. However, to our knowledge, only a few studies have attempted to investigate the effects of enhanced N deposition on N acquisition of (sub)tropical forest plants at the species level [12,13].
Species variation in 15N:14N ratio (natural 15N abundance expressed as δ15N) of plant tissues both within and between sites [14,15,16] has been explained as representing species differences in N acquisition mechanisms, such as differences in sources and forms of N taken up by the plants [17]. For example, plants that mainly use atmospherically deposited 15N-depleted N may have lower δ15N values compared to those that mainly use 15N-enriched (relative to atmospheric N) soil N. Similarly, some studies, mostly in predominately N-limited temperate and boreal forests, have shown that leaf δ15Ns of mycorrhizal plants are often more 15N-depleted than those of non-mycorrhizal plants [18,19,20]. Within mycorrhizal groups, leaf δ15N is more 15N-depleted in ectomycorrhizal plants than in arbuscular mycorrhizal plants due to stronger fractionation in the ectomycorrhizal plants during fungus-to-plant N transfer [18,19,20]. On the other hand, high within-site species variation in leaf δ15N (10‰) has been observed in the extremely nutrient-poor tundra ecosystem [21], which was thought to reflect species differences in N acquisition mechanisms (i.e., that they access different N sources with distinct 15N signature) due to competitive partitioning of the overall N pool. Thus, it was suggested [21] that species variation in leaf δ15N could be minor in N-rich forests as all plant species may display similar N acquisition mechanisms, i.e., rely on common pools of inorganic soil N. However, in some N-rich (sub)tropical forests including those in South America [22,23] and Asia [24], where competition for N sources is not expected due to the abundant N availability in the soil, species leaf δ15N range has been reported to be comparable to that observed in N-limited ecosystems [21]. The primary underlying mechanisms in these naturally N-rich ecosystems for species variation in leaf δ15N and its interpretation when evaluating N status and N cycling in the ecosystems are yet to be explored.
This study evaluates differences in δ15N among five co-occurring tree species and seven understory plant species in a subtropical forest using an ongoing N addition experiment that was established in an old-growth forest in Dinghushan Biosphere Reserve (DHSBR), southern China, in July 2003 [25]. We examined species variation in δ15N in all tree compartments (leaf, twigs, branches, bark and wood) and leaf δ15N in the understory plants under ambient N deposition (control) and after decadal N addition (N-plots), but we focus primarily on leaf δ15N, as do most other studies [17]. We also examined the variation in leaf δ15N response to a one-year addition of 15N-enriched N (added as a tracer) in both treatments. With these three data sets (control, N-plots, and after the one-year 15N addition in both treatments), we aim to understand species N acquisition differences in old-growth subtropical forests based on their δ15N and its response to experimentally manipulated N deposition. Our objectives are: (1) to evaluate species variation in δ15N natural abundance among the co-occurring plant species under ambient N deposition (control) as an indicator of long-term differences in N acquisition and cycling traits such as fractionation during uptake and assimilation of soil N and/or deposited N; (2) to evaluate species variation in δ15N of the plant species in response to a decade of higher N availability (N-plots) with δ15N of −0.7‰ in added N which, if taken up, is expected to increase (move towards zero) plant δ15N, and (3) to evaluate species variation in leaf δ15N after a year-long addition of 15N-enriched N fertilizer to both control and N-plots, which could imply short-term species differences in access to and/or uptake of deposited and added N. We hypothesized that: (1) species variation in leaf δ15N would be significant under both ambient and decadal N addition due to differences in N acquisition mechanism including the primary sources and forms of N used by the plants, and; (2) the response of leaf δ15N to N and 15N addition would also be different among the plant species, which could imply species differences in access to and/or uptake of deposited and added N.

2. Materials and Methods

2.1. Study Site

The study was conducted in the Dinghushan Biosphere Reserve (DHSBR) in southern China (112°33′ E and 23°10′ N) which occupies an area of approximately 1200 ha. This site has a subtropical monsoon climate with mean annual temperature of 22.2 °C and mean annual precipitation of 1927 mm. Atmospheric N deposition (measured as inorganic N in bulk precipitation) in the reserve since the 1990s has ranged from 21 to 38 kg N ha−1 yr−1 [26,27]. Recent measurement shows a high total wet N deposition of 51 kg N ha−1 yr−1 [28]. The soil is lateritic red earth (Oxisol) with a pH value of ~4 and a C:N ratio of 11 in the upper 0–30 cm mineral soil [29]. The forest we used for this study is an old-growth broadleaved forest that covers about 20% of reserve. In terms of vegetation composition, the forest consists of several co-occurring plant species (having the high species diversity typical of humid subtropical forests) in canopy and understory layers that form a complex canopy structure. The most common tree species in the canopy and sub-canopy layers are Castanopsis chinensis (Spreng.) Hance, Cryptocarya chinensis (Hance) Hemsl., Memecylon ligustrifolium Champ. ex Benth., Syzygium rehderianum Merr. & L.M.Perry, Syzygium acuminatissimum (Blume) DC., Machilus chinensis, and Schima superba, [30], which represent more than 90% of the total basal area. The understory layer consists of many species (high taxonomic diversity) with the dominant ones including Alpinia chinensis (Retz.) Roscoe, Blastus cochinchinensis Lour., Calamus rhabdocladus Burret, Cryptocarya concinna Hance, Tectaria harlandii (Hook.) C.M.Kuo, Maesa salicifolia E.Walker and Aidia canthioides (Champ. ex Benth.) Masam [30], which represent various growth forms including woody plants (mostly >1 m), lianas and herbs (Table 1).

2.2. Experimental Design

We used an ongoing N addition experiment established in the forest in July 2003 [25]. The N addition experiment consisted of four treatments: a control and three N addition treatments at 50, 100 and 150 kg N ha−1 yr−1, each with three replicates. In this study, we used only the control plots and the lower N addition plots at 50 kg N ha−1 yr−1 (hereafter referred to as N-plots). Each experimental plot was 10 m × 20 m, laid out on a mountain slope with at least a 10-m-wide buffer strip to the next adjacent plots. The N-plots have been receiving NH4NO3 since July 2003. The fertilizer is dissolved in 20 L of water and added monthly below the canopy using a backpack sprayer. The control plots received the equivalent 20 L of water alone. The NH4NO3 fertilizer has a δ15N value (−0.7‰) close to that of atmospheric N2 (0‰). From March 2013 to February 2014, 15N-enriched (99.5% atom 15N) 15NH415NO3 was added monthly to both control and N-plots. The monthly 15N tracer dose was mixed with the fertilizer in the N-plots and with the 20 L water in the control plots. The total amount of added 15N (100 mg 15N m−2 split in 12 equal monthly doses) was determined so that it would significantly alter ecosystem δ15N without significant disturbance of the N pools and fluxes in the control plots or further aggravating effects of the ongoing N addition in the N-plots.

2.3. Sampling and Analysis of Samples

Leaves and other plant compartments were sampled from all the dominant tree species (except Machilus chinensis, and Schima superba, which were too tall to be sampled) and only leaves were sampled from all the dominant understory plant species (Table 1) in January 2013 and again in June 2014—four months after the last year-long monthly 15N addition. A small branch per tree species per plot was cut from the dense canopy layer using a pole pruner and was separated into leaves (current year and older), twigs (<2 cm) and small branches (>1 cm). For each tree species, a wood core was sampled from the same tree (from which the branch was sampled) using an increment borer and was divided into bark and wood. Leaves of understory plants were cut with a knife from three to four individual plants and were bulked per species. Two mineral soil cores (0–30 cm) per plot were sampled using an auger (5.1 cm in diameter). The two soil cores were analyzed separately but only plot means of δ15N were used. Living fine roots (<2 mm) were hand-sorted from these soil cores but could not be separated into different species.
All samples were oven-dried at 70 °C, and ground to a fine and homogeneous powder. Subsamples were dried at 105 °C, and all results are reported on a 105 °C basis. Nitrogen (and C to determine C:N) concentrations (%N) and δ15N of the samples were determined simultaneously on an isotope ratio mass spectrometer (Isoprime 100, Isoprime Limited, Manchester, UK ) coupled to an automatic online elemental analyzer (vario ISOTOPE cube, Elementar, Langenselbold, Germany). We used IAEA-600 and wheat flour with δ15N of 1.00 and 2.85‰ to correct the measured δ15N of the samples.

2.4. Calculations and Statistics

The δ15N data obtained after the one-year of 15N addition (June 2014) were adjusted to express the change in leaf δ15N by subtracting the δ15N found prior to the 15N addition in both treatments (January 2013). Species differences in leaf δ15N among the tree species and understory plant species were separately analyzed using one-way-analysis of variance (ANOVA). Tukey’s HSD pairwise comparison test was used to test for significant differences among tree species, and understory plant species. Effects of N addition (control vs. N-plot) on leaf δ15N of individual species were determined by a simple t-test. For ANOVA analyses, all ANOVA assumptions were fulfilled. All analyses were completed using R 3.2.0.

3. Results

3.1. Leaf %N

Leaf %N and C:N ratio in both tree and understory layers differed significantly (p < 0.001) among the studied species in both control and N-plots (Table 1). The studied tree species displayed two separate groups with Syzygium acuminatissimum, Castanopsis chinensis, and Cryptocarya chinensis having higher leaf %N (and a lower C:N ratio) than Memecylon ligustrifolium and Syzygium rehderianum (Table 1). Of the understory plants, Cryptocarya concinna had the highest leaf %N, which was significantly different from Alpinia chinensis, Calamus rhabdocladus, and Maesa salicifolia. The shrub Maesa salicifolia had significantly lower leaf %N than all the other understory plants. Decadal N addition did not cause significant change in leaf %N of any of the plant species investigated in both canopy and understory layers (Table 1).

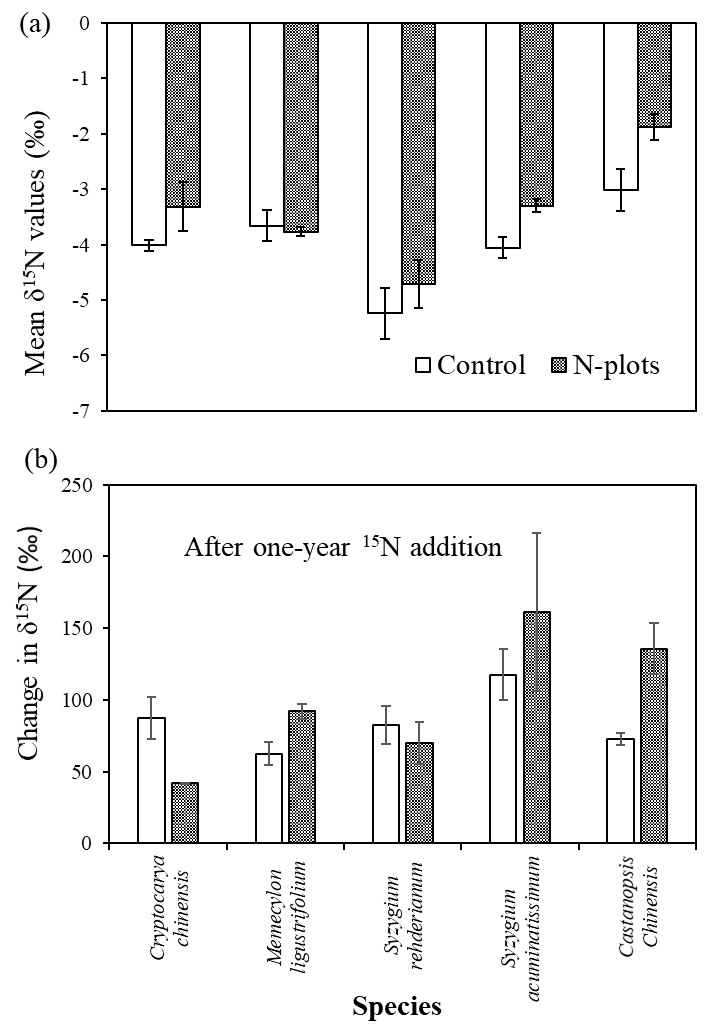
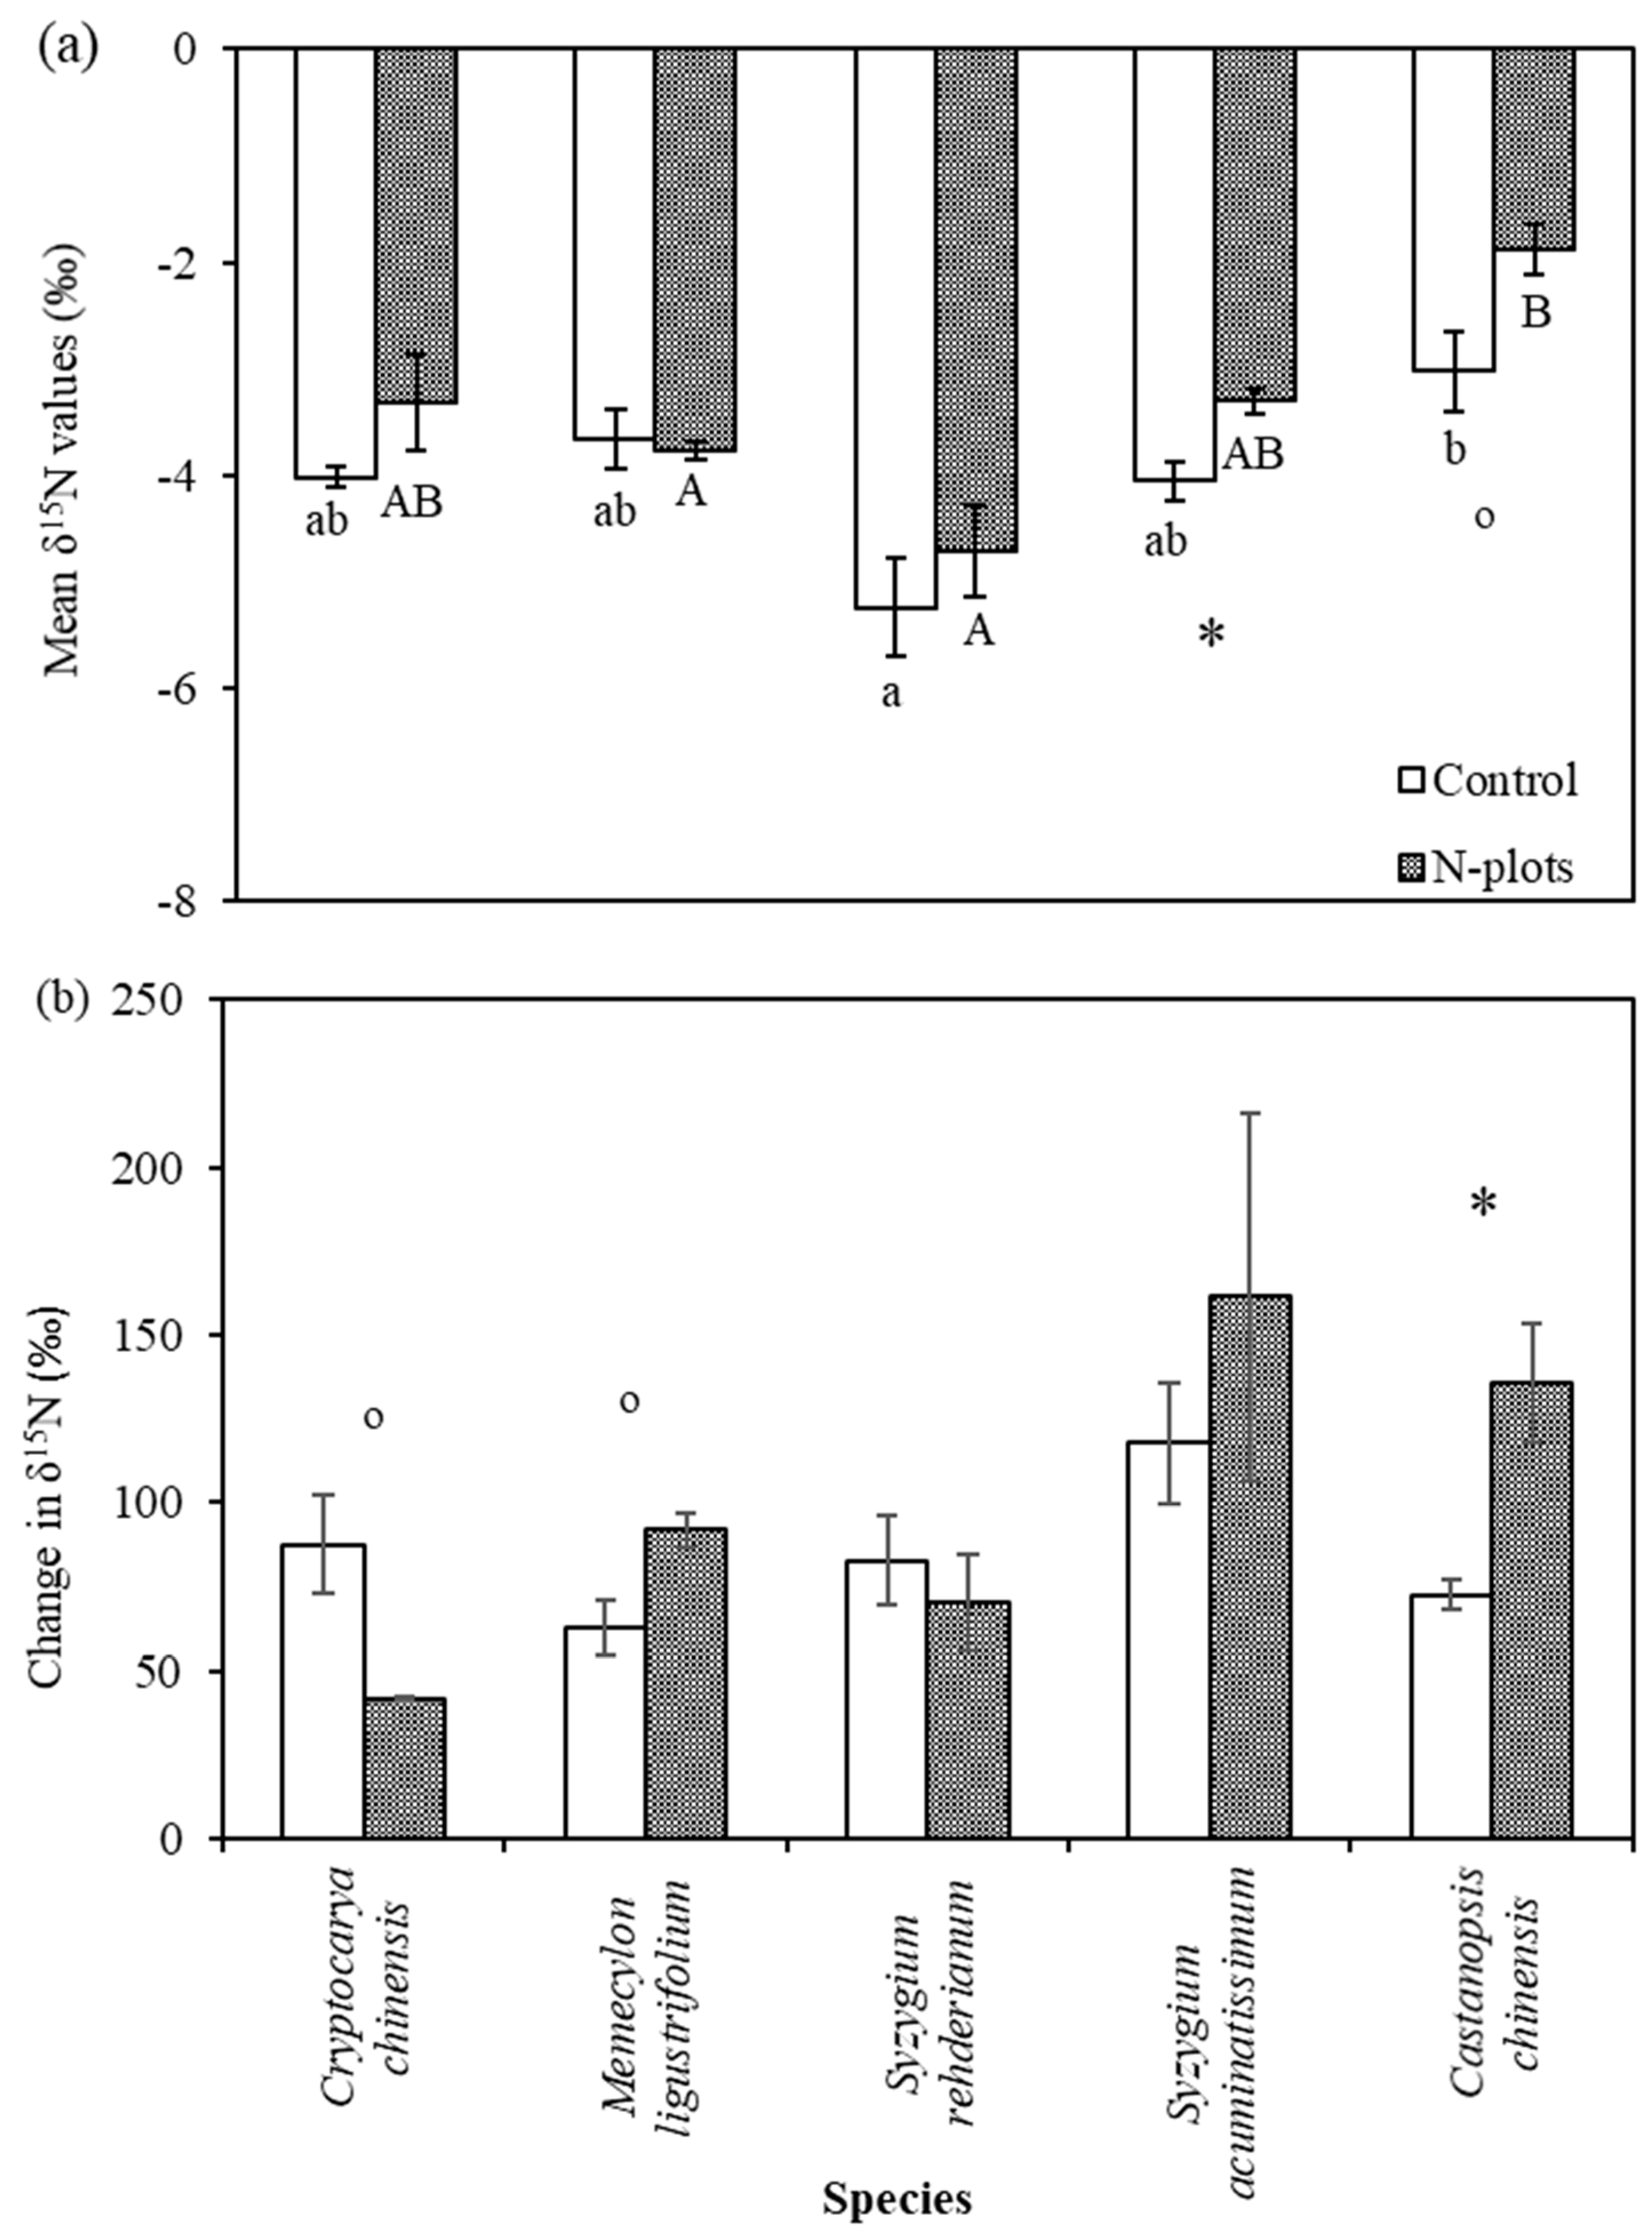
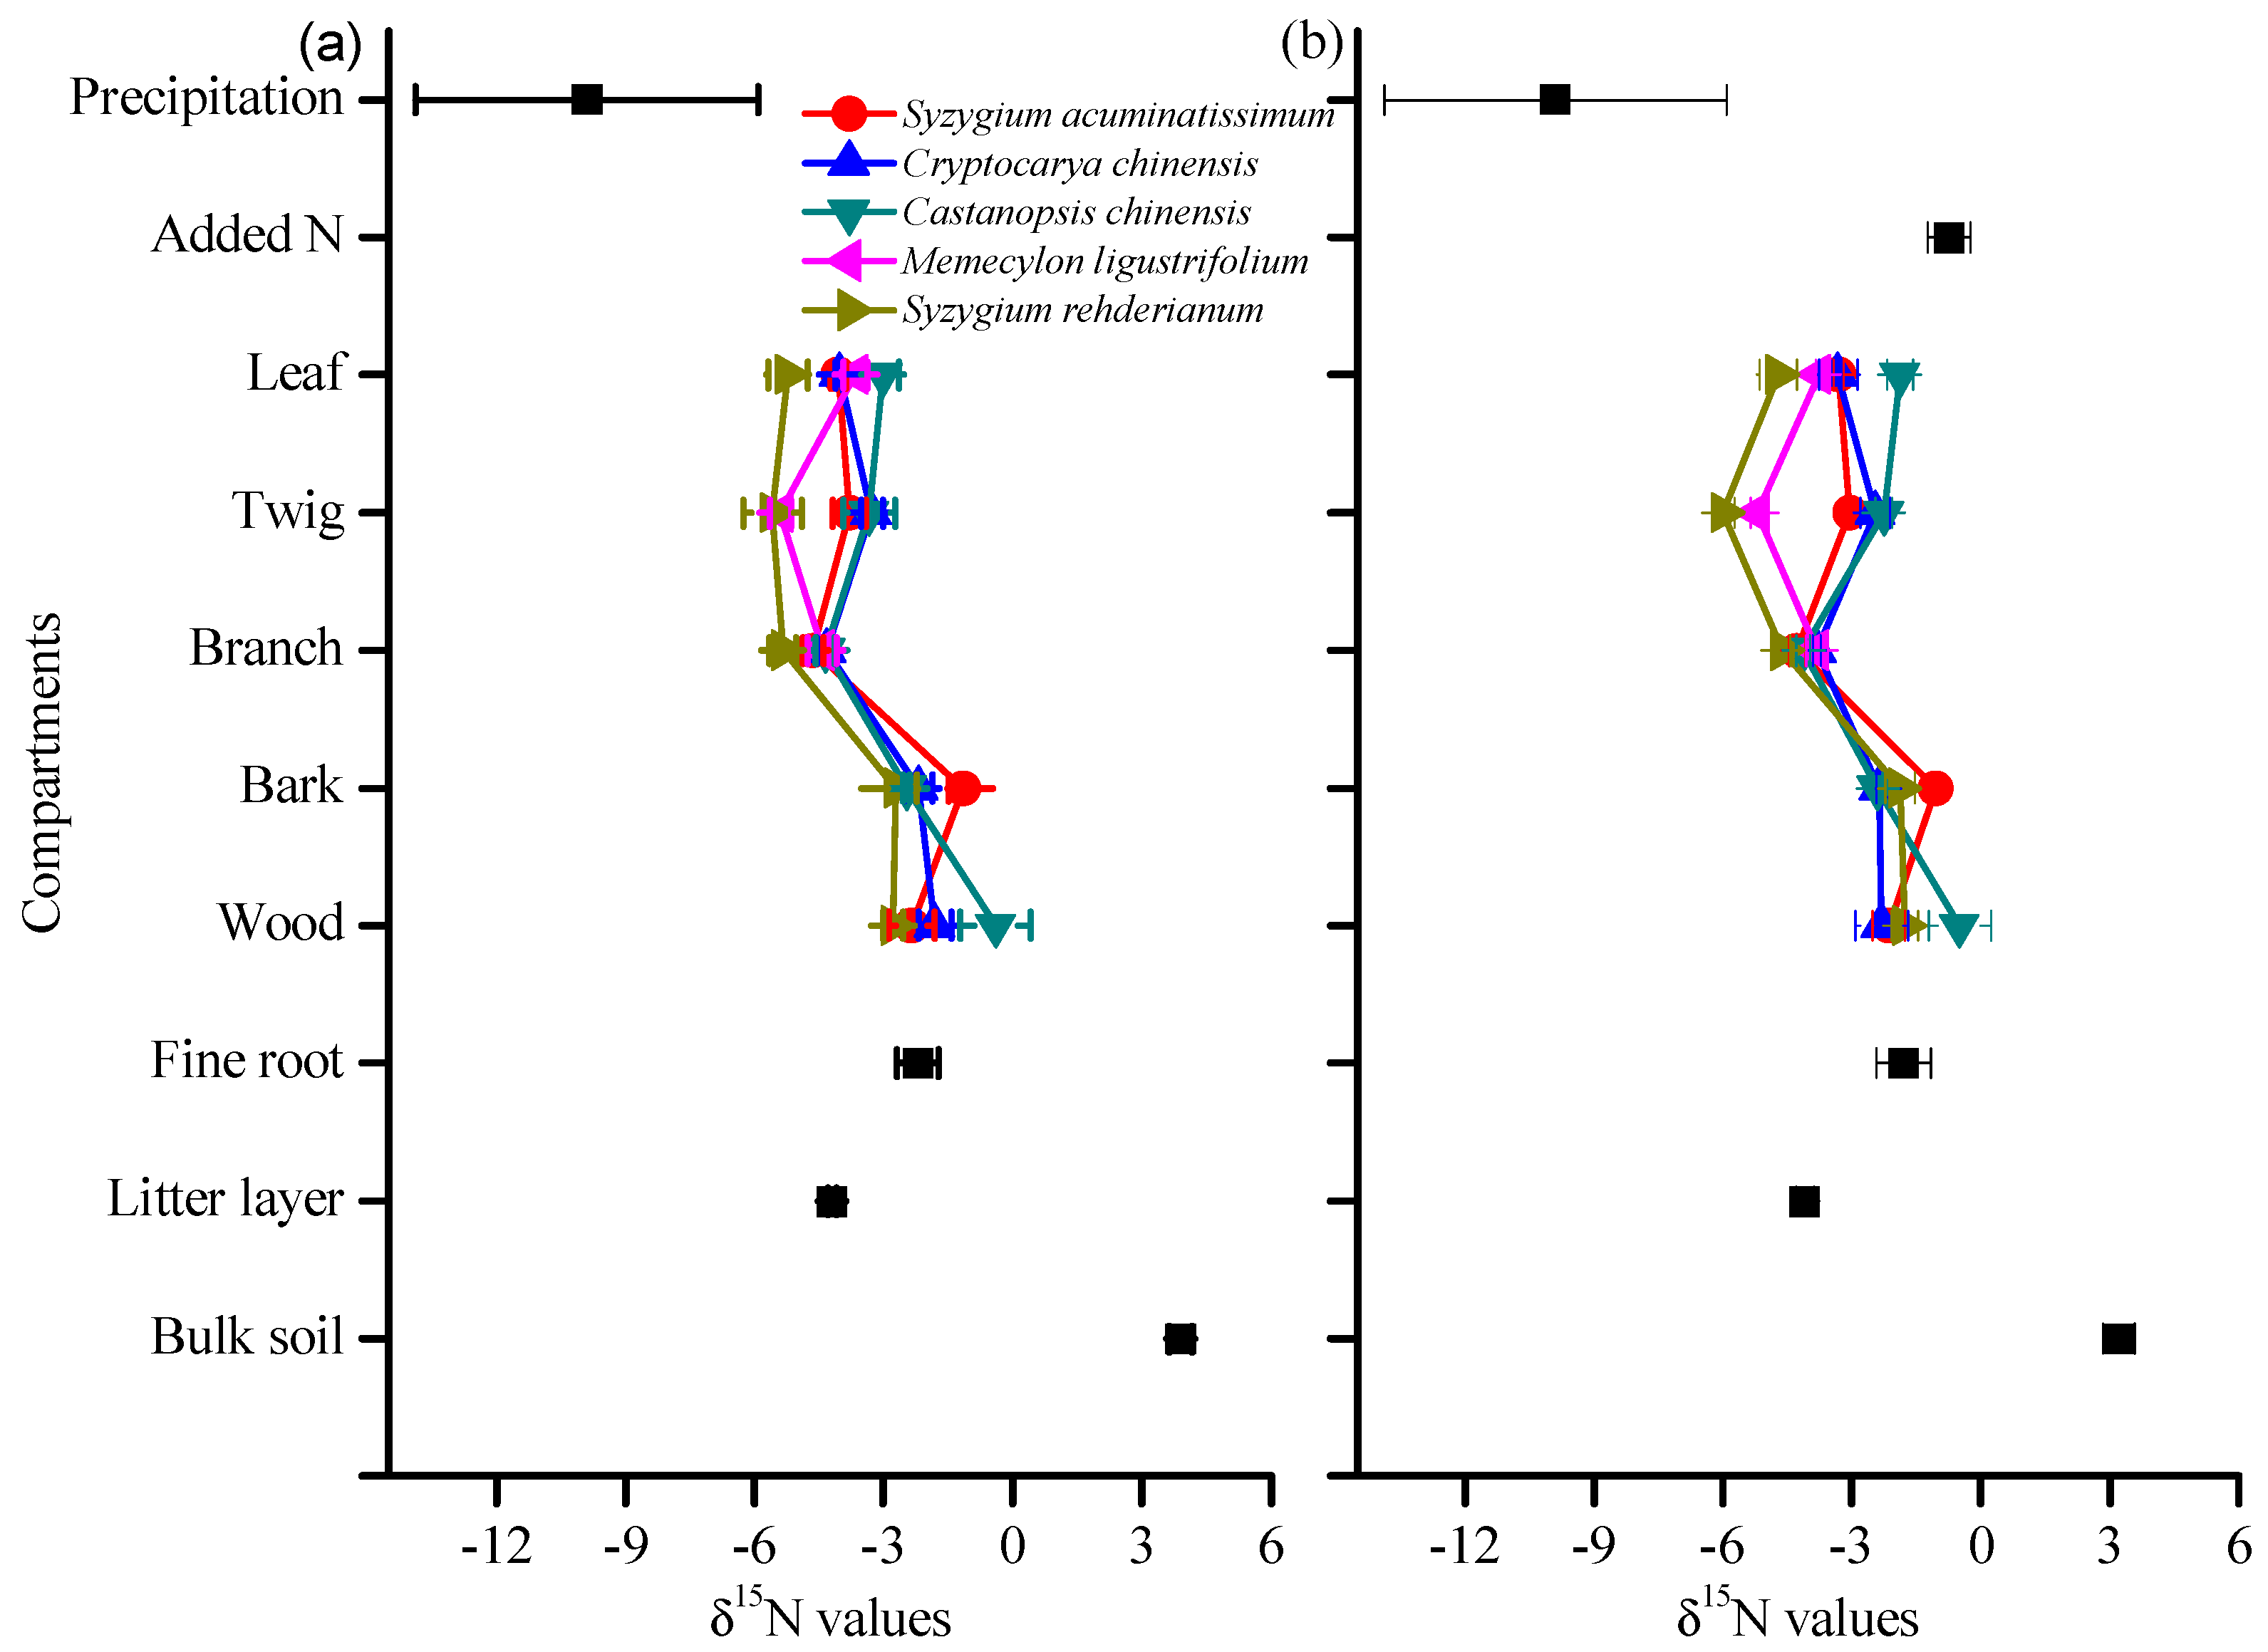
3.2. δ15N Values of Tree Compartments

Tree species had a significant (p < 0.001) effect on leaf δ15N in both control and N-plots (Figure 1). In control plots, a significant difference (p = 0.01) was observed between Syzygium rehderianum and Castanopsis chinensis, which had the lowest (−5.2 ± 0.5‰) and highest (−3.0 ± 0.4‰) leaf δ15Ns, respectively (Figure 1a, white bar). A similar difference between the two species was observed in the N-plots (Figure 1a, shaded bars). In the N-plots, leaf δ15N of Memecylon ligustrifolium also differed significantly from that of Castanopsis chinensis (Figure 1; shaded bars). Nitrogen addition generally increased leaf δ15N, i.e., it moved the δ15N towards the 15N signature of the added N, with significant change in leaves of Syzygium acuminatissimum at p ≤ 0.05 and Castanopsis chinensis at p ≤ 0.1 (Figure 1a, shaded bars).
Leaf 15N values of all studied tree species were significantly increased above their natural abundance (δ15N) values after 15N addition, as indicated by the changes in leaf δ15N of the tree species (Figure 1b). Leaf δ15N of the tree species obtained after the one-year 15N addition ranged from 40‰ to 160‰ (Table S1). There was no apparent significant species difference in the changes in leaf δ15N in either control and N-plots although leaf δ15N of the two tree species (Syzygium acuminatissimum and Castanopsis chinensis) that were more affected by the decadal N addition (Figure 1a) also showed larger changes in leaf δ15N after the 15N addition, particularly in the N-plots (Figure 1b, shaded bars).
For all tree species, δ15N increased from leaves to wood with visible variation among the five tree species in both control and N-plots and across tree compartments (Figure 2). δ15N values of all tree compartments lay between δ15N values of N in precipitation and soil N. Species variation in the twig δ15N was similar to the variation observed for leaf δ15N (Figure 1a). Syzygium rehderianum and Memecylon ligustrifolium had higher leaf C:N; Syzygium rehderianum tended to have the lowest δ15N across all compartments while Memecylon ligustrifolium also tended to be separated from the three other species with lower C:N ratios of 24 to 27 (Table 1).
The five tree species constitute different proportions of tree biomass in the experimental plots (Table S2). Thus, we calculated the N pool weighted plant δ15N for the trees and the results showed significant species variation in N pool weighted plant δ15N in both control (p = 0.01) and N-plots (p < 0.01) (Figure S1), which is similar to the pattern observed in leaf δ15N (Figure 1a).

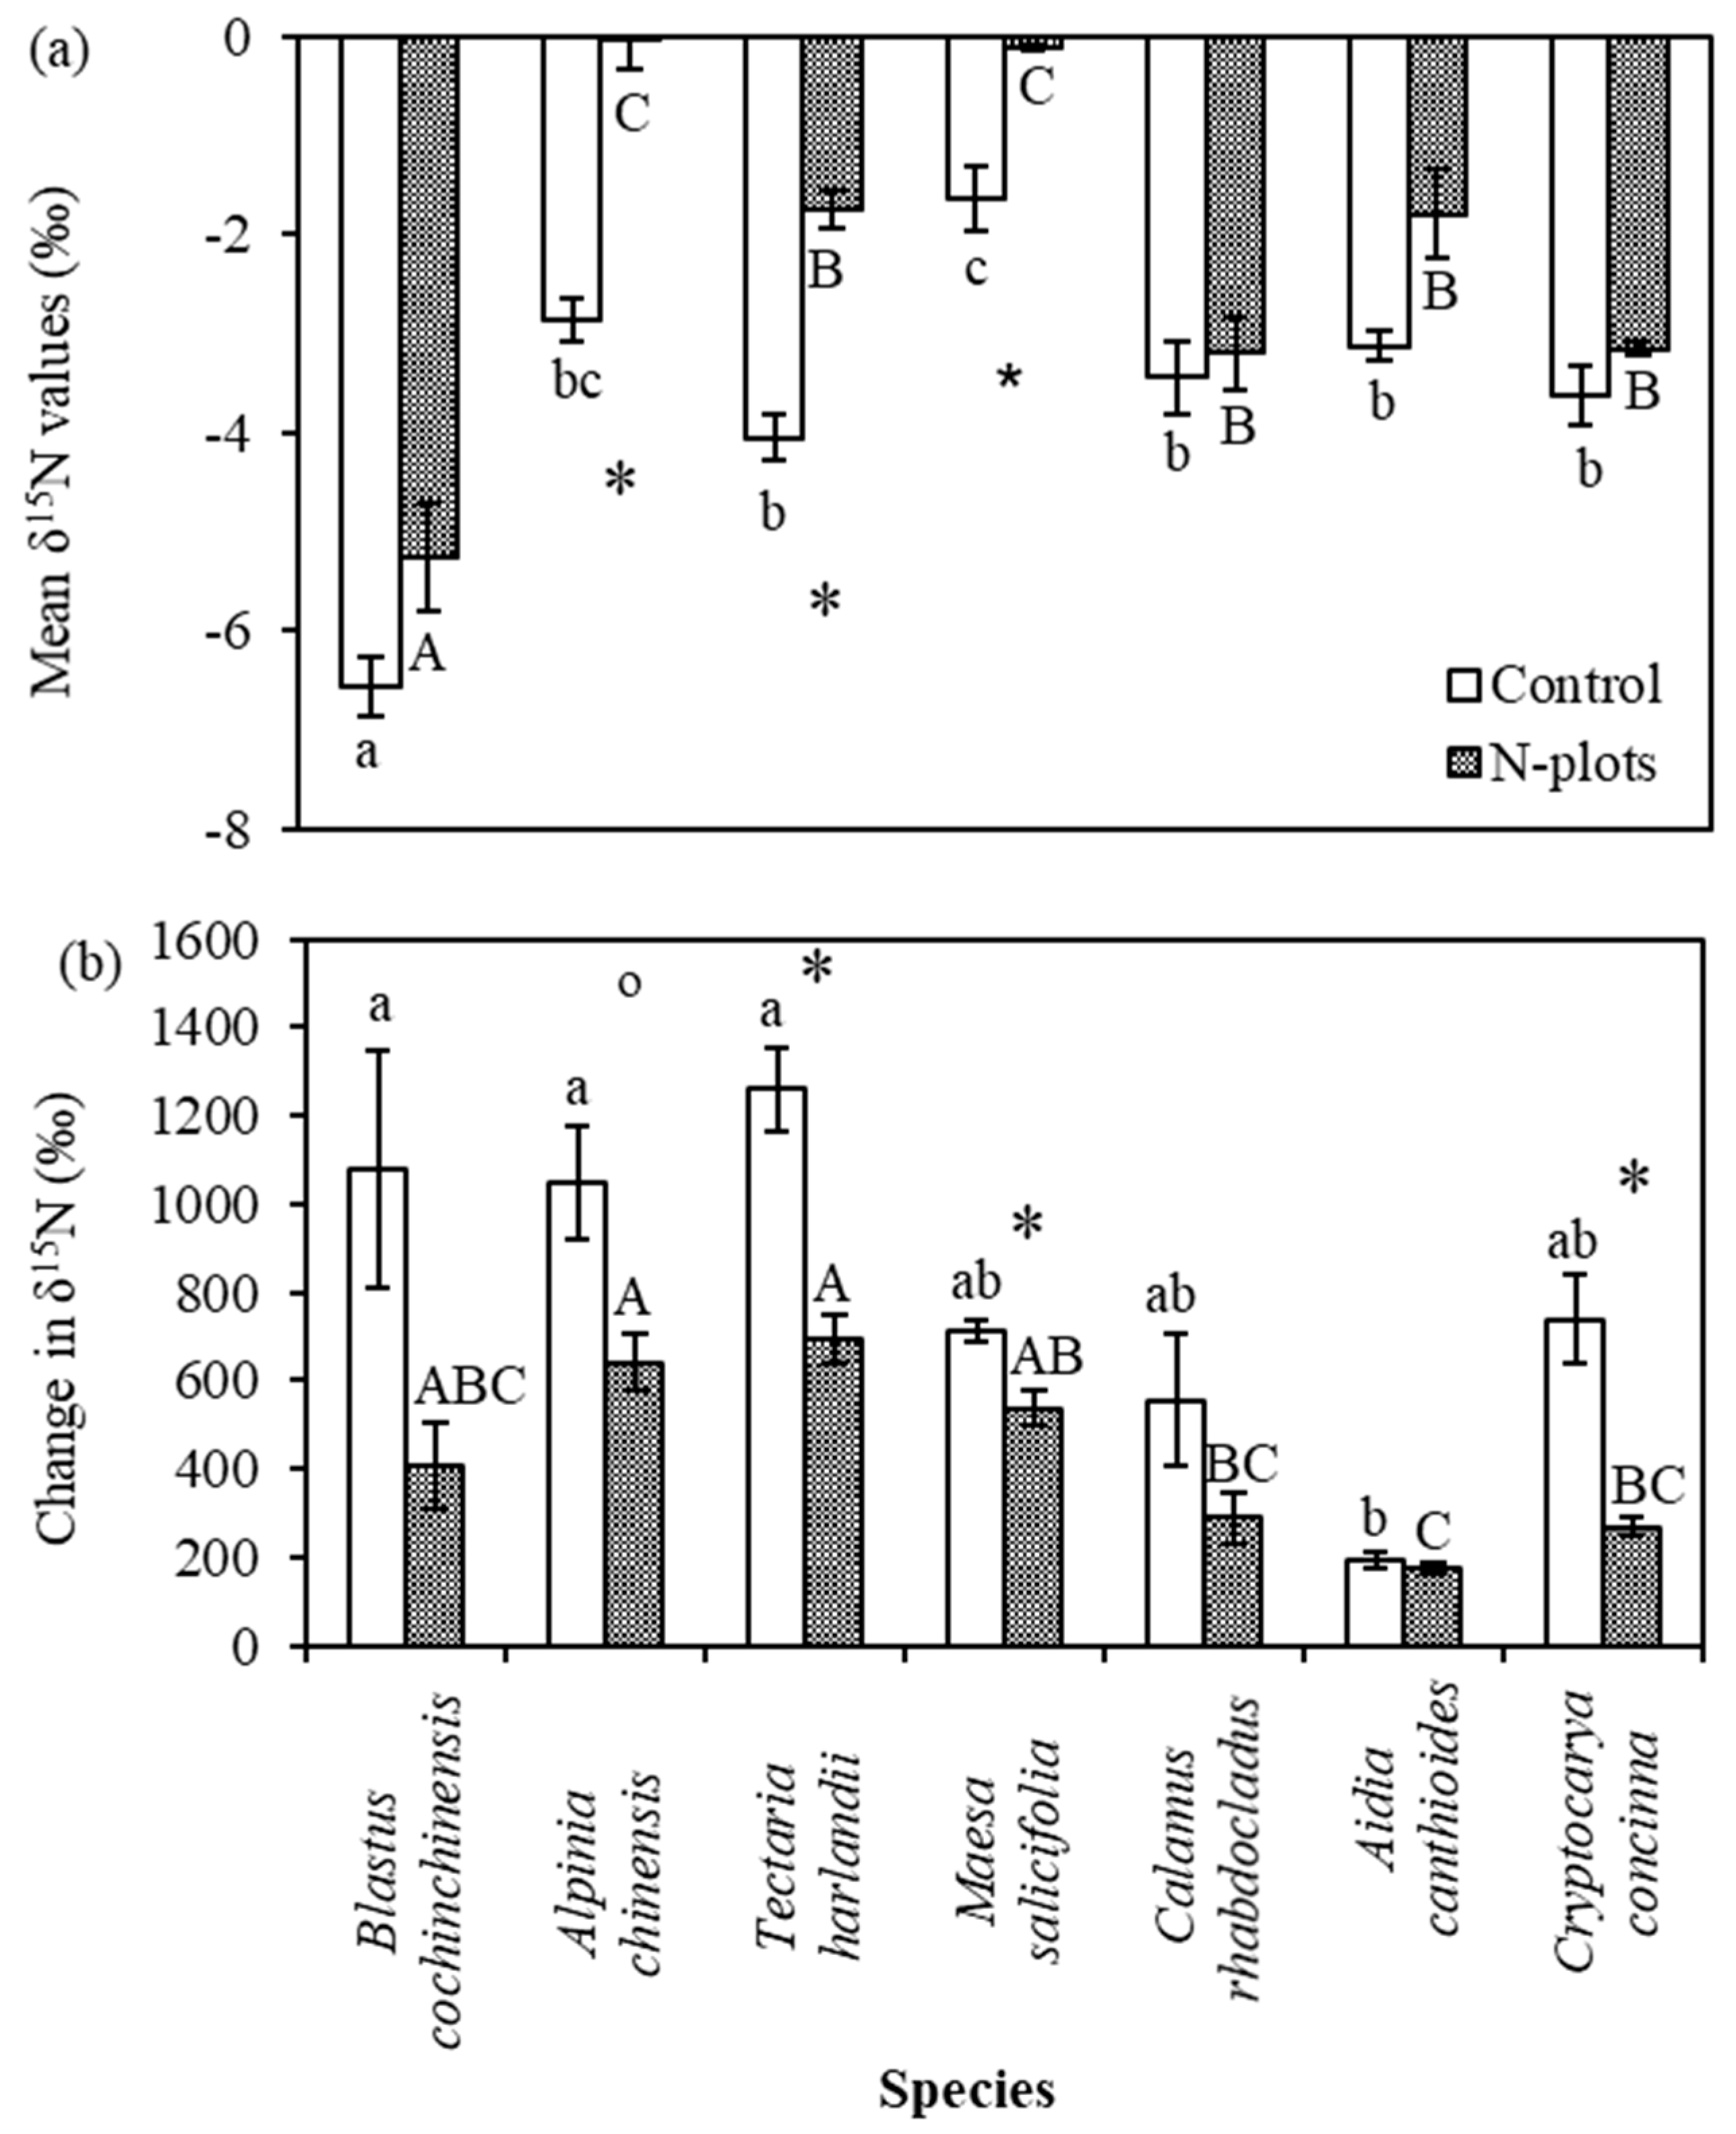
3.3. Leaf δ15N Values of Understory Plants

As in the tree layer, understory leaf δ15N values differed significantly (p < 0.001) among the plant species in both control (Figure 3a, white bars) and N-plots (Figure 3a, shaded bars). In the control plots, Blastus cochinchinensis had the lowest leaf δ15N value (−6.6 ± 0.2‰), which was significantly lower than that of all the other species. Maesa salicifolia had the highest leaf δ15N value (−1.6 ± 0.4‰), which was significantly different from that of the other species, except Alpinia chinensis. Nitrogen addition significantly increased leaf δ15N of Alpinia chinensis, Tectaria harlandii and Maesa salicifolia (Figure 3a, white bars vs. shaded bars). Leaf δ15N of the understory species after the year-long 15N tracer addition ranged from 170‰ to 1070‰ (Table S1). Thus, the 15N addition significantly increased the 15N abundance of all sampled understory plant species with Blastus cochinchinensis, Alpinia chinensis and Tectaria harlandii showing a stronger increase in leaf 15N in the control plots (Figure 3b, white bars). Similar species differences in the change in δ15N were apparent in the N-plots (Figure 3b, shaded bars). Three species, Tectaria harlandii, Maesa salicifolia, and Cryptocarya concinna, showed significantly higher changes in leaf δ15N in the control plots than in the N-plots (Figure 3b, shaded bars). Aidia canthioides had the lowest change in leaf δ15N compared to the other species in both the control and N-plots (Figure 3b).

4. Discussion

4.1. Species Variation in %N and Effects of N Addition

In N-limited ecosystems, variation in leaf %N among co-occurring plant species has been reported to reflect differences in N use efficiency [31] and interspecific competition for N [32]. Since the forest at DHSBR is regarded as N saturated, the cause of species differences in leaf %N observed at different levels of high N availability (control and N-plots) both in the tree and understory layers (Table 1) is unlikely to be interspecific competition. Instead, the species variation in leaf %N may simply indicate variation in composition of organic N compounds in their tissues as a result of high taxonomic diversity that creates significant chemical and structural variation in the canopy [33], which is often reflected in plant leaf chemistry [34,35]. For example, Phillips et al. [35] showed that variation in leaf %N, phosphorus (P) and the N:P ratio of species within individual tropical forest canopies (trees and large lianas) or plant families exceed that of a biome-wide database on all temperate trees. Lack of significant effects of decadal N addition on leaf %N of any of the plant species we sampled (Table 1) could indicate that the plants are already N-rich, hence N addition may not affect N availability in the forest. A previous study conducted in the old-growth forest at DHSBR showed that plant (tree and understory) growth generally did not show a positive growth response to N addition [36,37], indicating that N is a non-limiting nutrient at the study site. Observed high leaching loss of N, under both ambient and N addition conditions [26,38,39], and soil acidification due to N addition in the forest [40] also confirm that the forest is N saturated as a result of long-term N accumulation and high ambient N deposition >30 kg N ha−1 yr−1 over the past 15–20 years [26,39,41]. Another reason for the lack of an N addition effect (increase) on leaf %N could be because of P-limitation in the forest, which is evident from high average foliar N:P ratios of leaves (28.3) and forest floors (37) [42], suggesting strong P-limitation at our study site. Thus, in addition to the increased N deposition in the region, P-limitation in the study forest may make the forest sensitive to increased N input with additional external N input only leading to negative consequences.

4.2. 15N-Depleted Plants at DHSBR

Nitrogen-rich forests, like the one we used in this study, are expected to be more 15N-enriched compared to predominately N-limited temperate and boreal forests [43]. This is thought to be due to increased fractionation during soil N transformation processes in N-rich soil that cause gaseous and leaching loss of the isotopically lighter 14N and plant uptake of 15N-enriched residual soil N [44]. Indeed, 15N-enriched leaf δ15Ns (>3‰) have been observed in tropical plants in the Amazonian basins [22,45,46]. In contrast to this expectation for tropical forests, leaf δ15N values of all the studied plant species at DHSBR are 15N-depleted (−3‰ to −7‰) (Figure 1a and Figure 3a), even compared to the average leaf δ15N values (~ −3‰) reported for global temperate forests [43]. A previous study in the same old-growth forest at DHSBR reported similar 15N-depleted (−3‰ to −7‰) leaf δ15N [47]. Similarly, the observed leaf δ15N range at our study site is within the range (−7‰ to 1.3‰) observed in different tropical forests located across southern China [24,48]. Similar ranges indicating low leaf δ15N values have also been reported in eastern Asia, including −4.8% to 0.02% for tropical forests in Malaysia [49] and −6% to −2.2% for a subtropical forest in Taiwan [50]. However, comparison of leaf δ15N among sites and interpretation of any observed difference and/or similarity is not straight forward due to many confounding factors related to site and plant (species-specific) traits [17]. For example, leaf δ15N values of the same plant species appear to vary across forest successional stages [24]. Nevertheless, the consistent 15N-depletion of plants at DHSBR and other subtropical forests in southeastern Asia regardless of their differences in vegetation (species) composition could be caused by 15N-depleted high N deposition, particularly NH4-N [51]. Our observation of increased δ15N values of the studied plant species following addition of N and 15N confirm the previous observation that δ15N of input N can directly affect plant δ15N [17]. Moreover, increased fractionation during plant uptake under the high N availability in the region [17,52] could contribute to the 15N-depletion of leaf δ15N in these forests.

4.3. Species Variation in δ15N and Its Response to N and 15N Addition

Differences often exist among plant parts (leaves, branches, stems and roots) [53,54] due to multiple assimilation events, organ-specific loss of N, different patterns of N assimilation and reallocation of N that leads to the intra-plant variation in δ15N [52]. Although, the magnitude of the differences may depend on species type [55] and plant functional type [56], any average differences are generally small, and foliar δ15N values are often used as an index of whole plant δ15N. We also observed a similar species variation pattern between N pool weighted plant δ15N in trees (Figure S1) and leaf δ15N (Figure 1a). Thus, we focus on species variation in leaf δ15N, which is more significant compared to the small variation in δ15N of the other tree compartments both within and among the tree species (Figure 2).
The significant variation in leaf δ15N of up to 3‰ among understory and tree species in both control and N-plots (Figure 1a and Figure 3a) confirmed our first and second hypotheses that leaf δ15N would significantly vary among the co-occurring plant species under both ambient and decadal N addition. The species variation in leaf δ15N observed at our study site is within the range (0–10‰) often observed among co-occurring plant species [57], and it is consistent with results reported from some forests in southeastern Asia [49,50,58]. Given that the range of variation in plant δ15N observed at a particular site increases with the number of plant species sampled [59], the narrow species variation observed for few plant species (dominant ones that are found in all replicate plots) at our site may not indicate a general pattern in tropical forests. A wider leaf δ15N range (>10‰) reported in N-rich tropical forests such as those in the Amazon where higher number of plant species were sampled [22,45] evidently indicates biogeochemical heterogeneity of tropical plant species both in single sites and biome-wide. Interestingly, at a larger scale, a considerably larger range of δ15N has been found in the tropical forests than in temperate forests [22,43]. Thus, different mechanisms may result in high leaf δ15N ranges in N-limited and N-rich systems. Interpreting variation among species within a site is complicated due to the multiple processes influencing δ15N values. Various mechanisms including differences in N sources (biological N2 fixation, depositional N, soil N) and forms of N (e.g., NH4+, NO3) utilized [60,61], mycorrhizal dependence [20] and discrimination against 15N during root N uptake and assimilation [55,62] have been proposed to explain species differences in leaf δ15N within an ecosystem. Here, we discuss some of the plausible mechanisms that could underlie the observed species variation in leaf δ15N in our study forest.
None of the plant species included in this study are N2-fixing (i.e., they do not belong to the Fabaceae family), indicating that the plants predominately acquire N from inorganic soil N and/or depositional N, which have different δ15N values (Table S3). The observed variation in leaf δ15N among the plants indicates that the studied co-occurring plants uptake different proportions of N sources (deposition or soil) and N forms (NH4+, NO3) with different 15N signatures due to species-specific preference and/or due to differences in their ability to access these N forms (e.g., different rooting depth). Moreover, previous studies in the same forest observed that δ15N of bulk soil N increased with soil depth [41] and the δ15N values of NH4+ and NO3 are different within the soil profile [47]. The studied plant species may access soil N from different soil layers (with distinct δ15N values) because of differences in their rooting patterns that were previously observed for the pioneer plant species in DHSBR [63]. 15N signature of deposited N can alter plant δ15N when directly acquired by plants on leaf surfaces or by altering the 15N signature of available N in the soil [17,64]. Difference in direct uptake of the deposited N (with multiple N compounds with variable 15N signature) among the plants can also contribute to the observed species variation in leaf δ15N [64]. We observed that leaf δ15N of all the studied species increased after decadal N addition in both tree (Figure 1a, shaded bars) and understory layers (Figure 3a, shaded bars), but the magnitude of the changes were different. This confirms part of our second hypothesis that the response of leaf δ15N to N would be different among the plant species, and it suggests differences among the plant species in access to (use of or dependence on) external N input (deposited or added N). Our second hypothesis was further confirmed by the observed species difference in leaf δ15N in response to the year-long 15N tracer addition, especially in the understory plants, where the species difference was significant in both control and N-plots (Figure 3b). The change in leaf δ15N after 15N addition was higher in the understory plants than in the tree (Figure 1b and Figure 3b), indicating understory plants have more access to the added 15N. Within understory plants, smaller understory species that were directly spayed on (Blastus cochinchinensis, Calamus rhabdocladus and Cryptocarya concinna) showed larger changes in leaf δ15N compared to the other relatively taller plants, indicating likely foliar uptake of the added 15N in the smaller plants (Figure 3b). In the dominant understory species, the change in leaf δ15N was generally higher in the control plots than in the N-plots for all species (Figure 3b). Since the added 15N was more diluted in the N-plots (added with fertilizer) than in the control plots, this contrast (higher changes in leaf δ15N in control plots) was expected in the change in leaf δ15N assuming similar uptake rates of the added 15N in the two treatments.
Another potential source of the species variation in δ15N could be the difference in mycorrhizal association [21]. In N-limited ecosystems, ectomycorrhizal plants (ECM) are found to be more 15N-depleted compared to co-occurring arbuscular mycorrhizal plants (AM) [65]. Emerging evidence from N-rich (sub)tropical ecosystems [66,67] and temperate forests subjected to high N deposition [18,68], however, indicate more 15N-enrichment of ECM plants compared with co-occurring AM plants. We found that the two ECM trees (Syzygium acuminatissimum and Castanopsis chinensis), on average, have significantly lower leaf C:N ratio in both control and N-plots (Table S4) and are more 15N-enriched than the three AM trees (Cryptocarya chinensis, Memecylon ligustrifolium and Syzygium rehderianum) in both control and N-plots (Figure S2). The 15N-enrichment of ECM in N-rich systems is reported to indicate either direct uptake of soil N by the trees without mediation by ectomycorrhiza, or absence of strong 15N-fractionation during the fungal transfer of N to the host trees [65,66,69]. We also found that the change in leaf δ15N was more pronounced in the ECM trees than in the AM trees (Figure S2), as also reported by a recent tracer study [70], indicating that the ECM trees may have more access to deposited N than AM trees, which in turn suggests that N acquisition of ECM plants may be more sensitive to N deposition than that of AM trees. In the understory layer, only Blastus cochinchinensis, the most 15N-depleted with low δ15N values in both control (−6.6‰) and N-plots (−5.3‰), and Calamus rhabdocladus (also with lower δ15N value) (Figure 3a) were identified as AM plants. Information about mycorrhizal association of the other understory species is not available, thus the pattern between mycorrhizal type and leaf δ15N in the understory plants could not be discussed. Nevertheless, our findings support previous remarks that plants with different mycorrhizal groups differ in their N cycling, and information about the contrasting N cycling in the mycorrhizal groups could be useful in predicting how these plants will respond to environmental change factors [71]; this could be an important area of research in these ecosystems.

5. Conclusions

Our study found significant species differences in leaf %N and δ15N among the studied plant species both in the tree and understory layers. The observed species variation in leaf δ15N was attributed to differences in N acquisition, mainly the primary sources and forms of N used by the different plant species. Leaf %N of all plant species was not significantly affected by decadal N addition, likely because the plant tissues are N-rich due to N saturation of the forest from long-term N accumulation and high ambient N deposition. The species-dependent responses of leaf δ15N to N and 15N additions were interpreted as representing species differences in accessing or in dependence on N sources and N forms (with different 15N signatures), which are partly related to their differences in mycorrhizal association. The results suggest that N acquisition traits or strategies of these co-occurring plants may differ, and they may also be differently affected by atmospheric N deposition. Our study also highlights that information about the mycorrhizal type of tropical plants (particularly at our study site) could be important to fully understand N acquisition of the plants and its response to changes in N input. However, such information is very scant, and it merits further investigation. Overall, our results highlight the importance of considering plant species variation in subtropical forests characterized by high taxonomic diversity when studying N cycling and its response to N deposition.

Supplementary Materials

The following are available online at https://www.mdpi.com/1999-4907/10/11/991/s1, Figure S1: N pool-weighted plant δ15N of five dominant tree species in Dinghushan Biosphere Reserve (DHSBR) in control plots and N addition plots, Figure S2: Mean leaf δ15N of arbuscular mycorrhizal (AM) and ectomycorrhizal (ECM) trees in Dinghushan Biosphere Reserve (DHSBR); Table S1: Foliar δ15N values of dominant co-occurring tree and understory plant species in Dinghushan Biosphere Reserve (DHSBR) in control and N-plots before (sampled in January 2013) and after one-year 15N addition (sampled in June 2014) in the two treatments, Table S2: Estimated leaf biomass (kg ha−1) of dominant tree species in the experimental plots of the old-growth broad-leaved forest at Dinghushan Biosphere Reserve (DHSBR), southern China, Table S3: Mean concentration (mg N L−1) and δ15N values of NH4-N, NO3-N and DON in precipitation, throughfall and soil solution in control plots (September 2012 to February 2013). Table S4: Leaf C:N ratio of the studied tree species grouped as ectomycorrhizal (ECM) and arbuscular mycorrhizal plants (AM).

Author Contributions

Conceptualization, G.A.G. and P.G.; Data curation, G.A.G.; Formal analysis, G.A.G.; Funding acquisition, X.L., P.G. and J.M.; Investigation, G.A.G., X.L. and Q.M.; Methodology, G.A.G. and P.G.; Project administration, X.L. and P.G.; Resources, X.L., Y.F. and J.M.; Supervision, P.G. and J.M.; Validation, X.L., P.G. and J.M.; Visualization, G.A.G; Writing—original draft, G.A.G; Writing—review & editing, G.A.G, X.L., P.G., Q.M., Y.F. and J.M.

Funding

This research was funded by National Natural Science Foundation of China (No. 41922056, 41731176, 31700422), and, Sino-Danish Centre for Education and Research (SDC).

Acknowledgments

The authors would like to thank Lijie Deng, Cong Wang, Xiaoping Pan for their skillful assistance in laboratory and field work. We would also like to extend out thanks to Tamara Fletcher, postdoctoral researcher at Institute of Applied Ecology, Chinese Academy of Science, Shenyang, for proofreading the manuscript for English Editing.

Conflicts of Interest

The authors declare no conflict of interest.

References

  1. Galloway, J.N.; Dentener, F.J.; Capone, D.G.; Boyer, E.W.; Howarth, R.W.; Seitzinger, S.P.; Asner, G.P.; Cleveland, C.C.; Green, P.A.; Holland, E.A.; et al. Nitrogen cycles: Past, present, and future. Biogeochemistry 2004, 70, 153–226. [Google Scholar] [CrossRef]
  2. Galloway, J.N.; Townsend, A.R.; Erisman, J.W.; Bekunda, M.; Cai, Z.; Freney, J.R.; Martinelli, L.A.; Seitzinger, S.P.; Sutton, M.A. Transformation of the nitrogen cycle: Recent trends, questions, and potential solutions. Science 2008, 320, 889–892. [Google Scholar] [CrossRef] [PubMed]
  3. Townsend, A.R.; Cleveland, C.C.; Houlton, B.Z.; Alden, C.B.; White, J.W. Multi-element regulation of the tropical forest carbon cycle. Front. Ecol. Environ. 2011, 9, 9–17. [Google Scholar] [CrossRef]
  4. Currie, W.S.; Nadelhoffer, K.J.; Aber, J.D. Redistributions of 15N highlight turnover and replenishment of mineral soil organic N as a long-term control on forest C balance. For. Ecol. Manag. 2004, 196, 109–127. [Google Scholar] [CrossRef]
  5. Hobbie, S.E. Effects of plant species on nutrient cycling. Trends Ecol. Evol. 1992, 7, 336–339. [Google Scholar] [CrossRef]
  6. Lovett, G.M.; Weathers, K.C.; Arthur, M.A.; Schultz, J.C. Nitrogen cycling in a northern hardwood forest: Do species matter? Biogeochemistry 2004, 67, 289–308. [Google Scholar] [CrossRef]
  7. Melillo, J.M.; Aber, J.D.; Muratore, J.F. Nitrogen and lignin control of hardwood leaf litter decomposition dynamics. Ecology 1982, 63, 621–626. [Google Scholar] [CrossRef]
  8. Gurmesa, G.A.; Schmidt, I.K.; Gundersen, P.; Vesterdal, L. Soil carbon accumulation and nitrogen retention traits of four tree species grown in common gardens. For. Ecol. Manag. 2013, 309, 47–57. [Google Scholar] [CrossRef]
  9. Vesterdal, L.; Schmidt, I.K.; Callesen, I.; Nilsson, L.O.; Gundersen, P. Carbon and nitrogen in forest floor and mineral soil under six common European tree species. For. Ecol. Manag. 2008, 255, 35–48. [Google Scholar] [CrossRef]
  10. Dawud, S.M.; Raulund-Rasmussen, K.; Domisch, T.; Finér, L.; Jaroszewicz, B.; Vesterdal, L. Is tree species diversity or species identity the more important driver of soil carbon stocks, C/N ratio, and pH? Ecosystems 2016, 19, 645–660. [Google Scholar] [CrossRef]
  11. Bobbink, R.; Hicks, K.; Galloway, J.; Spranger, T.; Alkemade, R.; Ashmore, M.; Bustamante, M.; Cinderby, S.; Davidson, E.; Dentener, F.; et al. Global assessment of nitrogen deposition effects on terrestrial plant diversity: A synthesis. Ecol. Appl. 2010, 20, 30–59. [Google Scholar] [CrossRef] [PubMed]
  12. Hietz, P.; Turner, B.L.; Wanek, W.; Richter, A.; Nock, C.A.; Wright Joseph, S.; Wright, S.J. Long-term change in the nitrogen cycle of tropical forests. Science 2011, 334, 664–666. [Google Scholar] [CrossRef] [PubMed]
  13. Van der Sleen, P.; Vlam, M.; Groenendijk, P.; Anten, N.P.R.; Bongers, F.; Bunyavejchewin, S.; Hietz, P.; Pons, T.L.; Zuidema, P.A. 15N in tree rings as a bio-indicator of changing nitrogen cycling in tropical forests: An evaluation at three sites using two sampling methods. Front. Plant Sci. 2015, 6, 229. [Google Scholar] [CrossRef] [PubMed]
  14. Kahmen, A.; Wanek, W.; Buchmann, N. Foliar δ15N values characterize soil N cycling and reflect nitrate or ammonium preference of plants along a temperate grassland gradient. Oecologia 2008, 156, 861–870. [Google Scholar] [CrossRef] [PubMed]
  15. Michelsen, A.; Schmidt, I.K.; Jonasson, S.; Quarmby, C.; Sleep, D. Leaf 15N abundance of subarctic plants provides field evidence that ericoid, ectomycorrhizal and non- and arbuscular mycorrhizal species access different sources of soil nitrogen. Oecologia 1996, 105, 53–63. [Google Scholar] [CrossRef] [PubMed]
  16. Templer, P.H.; Mack, M.C.; Chapin, F.S.; Christenson, L.M.; Compton, J.E.; Crook, H.D.; Currie, W.S.; Curtis, C.J.; Dail, D.B.; D’Antonio, C.M.; et al. Sinks for nitrogen inputs in terrestrial ecosystems: A meta-analysis of 15N tracer field studies. Ecology 2012, 93, 1816–1829. [Google Scholar] [CrossRef]
  17. Craine, J.M.; Brookshire, E.N.J.; Cramer, M.D.; Hasselquist, N.J.; Koba, K.; Marin-Spiotta, E.; Wang, L. Ecological interpretations of nitrogen isotope ratios of terrestrial plants and soils. Plant Soil 2015, 396, 1–26. [Google Scholar] [CrossRef] [Green Version]
  18. Schulze, E.D.; Chapin, F.S.; Gebauer, G. Nitrogen nutrition and isotope differences among life forms at the northern treeline of Alaska. Oecologia 1994, 100, 406–412. [Google Scholar] [CrossRef]
  19. Michelsen, A.; Quarmby, C.; Sleep, D.; Jonasson, S. Vascular plant 15N natural abundance in heath and forest tundra ecosystems is closely correlated with presence and type of mycorrhizal fungi in roots. Oecologia 1998, 115, 406–418. [Google Scholar] [CrossRef]
  20. Craine, J.M.; Elmore, A.J.; Aidar, M.P.; Bustamante, M.; Dawson, T.E.; Hobbie, E.A.; Kahmen, A.; Mack, M.C.; McLauchlan, K.K.; Michelsen, A.; et al. Global patterns of foliar nitrogen isotopes and their relationships with climate, mycorrhizal fungi, foliar nutrient concentrations, and nitrogen availability. New Phytol. 2009, 183, 980–992. [Google Scholar] [CrossRef]
  21. Nadelhoffer, K.; Shaver, G.; Fry, B.; Giblin, A.; Johnson, L.; McKane, R. 15N natural abundances and N use by tundra plants. Oecologia 1996, 107, 386–394. [Google Scholar] [CrossRef] [PubMed]
  22. Ometto, J.P.H.B.; Ehleringer, J.R.; Domingues, T.F.; Berry, J.A.; Ishida, F.Y.; Mazzi, E.; Higuchi, N.; Flanagan, L.B.; Nardoto, G.B.; Martinelli, L.A. The stable carbon and nitrogen isotopic composition of vegetation in tropical forests of the Amazon Basin, Brazil. Biogeochemistry 2006, 79, 251–274. [Google Scholar] [CrossRef]
  23. Viani, R.A.G.; Rodrigues, R.R.; Dawson, T.E.; Oliveira, R.S. Functional differences between woodland savannas and seasonally dry forests from south-eastern Brazil: Evidence from 15N natural abundance studies. Austral Ecol. 2011, 36, 974–982. [Google Scholar] [CrossRef]
  24. Wang, A.; Fang, Y.T.; Chen, D.X.; Koba, K.; Makabe, A.; de Li, Y.; Luo, T.S.; Yoh, M. Variations in nitrogen-15 natural abundance of plant and soil systems in four remote tropical rainforests, southern China. Oecologia 2014, 174, 567–580. [Google Scholar] [CrossRef] [PubMed]
  25. Mo, J.; Brown, S.; Xue, J.; Fang, Y.; Li, Z. Response of litter decomposition to simulated N deposition in disturbed, rehabilitated and mature forests in subtropical China. Plant Soil 2006, 282, 135–151. [Google Scholar] [CrossRef]
  26. Fang, Y.; Gundersen, P.; Mo, J.; Zhu, X.W. Input and output of dissolved organic and inorganic nitrogen in subtropical forests of South China under high air pollution. Biogeosciences 2008, 5, 339–352. [Google Scholar] [CrossRef] [Green Version]
  27. Huang, Z.L.; Kong, G.H.; Yu, Q.F.; Zhang, Z.H. The hydrological processes and nitrogen dynamics in a monsoon evergreen broad-leaved forest of Dinghu Shan. Acta Phytoecol. Sin. 2000, 24, 157–161. [Google Scholar]
  28. Gurmesa, G.A. Fate of Deposited Nitrogen in Tropical Forests in Southern China. Ph.D. Thesis, University of Copenhagen, Copenhagen, Denmark, 5 February 2016. [Google Scholar]
  29. Lu, X.; Gilliam, F.S.; Yu, G.; Li, L.; Mao, Q.; Chen, H.; Mo, J. Long-term nitrogen addition decreases carbon leaching in a nitrogen-rich forest ecosystem. Biogeosciences 2013, 10, 3931–3941. [Google Scholar] [CrossRef] [Green Version]
  30. Mo, J.; Brown, S.; Peng, S.L.; Kong, G.; Mo, H.M.; Brown, S.; Peng, S.L.; Kong, G. Nitrogen availability in disturbed, rehabilitated and mature forests of tropical China. For. Ecol. Manag. 2003, 175, 573–583. [Google Scholar] [CrossRef]
  31. Field, C.; Merino, J.; Mooney, H.A. Compromises between water-use efficiency and nitrogen-use efficiency in five species of California evergreens. Oecologia 1983, 60, 384–389. [Google Scholar] [CrossRef]
  32. Magill, A.H.; Aber, J.D.; Hendricks, J.J.; Bowden, R.D.; Melillo, J.M.; Steudler, P.A. Biogeochemical response of forest ecosystems to simulated chronic nitrogen deposition. Ecol. Appl. 1997, 7, 402–415. [Google Scholar] [CrossRef]
  33. Townsend, A.; Asner, G.; Cleveland, C. The biogeochemical heterogeneity of tropical forests. Trends Ecol. Evol. 2008, 23, 424–431. [Google Scholar] [CrossRef] [PubMed]
  34. Reich, P.B.; Walters, M.B. Photosynthesis-nitrogen relations in Amazonian tree species. Oecologia 2004, 97, 62–72. [Google Scholar] [CrossRef] [PubMed]
  35. Phillips, O.L.; Martínez, R.V.; Mendoza, A.M.; Baker, T.R.; Vargas, P.N. Large lianas as hyperdynamic elements of the tropical forest canopy. Ecology 2005, 86, 1250–1258. [Google Scholar] [CrossRef]
  36. Lu, X.; Mo, J.; Gilliam, F.S.; Zhou, G.; Fang, Y. Effects of experimental nitrogen additions on plant diversity in an old-growth tropical forest. Glob. Chang. Biol. 2010, 16, 2688–2700. [Google Scholar] [CrossRef] [Green Version]
  37. Lu, X.; Vitousek, P.M.; Mao, Q.; Gilliam, F.S.; Luo, Y.; Zhou, G.; Zou, X.; Bai, E.; Scanlon, T.M.; Hou, E.; et al. Plant acclimation to long-term high nitrogen deposition in an N-rich tropical forest. Proc. Natl. Acad. Sci. USA 2018, 115, 5187–5192. [Google Scholar] [CrossRef] [Green Version]
  38. Fang, Y.; Yoh, M.; Mo, J.; Gundersen, P.; Zhou, G. Response of Nitrogen Leaching to Nitrogen Deposition in Disturbed and Mature Forests of Southern China. Pedosphere 2009, 19, 111–120. [Google Scholar] [CrossRef]
  39. Fang, Y.; Gundersen, P.; Vogt, R.D.; Koba, K.; Chen, F.; Chen, X.Y.; Yoh, M. Atmospheric deposition and leaching of nitrogen in Chinese forest ecosystems. J. For. Res. 2011, 16, 341–350. [Google Scholar] [CrossRef]
  40. Lu, X.; Mao, Q.; Gilliam, F.S.; Luo, Y.; Mo, J. Nitrogen deposition contributes to soil acidification in tropical ecosystems. Glob. Chang. Biol. 2014, 20, 3790–3801. [Google Scholar] [CrossRef]
  41. Gurmesa, G.A.; Lu, X.; Gundersen, P.; Mao, Q.; Zhou, K.; Fang, Y.; Mo, J. High retention of 15N-labeled nitrogen deposition in a nitrogen saturated old-growth tropical forest. Glob. Chang. Biol. 2016, 22, 3608–3620. [Google Scholar] [CrossRef]
  42. Hou, E.; Chen, C.; McGroddy, M.E.; Wen, D. Nutrient Limitation on Ecosystem Productivity and Processes of Mature and Old-Growth Subtropical Forests in China. PLoS ONE 2012, 22, 3608–3620. [Google Scholar] [CrossRef]
  43. Martinelli, L.A.; Piccolo, M.C.; Townsend, A.R.; Vitousek, P.M.; Cuevas, E.; McDowell, W.; Robertson, G.P.; Santos, O.C.; Treseder, K. Nitrogen stable isotopic composition of leaves and soil: Tropical versus temperate forests. Biogeochemistry 1999, 46, 45–65. [Google Scholar] [CrossRef]
  44. Mayor, J.R.; Wright Joseph, S.; Schuur, E.A.; Brooks, M.E.; Turner, B.L. Stable nitrogen isotope patterns of trees and soils altered by long-term nitrogen and phosphorus addition to a lowland tropical rainforest. Biogeochemistry 2014, 119, 293–306. [Google Scholar] [CrossRef] [Green Version]
  45. Nardoto, G.B.; Quesada, C.A.; Patino, S.; Saiz, G.; Baker, T.R.; Schwarz, M.; Schrodt, F.; Feldpausch, T.R.; Domingues, T.F.; Marimon, B.S.; et al. Basin-wide variations in Amazon forest nitrogen-cycling characteristics as inferred from plant and soil N-15:N-14 measurements. Plant Ecol. Divers. 2014, 7, 173–187. [Google Scholar] [CrossRef]
  46. Domingues, T.F.; Martinelli, L.A.; Ehleringer, J.R. Ecophysiological traits of plant functional groups in forest and pasture ecosystems from eastern Amazonia, Brazil. Plant Ecol. 2007, 193, 101–112. [Google Scholar] [CrossRef]
  47. Koba, K.; Isobe, K.; Takebayashi, Y.; Fang, Y.; Sasaki, Y.; Saito, W.; Yoh, M.; Mo, J.; Liu, L.; Lu, X.; et al. Delta N-15 of soil N and plants in a N-saturated, subtropical forest of southern China. Rapid Commun. Mass Spectrom. 2010, 24, 2499–2506. [Google Scholar] [CrossRef]
  48. Fang, Y.; Yoh, M.; Koba, K.; Zhu, W.; Takebayashi, Y.; Xiao, Y.; Lei, C.; Mo, J.; Zhang, W.; Lu, X. Nitrogen deposition and forest nitrogen cycling along an urban-rural transect in southern China. Glob. Chang. Biol. 2011, 17, 872–885. [Google Scholar] [CrossRef]
  49. Kitayama, K.; Iwamoto, K. Patterns of natural 15N abundance in the leaf-to-soil continuum of tropical rain forests differing in N availability on Mount Kinabalu, Borneo. Plant Soil 2001, 229, 203–212. [Google Scholar] [CrossRef]
  50. Liu, C.P.; Yeh, H.W.; Sheu, B.H. N isotopes and N cycle in a 35-year-old plantation of the Guandaushi subtropical forest ecosystem, central Taiwan. For. Ecol. Manag. 2006, 235, 84–87. [Google Scholar] [CrossRef]
  51. Gurmesa, G.A.; Lu, X.; Gundersen, P.; Fang, Y.; Mao, Q.; Hao, C.; Mo, J. Nitrogen input 15N signatures are reflected in plant 15N natural abundances in subtropical forests in China. Biogeosciences 2017, 14, 2359–2370. [Google Scholar] [CrossRef]
  52. Evans, R.D. Physiological mechanisms influencing plant nitrogen isotope composition. Trends Plant Sci. 2001, 6, 121–126. [Google Scholar] [CrossRef]
  53. Kolb, K.J.; Evans, R.D. Implications of leaf nitrogen recycling on the nitrogen isotope composition of deciduous plant tissues. New Phytol. 2002, 156, 57–64. [Google Scholar] [CrossRef]
  54. Emmett, B.A.; Kjonaas, O.J.; Gundersen, P.; Koopmans, C.; Tietema, A.; Sleep, D. Natural abundance of N-15 in forests across a nitrogen deposition gradient. For. Ecol. Manag. 1998, 101, 9–18. [Google Scholar] [CrossRef]
  55. Pardo, L.H.; Semaoune, P.; Schaberg, P.G.; Eagar, C.; Sebilo, M. Patterns in δ15N in roots, stems, and leaves of sugar maple and American beech seedlings, saplings, and mature trees. Biogeochemistry 2013, 112, 275–291. [Google Scholar] [CrossRef]
  56. Dijkstra, P.; Williamson, C.; Menyailo, O.; Doucett, R.; Koch, G.; Hungate, B.A. Nitrogen stable isotope composition of leaves and roots of plants growing in a forest and a meadow. Isot. Environ. Health Stud. 2003, 112, 275–291. [Google Scholar] [CrossRef]
  57. Handley, L.L.; Raven, J.A. The use of natural abundance of nitrogen isotopes in plant physiology and ecology. Plant Cell Environ. 1992, 15, 965–985. [Google Scholar] [CrossRef]
  58. Sheng, W.; Yu, G.; Fang, H.; Liu, Y.; Wang, Q.; Chen, Z.; Zhang, L. Regional patterns of 15N natural abundance in forest ecosystems along a large transect in eastern China. Sci. Rep. 2014, 4, 4249. [Google Scholar] [CrossRef]
  59. Craine, J.M.; Towne, E.G.; Ocheltree, T.W.; Nippert, J.B. Community traitscape of foliar nitrogen isotopes reveals N availability patterns in a tallgrass prairie. Plant Soil 2012, 356, 395–403. [Google Scholar] [CrossRef]
  60. Xu, Y.; He, J.; Cheng, W.; Xing, X.; Li, L. Natural 15N abundance in soils and plants in relation to N cycling in a rangeland in Inner Mongolia. J. Plant Ecol. 2010, 3, 201–207. [Google Scholar] [CrossRef]
  61. Falkengren-Grerup, U.; Michelsen, A.; Olsson, M.O.; Quarmby, C.; Sleep, D. Plant nitrate use in deciduous woodland: The relationship between leaf N, 15N natural abundance of forbs and soil N mineralisation. Soil Biol. Biochem. 2004, 36, 1885–1891. [Google Scholar] [CrossRef]
  62. Wania, R.; Hietz, P.; Wanek, W. Natural 15N abundance of epiphytes depends on the position within the forest canopy: Source signals and isotope fractionation. Plant Cell Environ. 2002, 25, 581–589. [Google Scholar] [CrossRef]
  63. Hao, Y.-R.; Peng, S.-L.; Mo, J.-M.; Liu, X.-W.; Chen, Z.-Q.; Zhou, K.; Wu, J.-R. Roots of pioneer trees in the lower sub-tropical area of Dinghushan, Guangdong, China. J. Zhejiang Univ. Sci. B 2006, 7, 377–385. [Google Scholar] [CrossRef] [Green Version]
  64. Vallano, D.M.; Sparks, J.P. Foliar δ15N is affected by foliar nitrogen uptake, soil nitrogen, and mycorrhizae along a nitrogen deposition gradient. Oecologia 2013, 172, 47–58. [Google Scholar] [CrossRef] [PubMed]
  65. Hobbie, E.A.; Högberg, P. Nitrogen isotopes link mycorrhizal fungi and plants to nitrogen dynamics. New Phytol. 2012, 196, 367–382. [Google Scholar] [CrossRef] [PubMed]
  66. Mayor, J.R.; Mack, M.C.; Schuur, E.A.G. Decoupled stoichiometric, isotopic, and fungal responses of an ectomycorrhizal black spruce forest to nitrogen and phosphorus additions. Soil Biol. Biochem. 2015, 88, 247–256. [Google Scholar] [CrossRef] [Green Version]
  67. Tedersoo, L.; Naadel, T.; Bahram, M.; Pritsch, K.; Buegger, F.; Leal, M.; Kõljalg, U.; Põldmaa, K. Enzymatic activities and stable isotope patterns of ectomycorrhizal fungi in relation to phylogeny and exploration types in an afrotropical rain forest. New Phytol. 2012, 195, 832–843. [Google Scholar] [CrossRef] [PubMed]
  68. Pardo, L.; Templer, P.; Goodale, C.; Duke, S.; Groffman, P.; Adams, M.; Boeckx, P.; Boggs, J.; Campbell, J.; Colman, B.; et al. Regional assessment of N saturation using foliar and root delta N-15. Biogeochemistry 2006, 80, 143–171. [Google Scholar] [CrossRef]
  69. Mayor, J.R.; Schuur, E.A.G.; Henkel, T.W. Elucidating the nutritional dynamics of fungi using stable isotopes. Ecol. Lett. 2009, 12, 171–183. [Google Scholar] [CrossRef]
  70. Goodale, C.L. Multiyear fate of a 15 N tracer in a mixed deciduous forest: Retention, redistribution, and differences by mycorrhizal association. Glob. Chang. Biol. 2017, 23, 867–880. [Google Scholar] [CrossRef]
  71. Lin, G.; McCormack, M.L.; Ma, C.; Guo, D. Similar below-ground carbon cycling dynamics but contrasting modes of nitrogen cycling between arbuscular mycorrhizal and ectomycorrhizal forests. New Phytol. 2017, 213, 1440–1451. [Google Scholar] [CrossRef]
Figure 1. Leaf δ15N values of co-occurring dominant tree species in Dinghushan Biosphere Reserve (DHSBR): (a) natural δ15N abundance in control and N-plots; and (b) changes in leaf δ15N values after one year of 15N tracer addition in both treatments. The change in leaf δ15N values in (b) was determined by subtracting the δ15N found prior to the 15N addition presented in (a) from the leaf δ15N values obtained after the one-year 15N tracer addition in each treatment. Error bars indicate SE among plots (n = 3). In graph (a), tree species means with different letters indicate significant species differences (p < 0.05) in the control plots (lowercase letters) and in the N-plots (uppercase letters). In graph (b), species differences are not significant. In both (a) and (b), significant effects of N addition on leaf δ15N of a given species are indicated by * (p < 0.05) and o (p < 0.1).
Forests 10 00991 g001
Figure 2. δ15N values of tree compartments of dominant co-occurring tree species in Dinghushan Biosphere Reserve (DHSBR) sampled prior to 15N addition: (a) in the control plots; and (b) in the N-plots including the δ15N values of the N source end points (precipitation, added N and bulk soil). δ15N of N in precipitation are from Gurmesa (2016) [28]. Error bars indicate SE (n = 3).
Forests 10 00991 g002
Figure 3. Leaf δ15N values of dominant co-occurring understory plant species in Dinghushan Biosphere Reserve (DHSBR): (a) natural δ15N abundance in control and in N-plots; and (b) changes in leaf δ15N values after one year of 15N tracer addition in both treatments. The change in leaf δ15N values in (b) was determined by subtracting the δ15N found prior to the 15N addition presented in (a) from the leaf δ15N values obtained after the one-year 15N tracer addition in each treatment. Error bars indicate SE (n = 3). For each graph, species means with different letters indicate significant species differences (p < 0.05) in control plots (lowercase letters) and in N-plots (uppercase letters). Significant effects of N addition within species are indicated by * (p < 0.05) and o (p < 0.1).
Forests 10 00991 g003
Table 1. Mean leaf %N and C:N ratio for dominant tree species and understory plant species in the control and N-plots at Dinghushan Biosphere Reserve (DHSBR) sampled in January 2013. Values in parentheses show SE among plots (n = 3). Different lowercase letters for each variable within each treatment plots and each plant group (tree and understory) indicate significant differences among plant species (p ≤ 0.05). No significant differences in leaf %N or C:N ratio were observed among control and N-plots for any species.
Species NameGrowth Form%NC:N Ratio
ControlN-plotsControlN-plots
Trees
Syzygium acuminatissimumTree1.95 (0.09)a2.06 (0.04)a25.5 (1.0)b23.7 (0.4)c
Castanopsis chinensisTree1.94 (0.08)a1.76 (0.02)b24.9 (1.1)b27.2 (0.2)bc
Cryptocarya chinensisTree1.97 (0.00)a1.95 (0.12)ab25.9 (0.2)b26.5 (1.7)bc
Memecylon ligustrifoliumTree1.34 (0.04)b1.35 (0.08)c32.2 (0.9)a32.4 (1.9)ab
Syzygium rehderianumTree1.37 (0.02)b1.33 (0.04)c34.3 (0.6)a36.0 (1.0)a
Understory plants
Alpinia chinensisHerb1.40 (0.10)c1.53 (0.02)c32.5 (3.3)a29.2 (0.3)a
Blastus cochinchinensisWoody shrub2.09 (0.08)ab2.15 (0.03)ab21.3 (0.7)b20.5 (0.2)c
Calamus rhabdocladusLiana1.86 (0.06)b1.58 (0.03)c24.3 (0.9)b28.2 (0.5)a
Cryptocarya concinnaUnderstory tree2.50 (0.10)a2.34 (0.05)a20.2 (0.8)b21.5 (0.5)c
Tectaria harlandiiFern2.16 (0.04)ab2.13 (0.00)ab20.0 (0.3)b20.7 (0.1)c
Maesa salicifoliaShrub2.01(0.02)b1.96 (0.04)b23.6 (0.2)b24.3 (0.6)b
Aidia canthioidesUnderstory tree2.23 (0.06)ab2.18 (0.07)ab20.6 (0.6)b21.0 (0.7)c

