Article

Dominant Tree Species Shape Soil Microbial Community via Regulating Assembly Processes in Planted Subtropical Forests

1
Research Institute of Tropical Forestry, Chinese Academy of Forestry, Longdong, Guangzhou 510520, China
2
Department of Biological Sciences, Florida International University, Miami, FL 33199, USA
*
Author to whom correspondence should be addressed.
Forests 2019, 10(11), 978; https://doi.org/10.3390/f10110978
Submission received: 21 September 2019 / Revised: 25 October 2019 / Accepted: 1 November 2019 / Published: 4 November 2019
(This article belongs to the Section Forest Ecology and Management)

Abstract

:
Understanding the ecological processes that regulate microbial community assembly in different habitats is critical to predict microbial responses to anthropogenic disturbances and environmental changes. Rubber (Hevea brasiliensis) and Eucalypt (Eucalyptus urophylla) plantations (thereafter RP and EP) are rapidly established at the expense of forests in tropical China, greatly affecting tropical soils and their processes. However, the assembly processes of soil microbial communities after forest conversions remain unclear. We investigated soil microbial communities’ attributes and quantified the portion of deterministic assembly variation in two RP (a 3- and a 5-year-old) and two EP (a 2- and a 4-year-old) in Southern China. Shannon and Faith’s Phylogenetic α-diversity of both bacterial and fungal communities were higher in RP than in EP, regardless of plantation age or soil depth (0–50 cm). Bacterial and fungal community structure was significantly different among the four plantations. The dominant microbial taxa in RP closely tracked the availability of nitrogen, phosphorus and potassium (K) while those in EP were closely related to the high total K content. Microbial co-occurrence networks in RP were more modular than those in EP, as governed by more keystone taxa that were strongly dependent on soil available nutrients. Environmental filtering imposed by soil nutrients heterogeneity contributed a considerable portion (33–47%) of bacterial assembly variation in RP, but much less (8–14%) in EP. The relative contribution of environmental selection on fungal assembly was also greater in RP than in EP. Our findings suggest that in RP clear microbial community patterns exist with respect to soil nutrients, whereas in EP microbial community assembly patterns are more stochastic and variable. The large variation in soil microbial community assembly patterns in EP could lead to fragile and unstable microbial-soil relationships, which may be one factor driving soil degradation in EP.

Graphical Abstract

1. Introduction

Understanding microbial assembly processes is a central goal in the field of microbial ecology, as it can reveal the fundamental rules for microbial taxonomic and phylogenetic structure across temporal and spatial scales [1,2,3]. Assemblage of microbial communities can be governed by deterministic processes that are imposed by environmental selections, which are traditionally recognized as the most important processes modulating microbial community evolution and diversification [4,5,6]. In recent years, the stochastic processes, such as drift, dispersal limitation and birth and death, have been proposed to interact with deterministic processes during microbial assembly in various ecosystems [7,8,9,10]. Moreover, the relative importance of deterministic versus stochastic processes in regulating microbial community structure can be highly variable across habitats. Some studies have proposed an increasing proportion of deterministic processes along the chronosequence of long-term disturbances, though emphasis has been given to the stochastic processes at the initial stage of disturbance [10,11]. Although soil microbiota is jointly shaped by the deterministic and stochastic processes under anthropogenic disturbances, such as fertilization [12], climate warming [11], and land use changes [10], the relative importance of these two processes is still unclear.
Soil microorganisms act as the engineers of biogeochemical processes and play a critical role in maintaining functional and structural stability of forest ecosystems via influencing soil nutrients content and aboveground productivity [13,14]. Although there is putative functional redundancy among some microbial taxa, the taxa responsible for different soil nutrient transformations are mostly unique [15,16]. Thus, shifts in soil microbial structure are generally parallel with changes in their functions. Microbial community network analysis can shed lights on the correlations between microbial structure and functions. Soil microbial communities consist of a vast diversity of taxa that generally interact with each other via competition and/or mutuality to accomplish their functions (e.g., soil biogeochemical and ecosystem processes), which consequently form complex species co-occurrence networks [17,18]. Microbial networks have been previously determined in soils from various ecosystems, including farmland, forest and grassland [19,20,21,22,23]. Most studies also use microbial network analysis to reveal the keystone taxa that play a critical role in modulating the whole network structure and function, as they often show the dominant relationship among taxa [24,25]. Moreover, recent studies have demonstrated remarkable alternations in soil microbial networks and their keystone taxa in response to anthropogenically induced environmental changes (e.g., extreme drought, elevated CO2 and deforestation) [20,21,24]. These environmental changes may act as deterministic selection forces, which cause community-level stochasticity to decrease. The environmental changes caused by conversions of natural forests to monoculture plantations, which have attracted much attention in recent years, are important drivers of soil microbial community reconstruction [26]. However, soil microbial communities show what kind of reconstruction and to what extent the reconstruction can occur under those environmental changes remain elusive.
An increasing number of tropical and subtropical forests have been converted to Rubber and Eucalypts monoculture plantations due to their prompt and vast economic benefits [27]. The considerable reduction in soil organic carbon and nutrients content, increases in soil compaction, and erosion following conversions of forests to Rubber and Eucalypt plantations have compromised soil fertility and soil carbon sequestration [28]. The leaf litter quality of Rubber and Eucalyptus is low, because they are high in polysaccharides and phenolic compounds, which can inhibit soil biological processes [29,30]. The impacts of Rubber and Eucalypt trees on the pedosphere are distinctive due to the differences of their litter quality and quantity, generally with a stronger reduction of soil nutrients content in the Eucalypt compared to Rubber plantations [31,32]. Moreover, it has been hypothesized that different plants can select for certain soil microbiomes to guarantee the functional resilience of the pedosphere after disturbance [33]. As a result, soil microbial structure and its controlling factors may differ between the Eucalypt and Rubber plantations. However, establishing the main influential factors and determining to what extent variance of soil microbial community can be explained by these factors in Rubber and Eucalypt plantations remain debatable. Lan et al. [34] demonstrated a marked increase in the relative abundance of Firmicutes while a decrease in Acidobacteria after conversion of tropical forests to rubber plantations, which was mainly attributed to the alternations in soil pH and phosphorus (P). According to Li et al. [35], soil pH and P are also important in driving soil bacterial composition changes after conversion of forest to Eucalypt plantations. Another study evidenced that soil microbial variation along with the succession of Eucalypt plantations was shaped by the combination of various soil properties (e.g., pH, organic mature, nitrogen, P and potassium) [36]. Recent studies from Lan et al. [37,38] suggested that the effects of seasonal changes on soil microbial community overwhelmed the effects of forest conversions, which could explain a large part (31.9%) of the total bacterial composition variance in both plantations and natural forests. However, in the context of seasonal variation, in remains unclear which environmental factors (e.g., soil moisture, temperature and nutrients content) play a decisive role in soil microbial community. Both Rubber and Eucalypt plantations could impact soil microbial community in many aspects, including communities’ composition, functions, abundance and diversity mainly through altering soil physiochemical properties [39,40,41], which may disrupt ecological interactions and ecosystem functional potentials. Thus, clarifying the determining factors of soil microbial community in the two types of monoculture plantations is rather important in evaluating microbial states and guiding plantation managements. Given the fact that vast variance of soil microbial structure in Rubber and Eucalypt plantations could not be explained by environmental variables in previous studies, it is imperative that we investigate the relative contributions of stochastic processes on soil microbial assembly.
In this study, we investigated soil bacterial and fungal community α-diversity, structure, species co-occurrence networks and assembly processes in the Rubber and Eucalypt plantations that have been established in tropical South China. We hypothesize that (1) deterministic processes indicative of environmental selection play a decisive role in soil microbial assembly in both the Rubber and Eucalypt plantations, with the selecting environmental variables differing between the two plantation types; (2) Not only diversity and structure, but also the species co-occurrence networks and keystone taxa of soil bacterial and fungal communities differ markedly between the Rubber and Eucalypt plantations. If Eucalypt plantations are more damaging to the soil environment (i.e., fertility) than Rubber plantations, then soil microbial community network modularity and community α-diversity should decrease to a greater degree in Eucalypt than in Rubber plantations.

2. Materials and Methods

2.1. Study Site and Field Sampling

The study site is located in the Zhanjiang City, Leizhou Peninsula, Guangdong Province, Southern China (114°25′ E, 23°75′ N). This region is characterized by a typical subtropical monsoon climate, with a mean annual temperature of 23 °C and mean annual precipitation of 1273 mm. The soil type is Latosol developed from basalt, and the climax vegetation is Evergreen Monsoon Forest. Unfortunately, a large part of the forest areas has been cleared for various land uses. Part of the areas was planted with Hevea brasiliensis (Rubber) and Eucalyptus urophylla (Eucalypt) trees arranged in 2 m × 2.5 m grid spacing. This study was conducted in two Rubber plantations (RP) with stand ages of 3 and 5 years (thereafter RP-3-year and RP-5-year) and two Eucalypt plantations (EP) with stand ages of 2 and 4 years (thereafter EP-2-year and EP-4-year) (Figure S1). The topographic features of the four plantation sites are similar, with an elevation ranging from 26 m to 33 m and a slope from 0°to 3°. The soil type of the selected four plantations is Latosol, and the mean annual temperature and mean annual precipitation of each plantation is similar with the Zhanjiang City. Litsea glutinosa, Clerodendrum cyrtophyllum Turcz, and Eupatorium odoratum L. are the dominate understory species in RP, and the understory of EP is dominated by Ephedra equisetina, Aporosa dioica, Lantana camara L., and Mimosa pudica Linn. The average tree height of RP-3-year and RP-5-year is 4.5 m and 7.8 m, and that of the EP-2-year and EP-4-year is 4.6 m and 9.5 m, respectively. EP-4-year has the largest average tree diameter (11 cm), followed by RP-5-year (9 cm), and both RP-3-year and EP-2-year have an average tree diameter of 5 cm. Three replicated stands were randomly selected in each plantation, with an area of 1 ha for each stand and no less than 50 m from the adjacent stands. In each stand, fifteen soil samples from three soil depths (i.e., 0–10, 10–30 and 30–50 cm, with five samples per depth; Figure S1) were collected using an auger (Φ 5 cm). The sampling sites were randomly distributed within each stand, avoiding tree roots. After sampling, soils were sieved through a 2 mm mesh to remove fine root, litter and stones, and samples from the same soil depth within each stand were combined and mixed. Thus, a total of 9 composite samples were obtained for each plantation with 3 replications for each soil depth (i.e., one for each stand). After collection, we immediately took these samples back to the laboratory and stored them in two parts. One part was stored at −20 °C for the microbial analyses, and the other part was stored under 4 °C for soil physicochemical analyses.

2.2. Soil Physicochemical Analyses

Soil water content was calculated as the mass loss after drying fresh soil to constant weight at 105 °C Soil pH was examined using a pH meter (UB-7 pH/ev Meter; Denver Instrument, Bohemia, NY, USA) with the soil/water (1:2.5, w/w) suspensions. Fresh soil was added to the H2SO4-K2Cr2O7 solution for digestion, and then the soil organic carbon (SOC) content was measured by titrating the remaining K2Cr2O7 with FeSO4·7H2O. Soil total nitrogen (N) content was determined using the semi-micro Kjeldahl method, total phosphorus (P) content was measured by the method of ammonium molybdate after digesting with H2SO4-H2O2-HF, and total potassium (K) content was examined via atomic absorption method. Soil available nitrogen (AN) content was measured using alkaline hydrolysis distillation method, and available phosphorus (AP) content was determined using the method of molybdate-blue colorimetry after extracting with NaHCO3. The available potassium (AK) content was measured on a flame atomic absorption spectrometer using the ammonium acetate extract. Soil exchangeable calcium (Ca), exchangeable magnesium (Mg), exchangeable Manganese (Mn), available copper (Cu), available Zinc (Zn), iron (Fe) content were estimated by the atomic absorption spectrophotometry method. The methods of inductor plasma chromatography and ion chromatography were used to detect soil boron (B) and chlorine (Cl) content, respectively.

2.3. Soil DNA Isolation, PCR Amplicons Sequencing and Data Processing

Soil DNA was extracted using the Power Soil® DNA Kit (MoBio, Carlsbad, CA, USA) with 0.3 g fresh soil according to the manufacturer’s instructions. After extraction, the quality of DNA was examined using 1% agarose gel electrophoresis. PCR reaction was performed on an ABI GeneAmp® 9700 (Applied Biosystems Inc., Foster City, CA, USA) with the TransStart Fastpfu DNA Polymerase (TransGen Biotech, Beijing, China). The barcoded primer pair set ITS7f and ITS4r primers [42] were used to amplify the internal transcribed spacer region 1 (ITS1) of the fungal Ribosomal RNA genes, and the barcoded primer set 515F and 806R [43] was used to amplify the V3-V4 hypervariable regions of bacterial 16S Ribosomal RNA genes. We did three PCR replicates for each sample, mixed the three replicated PCR products, and then purified the products with AxyPrepDNA Gel Extraction Kit (Axygen Biosciences, Union City, CA, USA). The purified PCR products were quantified using QuantiFluor™ -ST (Promega, USA) and mixed proportionally according to the sequencing quantity of each sample. The metagenomic library was constructed with the TruSeqTM DNA Sample Prep Kit (Illumina, San Diego, CA, USA) according to the manufacturer’s instructions before sequencing. Sequencing of the library was performed on the Illumina Miseq platform at Majorbio BioPharm Technology Co., Ltd. (Shanghai, China).
The quality of raw sequences was checked using the Quantitative Insights into Microbial Ecology (QIIME) pipeline (version 1.17). Briefly, the sequences with more than 200 bp without any ambiguous base calls and had an average quality score > 20 passed the quality check. After removing the repeated sequences, the unique high-quality sequences were clustered using the Usearch (version 7.0 http://drive5.com/uparse/) to obtain the operational taxonomic units (OTUs) based on 97% identity. The representative sequence for each OTU was selected with QIIME (http://qiime.org/scripts/split_libraries_fastq.html) and assigned taxonomic information using Mothur against the UNITE 7.1 (ITS, http://unite.ut.ee/index.php) database for fungi and the Ribosomal Database Project (RDP) classifier (http://rdp.cme.msu.edu/) for bacteria.

2.4. Stochastic and Deterministic Processes Determination

The relative importance of stochastic and deterministic processes that drive microbial assembly was quantified by examining the turnover in phylogenetic composition, as proposed by the analytic framework of Stegen et al. [1]. In our case, the phylogenetic composition turnover of bacterial and fungal communities among samples was calculated in each plantation. Briefly, the between community version of the β-mean-nearest taxon distance (βMNTD) was used to quantify the phylogenetic distance between each OTU within a certain community and its closest relative in another community [44]. Then, a randomization of the phylogenetic composition was performed by shuffling species names and abundances across the phylogeny tips 999 times. Meanwhile the βMNTD was recalculated 999 times to generate a null distribution of βMNTD values, which were compared to the observed value. The difference between the mean of the null distribution and the observed βMNTD was the β-nearest taxon index (βNTI), with a value >+2 or <−2 denoting significantly greater or less observed phylogenetic turnover than expected. We divided the number of pairwise comparisons with |βNTI| < 2 by the total number of all pairwise to get the fraction of stochastic processes. All the analyses were completed using R v.3.5.1 [45] with the package ‘picante’.

2.5. Microbial Network Analysis

Species co-occurrence networks were constructed separately for bacterial and fungal communities based on the OTU tables for each plantation. The construction of networks were carried out using the Molecular Ecological Network Analyses pipeline (http://ieg2.ou.edu//MENA/) with the following steps according to Zhou et al. [24] and Deng et al. [25]: (1) data standardization by square-root transformation of the OUT table, (2) data submission and pair-wise similarity calculation, for this a link between OTU (operational taxonomic unit, also node) pair was constructed if the correlation between their abundance was larger than the similarity threshold, (3) network structure randomization according to a random matrix theory (RMT)-based approach to get the adjacent matrix. The empirical and random network properties were obtained after conducting all the processes. Average degree indicates the degree of connectivity among OTUs in the network. Clustering coefficient evaluates the trend of connection between node neighbors. The geodesic distance represents the number of edges (shortest path length) between the connections of any two nodes. A group of highly interconnected nodes with few connections outside the group form a network module, and to which extent the nodes attain more links within their own modules than expected for random linkages was assessed by the property of modularity. Visualization of network structure was performed using Cytoscape v.3.6.0 according to the instruction (http://manual.cytoscape.org/en/stable/). The topological role of each node was determined based on its within-module connectivity (Zi) and among-module connectivity (Pi) [46]. According to the simplified criteria as described by Olesen et al. [47], the nodes in a network can be classified into four groups. Briefly, the nodes with Zi > 2.5, which are highly connected within modules, are module hubs. The nodes with Zi > 2.5 and Pi > 0.62, which are highly connected within the entire network, are network hubs. Nodes with Pi > 0.62 are connectors that are highly connected to modules, and the nodes with Zi < 2.5 and Pi < 0.62 are peripherals which always linked to the nodes within their own modules without outside links.

2.6. Statistical Analysis

All the statistical analyses were carried out using R v.3.5.1 with the package ‘vegan’. Differences of microbial α-diversity and soil properties along soil profile (0–50 cm) or among plantations were compared with one-way analysis of variance (ANOVA). Tukey’s HSD multiple comparisons were used if the ANOVA result was significant. Spearman correlation analyses was performed to examine the relationships between the abundance of specific microbial taxa and soil properties. Microbial structure patterns in the four plantations were visualized via non-metric multidimensional scaling (NMDS) ordination based on the taxonomic (Bray-Curtis) and phylogenetic (Unweighted Unifrac) dissimilarities. Differences in microbial structure were tested with the non-parametric multivariate analysis of variance (Adonis) and analysis of similarity (ANOSIM). Redundancy analysis (RDA) and canonical correspondence analysis (CCA) were used to explore the relationships between the variation of microbial structure and soil physiochemical variables, and the relationship significance was tested with the function ‘envfit’. Variance inflation factor (VIF) for each environmental variable was calculated before doing RDA and CCA to remove the variables with high collinearity.

3. Results

3.1. Soil Properties

Soil pH value and content of SOC, P, AN, AP, Ca, Cu and Zn were higher in RP than those in the EP while K and Cl content was lower in RP compared to EP (p < 0.05, Figure S2). Moreover, the K content increased while Mg and Cu content declined markedly from the 2-year-old EP to the 4-year-old EP (Figure S2). Soil pH increased significantly from 3-year-RP to 5-year-RP. Most of the soil properties showed a stronger variation along the soil depth (0–50 cm) in EP than in RP. For instance in the EP-2-year, soil pH value and content of K, Mg, Zn, Fe and Mn were significantly higher in the subsoil (30–50 cm) compared with those in topsoil (0–10 cm), whereas the SOC, N, AN and B content declined significantly with increasing in soil depth (Figure S2). Concluding, soils from RP were characterized by higher nutrient content compared with those from EP, whereas the variations of soil nutrient content along with plantation age and soil depth were larger in EP.

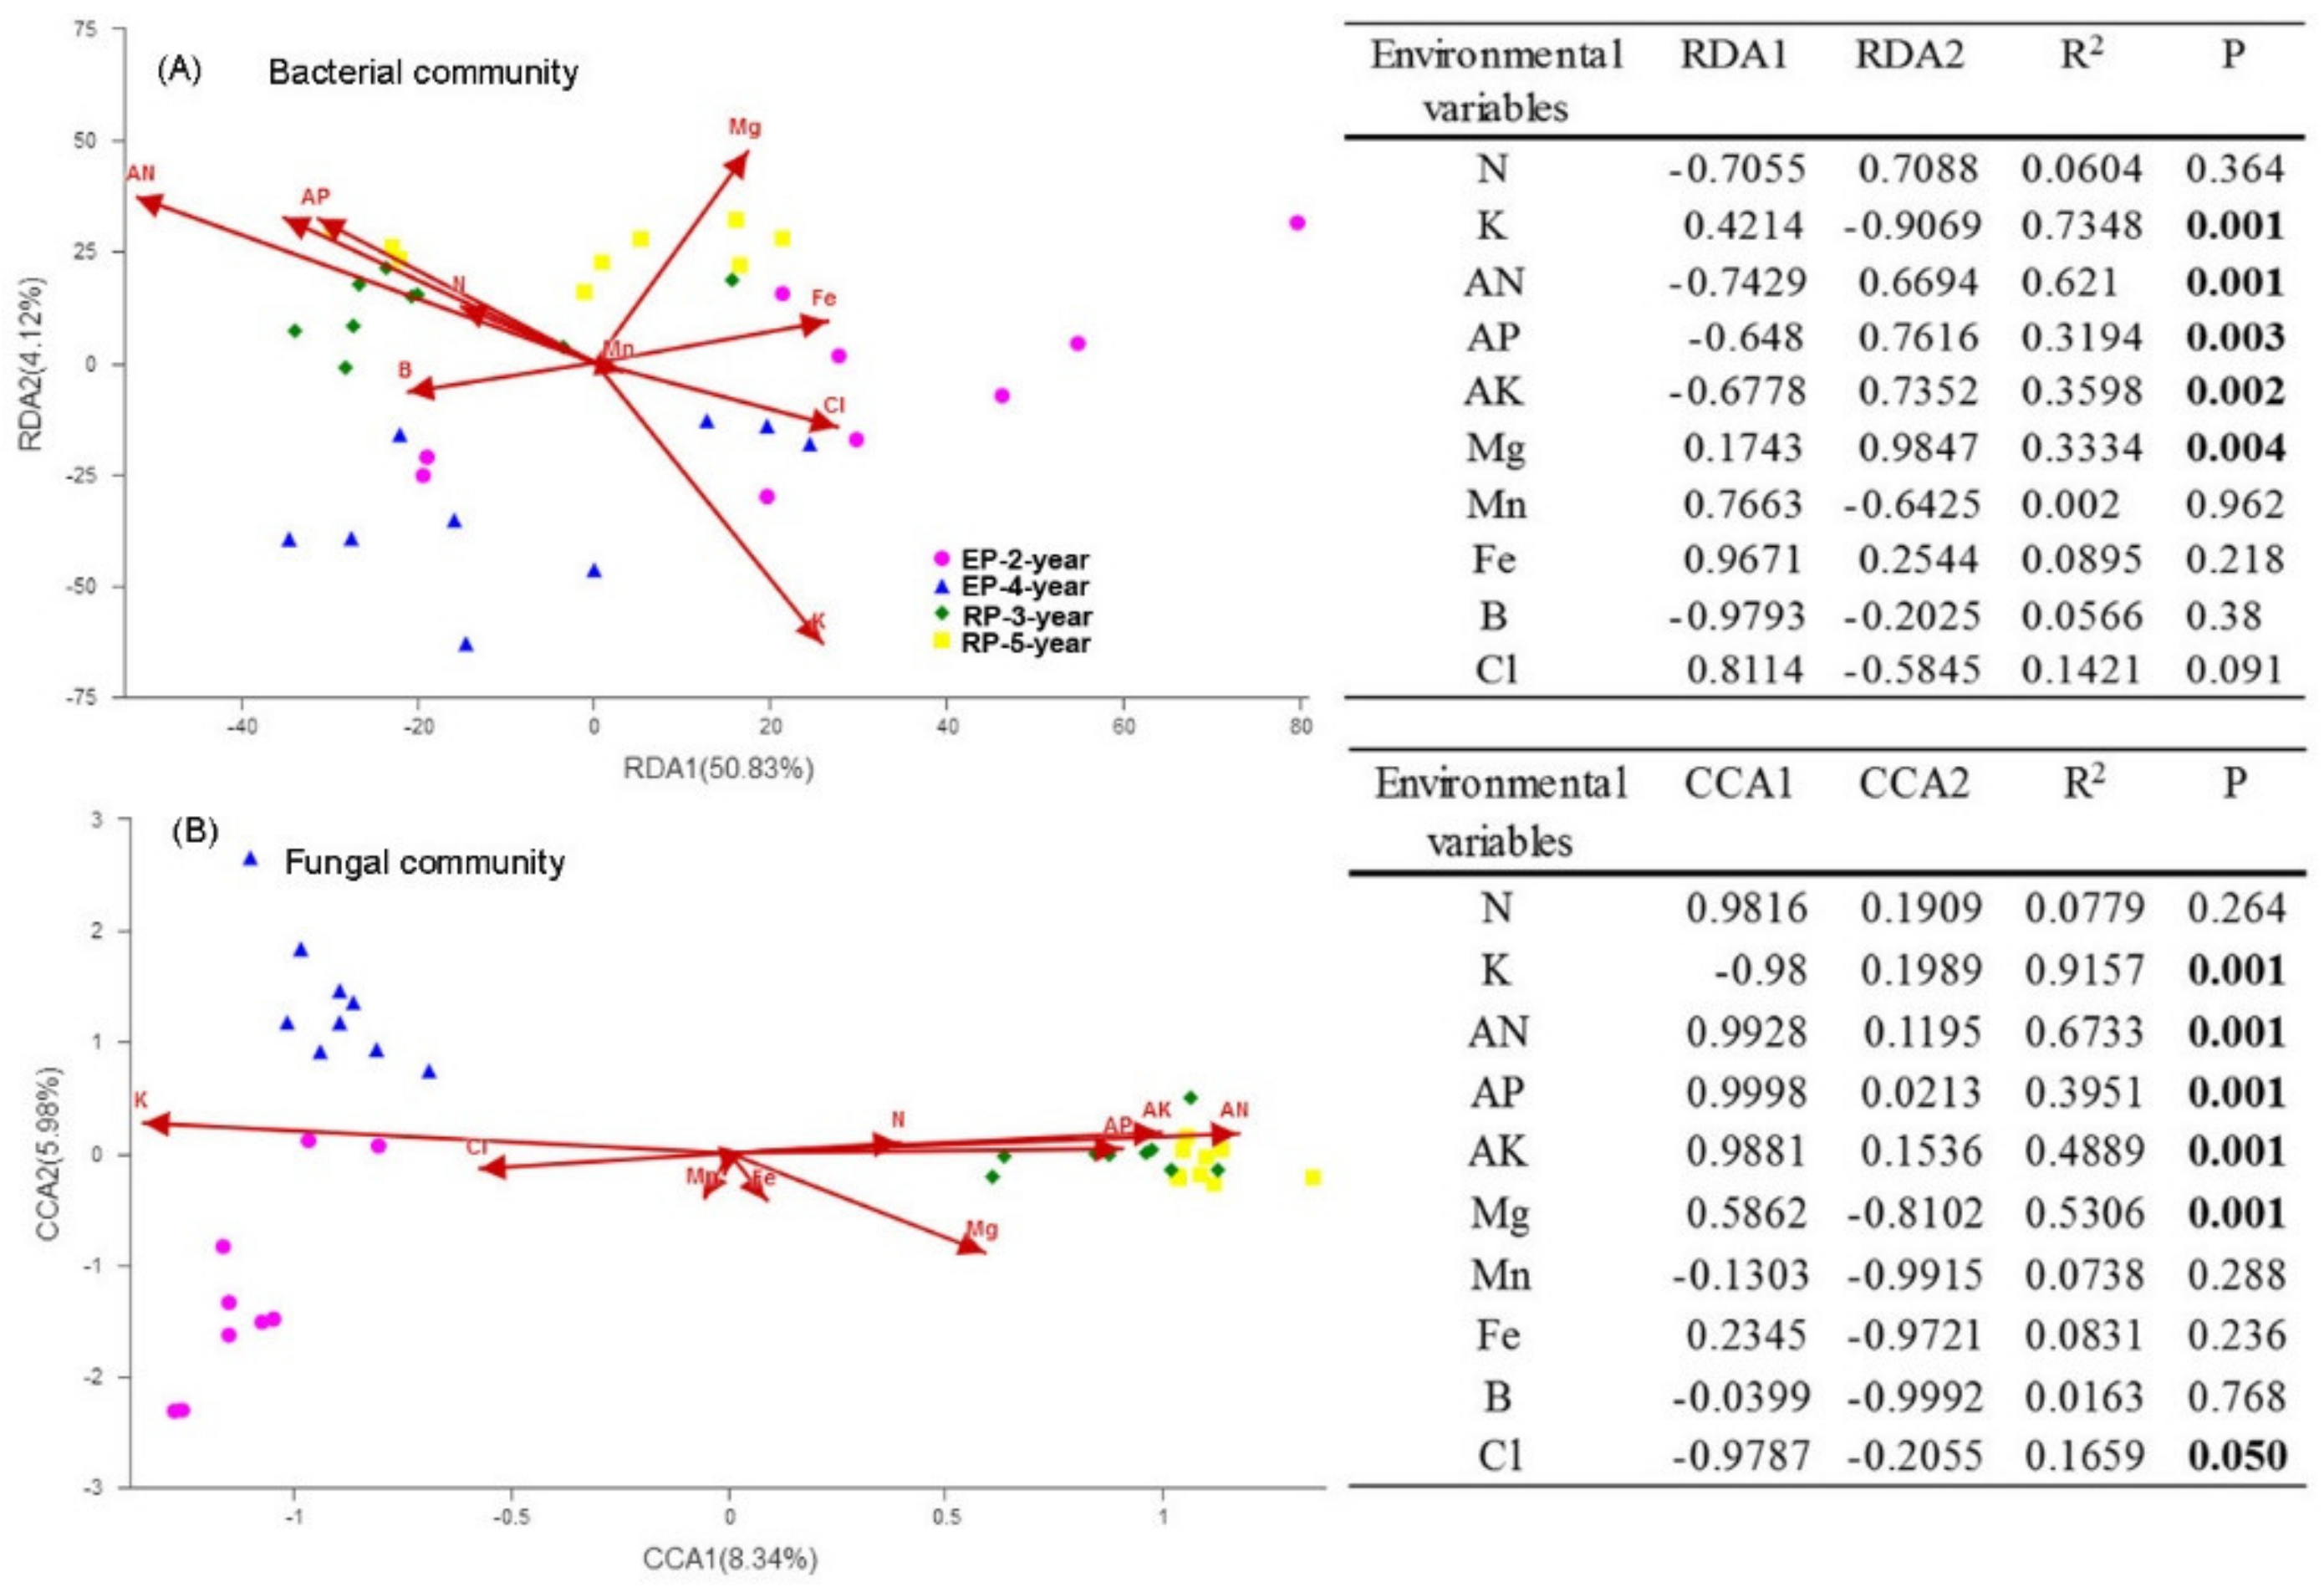
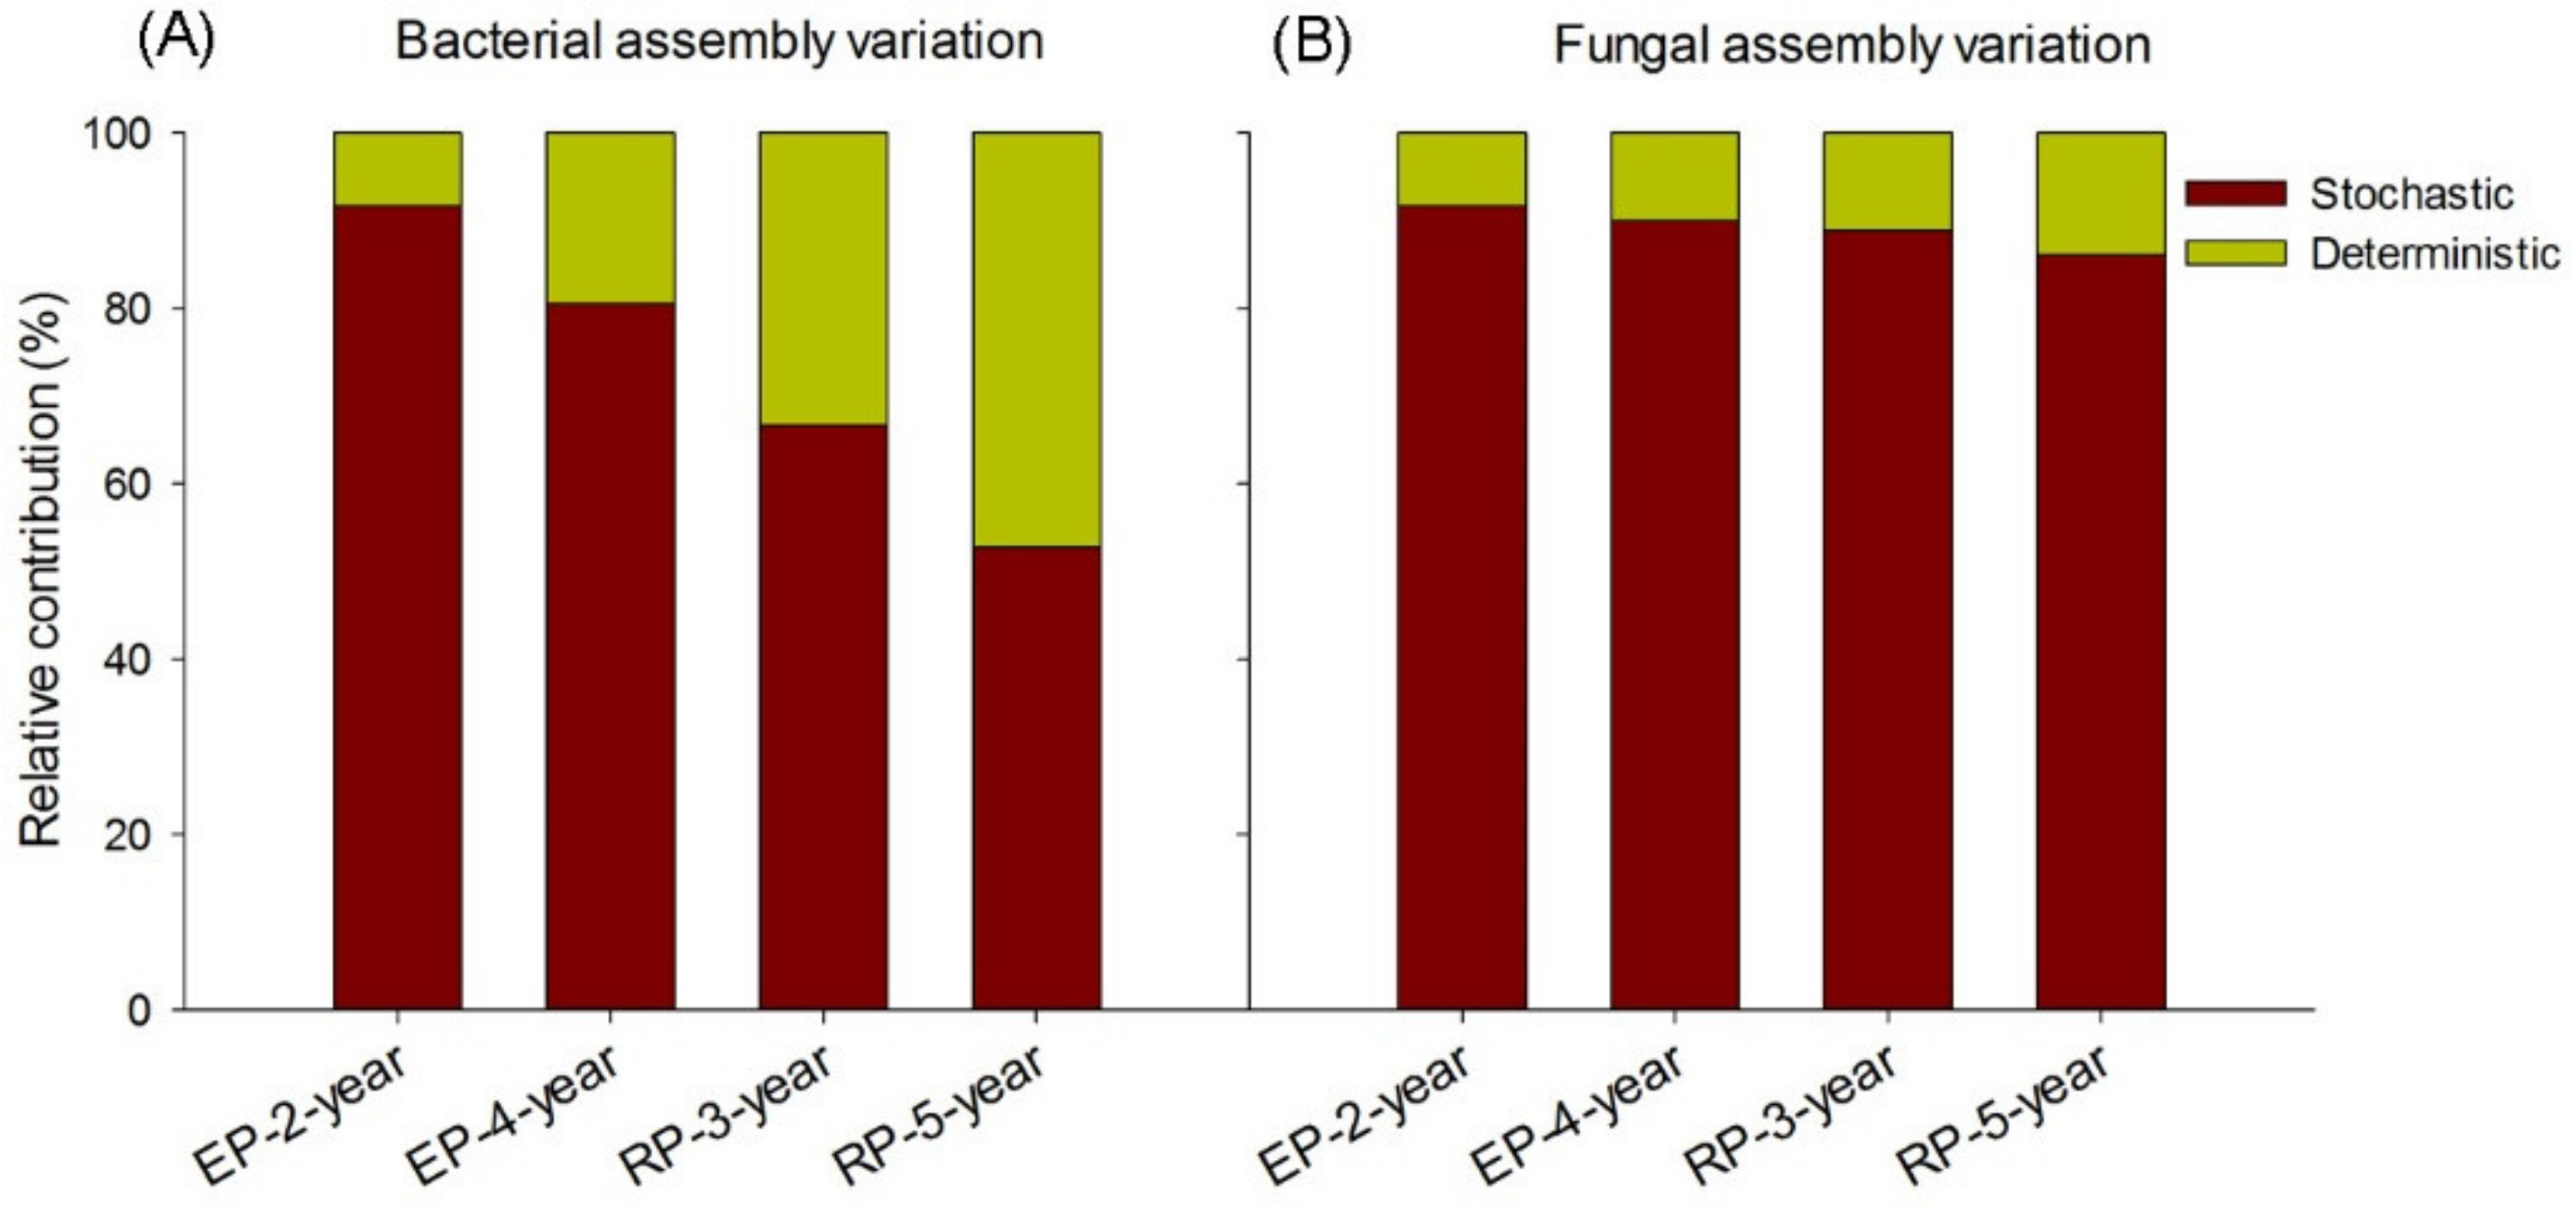
3.2. Microbial Community Diversity and Structure

A total of 2,055,300 and 2,444,146 high-quality bacterial and fungal sequences were obtained from 36 sequenced composite samples (9 per planation), respectively. The bacterial sequences were clustered into 3191 operational taxonomic units (OTUs) and fungal sequences were grouped into 3647 OTUs based on 97% sequence similarity.
The Chloroflexi, aerobic thermophilic bacteria, was the most abundant bacterial phylum, accounting for 36–51% of the total sequences from the four plantations, with the highest relative abundance present in EP-2-year. Proteobacteria, a major phylum of gram negative bacteria, was the second abundant bacterial phylum comprising 12–21% of the total sequences. Actinobacteria, a major phylum of gram positive bacteria, accounted for 12–20% of the total sequences, and Acidobacteria accounted for 11–16% of the total sequences (Figure 1A). Further, the relative abundance of Chloroflexi showed an increasing trend along the depth of soil profile (0–50 cm), whereas the Actinobacteria and Proteobacteria were more abundant in the topsoil (0–10 cm) than that in the subsoil (30–50 cm) (Figure 1A). The dominant fungal phylum in EP was Basidiomycota (48–54% of the total sequences), and that in the RP was Ascomycota (72–82% of the total sequences) (Figure 1B). Nevertheless, the relative abundance of Ascomycota decreased markedly along the soil depth (0–50 cm) in the EP-4-year and RP (Figure 1B). Balancing the general decline in Ascomycota, the relative abundance of Zygomycota and unclassified fungi increased with soil depth. Spearman correlation analyses revealed that the relative abundance of Chloroflexi and Basidiomycota was positively correlated with soil K and Cl content, while negatively related to soil SOC, N and P content. However, the abundance of RP-dominated fungal phyla (i.e., Ascomycota) was positively related to soil SOC, N and P content (Figures S4 and S5). Generally, the difference of soil fungal community composition between EP and RP was much greater than that of bacterial community composition at the phylum level, as indicated by a shift of dominant group from Basidiomycota in EP to Ascomycota in RP and an obviously higher relative abundance of Zygomycota in RP.
The Shannon and phylogenetic α-diversity of both bacterial and fungal communities differed distinctly among the four plantations (p < 0.001, Figure 2), but no significant differences were found with respect to soil depth (Figure 2). Both the α-diversity estimators for soil from RP were higher than those from EP. Comparisons of soil microbial communities’ structure among plantation types and soil layers were performed based on the Bray Curtis and Unweighted Unifrac dissimilarities of OTUs by using NMDS and PCoA, respectively (Figure 3 and Figure S6). The taxonomic and phylogenetic structure of bacterial and fungal communities differed substantially among the studied plantations, as indicated by the results of the significant tests via ADONIS and ANOSIM (Tables S1–S4). As a result, soil samples showed clear separation of community composition between RPs and EP (Figure 3 and Figure S6). The community compositional separation between RP and EP was greater for fungi than for bacterial (Figure 3).
We examined the influence of environmental variables on microbial community structure via constrain ordination analyses (CCA and RDA). In EP, both bacterial and fungal community structure was related to high soil K and Cl content, whereas in RP, the microbial community structure was positively related to AN, AP, AK and Mg content (see the insert tables in Figure 4). However, only 14.32% of the total variance in fungal structure and 54.95% of the total variance in bacterial structure could be explained by the first two constrained ordination axis (Figure 4A,B). We further calculated the relative contributions of stochastic and deterministic processes on bacterial and fungal assembly based on the taxonomic and phylogenetic metrics, which identified the most important ecological processes in shaping the soil microbial community assembly in the different plantations. In RP, deterministic processes played a considerable role in explaining bacterial community compositional assembly variation, and the explanatory power of deterministic processes increased from 33% in the 3-year-old plantation to 47% in the 5-year-old plantation (Figure 5A). In EP, however, deterministic processes contributed much less in explaining the variation in patterns of bacterial community assembly, ranging from 8% in the 2-year-old plantations to 19% in the 4-year-old plantations (Figure 5A). Regarding fungal community, only 8–14% of the variation in community assembly could be explained by the deterministic assembly processes, with a higher portion of community compositional variation being explained in the RP (11–14%) than that in the EP (8–10%) (Figure 5B). In general, although soil microbial structure showed significant associations with soil properties, the main influential factors of microbial community assembly are stochastic in both RP and EP.

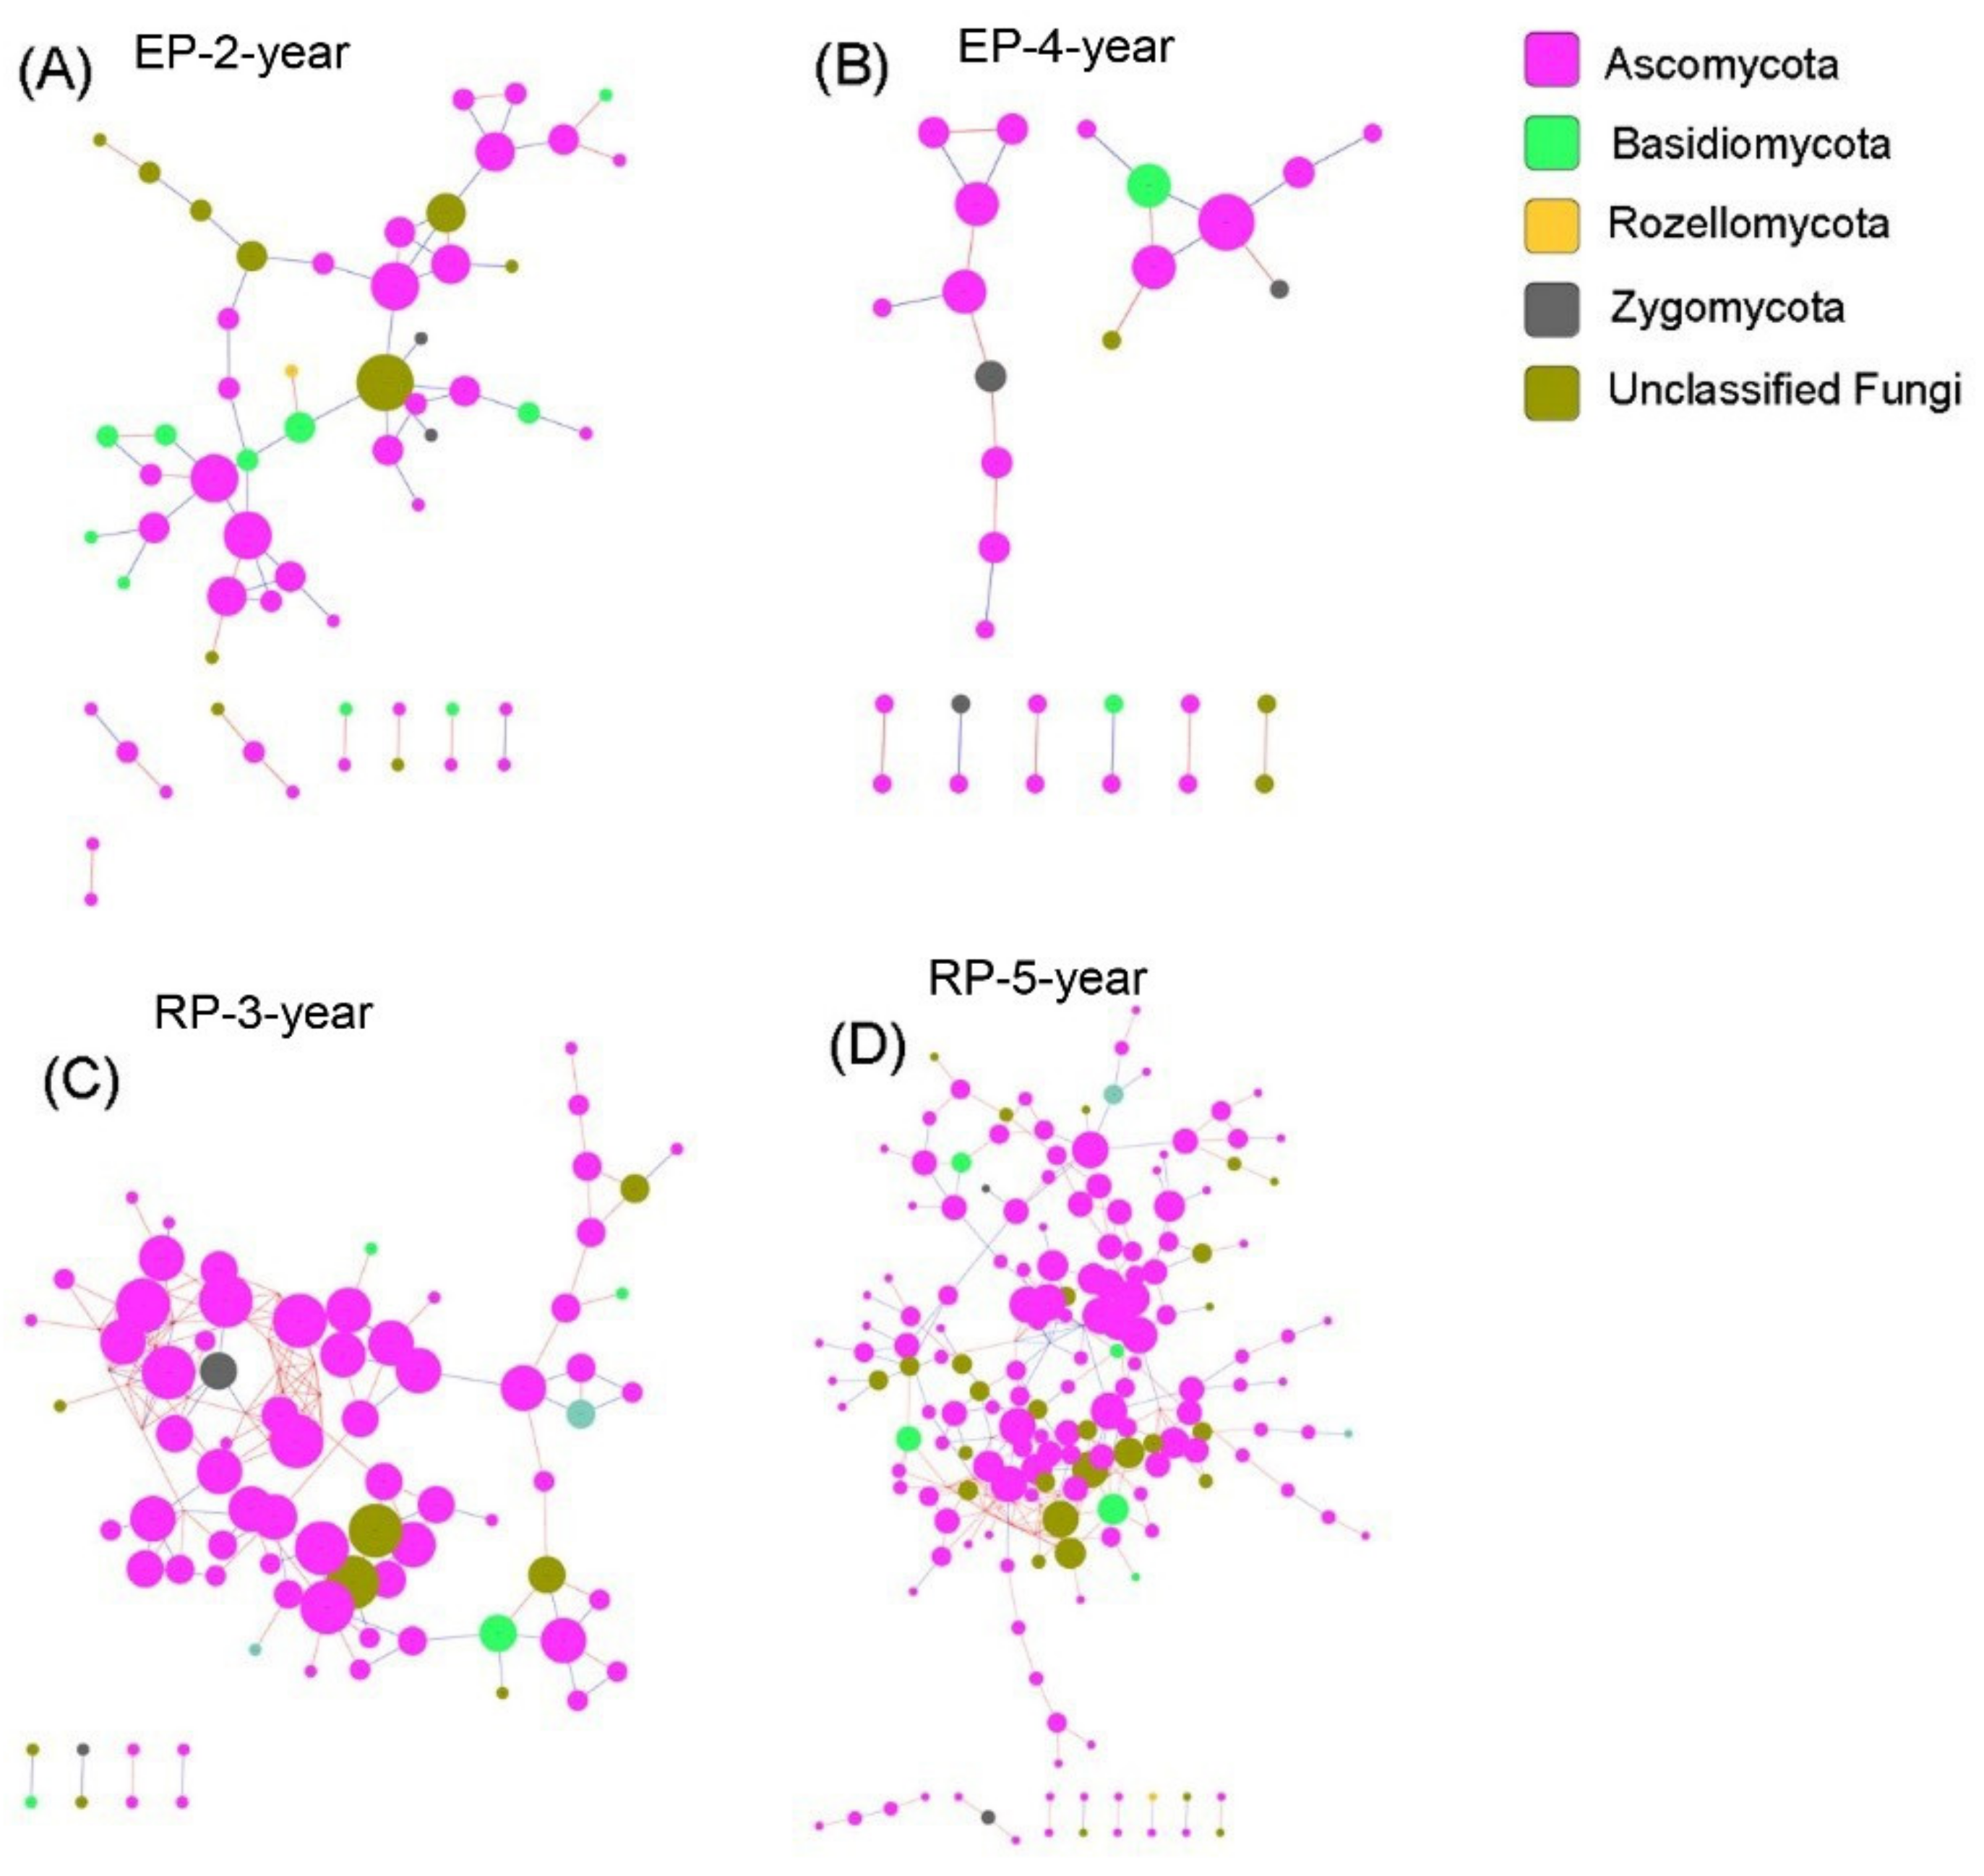
3.3. Microbial Community Networks

The bacterial networks in EP contained less nodes (OTUs in this study) but more links than those in the RP (Figure 6, Table S5). The average connectivity and clustering coefficient were higher in the bacterial networks from EP, whereas the average path distance, geodesic distance and modularity were greater in the bacterial networks from RP (Table S5). These results indicate that bacterial structure under Rubber trees is more modular, while the interspecies connection is more intense under Eucalypt trees. In contrast, the fungal nodes connected more intensively in RP, but structured more modularly in EP (Figure 7, Table S6). Overall, the network structure of both soil bacterial and fungal communities was dramatically different between EP and RP. The effects of plantation age on network structure was overwhelmed by the effects of plantation type, suggesting a sensitive response of microbial network to the dominant tree species in planted forests.
The topological roles of the nodes in networks were identified from the Zi-Pi plot. The majority of the nodes in both bacterial (~99% of the total nodes) and fungal (97–100% of the total nodes) networks were classified as peripheral, and they were highly connected within their own modules (Figure 8). A total of ten nodes from bacterial networks acted as module hubs and connectors, but the number of these nodes and their taxonomic affiliations differed among the four plantations. For example, in the EP-2-year, only one node belonging to Acidobacteria acted as module hub, and four nodes belonging to Acidobacteria, Actinobacteria, Planctomycetes and Proteobacteria were identified as connectors (Figure 8A). In the EP-4-year, two nodes affiliating to Actinobacteria were categorized into module hubs and two nodes belonging to Chloroflexi were identified as connectors (Figure 8A). In the RP-3-year, six nodes assigned to Proteobacteria, Actinobacteria and Firmicutes were grouped into module hubs and connectors (Figure 8B). Five and three nodes belonging to Chloroflexi, Proteobacteria and Actinobacteria were identified as module hubs and connectors in the RP-5-year (Figure 8B). Most of the identified module hubs and connectors for EP were positively correlated with soil K, Cl and Mn content, while negatively related to Mg, AK, AP, AN and N content (Figure 9A). The module hubs and connectors from RP, however, were generally supported by high Mg, AK, AP, AN and N content and low K and Cl content, except OTU956, OTU1326 and OTU493 (Figure 9A). Regarding fungal networks, only the network from RP-5-year had two nodes identified as module hubs and four connectors, which belonged to Ascomycota (Figure 8B). Moreover, the fungal network module hubs and connectors from RP-5-year were positively correlated with Mg, AK, AP, AN, and N content, while negatively related to Cl and K content (Figure 9). This was consistent with the constrained ordination results showing contrasting environmental associations with microbial community structure between EP and RP. In general, soil microbial networks in RP contained more keystone species than those in EP, which may lead to a more effective organization of species connections in networks from RP as regulated by more module hubs and connectors. The relationships of keystone species and soil properties were different between EP and RP, which to a certain extent indicated that the dominant factors shaping soil microbial networks were specific in EP and RP.

4. Discussion

4.1. Microbial α-Diversity and Structure and Relationships to Soil Properties in Rubber and Eucalypt Plantations

Clarifying soil microbial community attributes and assembly processes in monoculture plantations are critical in understanding the effects of forest-to-plantation conversions on soil microorganisms and their functional potentials. Here, we found that soil bacterial taxonomic α-diversity (Shannon Wiener index) in EP-2-year was significantly lower than in the other three plantations. A previous study showed no difference in soil bacterial Shannon diversity between Rubber and Eucalypts plantations either in dry season or in wet seasons [37], which was partly in disagreement with our results. Perhaps the difference in plantation age between the previous and this study contribute to this controversial result, since the diversity of soil microbial communities varied substantially with the succession of Eucalypts plantations [36]. The fungal Shannon diversity, however, was significantly lower in EP than in RP, regardless of plantation age. This suggested that the taxonomic α-diversity of soil bacterial community was more sensitive to dominant tree species than tree age in monoculture plantations. Regarding the phylogenetic α-diversity (Faith’s Phylogenetic index), both bacterial and fungal communities had a lower value in EP than in RP. In contrast to the Shannon diversity, phylogenetic α-diversity of fungal community was more responsive to plantation age than bacterial community, as indicated by a greater value in EP-4-year than in EP-2-year. The overall higher microbial α-diversity in RP might be associated with the greater soil nutrients content in RP than those in EP (Figure S2). Although declines in soil nutrients in monoculture plantations has been widely recognized, Eucalypt and Rubber trees generally exert different effects on the soil fertility and may provide distinct niches for soil microbes. The quality and quantity of litterfall from RP, especially in older plantations, is comparable to that of undisturbed natural forests [48,49]. A recent study further demonstrated that litter decomposition rates increase with RP age, potentially leading to an improvement of soil quality in older plantations [32]. In contrast, soil nutrients levels decline dramatically after the establishment of Eucalypt plantations, which has been proposed to be related to their poor-quality and highly recalcitrant litterfall [50,51]. In congruence with these previous results, we found greater soil C, N and P content in RP than in EP (Figure S2). Higher levels of soil nutrients and faster litter decomposition and turnover dynamics may provide a broader range of environmental niches, and hence support more diverse microbial communities.
Bacterial and fungal structure based on both taxonomic and phylogenetic matrices was strongly affected by the plantation type and age but not soil depth (Figure 3). The constrained ordination analyses showed that microbial structure was mainly affected by soil total K in EP while by soil available nutrients (i.e., AN, AP, and AK) in RP. The similar community structure along the 0–50 cm soil profile in RP possibly resulted from the similar available nutrient content along soil depth (Figure S2). Although in EP soil total K varied markedly with soil depth (0–50 cm), its variation is insufficient to cause microbial community shifts in comparison to the amount of variation of soil total K among the plantations (Figure S2). Moreover, the similar soil microbial community along 0–50 cm could be partly attributed to the homogeneity of the vertical soil environments caused by the root exudates, as the roots of the dominant trees can reach a depth of more than 50 cm. Although we tried to avoid the root areas during sample collection, some fine roots were still present in the samples. Thus, the effects of root systems could not be totally removed. Microbial community attributes in deeper soil environments need to be investigated to explore the vertical variation in RP and EP in future studies. The constrained ordination analyses illustrate how microbial community structure in RP varies in relation to soil available nutrients content, whereas the microbial community structural variation in EP is probably driven by soil nutrient limitations. Looking at the soil microbial community composition at phylum level, the EP had a higher relative abundance of Chloroflexi and Basidiomycota, and their relative abundance was negatively correlated with soil AN, AP and AK content. In contrast, the phyla that positively related to soil available nutrients and were more abundant in RP, including Actinobacteria, Gemmatimonadetes, Ascomycota and Zygomycota (Figure 1, Figures S4 and S5). It was surprising that soil pH had little effect on soil microbial structure despite a significant difference in soil pH among the four plantations. This result was inconsistent with recent studies demonstrating that pH played a decisive role in shaping soil microbial communities in both Rubber and Eucalypts plantations [34,35,52]. One reason for this might be that the soil pH value in this study was less likely to impose stress on soil microorganisms, as the average pH (5.0) in our study site is relatively higher than that in the recent studies (4.0–4.6). Interestingly, we found a significant positive correlation between microbial structure and soil total K content in EP. This has not been evidenced previously, even though K is required for many plants and microorganisms to maintain essential metabolisms, such as photosynthesis, ATP production, sugars translocation, starch production, nitrogen fixation and protein synthesis [53]. The effects of K deficiency on plants are mainly indirect and limit the plant use of other nutrients. For example, it has been proved that increased K allows for rapid assimilation of N and P in the plants [54]. Similarly, a continuous K supply in the degraded soils in EP may alleviate nutrient limitations by accelerating plant uptake of other available nutrients or by improving the efficiency of plant nutrients’ use. In this case, Eucalypt trees may shift soil microbial composition towards a community that has a high ability to mobilize soil K. For instance, Burkholderia spp., which is able to release K from K-bearing minerals by excreting organic acids [53], was found in a much higher relative abundance in the EP sites (0.71%) than in the RP sites (0.09%). Furthermore, we found a positive correlation between soil total K content and microbial structure in EP. Another explanation for the different fungal composition between RP and EP might be the distinct mycorrhizal status of their dominant tree species. It has been suggested that Eucalypt is mainly an ectomycorrhizal species [55,56,57]. Accordingly, the fungi belonging to Basidiomycota phylum, which can form mycorrhizal symbiosis with plants, dominated in EP (Figure 1B). The Rubber trees, however, largely form arbuscular mycorrhiza with fungi belonging to Zygomycota [58], resulting in a higher relative abundance of Zygomycota in RP than in EP (Figure 1B). However, together with poor litter quality, the slow rates of litter decomposition, the low availability of nutrients in EP, competition between soil microorganisms and plants for nutrients is very high, which potentially depletes soil nutrient pools over time. This may be one mechanism underling the observed severe soil degradation in established EP. For RP, however, greater soil nutrients availability can increase microbial nutrients assimilation and enlarge soil microbial nutrients pools, which can potentially serve as plant-available nutrients after being released from microbial cells [59].

4.2. Microbial Assembly Processes in Rubber and Eucalypt Plantations

In contrast to our hypothesis that the distinct soil microbial assembly patterns in EP and RP are primarily governed by environmental selections, a considerable portion (53–92%) of microbial assembly variation was attributed to stochastic processes. Lan et al. [34,37,38] recently found that 14–50% of the total variance of soil microbial composition in Rubber plantations in tropical China could be explained by environments, which was in agreement with our results. We further proposed that the undetermined processes, for instance, birth and death rate, dispersal limitation and drift played a stronger role in regulating soil microbial assembly than deterministic processes at the initial stage of conversions of forest to Rubber and Eucalypt plantations. This was in consistent with the findings from Goss-Souza et al. [10] showing a dominant role of stochastic processes (i.e., dispersal) in shaping soil microbial assembly along the chronosequence of forest-to-agriculture conversion. The increased environmental homogeneity due to the reduction in plant diversity and the intensive disturbance of forest-to-plantation conversions might result in an increased stochastic process frequency, and might therefore be important [60]. Since fungal communities have stronger correlations with plant composition than bacterial communities do [61,62], plant diversity losses presumably affect fungal communities more, leading to more unpredictability in their assembly patterns. The relative contribution of deterministic processes on microbial assembly variation was higher in RP than in EP, which was consistent with our results showing a stronger constraint of microbial structure by soil properties in RP than in EP (Figure 4A,B). Perhaps the fast rate of litter decomposition and relative increased availability of soil nutrients in RP acted as environmental filter that select microbial community. If so, then the coexisting bacterial taxa would be more closely related due to stronger environmental selection [63]. Thus, the bacterial community should be more phylogenetically conserved in the evolution over time in RP than in EP.

4.3. Linking Microbial Species Co-Occurrence Networks to Assembly Processes

To further clarify the species co-occurrence and interspecies interactions in response to different microbial community assembly processes, bacterial and fungal networks were analyzed in each plantation. Bacterial species interlinked more intensively in the nutrient-poor EP, reflecting stronger species interactions (either competition and/or collaboration) within the community (Figure 6). Instead, a more modular bacterial network presented in the RP, which increased the complexity of interspecific interactions within the whole community. In highly modular species networks, the community is stable with an ordered structure, and it is highly efficient at exchanging energy, material and information [19]. Moreover, the keystone taxa (module hubs and connectors), which played a decisive role in governing the whole network structure [25,64], were mostly positively correlated with soil available nutrients (i.e., AN, AP, AK) in RP, while only being associated with total K in EP. Compared with bacterial networks, the fungal networks’ structure was looser and the species interactions were weaker, with only five keystone taxa identified in the RP-5-year (Figure 7 and Figure 8, Table S6). Again, the substantial losses in plant diversity after forest-to-plantation conversions probably disrupt soil fungal community organization and species interconnections, resulting in a highly stochastic manner of community assembly. This explanation fits with the result showing a relatively high contribution of stochastic processes (86–92%) in shaping fungal community structure. The bacterial community was more sensitive to soil nutrients variations than the fungal community was in both EP and RP, and thus it may offer critical feedback regarding the on-going disturbances caused by these plantations. Overall, these findings indicate that besides diversity and structure, bacterial and fungal communities can regulate their co-occurrence networks and the keystone taxa partly in response to the environmental selection forces imposed by forest conversion to plantations. In congruence with our hypothesis, soil microbial community α-diversity and community network modularity decrease to a greater degree in Eucalypt than in Rubber plantations in response to the stronger damages to soil fertility caused by Eucalypt plantations.

5. Conclusions

We combined the microbial diversity, structure and species co-occurrence networks with community assembly processes to provide a comprehensive understanding of soil bacterial and fungal communities in Eucalypt and Rubber plantations of tropical China. Both bacterial and fungal communities are strongly affected by soil available nutrients (i.e., AN, AP and AK) in RP, thus they responded in a more predictable manner by forming better organized and more robust networks to adapt to changes in these nutrients. Microbial communities in EP were mainly influenced by soil total K. However, environmental selection imposed by the high total K content was overweighed by stochastic processes, especially for the fungal community assembly. Generally, the bacterial phyla of Chloroflexi, Planctomycetes, Proteobacteria and fungal phyla of Basidiomycota and Rozellomycota prefer the high soil total K environment in EP, and these taxa may in turn be capable of immobilizing K and resisting low nutrients availabilities. However, the bacterial phyla of Acidobacteria, Actinobacteria, Firmicutes, Gemmatimonadetes and fungal phyla of Ascomycota, Chytridiomycota, Glomeromycota and Zygomycota probably play a key role in soil C, N and P accumulation and transformations in RP. Our results suggest that Eucalypt and Rubber plantations form a specific soil microbial structure and network by regulating the relative role of multiple microbial community assembly processes.

Supplementary Materials

The following are available online at https://www.mdpi.com/1999-4907/10/11/978/s1, Tables S1–S4: Significance tests of the differences of soil bacterial and fungal structure between each two of the four plantations, Tables S5 and S6: Properties of soil bacterial and fungal species co-occurrence networks, Figure S1: The layout of the studied plantations and the soil sampling scheme, Figure S2: Soil properties at three soil depths (0–10 cm, 10–30 cm, 30–50 cm) in the four studied plantations, Figure S3: The rarefaction curves of microbial OTU numbers, Shannon index and Chao index in relation to the number of reads for each sample, Figures S4 and S5: Spearman correlations of the top bacterial fungal phyla abundance with environmental variables, Figure S6: Non-metric multidimensional scaling (NMDS) ordination and principal coordinates analysis (PCoA) showing the structural differences of bacterial and fungal communities along 0–50 cm soil profile in the four studied plantations.

Author Contributions

Conceptualization, J.C.; methodology, J.C.; investigation, W.Z., J.Y. and H.X.; data curation, H.M. and J.C.; writing—original draft preparation, H.M. and J.C.; writing—review and editing, Z.W., J.Y., J.A.H. and H.X.; funding acquisition, H.M.

Funding

This research was funded by the Forestry Science and Technology Innovation Project of Guangdong (2018KJCX010) and the Central Public-interest Scientific Institution Basal Research Fund, China (CAFYBB2019SZ003).

Acknowledgments

We thank Yuqi Jie and Fulin Jing from the Huoju Farmland in Guangdong Province for their help with soil sampling and data collection.

Conflicts of Interest

The authors declare no conflict of interest.

References

  1. Stegen, J.C.; Lin, X.; Fredrickson, J.K.; Chen, X.; Konopka, A. Quantifying community assembly processes and identifying features that impose them. ISME J. 2013, 7, 2069–2079. [Google Scholar] [CrossRef]
  2. Stegen, J.C.; Lin, X.J.; Fredrickson, J.K.; Konopka, A.E. Estimating and mapping ecological processes influencing microbial community assembly. Front. Microbiol. 2015, 6, 370. [Google Scholar] [CrossRef] [PubMed]
  3. Jiao, S.; Yang, Y.; Xu, Y.; Zhang, J.; Lu, Y. Balance between community assembly processes mediates species coexistence in agricultural soil microbiomes across eastern China. ISME J. 2019. [Google Scholar] [CrossRef] [PubMed]
  4. Vellend, M. Conceptual synthesis in community ecology. Q. Rev. Biol. 2010, 85, 183–206. [Google Scholar] [CrossRef] [PubMed]
  5. Hanson, C.A.; Fuhrman, J.A.; Horner-Devine, M.C.; Martiny, J.B.H. Beyond biogeographic patterns: Processes shaping the microbial landscape. Nat. Rev. Microbiol. 2012, 10, 497–506. [Google Scholar] [CrossRef] [PubMed]
  6. Nemergut, D.R.; Schmidt, S.K.; Fukami, T.; O’Neill, S.P.; Bilinski, T.M.; Stanish, L.F.; Knelman, J.E.; Darcy, J.L.; Lynch, R.C.; Wickey, P.; et al. Patterns and processes of microbial community assembly. Microbiol. Mol. Biol. Rev. 2013, 77, 342–356. [Google Scholar] [CrossRef] [PubMed]
  7. Dumbrell, A.J.; Nelson, M.; Helgason, T.; Dytham, C.; Fitter, A.H. Relative roles of niche and neutral processes in structuring a soil microbial community. ISME J. 2010, 4, 337–345. [Google Scholar] [CrossRef] [PubMed]
  8. Caruso, T.; Chan, Y.K.; Lacap, D.C.; Lau, M.C.Y.; Mckay, C.P.; Pointing, S.B. Stochastic and deterministic processes interact in the assembly of desert microbial communities on a global scale. ISME J. 2011, 5, 1406–1413. [Google Scholar] [CrossRef]
  9. Martiny, J.B.H.; Eisen, J.A.; Penn, K.; Allison, S.D.; Horner-Devine, M.C. Drivers of bacterial β-diversity depend on spatial scale. Proc. Natl. Acad. Sci. USA 2011, 108, 7850–7854. [Google Scholar] [CrossRef]
  10. Goss-Souza, D.; Mendes, L.W.; Rodrigues, J.L.M.; Tsai, S.M. Ecological Processes Shaping Bulk Soil and Rhizosphere Microbiome Assembly in a Long-Term Amazon Forest-to-Agriculture Conversion. Microb. Ecol. 2019. [Google Scholar] [CrossRef]
  11. Guo, X.; Feng, J.J.; Shi, Z.; Zhou, X.S.; Yuan, M.T.; Tao, X.Y.; Hale, L.; Yuan, T.; Wang, J.; Qin, Y.; et al. Climate warming leads to divergent succession of grassland microbial communities. Nat. Clim. Chang. 2018, 8, 813–818. [Google Scholar] [CrossRef] [Green Version]
  12. Shi, Y.; Dang, K.K.; Dong, Y.H.; Feng, M.M.; Wang, B.R.; Li, J.G.; Chu, H.Y. Soil fungal community assembly processes under long-term fertilization. Eur. J. Soil Sci. 2019. [Google Scholar] [CrossRef]
  13. Fuhrman, J.A. Microbial community structure and its functional implications. Nature 2009, 459, 193–199. [Google Scholar] [CrossRef] [PubMed]
  14. Banning, N.; Gleeson, D.; Grigg, A.H.; Grant, C.D.; Andersen, G.L.; Brodie, E.L.; Murphy, D.V. Soil microbial community successional patterns during forest ecosystem restoration. Appl. Environ. Microb. 2011, 77, 6158. [Google Scholar] [CrossRef] [PubMed]
  15. Gravel, D.; Bell, T.; Barbera, C.; Combe, M.; Pommier, T.; Mouquet, N. Phylogenetic constraints on ecosystem functioning. Nat. Commun. 2012, 3, 1117. [Google Scholar] [CrossRef] [PubMed] [Green Version]
  16. Yang, Y.F.; Gao, Y.; Wang, S.P.; Xu, D.P.; Yu, H.; Wu, L.W.; Lin, Q.Y.; Hu, Y.G.; Li, X.Z.; He, Z.L.; et al. The microbial gene diversity along an elevation gradient of the Tibetan grassland. ISME J. 2014, 8, 430–440. [Google Scholar] [CrossRef]
  17. Hallam, S.J.; McCutcheon, J.P. Microbes don’t play solitaire: How cooperation trumps isolation in the microbial world. Environ. Microbiol. Rep. 2015, 7, 26–28. [Google Scholar] [CrossRef]
  18. Shi, S.J.; Nuccio, E.E.; Shi, Z.J.; He, Z.L.; Zhou, J.Z.; Firestone, M.K. The interconnected rhizosphere: High network complexity dominates rhizosphere assemblages. Ecol. Lett. 2016, 19, 926–936. [Google Scholar] [CrossRef] [Green Version]
  19. Lu, L.; Yin, S.; Liu, X.; Zhang, W.; Gu, T.; Shen, Q.; Qiu, H. Fungal networks in yield-invigorating and -debilitating soils induced by prolonged potato monoculture. Soil Biol. Biochem. 2013, 65, 186–194. [Google Scholar] [CrossRef] [Green Version]
  20. Tian, J.; He, N.; Kong, W.; Deng, Y.; Feng, K.; Green, S.M.; Wang, X.B.; Zhou, J.Z.; Kuzyakov, Y.; Yu, G.R. Deforestation decreases spatial turnover and alters the network interactions in soil bacterial communities. Soil Biol. Biochem. 2018, 123, 80–86. [Google Scholar] [CrossRef] [Green Version]
  21. De Vries, F.T.; Griffiths, R.I.; Bailey, M.J.; Craig, H.; Girlanda, M.; Gweon, H.S.; Hallin, S.; Kaisermann, A.; Keith, A.M.; Lumini, E.; et al. Soil bacterial networks are less stable under drought than fungal networks. Nat. Commun. 2018, 9, 3033. [Google Scholar] [CrossRef] [PubMed]
  22. Song, H.; Singh, D.; Tomlinson, K.W.; Yang, X.; Ogwu, M.C.; Slik, J.W.F.; Adams, J.M. Tropical forest conversion to rubber plantation in southwest China results in lower fungal beta diversity and reduced network complexity. FEMS Microbiol. Ecol. 2019. [Google Scholar] [CrossRef] [PubMed]
  23. Singh, D.; Slik, J.W.F.; Jeon, Y.-S.; Tomlinson, K.W.; Yang, X.; Wang, J.; Kerfashi, D.; Porazinska, D.L.; Adams, J.M. Tropical forest conversion to rubber plantation affects soil micro-& mesofaunal community & diversity. Sci. Rep. 2019, 9, 5893. [Google Scholar] [PubMed]
  24. Zhou, J.Z.; Deng, Y.; Luo, F.; He, Z.L.; Yang, Y.F. Phylogenetic molecular ecological network of soil microbial communities in response to elevated CO2. MBio 2011, 2, e00122-11. [Google Scholar] [CrossRef] [PubMed]
  25. Deng, Y.; Jiang, Y.H.; Yang, Y.F.; He, Z.L.; Luo, F.; Zhou, J.Z. Molecular ecological network analyses. BMC Bioinform. 2012, 13, 113. [Google Scholar] [CrossRef]
  26. Vitali, F.; Mastromei, G.; Senatore, G.; Caroppo, C.; Casalone, E. Long lasting effects of the conversion from natural forest to poplar plantation on soil microbial communities. Microbiol. Res. 2016, 182, 89–98. [Google Scholar] [CrossRef]
  27. Lan, G.Y.; Li, Y.W.; Wu, Z.X.; Xie, G.S. Soil bacterial diversity impacted by conversion of secondary forest to rubber or eucalyptus plantations: A case study of hainan island, South China. Forest Sci. 2017, 63, 87–93. [Google Scholar] [CrossRef]
  28. Guillaume, T.; Holtkamp, A.M.; Damris, M.; Brümmer, B.; Kuzyakov, Y. Soil degradation in oil palm and rubber plantations under land resource scarcity. Agric. Ecosyst. Environ. 2016, 232, 110–118. [Google Scholar] [CrossRef]
  29. Wang, Y.; Zheng, J.; Boyd, S.E.; Xu, Z.; Zhou, Q. Effects of litter quality and quantity on chemical changes during eucalyptus litter decomposition in subtropical Australia. Plant Soil 2019, 442, 65–78. [Google Scholar] [CrossRef]
  30. Abraham, J.; Chudek, J.A. Studies on litter characterization using 13C NMR and assessment of microbial activity in natural forest and plantation crops’ (teak and rubber) soil ecosystems of Kerala, India. Plant Soil 2008, 303, 265–273. [Google Scholar] [CrossRef]
  31. Wu, J.P.; Liu, Z.F.; Sun, Y.X.; Zhou, L.X.; Lin, Y.B.; Fu, S.L. Introduced eucalyptus Urophylla plantations change the composition of the soil microbial community in subtropical china. Land Degrad. Dev. 2013, 24, 400–406. [Google Scholar] [CrossRef]
  32. N’Dri, J.K.; Guéi, A.M.; Edoukou, E.F.; Yéo, J.G.; N’Guessan, K.K.; Lagerlöf, J. Can litter production and litter decomposition improve soil properties in the rubber plantations of different ages in côte d’ ivoire? Nutr. Cycl. Agroecosyst. 2018, 111, 203–215. [Google Scholar] [CrossRef]
  33. König, S.; Worrich, A.; Centler, F.; Wick, L.Y.; Miltner, A.; Kästner, M.; Thullner, M.; Frank, K.; Banitz, T. Modelling functional resilience of microbial ecosystems: Analysis of governing processes. Environ. Model. Softw. 2017, 89, 31–39. [Google Scholar] [CrossRef]
  34. Lan, G.; Li, Y.; Wu, Z.; Xie, G. Impact of tropical forest conversion on soil bacterial diversity in tropical region of China. Eur. J. Soil Biol. 2017, 83, 91–97. [Google Scholar] [CrossRef]
  35. Li, J.; Lin, J.; Pei, C.; Lai, K.; Jeffries, T.C.; Tang, G. Variation of soil bacterial communities along a chronosequence of Eucalyptus plantation. Peer J. 2018, 6, e5648. [Google Scholar] [CrossRef]
  36. Zhu, L.; Wang, X.; Chen, F.; Li, C.; Wu, L. Effects of the successive planting of Eucalyptus urophylla on the soil bacterial and fungal community structure, diversity, microbial biomass, and enzyme activity. Land Degrad. Dev. 2019. [Google Scholar] [CrossRef]
  37. Lan, G.; Li, Y.; Lesueur, D.; Wu, Z.; Xie, G. Seasonal changes impact soil bacterial communities in a rubber plantation on Hainan Island, China. Sci. Total Environ. 2018, 626, 826–834. [Google Scholar] [CrossRef]
  38. Lan, G.; Wu, Z.; Li, Y.; Chen, B. The drivers of soil bacterial communities in rubber plantation at local and geographic scales. Arch. Agron. Soil Sci. 2019. [Google Scholar] [CrossRef]
  39. Guo, J.; Yang, Z.; Lin, C.; Liu, X.; Chen, G.; Yang, Y. Conversion of a natural evergreen broadleaved forest into coniferous plantations in a subtropical area: Effects on composition of soil microbial communities and soil respiration. Biol. Fert. Soils 2016, 52, 799–809. [Google Scholar] [CrossRef]
  40. He, R.; Yang, K.; Li, Z.; Schadler, M.; Yang, W.Q.; Wu, F.Z.; Tan, B.; Zhang, L.; Xu, Z.F. Effects of forest conversion on soil microbial communities depend on soil layer on the eastern Tibetan Plateau of china. PLoS ONE 2017, 12, e0186053. [Google Scholar] [CrossRef]
  41. Chen, K.; Zhang, K.; Wang, Y.; Wu, A.; Zheng, H. Impacts of converting natural secondary forests to exotic eucalyptus plantations on structure and function of soil microbial communities. Acta Ecol. Sin. 2018, 38, 8070–8079. [Google Scholar]
  42. Ihrmark, K.; Bodeker, I.T.M.; Cruz-Martinez, K.; Friberg, H.; Kubartova, A.; Schenck, J.; Strid, Y.; Stenlid, J.; Clemmensen, K.E.; Lindahl, B.D.; et al. New primers to amplify the fungal ITS2 region-evaluation by 454-sequencing of artificial and natural communities. FEMS Microbiol. Ecol. 2012, 82, 666–677. [Google Scholar] [CrossRef] [PubMed]
  43. Peiffer, J.A.; Spor, A.; Koren, O.; Jin, Z.; Tringe, S.G.; Dangl, J.L.; Buckler, E.; Ley, R. Diversity and heritability of the maize rhizosphere microbiome under field conditions. Proc. Natl. Acad. Sci. USA 2013, 110, 6548–6553. [Google Scholar] [CrossRef] [PubMed] [Green Version]
  44. Fine, P.V.A.; Kembel, S.W. Phylogenetic community structure and phylogenetic turnover across space and edaphic gradients in western Amazonian tree communities. Ecography 2011, 34, 552–565. [Google Scholar] [CrossRef]
  45. R Core Team. R: A Language and Environment for Statistical Computing; The R Foundation for Statistical Computing: Vienna, Austria, 2005; Available online: www.r-project.org.
  46. Roger, G.; Amaral, L.A.N. Functional cartography of complex metabolic networks. Nature 2005, 433, 895. [Google Scholar]
  47. Olesen, J.M.; Bascompte, J.; Dupont, Y.L.; Jordano, P. The modularity of pollination networks. Proc. Natl. Acad. Sci. USA 2007, 104, 19891–19896. [Google Scholar] [CrossRef] [Green Version]
  48. Martius, C.; HöFer, H.; Garcia, M.V.B.; RöMbke, J.; Hanagarth, W. Litter fall, litter stocks and decomposition rates in rainforest and agroforestry sites in central amazonia. Nutr. Cycl. Agroecosyst. 2004, 68, 137–154. [Google Scholar] [CrossRef]
  49. Kotowska, M.M.; Leuschner, C.; Triadiati, T.; Hertel, D. Conversion of tropical lowland forest reduces nutrient return through litterfall, and alters nutrient use efficiency and seasonality of net primary production. Oecologia 2016, 180, 601–618. [Google Scholar] [CrossRef]
  50. Cizungu, L.; Staelens, J.; Huygens, D.; Walangululu, J.; Muhindo, D.; Van Cleemput, O.; Boeckx, P. Litterfall and leaf litter decomposition in a central African tropical mountain forest and eucalyptus plantation. Forest Ecol. Manag. 2014, 326, 109–116. [Google Scholar] [CrossRef]
  51. Valadao, M.B.X.; Carneiro, K.M.S.; Inkotte, J.; Ribeiro, F.P.; Miguel, E.P.; Gatto, A. Litterfall, litter layer and leaf decomposition in Eucalyptus stands on Cerrado soils. Sci. For. 2019, 47, 256–264. [Google Scholar] [CrossRef]
  52. Jatoi, M.T.; Lan, G.; Wu, Z.; Sun, R.; Yang, C.; Tan, Z. Comparison of soil microbial composition and diversity between mixed and monoculture rubber plantations in Hainan province, China. Trop. Conserv. Sci. 2019, 12. [Google Scholar] [CrossRef]
  53. Zörb, C.; Senbayram, M.; Peiter, E. Potassium in agriculture–status and perspectives. J. Plant Physiol. 2014, 171, 656–669. [Google Scholar] [CrossRef] [PubMed]
  54. Clark, R.B. Physiology of cereals for mineral nutrient uptake, use, and efficiency. In Crops as Enhancers of Nutrient Use; Baligar, V.C., Duncan, R.R., Eds.; Academic Press: San Diego, CA, USA, 1990; pp. 131–209. [Google Scholar]
  55. Santolamazza-Carbone, S.; Durán-Otero, M.; Calviño-Cancela, M. Context dependency, co-introductions, novel mutualisms, and host shifts shaped the ectomycorrhizal fungal communities of the alien tree Eucalyptus globulus. Sci. Rep. 2019, 9. [Google Scholar] [CrossRef] [PubMed]
  56. Lu, X.; Malajczuk, N.; Brundrett, M. Fruiting of putative ectomycorrhizal fungi under blue gum (Eucalyptus globulus) plantations of different ages in Western Australia. Mycorrhiza 1999, 8, 255–261. [Google Scholar] [CrossRef]
  57. Ducousso, M.; Duponnois, R.; Thoen, D.; Prin, Y. Diversity of ectomycorrhizal fungi associated with Eucalyptus in Africa and Madagascar. Int. J. For. Res. 2012, 2012, 450715. [Google Scholar]
  58. Wang, Z.H. Advances in researches of arbuscular mycorrhizae in Hevea brasiliensis. For. Res. 2001, 14, 345–348. [Google Scholar]
  59. Miltner, A.; Bombach, P.; Schmidt-Brücken, B.; Matthias, K. SOM genesis: Microbial biomass as a significant source. Biogeochemistry 2012, 111, 41–55. [Google Scholar] [CrossRef]
  60. Liu, C.; Guénard, B.; Blanchard, B.; Peng, Y.Q.; Economo, E.P. Reorganization of taxonomic, functional, and phylogenetic ant biodiversity after conversion to rubber plantation. Ecol. Monogr. 2016, 86, 215–227. [Google Scholar] [CrossRef]
  61. Kageyama, S.A.; Posavatz, N.R.; Waterstripe, K.E.; Jones, S.J.; Bottomley, P.J.; Cromack, K.; Myrold, D.D. Fungal and bacterial communities across meadow-forest ecotones in the western Cascades of Oregon. Can. J. For. Res. 2008, 38, 1053–1060. [Google Scholar] [CrossRef]
  62. Nie, M.; Meng, H.; Li, K.; Wan, J.R.; Quan, Z.X.; Fang, C.M.; Chen, J.K.; Li, B. Comparison of bacterial and fungal communities between natural and planted pine forests in subtropical china. Curr. Microbiol. 2012, 64, 34–42. [Google Scholar] [CrossRef]
  63. Stegen, J.C.; Lin, X.; Konopka, A.E.; Fredrickson, J.K. Stochastic and deterministic assembly processes in subsurface microbial communities. ISME J. 2012, 6, 1653–1664. [Google Scholar] [CrossRef] [PubMed] [Green Version]
  64. Power, M.E.; Tilman, D.; Estes, J.A.; Menge, B.A.; Bond, W.J.; Mills, L.S.; Daily, G.; Castilla, J.C.; Lubchenco, J.; Paine, R.T. Challenges in the quest for keystones. BioScience 1996, 46, 609–620. [Google Scholar] [CrossRef]
Figure 1. Percent of microbial communities’ abundance on phylum level along three soil depth (0–10 cm, 10–30 cm, 30–50 cm) under 2-year-old and 4-year-old Eucalypt plantations (EP-2-year and EP-4-year) and 3-year-old and 5-year-old Rubber plantations (RP-3-year and RP-5-year). (A), percent of the top bacterial phyla abundance. (B), percent of the top fungal phyla abundance. The phyla with abundance less than 0.01 percent were defined as others.
Forests 10 00978 g001
Figure 2. The α-diversity of soil bacterial and fungal communities along three soil depth (0–10 cm, 10–30 cm, 30–50 cm) under 2-year-old and 4-year-old Eucalypt plantations (EP-2-year and EP-4-year) and 3-year-old and 5-year-old Rubber plantations (RP-3-year and RP-5-year). AB, the taxonomic diversity indicated by Shannon Wiener index. CD, the phylogenetic diversity indicated by Faith’s Phylogenetic α-Diversity index. Lowercase letters above the grouped bars indicate the differences among the four plantations. F-statistic and p values (df = 8) represent the overall difference of the four plantations based on one-way ANOVA analysis.
Forests 10 00978 g002
Figure 3. Non-metric multidimensional scaling (NMDS) ordination and principal coordinates analysis (PCoA) showing the structure differences of soil bacterial (AC) and fungal (BD) communities among the four Rubber and Eucalypt plantations (EP-2-year, EP-4-year, RP-3-year, RP-5-year). The NMDS analysis was performed based on Bray-Curtis dissimilarity matrix, and the PCoA was conducted with the Unweighted Unifrac dissimilarity matrix.
Forests 10 00978 g003
Figure 4. Constrained ordination analysis of microbial communities in 2-year-old and 4-year-old Eucalypt plantations (EP-2-year and EP-4-year) and 3-year-old and 5-year-old Rubber plantations (RP-3-year and RP-5-year). (A) Redundancy analysis (RDA) of bacterial community composition and environmental attributes. (B) Canonical correspondence analysis (CCA) of fungal community composition and environmental attributes. The relationships between soil variables and the two axes were indicated in the insert tables. Soil total nitrogen (N), total potassium (K), available nitrogen (AN), available phosphorus (AP), available potassium (AK), magnesium (Mg), manganese (Mn), iron (Fe), boron (B), and chlorine (Cl) were selected in the RDA and CCA model after excluding the variables with high variance inflation factor (>10).
Forests 10 00978 g004
Figure 5. The relative contributions of environmental selection and stochastic processes on soil microbial community assembly in 2-year-old and 4-year-old Eucalypt plantations (EP-2-year and EP-4-year) and 3-year-old and 5-year-old Rubber plantations (RP-3-year and RP-5-year). (A) The relative contributions of stochastic and deterministic processes on bacterial community assembly. (B) The relative contributions of stochastic and deterministic processes on fungal community assembly.
Forests 10 00978 g005
Figure 6. Soil bacterial species co-occurrence networks in the studied plantations. (A,B) Structure of the networks in 2-year-old and 4-year-old Eucalypt plantations (EP-2-year and EP-4-year). (C,D) Structure of the networks in 3-year-old and 5-year-old Rubber plantations (RP-3-year and RP-5-year). The taxonomic affiliation of each operational taxonomic unit (OTU) is specified to phylum, using node color, and the node size is proportional to its connectivity. The blue lines between each two-node structure indicate positive interactions, while blue ones indicate negative interactions.
Forests 10 00978 g006
Figure 7. Soil Fungal species co-occurrence networks in the studied plantations. (A,B) Structure of the networks in 2-year-old and 4-year-old Eucalypt plantations (EP-2-year and EP-4-year). (C,D) Structure of the networks of 3-year-old and 5-year-old Rubber plantations (RP-3-year and RP-5-year). The taxonomic affiliation of each OTU is specified to phylum, using node color, and the node size is proportional to its connectivity (i.e., degree). The red lines between each two-node structure indicate positive interactions, while blue ones indicate negative interactions.
Forests 10 00978 g007
Figure 8. Topological roles of OTUs in the bacterial and fungal co-occurrence networks as indicated by the Zi-Pi plot. (A,C) The Zi-Pi plot of soil bacterial and fungal networks in 2-year-old and 4-year-old Eucalypt plantations (EP-2-year and EP-4-year). (B,D) The Zi-Pi plot of soil bacterial and fungal networks in 3-year-old and 5-year-old Rubber plantations (RP-3-year and RP-5-year). Network module hubs and connectors represent keystone taxa and are labeled with their OTU numbers and taxonomic affiliations. The nodes with Zi > 2.5 are identified as module hubs, and those with Pi > 0.62 are connectors. The network hubs are determined by Zi > 2.5 and Pi > 0.62, and the peripherals are characterized by Zi < 2.5 and Pi < 0.62 [47].
Forests 10 00978 g008
Figure 9. Spearman correlation heatmaps showing the relationships between soil microbial network keystone taxa and soil physiochemical variables. (A) The relationships between soil bacterial network keystone taxa and soil physiochemical variables. (B) The relationships between soil fungal network keystone taxa and soil physiochemical variables. Asterix indicates significant correlations at the p < 0.05 level.
Forests 10 00978 g009

