Article

The Effect of Insect Defoliations and Seed Production on the Dynamics of Radial Growth Synchrony among Scots Pine Pinus sylvestris L. Provenances

by
Marcin Klisz
1,*,
Radosław Puchałka
2,*,
Sławomir Wilczyński
3,
Władysław Kantorowicz
1,
Tomasz Jabłoński
4 and
Jan Kowalczyk
1
1
Department of Silviculture and Genetics, Forest Research Institute, Braci Leśnej 3, Sękocin Stary, 05-090 Raszyn, Poland
2
Department of Ecology and Biogeography, Nicolaus Copernicus University in Toruń, Lwowska 1, 87-100 Toruń, Poland
3
Department of Forest Protection, Entomology and Forest Climatology, University of Agriculture in Kraków, 29 Listopada 46, 31-425 Kraków, Poland
4
Department of Forest Protection, Forest Research Institute, Braci Leśnej 3, Sękocin Stary, 05-090 Raszyn, Poland
*
Authors to whom correspondence should be addressed.
Forests 2019, 10(10), 934; https://doi.org/10.3390/f10100934
Submission received: 30 August 2019 / Revised: 15 October 2019 / Accepted: 19 October 2019 / Published: 22 October 2019
(This article belongs to the Section Forest Ecology and Management)

Abstract

:
The intraspecific variation of climate–growth relationships observed on provenance trials results from among–provenance differences in phenotypic plasticity. Temporal variation in radial growth synchrony among provenances may be modified by adverse climatic/biotic conditions such as drought or insect defoliation. However, these factors can potentially diminish provenance–specific growth reactions and, consequently, prevent the identification of provenances with the highest adaptive potential. Thus, understanding the influence of major biotic conditions on provenance–specific climate–growth relationships seems to be important to anticipate climate change. To determine provenance–specific growth patterns in relation to climate conditions (drought), seed production (reproductive effort), and insect defoliation in a common garden of Scots pine (Pinus sylvestris L.), we applied dendroecological techniques to time–series of tree–ring widths and basal area increments. The long–term records of seed production and insect outbreaks from the local Scots pine stands were used to explain the potential effect of biotic factors on the temporal dynamics of radial growth synchrony. During a period of favorable growth conditions, Scots pine provenances showed a decline in inter–provenance synchronicity in growth patterns, while during years affected by severe soil water deficit and insect defoliation, they manifested high uniformity in growth dynamics. The long–term trend in growth synchrony among P. sylvestris provenances depend on both abiotic and biotic environmental factors. This gains significance following an introduction of the appropriate selection of tree provenances for climate–smart forestry.

1. Introduction

In the face of climate change, understanding the phenotypic plasticity of forest trees in relation to biotic and abiotic factors driving adaptation processes may support climate–adapted forest management [1,2] The frequency and severity of disturbances will increase under climate change in forest ecosystems [3,4]. Provenance experiments originally established to assess inter–species variability in productivity and growth performance have recently gained importance as a valuable source of information for provenance–specific climate–adaptation potential [5,6]. Climate–dependent radial growth variation reflects the sensitivity of species and provenances to climate anomalies; however, marginal growth conditions may diminish differences among provenances in climate–growth responses and thereby hamper the detection of provenance–specific, climate–related adaptive responses [7]. The cumulative effect of adverse climatic conditions and biotic factors such as the above average seed production and insect outbreaks may have a negative effect on tree–ring width and consequently weaken climate–growth relationships [8,9,10].
The growth synchrony among spatially separated provenances observed in natural populations [11] is a relatively common phenomenon in common garden experiments (e.g., [7]). Undoubtedly, spatial synchrony, caused by regionally correlated climatic conditions, has implications for natural population dynamics [12]; however, little is known about how to interpret this phenomenon in provenance trial conditions. Another unexplained mechanism is the temporal variation in the among–population synchrony; here, one of the hypotheses explaining this phenomenon is the possible impact of climate change [13]. In our study, we focused on the phenomenon of temporal variation in the among–provenance growth synchrony.
Adverse climatic conditions, mainly related to severe soil water deficit, may modify growth patterns and thus enhance the level of synchronicity among trees and provenances [14,15]. However, even if among–provenance differences in drought reaction are noticeable, these relationships may be temporally unstable, suggesting the phenotypic instability of provenances and/or the modifying effect of non–climatic factors [16,17]. Temporal instability in climate–growth relationships has been mainly observed in natural populations of forest trees [18,19,20,21], indicating at least two causal factors—current and past climate instability–as well as age–related trends in radial growth dynamics [22,23,24]. In turn, studies on provenance–specific growth patterns under temporally–unstable climatic conditions revealed weak–or even a lack of—variation in radial growth synchrony among provenances [25].
The inter–annual variation of seed production seems to be species–specific, most likely as a result of evolutionary processes driving their reproductive strategies [26,27]. Among tree species, both the reproductive cycle and intervals between seeding years are highly diverse [28]. Above average seed production may result from several different ecological mechanisms; however, regardless of the reproductive strategy, different effects of resource allocations on secondary growth are to be expected [29]. In Norway, spruce large–seed crops were identified as causes of negative pointer years [30] which can be related to the “resource switching” mechanism responsible for a negative correlation between tree–ring growth and seed production [31]. In contrast, Hacket–Pain et al. [32] revealed a limited relationship between Norway spruce seed production and the among–population growth synchrony, most likely resulting from within–population variation in cone production. However, there is no evidence of a similar pattern in Scots pine populations, and it is very likely that, also in this species, between–individual variations in seed production exist.
The defoliation caused by insect outbreaks has reduced the carbon sequestration in cell walls [33], specific leaf area, and water–use efficiency in trees [34], but has also indirectly affected the physiology of trees by disturbing the nitrogen cycling as well as microbial populations in the forest soil [35,36]. Under water shortage, an increasing vulnerability of trees to insect outbreaks has been observed [37,38,39,40]. The additive effects of multiple stressors, drought, and insect defoliation may have complementary effects on radial growth [34]; however, this relationship is nonlinear, as partial defoliation does not limit the impact of water stress through reduced transpiration [41]. Moreover, there is evidence of inter–species variability in defoliation sensitivity; that is, conifers allocate more nutrients to foliage than deciduous trees, and therefore their abilities to compensate for insect defoliation are lower [42]. For mountain birch, evidence exists regarding the impact of defoliation on reproductive organs (mass of female catkins and seed viability) [43]. Consequently, exploring the provenance–specific variation in climate–growth relationships and among–provenance growth synchronicity requires the consideration of the role of climatic factors, but also other biotic factors such as seed production and defoliation.
Recent studies indicate that provenances differing in terms of the climate of their origin manifest different growth reactions for both optimal and adverse climatic conditions [7,17]. However, the effect of biotic factors on climate–growth relationships, namely the reproductive effort and defoliation caused by insect outbreaks, usually affects all populations of a given species within the same region. We hypothesized that (a) climate transfer affects provenance–specific growth sensitivity to soil water deficit, (b) growth resilience after severe insect defoliation differs among provenances, and that (c) both insect defoliation and large seed production modulate long–term trends in growth synchronicity among Scots pine provenances.

2. Material and Methods

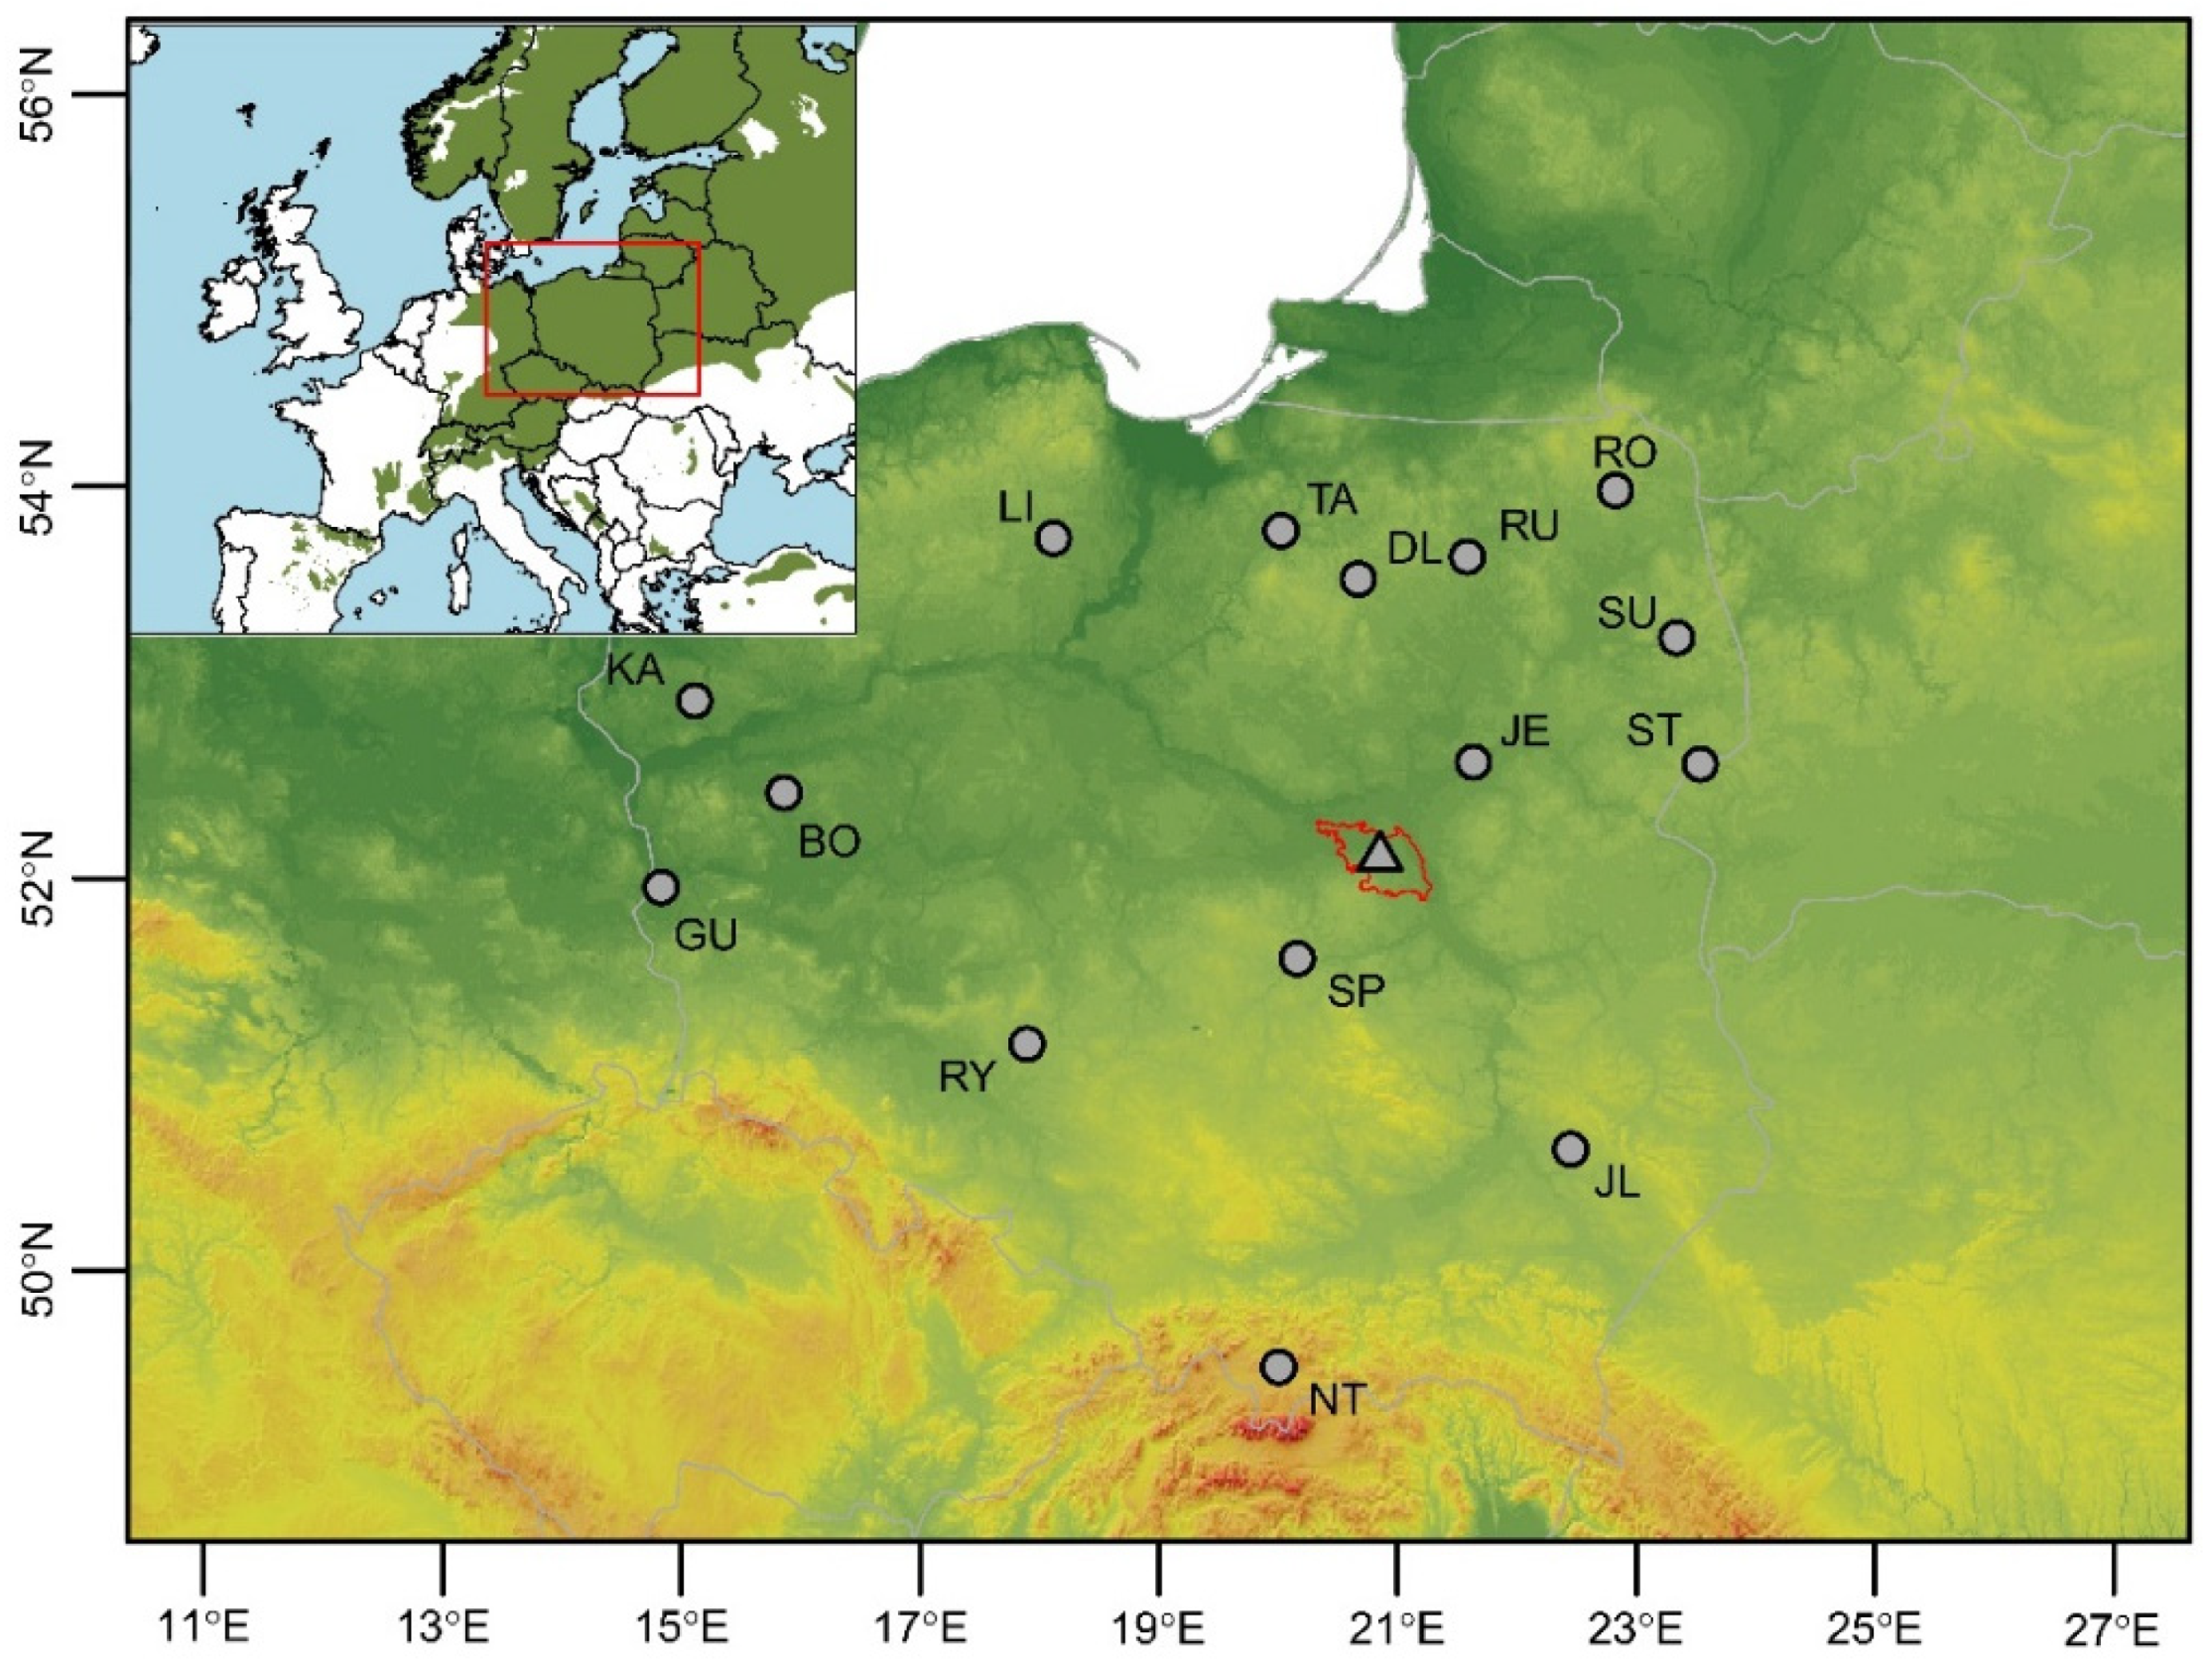
2.1. Study Sites and Sample Collection

The study material is a part of the five Polish Scots pine provenance trials established in 1967 [44]. The provenance trials were designed following a scheme of a random block design with five replicates, with 1–year–old seedlings at a 1.0 × 1.0 m spacing. For our study, we considered 15 Scots pine provenances altogether, representing the highest possible climatic variation among Polish provenances (ΔPrec > 400 mm, ΔTmin = 4.9 °C, ΔTmax > 2.9 °C; Table 1) that were planted in Sękocin, central Poland (SE; lat: 52.107103, lon: 20.85411; Table 1). These provenances represent the complete range of Scots pine in Poland; however, with an emphasis on north–eastern and western Poland (Figure 1). The selection of the SE trial was based on the average climatic conditions representative for all provenance trials [45]. Climatic descriptions of the SE trial were based on climate data from the National Oceanic and Atmospheric Administration (NOAA) agency (climate station in Okęcie, reference period 1973–2017; NOAA/NCEI/CWC http://www.noaa.gov/; see also Figure S1). From these climate data, the total sum of monthly precipitation (P) as well as the mean monthly temperature (T) were obtained to represent conditions in SE. To detect periods with water deficit, the standardized precipitation evapotranspiration indices integrated over three (SPEI3) and six months (SPEI6) were computed. SPEI was defined as the standardized difference between monthly precipitation and potential evapotranspiration [46] (Figure 2A). The limited availability of meteorological data motivated the use of the Hargreaves equation to estimate the potential evapotranspiration (PET), which is an alternative for the Food and Agriculture Organization of the United Nations 56 Penman–Monteith method [47,48]:
P E T = 0.408 × 0.0023 ( T m e a n + 17.8 ) ( T m a x T m a x ) 0.5 R a
where PET is the potential evapotranspiration, Tmean is the mean of Tmax and Tmin, Ra is extraterrestrial radiation, and 0.408 is a factor to convert units of MJ m−2 day−1 into mm day−1. The soil at the site of the trial can be described as rusty soil which has developed on sandy dunes (IUSS Working Group WRB, [49]). For each of the 15 provenances, 15 trees were sampled at breast height (1.3 m) for two increment cores in 2015, resulting in a total of 450 samples from 225 trees.

2.2. Seed Production

To quantify the seed production, we used data obtained from the long–term seed crop monitoring carried out by the State Forest National Holding in Poland (SF, [50]). In the analysis of growth–reproduction relationships, the number of cones produced per stand in the Chojnów Forest District (same region as the tree ring samples) was used as derived from the SF reports (Figure 1). The seed crop data used for analyses do not directly refer to seed production during the provenance trial, although annual reports from the Chojnów Forest District suggest a convergence between seed crop monitoring data (SF, [50]) and the quantity of cones annually observed in the Scots pine provenance trial. Since the period before 1988 corresponds with the first 20 years of juvenile tree growth—i.e., before trees reach full reproductive activity—data regarding seed crops in Chojnów Forest District have been limited to the period of 1988–2015. These data suggest an intensive seed production over the period 1988 to 2006, followed by a decline in seed production, which increased after 2012.

2.3. Insect Outbreaks

To analyze the effects of insect defoliation on growth patterns and/or seedings, we considered records of the four most important needle herbivores of Scots pine from Lepidoptera and Hymenoptera orders: Diprionidae spec., Lymantria monacha L., Bupalus piniarius L. and Panolis flammea Schiff. et Den [51,52,53,54,55,56,57]. The Scots pine needle herbivores considered in our study are characterized by high population dynamics during mass outbreak and thus pose a major threat to mid–European lowland coniferous forests. The time–series of needle herbivores were extracted from the SF database for the period 1970–2015, representing the area of stands which are affected by insect herbivores in the Chojnów Forest District where the SE trial is located. These data suggested major outbreaks of Diprionidae in 1992–1995 and 2004–2005, and L. monacha in 2004–2005 (Figure 2C, Table S1). To determine the resilience and recovery of provenances after a major L. monacha outbreak in 2004, we calculated a relative resilience index expressed in the relative growth deviation (RGD) [58]:
R G D = ( B A I p o s t B A I 3 y r ) ÷ ( B A I e v e n t B A I 3 y r )
where BAIpost is the basal area increment (BAI) value in a post–event year (after an outbreak), BAI3−yr is the BAI average for three years previous to the considered event, and BAIevent is the BAI value in the event year. To test differences between provenances in recovery after the 2004 outbreak, for each pairwise combination, we used the Wilcoxon rank–sum test [59].

2.4. Sample Preparation

The samples were prepared, measured and analyzed in accordance with standard dendroecological protocol [60]. The cores were dried and sanded with abrasive paper (with a grain size up to 1000). Then, the radial cross section of each core was scanned (Epson Expression XL12000, Epson America, Inc., Long Beach, USA) at 1200 dpi resolution. Annual ring–widths were measured and cross–dated using “CooRecorder” and “CDendro” software (version 9.0, Cybis Elektronik & Data AB, Saltsjöbaden, Sweden) at a resolution of 0.01 mm. To create the tree–ring series, two series per tree were averaged to create a total of 225 individual ring–width series. Each tree–ring series was detrended using a cubic–smoothing spline with a 50% frequency cut–off at 30 years [61,62]. To remove the remaining temporal autocorrelation and to emphasize the high–frequency signal (year–to–year variability) of the tree–ring series, the first–order autoregressive model (also known as “prewhitening”) was applied to each series [63], finally resulting in an indexed ring–width series (RWI). Fifteen provenance–specific chronologies for the period 1970–2014 were created on the basis of RWI using a biweight robust mean. We calculated the basal area increment (BAI) for each tree assuming a circular shape of the stems:
B A I = π ( r t 2 r t 1 2 )
where rt is the cumulative radius of the growth year and rt−1 is the radius of the previous year. The datasets generated during and the current study are available from the corresponding author on reasonable request.

2.5. Dendrochronological Statistics

The gleichläufigkeit (glk, also known as the coefficient of coherence, [64,65]), mean sensitivity (MS, indicator of general climate sensitivity of growth), and 10–year moving window mean inter–series correlation (mean rbar, an indicator of the strength of the common signal in growth series from individual trees within a stand) were calculated to characterize and qualify provenance chronologies [63,66,67]. Additionally, to test the quality of the provenance chronologies, the expressed population signals (EPSs; a measure of quality of common growth signal within a population) [66]) were calculated from detrended tree–ring series, whereas the MS and first–order autocorrelation (AR1; an indicator of the effects of previous–year conditions upon current year’s growth) were calculated from the index series (RWI; the raw ring widths of each tree divided by the average ring width of the tree). These measures were calculated for the robust common overlap period from 1970–2014 and used to assess the quality and characteristics of the chronologies.

2.6. Clustering and PCGA

The similarity of the RWI provenance chronologies was determined by hierarchical clustering using the Euclidean distance (root sum–of–squares of differences) as a similarity measure and Ward’s clustering method with the criterion proposed in [68]. To verify the clustering structure of the dataset, different clustering methods—i.e., single and complete linkage, the unweighted pair group method with arithmetic mean (UPGMA) [69], and Ward’s method—were tested for their clustering structure using the agglomerative coefficient [70]. Since it expressed the highest agglomerative coefficient, we finally selected Ward’s method. The provenance–specific individualistic growth reaction of trees was investigated using a refined version of the so–called principal component gradient analysis (PCGA) [71]; that is, we sub–selected the individual series of indexed tree–ring data for each of the two provenances and performed a PCGA to explore for possible provenance–specific growth patterns. Since this was done for each possible pairwise combination of provenances, we term this analysis pairwise PCGA. For each pairwise combination, the Wilcoxon rank–sum test [59] was used to test whether the polar coordinates of RWI loadings expressed a provenance–specific location shift, which would indicate that the considered provenances express provenance–specific growth patterns in comparison to each other. To control the familywise error rate which may occur in the multiple comparison approach, a Bonferroni correction was applied [72]. To test the potential influence of the above average seed production on the among–provenance growth synchronicity, PCGA pairwise analysis was performed for three consecutive sub–periods (1970–1987, 1988–2006 and 2007–2014, respectively). Due to the lack of available seed crop data for the provenance trial, sub–periods were defined in relation to the periods of weak and high seed production reported by SF seed crop monitoring. Only the last two years of the analyzed period (2013–2014) according to SF seed crop monitoring which were characterized by an increase in seed production, due to the minimum PCGA analysis requirements for the analyzed period, were included in the sub–period of weak seed production (2007–2014).

2.7. Pointer Years, Moving Inter–Series Correlation and Climate Sensitivity

To investigate the among–provenance growth synchrony, we used common pointer years (CPY), moving–window inter–chronology correlation, and interval trends (IT) [73]. Based on single–tree RWI, a pointer–year analysis was carried out, exploring provenance–specific growth reactions to extreme events [74]. The Neuwirth method, a window size of 5 years, and a series threshold of 65% were used as criteria for weak, strong, and extreme events, where the intensity classes refers to absolute Cropper values of >1, >1.28, and >1.645, respectively [75,76]. Years in which at least eight out of 15 provenances indicated a pointer year were defined as common pointer years. The degree of homogeneity of growth reactions in individual years was determined using a moving–window inter–chronology correlation (RB; i.e.,the rbar of provenance chronologies) with a window size of 10 years, a window overlap of 9 years, and the so–called interval trend [74].
I T = 100 × m n [ % ]
where m is the number of trees that show a relative growth increase in a given year compared to the previous year and n refers to the number of trees considered.
For climate sensitivity analyses, the mean monthly temperature, precipitation, SPEI3, and SPEI6 for the period 1970 to 2014 were used to calculate Spearman’s rank correlation coefficients of indexed provenance chronologies with climatic variables from March in the previous year through to October in the current year. To test the temporal variation in climate sensitivity, a 20–year moving correlation window was calculated for the period 1970–2014.

2.8. Bioclimatic Analyses

In order to determine the bioclimatic distance between provenance origins and the trial site, a principal component analysis (PCA) of 19 bioclimatic parameters was performed. For this purpose, climate data for the trial site as well as for the locations representing the 15 different Scots pine origins were extracted from BIOCLIM 1.4 at a spatial resolution of 2.5 arcmin taken from the WorldClim - Global Climate Data website (www.worldclim.org, [77]). Bioclimatic variables that were most closely related to the distribution of the provenances and sites along the principal components were determined on the basis of Pearson’s correlation coefficients. The clustering of provenances according to their locations on the PCA biplot was determined visually.
All analyses were computed in R [78]. The extraction of climatic data values for the provenance–origin sites was done with the biovars function in the R package “dismo” [79]. PCA analyses as well as the biplot were created with fviz_pca_biplot functions from the “FactoMineR” package [80]. The detrending, chronology building, and calculation of chronology statistics were performed using the “dplR” package 1.6.4 [81]. Clustering analyses were calculated using the “cluster” 2.0.7–1 package [82]. Pointer–year analysis was implemented using the “pointRes” package [83]. Standardized precipitation evapotranspiration indices were calculated using the “SPEI” package [84]. Moving correlations were performed using the “treeclim” package [85].

3. Results

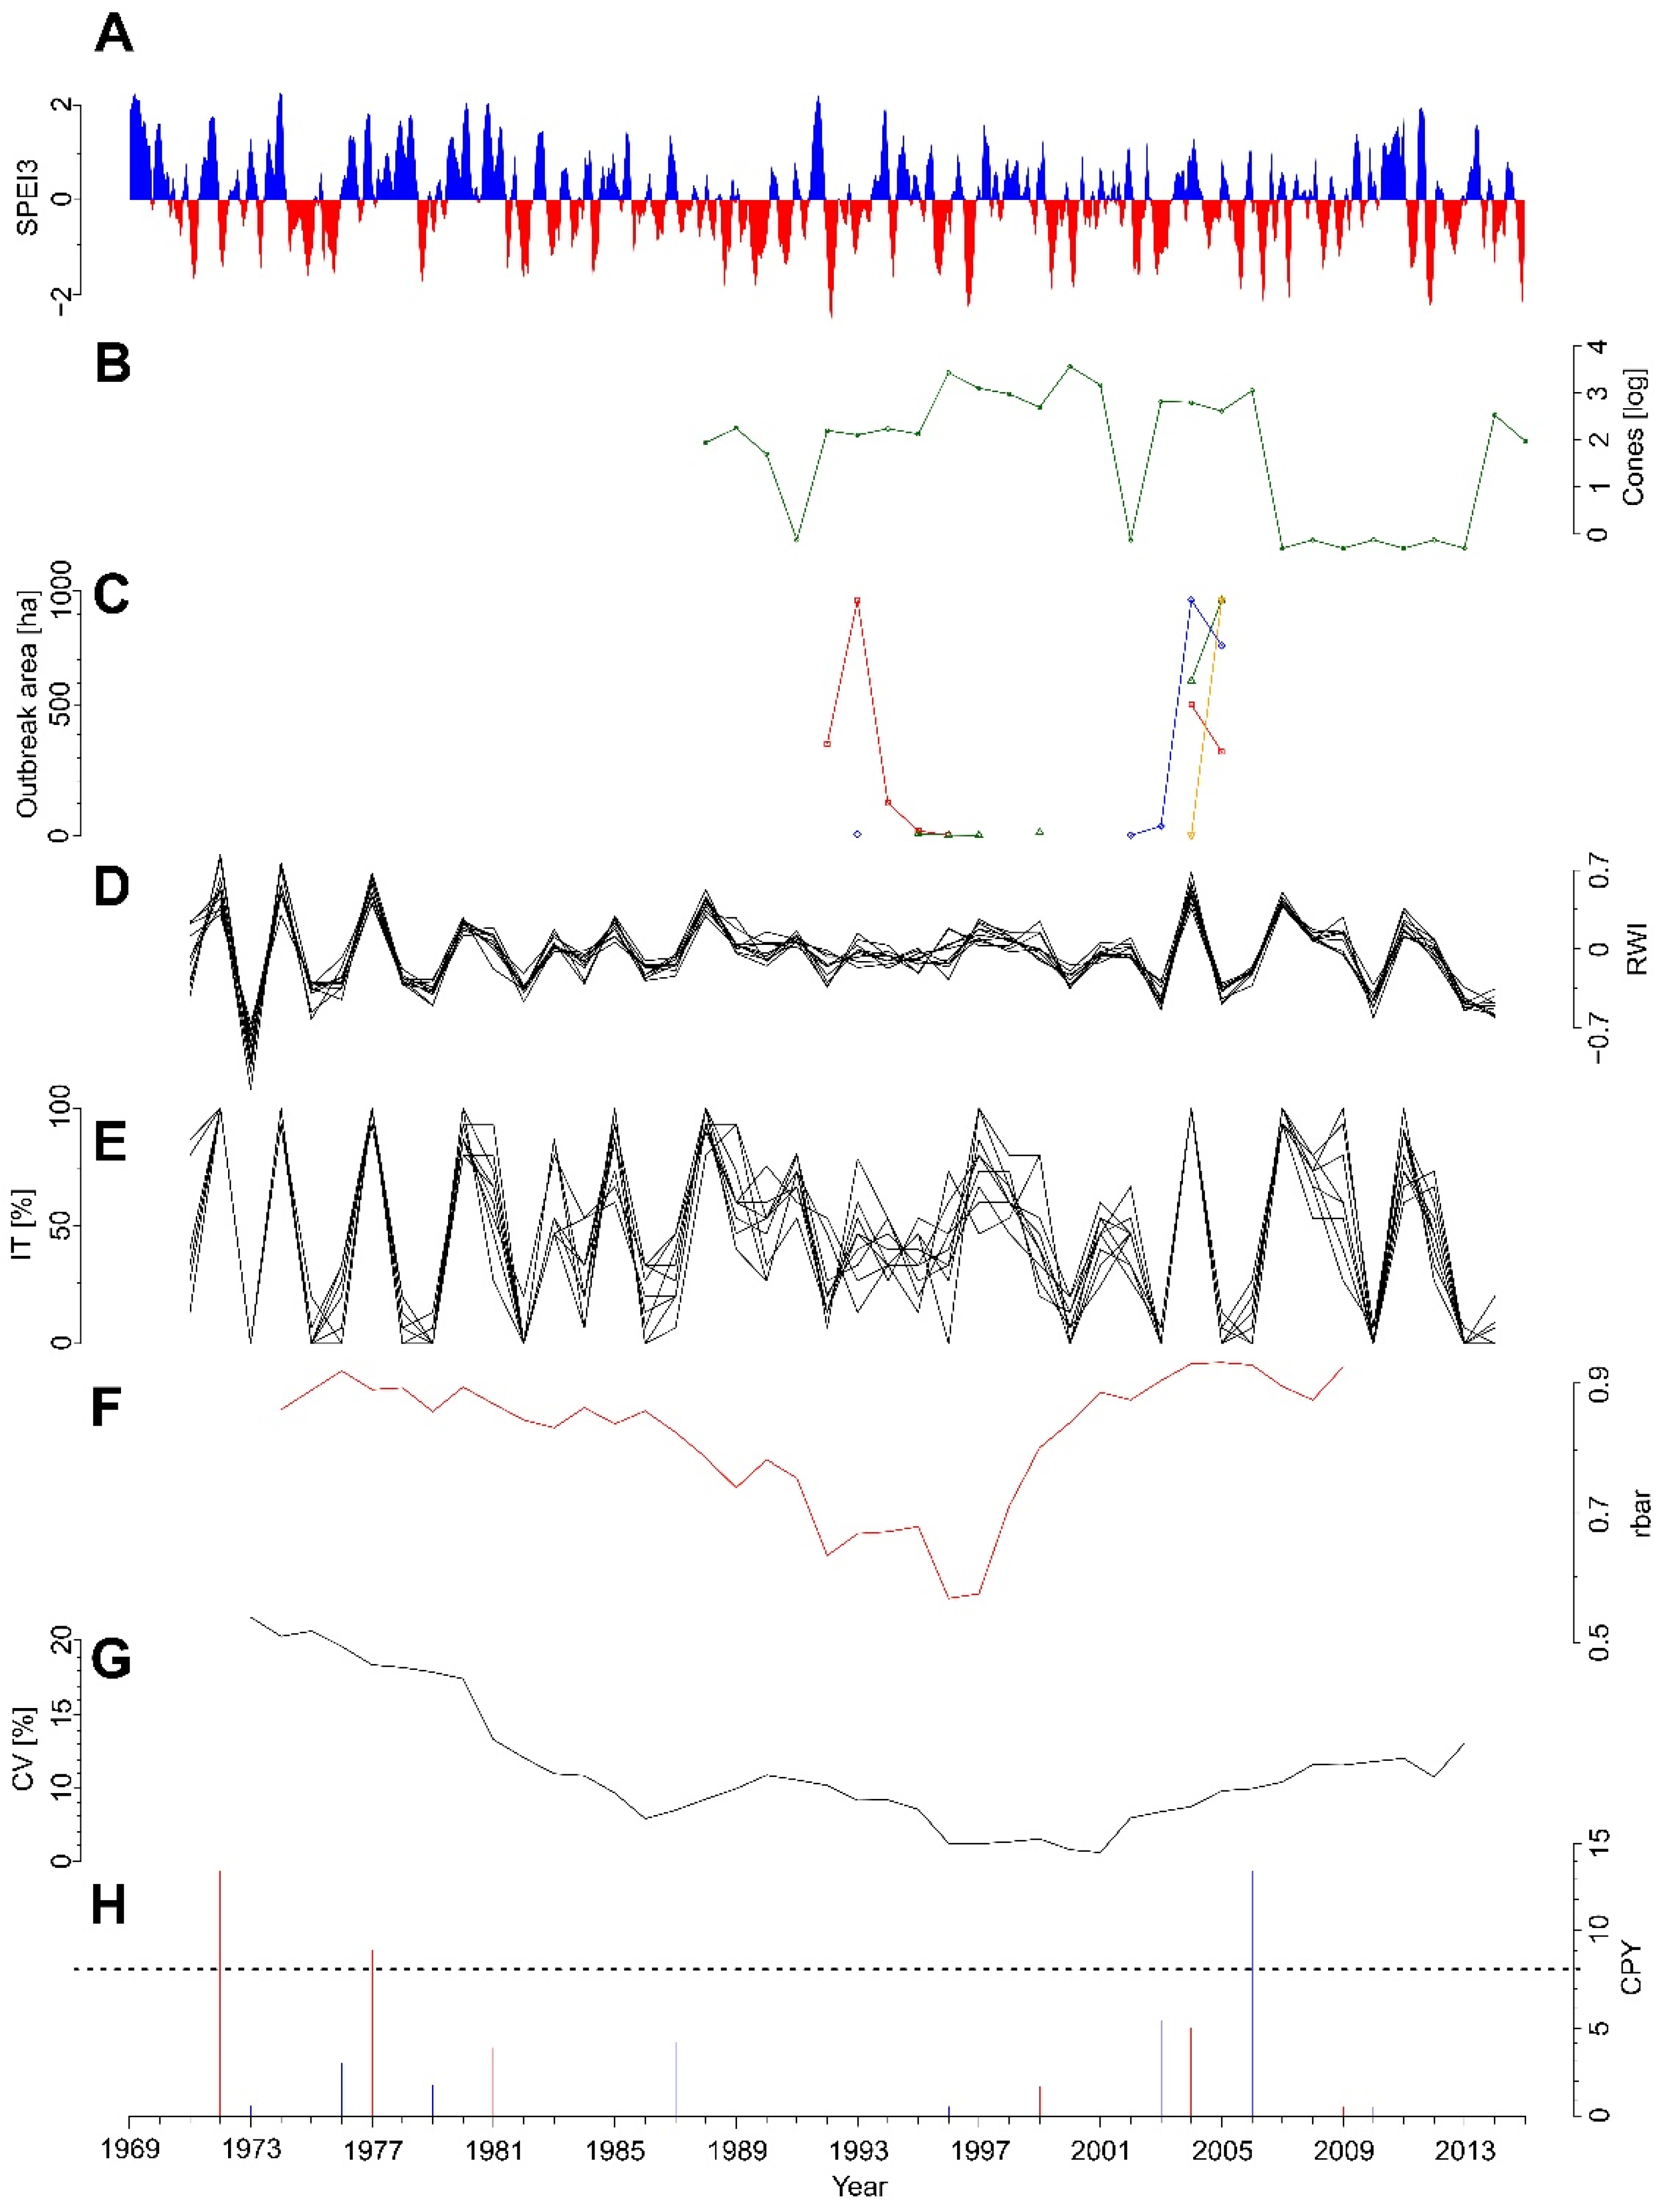
3.1. Radial Growth Chronologies

The mean sensitivity and mean inter–series correlation varied among provenance chronologies; however, no noticeable trend related to the geographical origins of provenance was detected. Thus, differing provenances often represent the same or a neighboring region of Poland (Table 2; Figure 1). The period 1988–2001 was characterized by a higher degree of asynchronicity of growth patterns between provenances as well as a mismatch of interval trends (IT). However, the declining trend for running rbar and coefficient of variation (CV) does not fully coincide with years of intensive seed production (Figure 2B,F,G).

3.2. Growth Responses to the Insect Outbreak

The post–2004 resilience significantly differed between Scots pine provenances; i.e., provenances RU, RO, RY and JE were characterized by the highest RGD value among all studied provenances (2.04, 1.71, 1.44, and 0.90, respectively; Figure 3). High RGD values indicate low resilience (the post–event BAI has not surpassed the BAI three–year average); thus, provenances RU, RO, RY and JE manifested significantly lower resilience after L. monacha defoliation.

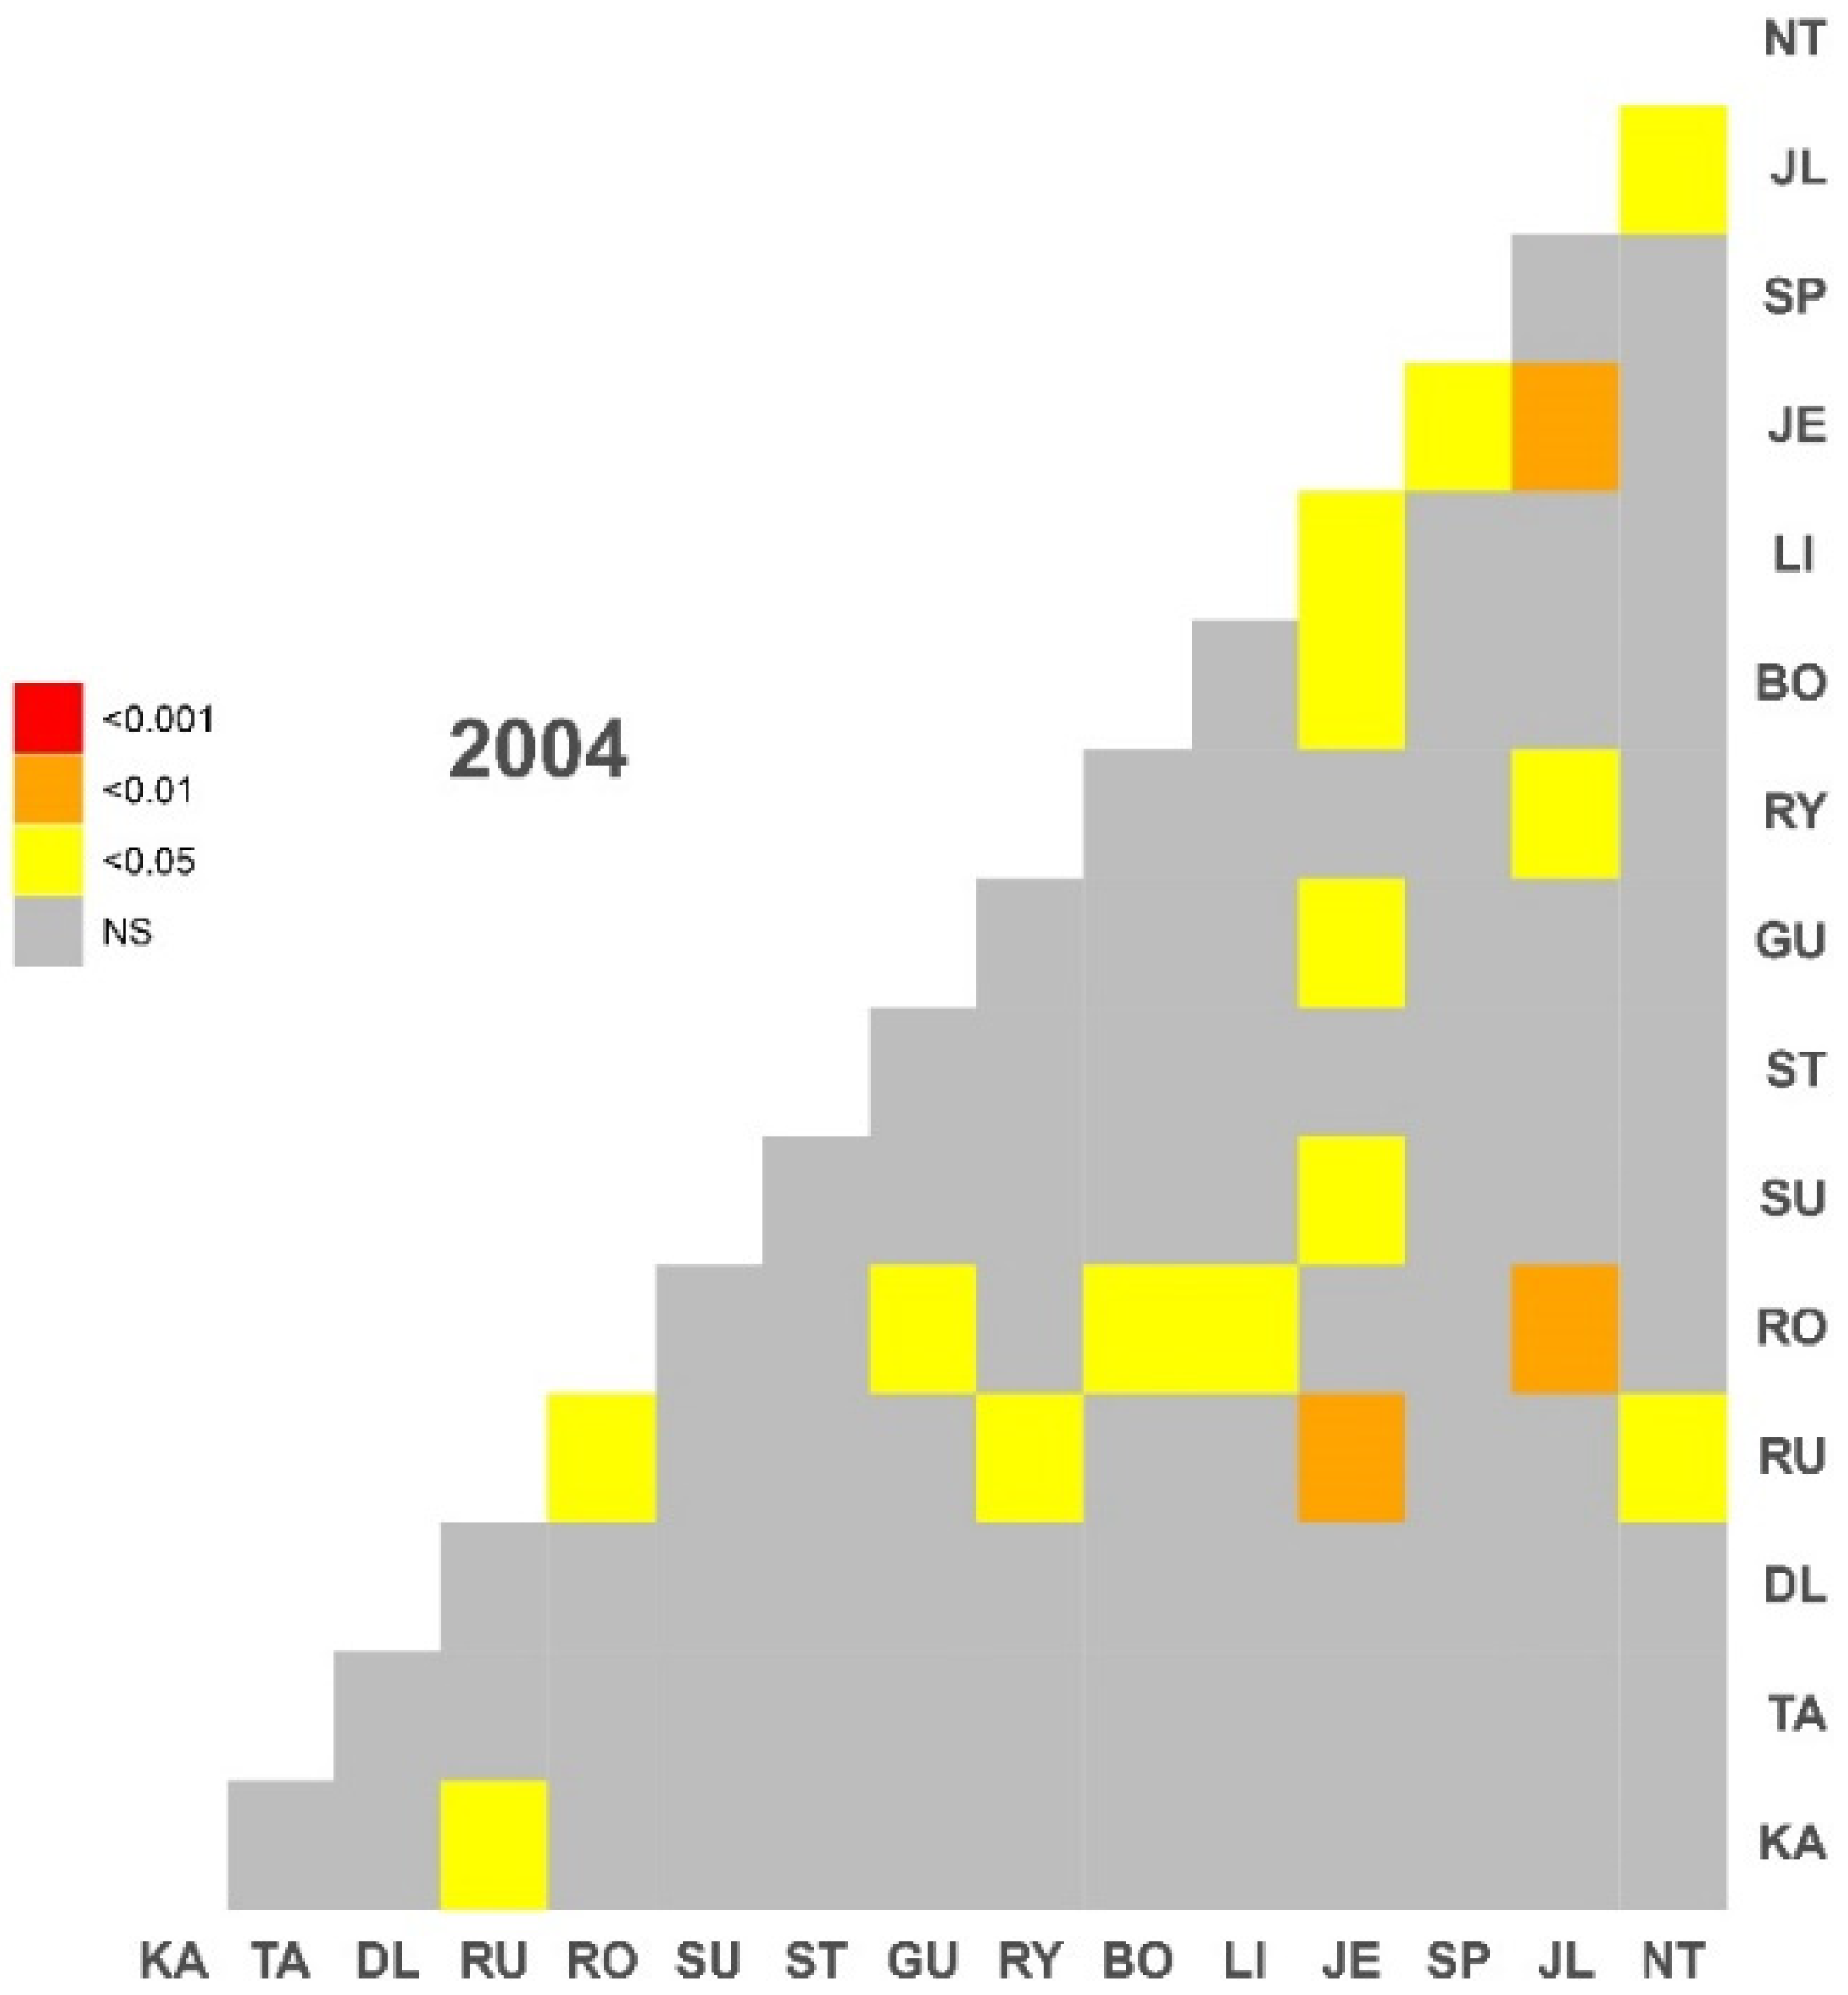
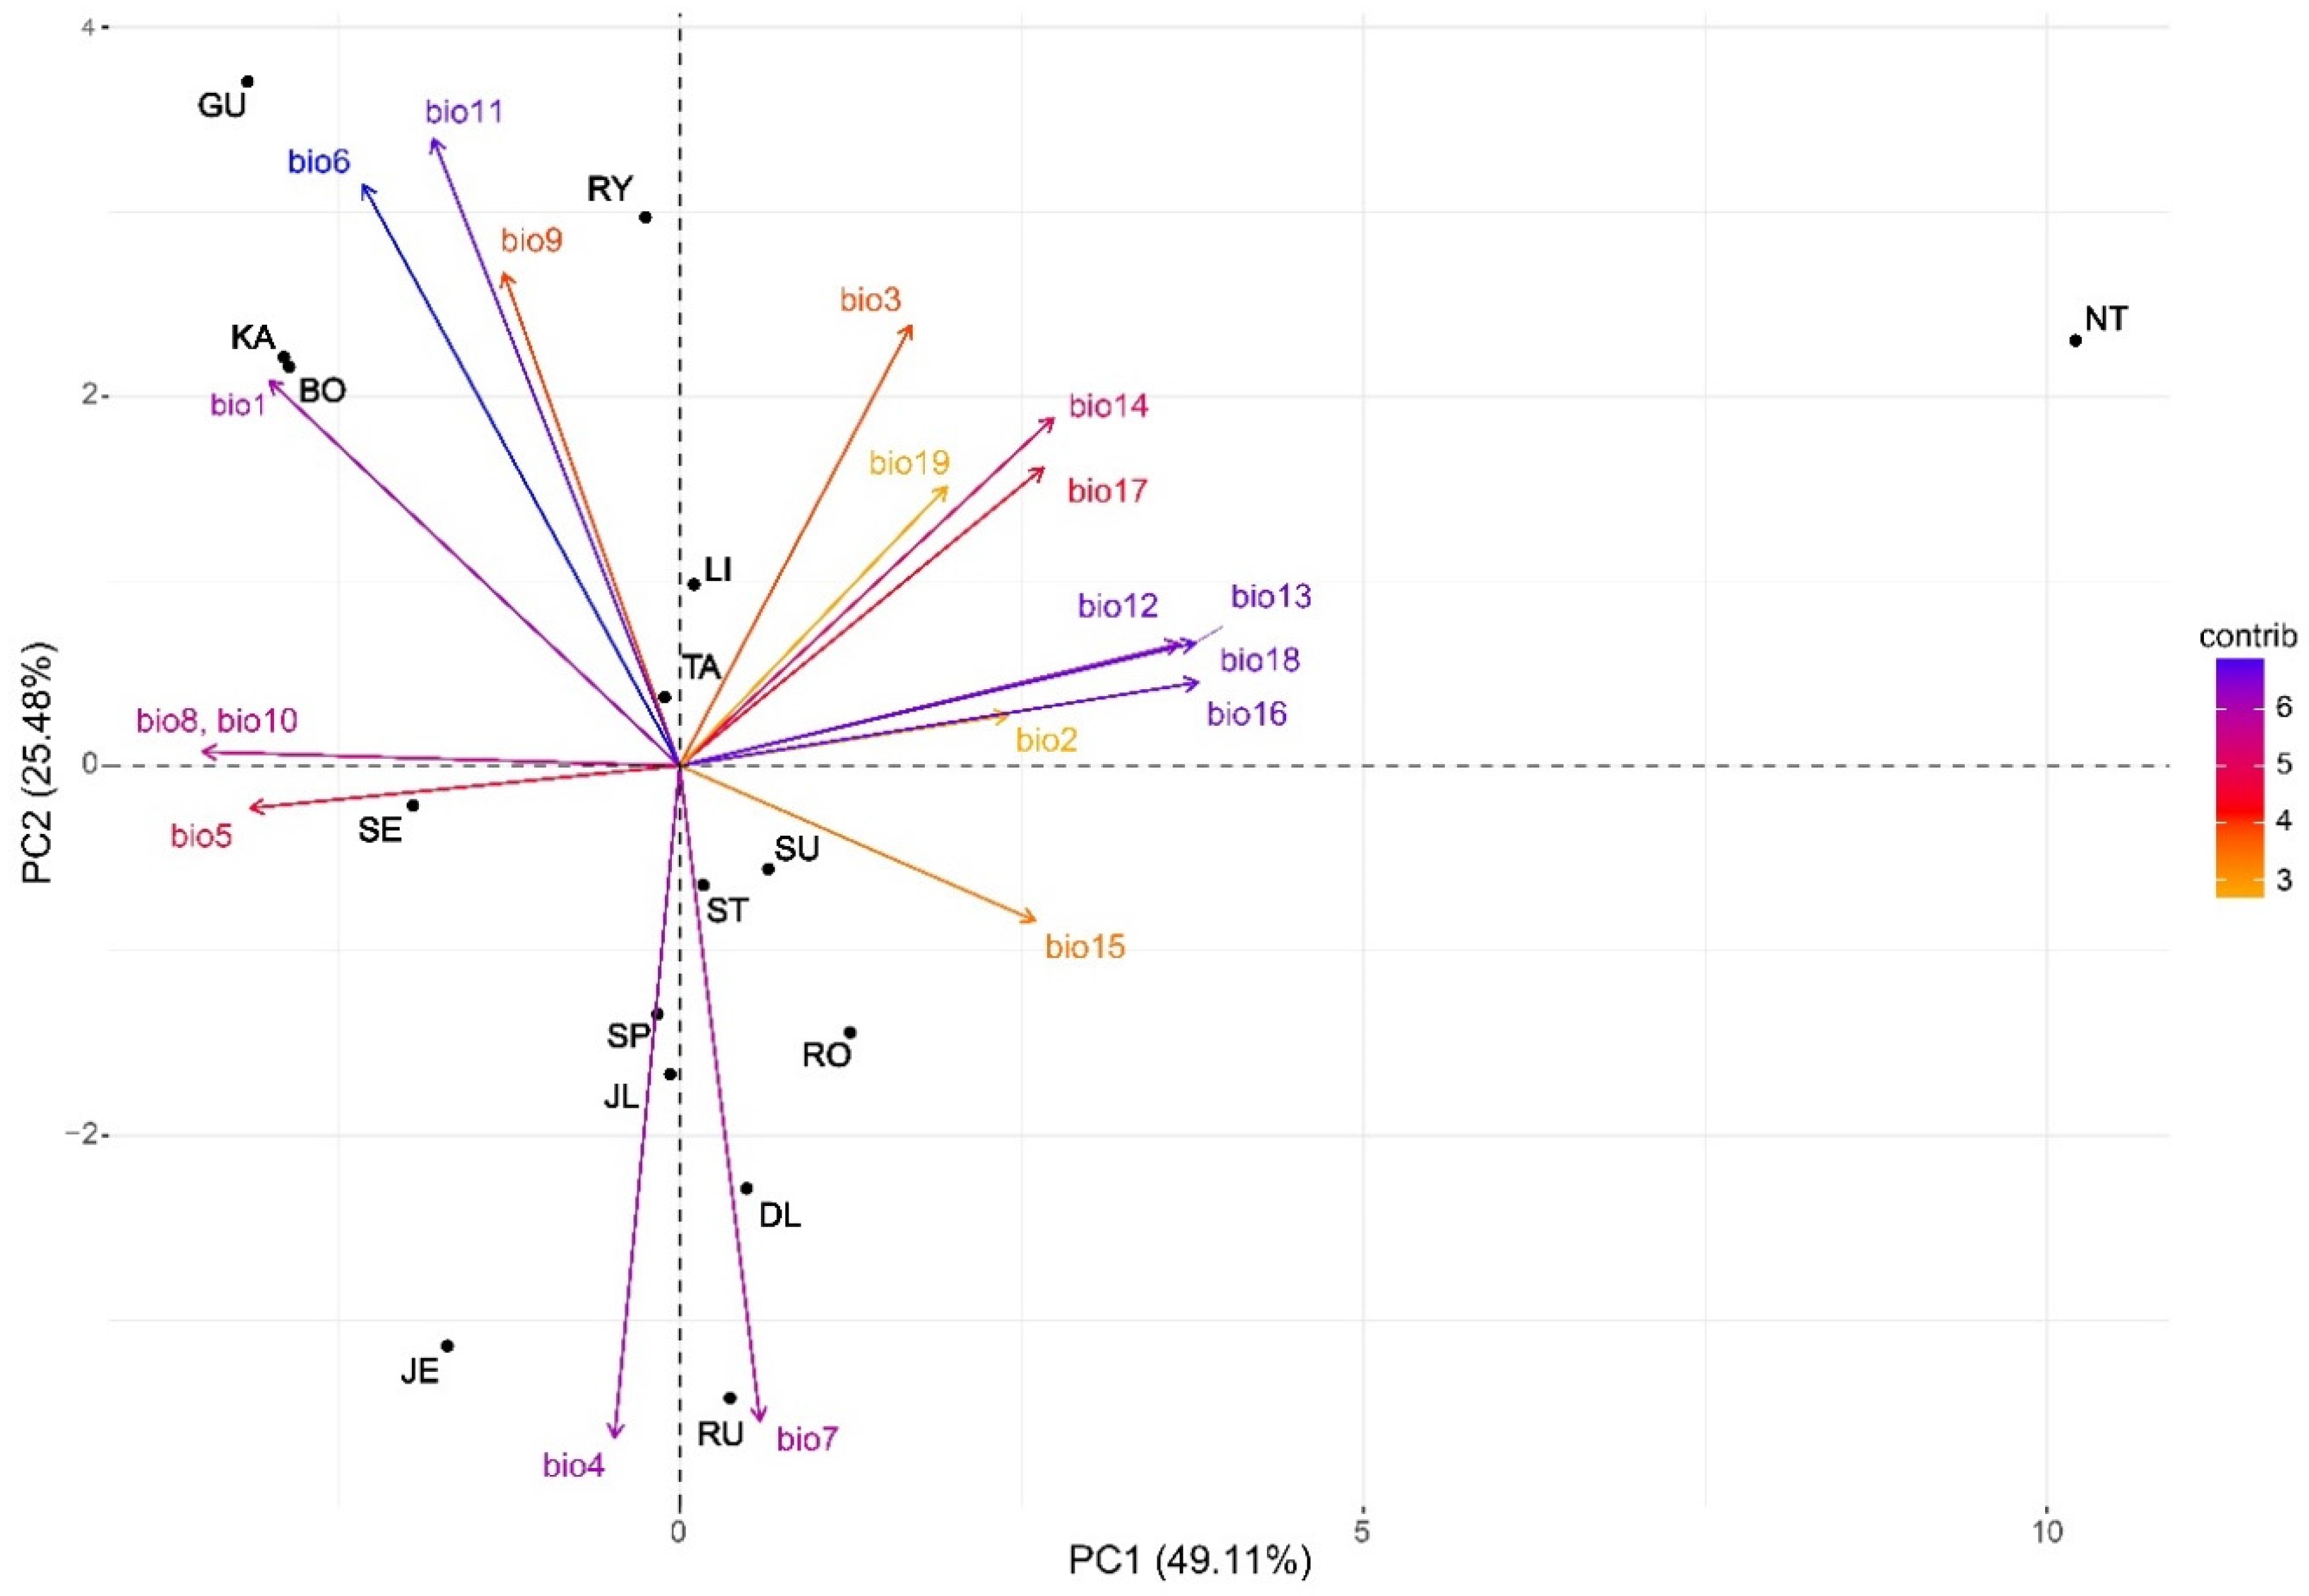
3.3. Clustering and PCGA
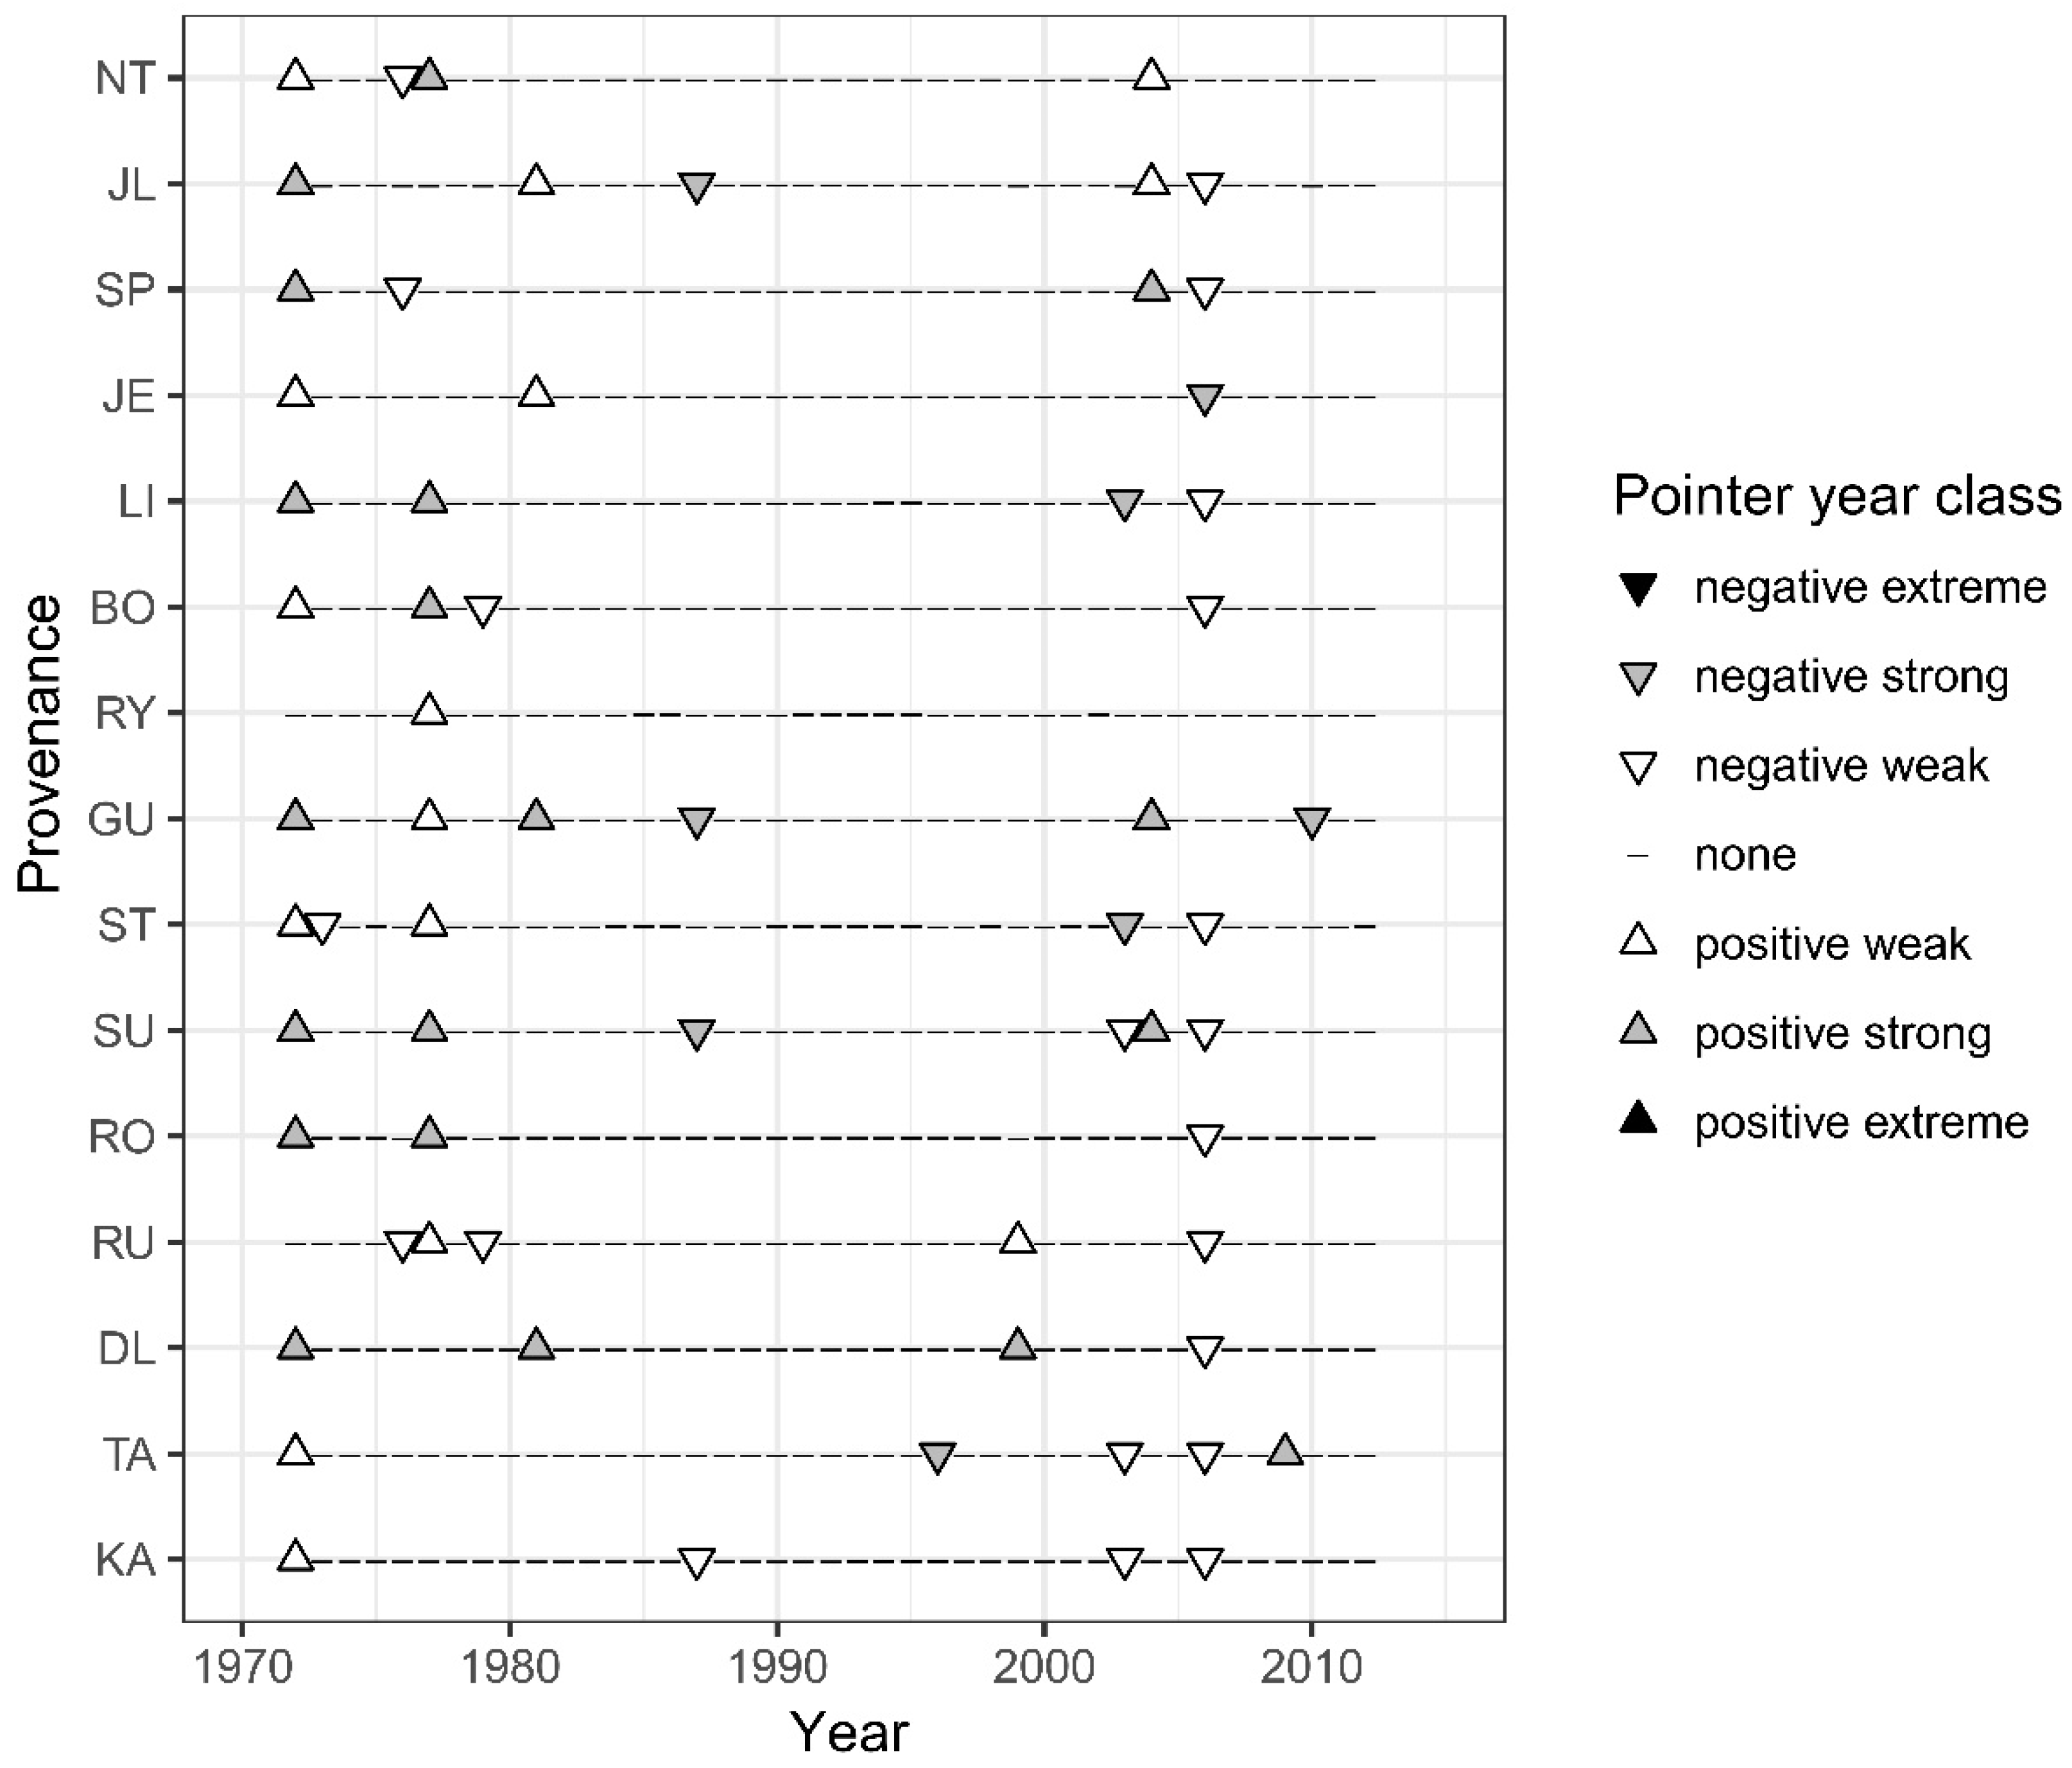
The cluster analysis did not indicate a clear separation of provenance chronologies; however, some of the provenances that were grouped closely together originated from spatially neighboring sites (KA and BO, DL and RU, Figure S2). Moreover, NT, having the highest origin above sea level, took a special position relative to the remaining provenances (Table 1, Figure S2). Pairwise PCGA distinguished the NT provenance from other provenances; however, this was mostly for the period preceding and for the period of intensive seed production (1970–1987, 1988–2006, respectively; Figure 4). In general, PCGA performed independently for the period preceding the period of high seed production and the subsequent one, which clearly underlined the effect of the reproduction effort differentiating provenances in terms of growth behavior.

3.4. Pointer Years

The pointer year analysis did not give us the opportunity to clearly distinguish the period of intensive seed production (i.e., 1988–2006) from the preceding and following years, which were periods of distinctly lower reproduction capacity (Figure 5); that is, only three pointer years were common to most provenances, but all of them were outside or at the end of the period of intensive seed production—i.e., 1972, 1977 (positive), and 2006 (negative) (Figure 2H). Nevertheless, the majority of the period of intensive seed production (1988–2002) was generally characterized by a lower frequency of pointer years (Figure 5).

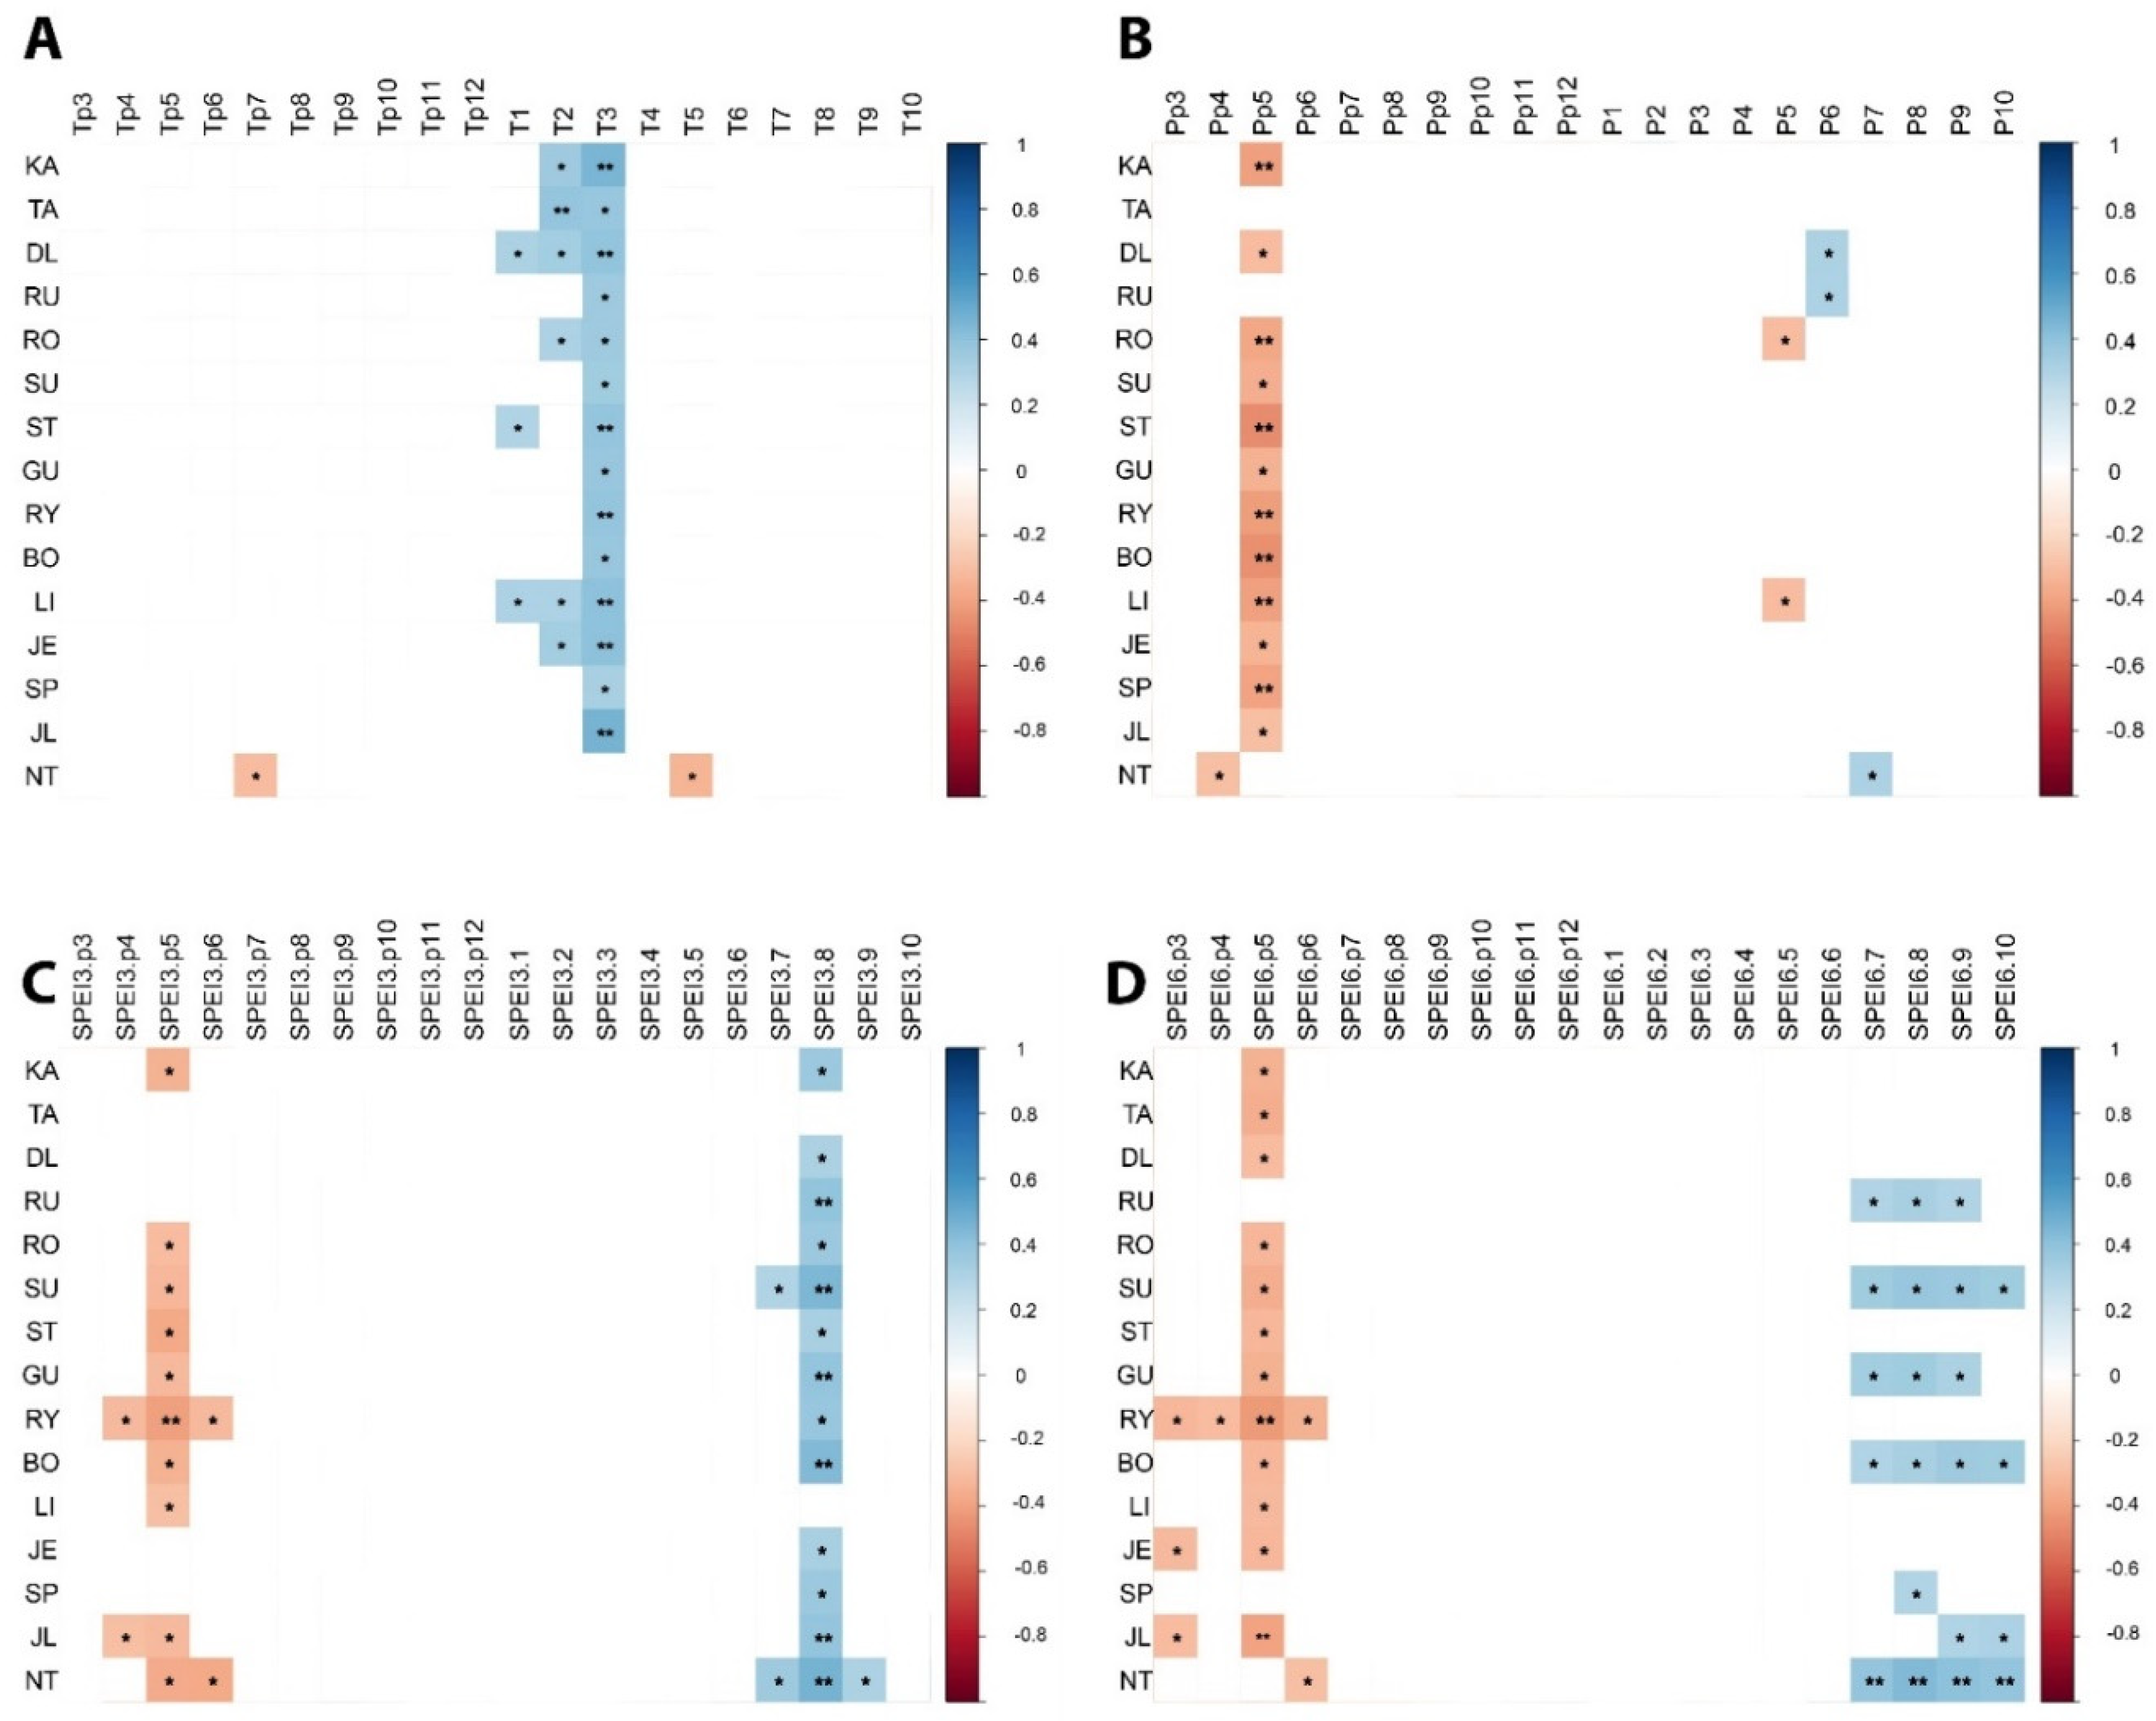
3.5. Climate–Growth Relationships

Climate correlations confirmed a largely uniform growth reaction of most provenances; however, for individual provenances, a pronounced reaction to selected climatic factors was observed. Provenance NT indicated a higher drought susceptibility, which was expressed by significant correlations with the temperature of the current May and the previous July, as well as the SPEI3 and SPEI6 of June–September (Figure 6A,B,D). However, some climatic drivers were common to most provenances, namely March temperature, the previous May’s precipitation and drought conditions (SPEI3) in August (Figure 6A–C). In general, the SPEI3 and SPEI6 indices for the period preceding the growing season correlated negatively with RWI, while for the current growing season, they correlated positively. Finally, some provenances did not show a lack of reaction to the considered drought indices (DL, LI and JE, Figure 6D).

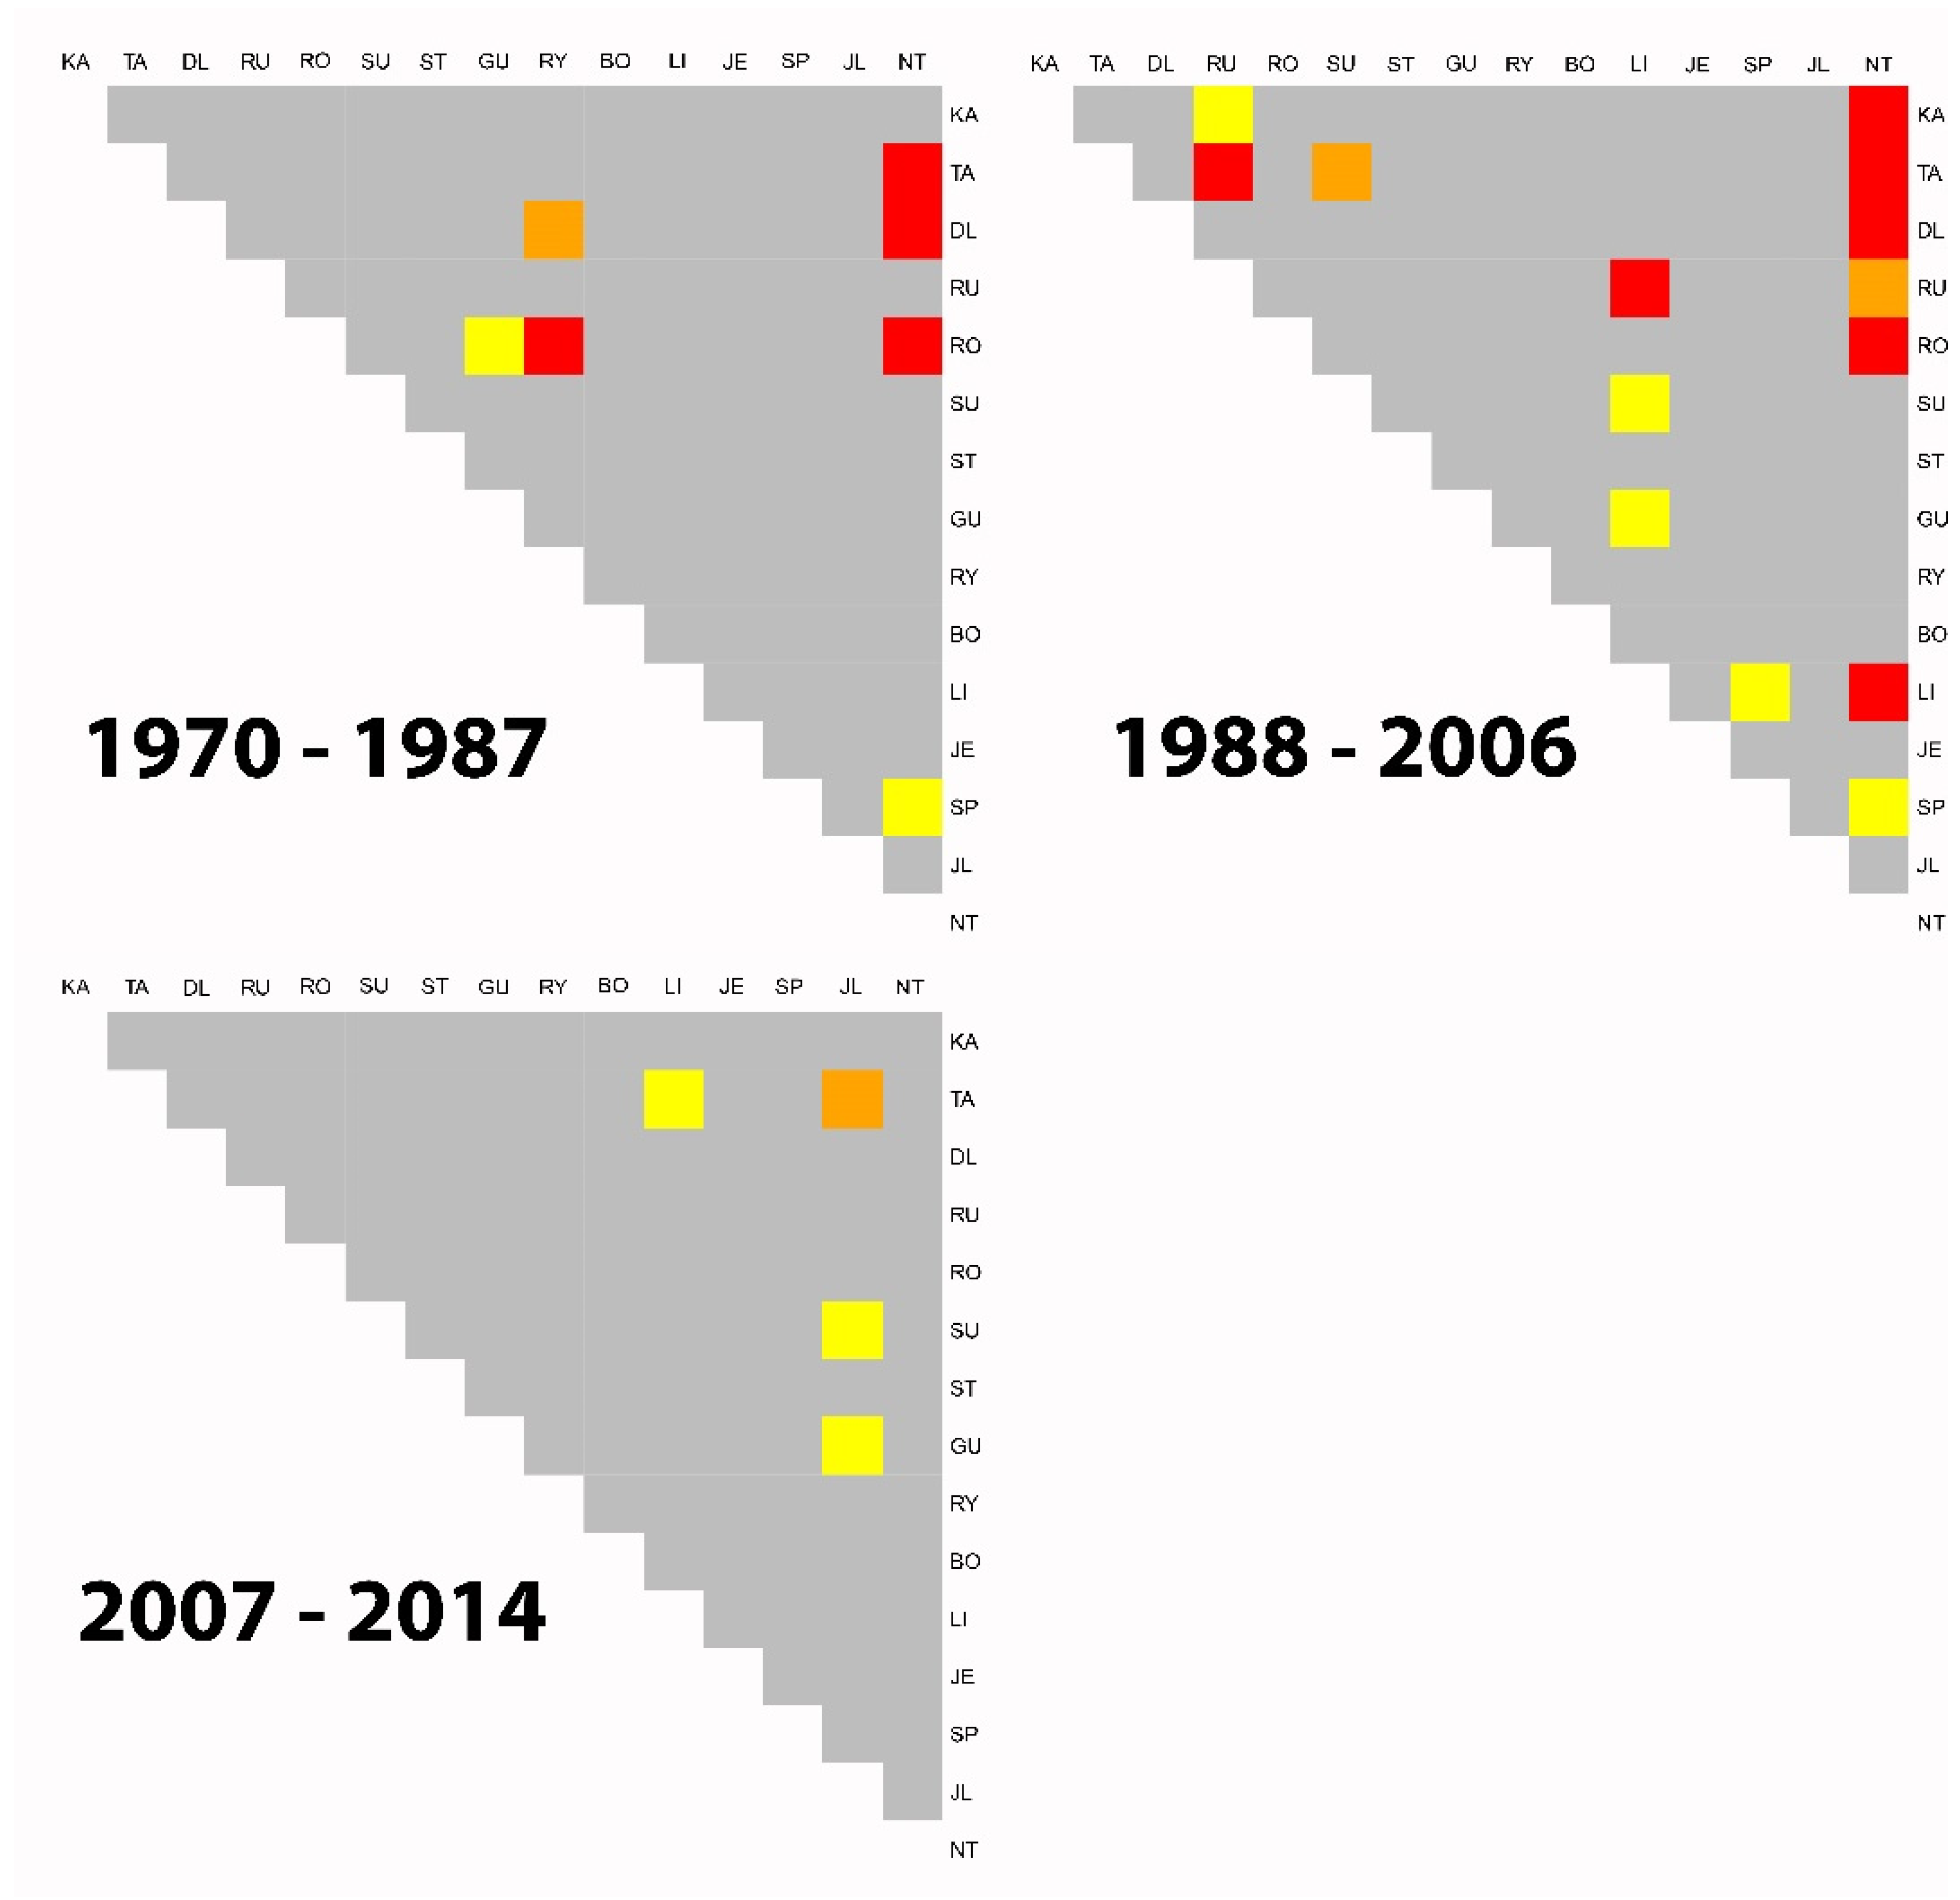
3.6. Climatic Transfer Effect

The PCA applied to the 19 bioclimatic variables representing the 15 origin sites as well as the provenance trial site explained a total of 74.59% of the overall variance (Figure 7, Table 3). The first principal component (PC) explained 49.11% of variance and was positively correlated (0.30 < r < 0.31) with precipitation (bio12–13, bio16 and bio18) and negatively correlated (−0.29 < r < −0.11) with the annual mean temperature and mean temperature of the growing season (bio1, bio5–6, bio8–11). The second principal component (PC2) explained 25.48% of variance (Table 3) and was positively correlated (0.21 < r < 0.39) with the annual mean temperature, isothermality, and mean temperature, as well as the precipitation of the growing season (bio3, bio6, bio9, bio11 and bio14). Moreover, PC2 was negatively correlated with the temperature seasonality and annual range of temperature (bio4, bio7; −0.40 < r < −0.42).
The western provenances (GU, KA, BO and RY) presumably formed a cluster, confirming the similarity of the provenances in terms of their climate origin, while other provenances—apart from NT—formed a separate cluster including northern and eastern locations (TA, LI, ST, SU, SP, JL, RO, DL, RU and JE; Figure 7). NT was located on the periphery of the PC biplot, which may result from its origin, namely the highest location above sea level. The location of the SE trial site between both clusters but on the opposite side of the PCA biplot with respect to NT indicated the average SE site conditions resembling most of the provenances.

3.7. Temporal Variation in Climate Sensitivity

The moving window correlation, performed separately for each provenance, confirmed the provenance–specific temporal variability of climatic sensitivity; provenances KA, TA, DL, BO, LI and JL were characterized by a stable climate reaction to March temperatures, while provenances RU, RO, SU, ST, GU, RY, JE and SP were distinguished by a weakened or no reaction in 1997–2002. In turn, provenance NT, with the highest origin above sea level, reacted to the temperature of the beginning of the growing season only in recent years (Figure S3). The climate sensitivity of provenances in relation to drought conditions (SPEI 3 and SPEI6) was generally characterized by a strong reaction in the first 3–6 years of the studied period, a weakened reaction in the next several years, and a strong reaction at the end of the period (Figure S4). However, the majority of provenances showed a growth reaction to the conditions of drought in May of the period 1997–2002. Only provenances TA, BO and SP did not show a common reaction within the mentioned period.

4. Discussion

Our analyses demonstrate the synergistic effect of both abiotic and biotic environmental factors on long–term trends in growth synchrony among P. sylvestris provenances. During periods with favorable growth conditions, differences among provenances were emphasized. In turn, adverse abiotic (drought) conditions intensified the synchronicity among provenances. The observed insect defoliations did not further desync growth among provenances. As was observed, growth heterogeneity started prior to the insect outbreak (2004), the year after a severe drought, and as a result caused a uniform growth depression in 2005. Nevertheless, in terms of post–outbreak resilience, a significant between–provenance differentiation of growth reaction was noticeable. The periods of high seed production (1988–2006) recorded in managed stands in Chojnów Forest District adjacent to the provenance trial do not reflect the inter–provenance synchronization of radial growth. Thus, apart from biotic conditions, insect herbivores rather than seed productions seem to modulate the temporal dynamics of radial growth synchronization among Scots pine provenances. However, considering both groups of factors—abiotic and biotic—the first factors (mainly droughts) seem to be of key importance for the temporal variation in radial growth synchrony.

4.1. Climate–Driven between–Provenance Variation

The main climatic factor limiting the growth of most provenances is the effect of a negative water balance at the end of the growing season (Figure 6C,D; Figures S3 and S4). Although only the last month of the period included in climate correlations (August) is significantly correlated with growth, this relationship is determined by the three preceding months used to calculate SPEI3. Thus, it can be concluded that the drought conditions of the summer season are the main climatic driver affecting the radial growth of Scots pine provenances. These results are consistent with recent studies on Scots pine, regardless of the study region (e.g., [86,87,88,89]). An additional climatic factor crucial to initiating growth activity is the temperature of the month preceding the growing season (March, Figure 6A). This may be related to critical temperatures limiting the allocation of assimilated carbon to xylem cells [90] and/or the amount of starch in storage tissues around the cambium [91]. The third important climatic factor for radial growth appears to be the precipitation in May of the previous year (Figure 6B). If we assume that high precipitation is related to cloudiness, then reduced solar radiation can substantially reduce the photosynthetic efficiency of trees and thus cause the depletion of synthesized sugars, finally causing a growth reduction [92]. Climate–growth relationships were heterogeneous among some provenances; provenances RU, SU, GU, BO, and NT showed a sensitivity to long–term drought effects (SPEI6; Figure 6D; Figure S4). The majority of Scots pine provenances was found to be relatively sensitive to the middle–term effect of drought conditions, expressed by SPEI3 correlations for August (Figure 6C). Interestingly, the other key climatic factors—namely the temperature of the current March and the precipitation of the previous May—triggered a relatively uniform growth reaction of all provenances (Figure 6A,B). Only provenance NT manifested insensitivity to climatic conditions in March (Figure S3).
So far, an intra–specific variability in the drought adaptation of Scots pine has been found while testing a wide range of provenances covering the European [93,94,95] and Central Siberian [96] range of this species. Studies performed on two provenance trials located in Germany showed an above–average height growth of two Polish provenances (mainly Supraśl and Bolewice) with near–average tolerance to drought [94]. Both Polish provenances mentioned in the studies of Taeger et al. [94] were included in the current study (SU and BO, respectively, Table 1, Figure 1). Based on the present study, both of them can be classified as drought–sensitive Polish provenances, whereas in German studies, they have been defined as moderately sensitive. Therefore, it can be concluded that a group of drought–resistant Polish provenances (KA, TA, DL, RO, LI and JE) would most likely express drought–adaptation in Central Europe.

4.2. Biotic Determinants of Temporal Dynamics in Radial Growth

Most of the period of intensive seed production observed in managed stands in Chojnów Forest District adjacent to the provenance trial (1988–2003) coincided with a period of high heterogeneity of growth behavior in Scots pine provenances, expressed as the lack of uniformity in IT. However, the pointer years analysis does not support this finding, as only three CPYs were determined in the analyzed period, of which two positive CPYs occurred during the juvenile phase of growth while the negative CPY occurred in the period of intensive seed production (in its final phase). Drawing conclusions about relationships between intense seed production and growth uniformity is, however, risky in the absence of a direct observation of seed crops from provenance trial or even in relation to a specific provenance. Seed production efforts can be highly diverse, both among provenances and between individuals, due to the canopy position and microenvironmental conditions, tree size and genetic structure [97,98,99,100]. Thus, the differences between the provenance trial and neighboring managed stands can interfere with the regional synchronization of seed production. On the other hand, however, there is evidence of the regional synchronization of seed production between Scots pine populations [101]. The years of rapid development of the population of insect herbivores expressed in the area of highly defoliated stands only partially overlap with the period of growth heterogeneity; the second period of insect outbreak (2003–2005) corresponds to a distinct growth pattern (Figure 2C, Table S1), confirming correlations between drought conditions that weaken trees and insect outbreak [9]. Interestingly, the highest level of sawfly, nun moth, pine looper moth and pine beauty moth population development occurred a year after the extreme droughts recorded throughout Europe (Figure 2C, Table S1; [102,103]). These observations support the theory that the drought–induced physiological stress of trees may reduce resistance against herbivores [38,39,40]. Nevertheless, the largest area of occurrence of nun moth was observed in 2004, when the growth recovery after drought was recorded, and only in the following year was a negative growth reaction noticeable. This pattern can be explained by the specific pine response to insect defoliation when the recovery of needles takes priority over growth, since a reduced photosynthetic area and carbohydrate pool cause the intense utilization of carbohydrate reserves [104]. The combined effects of multiple stressors—i.e., herbivory by different insect species with different feeding strategies, drought periods, and additionally climatically–driven reproductive events—creates a complex of interrelated biotic and abiotic factors that are reflected in the growth pattern and performance of trees.

4.3. Individualistic Growth Response and Provenance Clustering

The pairwise PCGA of provenances highlighted the effect of reproductive efforts on the inter–provenance variability of growth reactions. This phenomenon is less noticeable in the period preceding intensive seed production and almost imperceptible in the following period (Figure 4). In the period 1988–2006, the provenance NT took a special position, which may support the theory that the high–elevation population characterized by the highest bioclimatic distance to the trial site (Figure 7) reached the limit of adaptability at the trial site [105]. In the case of the remaining provenances, the within–population variability in growth reactions to the common growth factor seems to be high compared to NT. Such high intra–individual variability within provenances is in line with previous studies on Scots pine provenance trials [106].
Both the cluster analysis as well as the pairwise PCGA distinguished NT as a single–provenance sub–cluster (Figure 4, Figure S2). This likely reflects the bioclimatically–determined ecological distance in relation to provenance–specific growth behavior, since the NT, due to its close to the mountain climate of origin, occupies a special bioclimatic niche (Figure 7, Table 3). Thus, the effect of artificially transferred populations manifested in distinct growth patterns resembles an environmentally–dependent phenotype expression [107,108]. The majority of provenances formed two main sub–clusters; however, within the same sub–cluster, both closely localized provenances and others from the edge of the species range in Poland were located. Nevertheless, considering the climatic conditions they represent, all of them seem to be climatically similar to conditions at the trial site (Figure 7, Table 1). The above findings are consistent with the observed highly homogeneous genetic structure of European Scots pine populations and their high phenotypic variability [109]; the only exception to this is the marginal population NT [110].

5. Conclusions

Our study, although it was based on a limited dataset (a single provenance trial and 15 Scots pine provenances covering only Central European distribution), shows that, under spatially uniform but temporally heterogonous climatic conditions, Scots pine provenances manifest temporal variations of growth synchrony. The bioclimatic distance between the climate of provenance origin and the climate of provenance trial determines periods of weak and strong uniformity in provenance–related growth patterns. The main climatic drivers of provenance growth synchrony are related to the hydrological conditions of the previous and current spring. Moreover, stress introduced by drought likely increases the susceptibility of trees to insect herbivory. In conclusion, our results indicate both abiotic and biotic factors that can modulate the temporal dynamics of radial growth synchrony. Insect herbivory, similar to drought periods, results in a more synchronous growth response, while post–outbreak resilience is provenance–specific. Moreover, as insect defoliation can be initiated by drought, both factors can interact synergistically. Understanding the temporal variation of provenance–specific growth behavior in the context of abiotic and biotic factors seems to be important when evaluating the adaptive potential of provenances to climate change. This, however, requires the extension of such studies on multisite provenance experiments and the inclusion of provenance–focused seed production data.

Supplementary Materials

The following are available online at https://www.mdpi.com/1999-4907/10/10/934/s1, Figure S1: Walter & Lieth climatic diagram of Scots pine provenance trials. BL—Bliżyn site, LR—Lipce Reymontowskie site, PO—Polany site, SE—Sękocin site (study site), SI—Siemianice site; Figure S2: Hierarchical clustering of the RWI provenance mean chronologies, using the Euclidean distance and Ward’s minimum variance clustering method. BO, DL, GU, JE, JL, KA, LI, NT, RO, RU, RY, SP, ST, SU and TA: Scots pine provenances; Figure S3: Twenty–year moving window correlations: between tree–ring width index (TRWI) and March–October precipitation and temperature. BO, DL, GU, JE, JL, KA, LI, NT, RO, RU, RY, SP, ST, SU and TA: Scots pine provenances; Figure S4: Twenty–year moving window correlations: between tree–ring width index (TRWI) and March–October SPEI3 and SPEI6. BO, DL, GU, JE, JL, KA, LI, NT, RO, RU, RY, SP, ST, SU and TA: Scots pine provenances; Table S1: Occurrence of the most important Scots pine insect needle herbivores (area of affected stands in hectares) in Chojnów Forest District for the period 1970–2015.

Author Contributions

Conceptualization: M.K.; Methodology: M.K. and S.W.; Formal Analysis: M.K.; Investigation: M.K.; Resources: M.K., W.K. and T.J.; Writing—original draft: M.K.; Writing—review & editing: M.K., R.P., S.W., W.K., T.J. and J.K.; Visualisation: M.K.; Project Administration: J.K.; Funding acquisition: J.K.

Funding

This study was funded by General Directorate of State Forests in Poland (grant number BLP 364).

Acknowledgments

We are grateful to Allan Buras for his input and explanations during data analysis. This research is linked to activities conducted within the COST FP1106 “STReESS” network and SUSTREE—Interreg project “Conservation and sustainable utilization of forest tree diversity in climate change”. We thank Sławomir Jaskólski for language correction.

Conflicts of Interest

The authors declare no conflict of interest.

References

  1. Williams, M.I.; Dumroese, R.K. Preparing for climate change: Forestry and assisted migration. J. For. 2013, 111, 287–297. [Google Scholar] [CrossRef]
  2. Jandl, R.; Bauhus, J.; Bolte, A.; Schindlbacher, A.; Schüler, S. Effect of climate–adapted forest management on carbon pools and greenhouse gas emissions. Curr. For. Rep. 2015, 1, 1–7. [Google Scholar] [CrossRef]
  3. Girona, M.M.; Navarro, L.; Morin, H. A secret hidden in the sediments: Lepidoptera scales. Front. Ecol. Evol. 2018, 6, 2. [Google Scholar] [CrossRef]
  4. Seidl, R.; Thom, D.; Kautz, M.; Martin-Benito, D.; Peltoniemi, M.; Vacchiano, G.; Wild, J.; Ascoli, D.; Petr, M.; Honkaniemi, J.; et al. Forest disturbances under climate change. Nat. Clim. Chang. 2017, 7, 395–402. [Google Scholar] [CrossRef] [Green Version]
  5. Isaac–Renton, M.G.; Roberts, D.R.; Hamann, A.; Spiecker, H. Douglas–fir plantations in Europe: A retrospective test of assisted migration to address climate change. Glob. Chang. Biol. 2014, 20, 2607–2617. [Google Scholar] [CrossRef] [PubMed]
  6. Chakraborty, D.; Jandl, R.; Kapeller, S.; Schueler, S. Disentangling the role of climate and soil on tree growth and its interaction with seed origin. Sci. Total Environ. 2019, 654, 393–401. [Google Scholar] [CrossRef]
  7. Klisz, M.; Buras, A.; Sass–Klaassen, U.; Puchałka, R.; Koprowski, M.; Ukalska, J. Limitations at the limit? Diminishing of genetic effects in Norway spruce provenance trials. Front. Plant Sci. 2019, 10, 306. [Google Scholar] [CrossRef]
  8. Lucas-Borja, M.E.; Vacchiano, G. Interactions between climate, growth and seed production in Spanish black pine (Pinus nigra Arn. ssp. salzmannii) forests in Cuenca Mountains (Spain). New For. 2018, 49, 399–414. [Google Scholar]
  9. Sangüesa–Barreda, G.; Linares, J.C.; Camarero, J.J. Reduced growth sensitivity to climate in bark–beetle infested Aleppo pines: Connecting climatic and biotic drivers of forest dieback. For. Ecol. Manag. 2015, 357, 126–137. [Google Scholar] [CrossRef]
  10. Navarro, L.; Morin, H.; Bergeron, Y.; Girona, M.M. Changes in spatiotemporal patterns of 20th century spruce budworm outbreaks in eastern Canadian boreal forests. Front. Plant Sci. 2018, 9, 1905. [Google Scholar] [CrossRef]
  11. Walter, J.A.; Sheppard, L.W.; Anderson, T.L.; Kastens, J.H.; Bjørnstad, O.N.; Liebhold, A.M.; Reuman, D.C. The geography of spatial synchrony. Ecol. Lett. 2017, 20, 801–814. [Google Scholar] [CrossRef] [PubMed]
  12. Defriez, E.J.; Sheppard, L.W.; Reid, P.C.; Reuman, D.C. Climate change–related regime shifts have altered spatial synchrony of plankton dynamics in the North Sea. Glob. Chang. Biol. 2016, 22, 2069–2080. [Google Scholar] [CrossRef] [PubMed]
  13. Shestakova, T.A.; Gutiérrez, E.; Kirdyanov, A.V.; Camarero, J.J.; Génova, M.; Knorre, A.A.; Linares, J.C.; De Dios, V.R.; Sánchez–Salguero, R.; Voltas, J. Forests synchronize their growth in contrasting Eurasian regions in response to climate warming. Proc. Natl. Acad. Sci. USA 2016, 113, 662–667. [Google Scholar] [CrossRef] [PubMed] [Green Version]
  14. Camarero, J.J.; Gazol, A.; Sangüesa–Barreda, G.; Oliva, J.; Vicente–Serrano, S.M. To die or not to die: Early warnings of tree dieback in response to a severe drought. J. Ecol. 2015, 103, 44–57. [Google Scholar] [CrossRef]
  15. Housset, J.M.; Carcaillet, C.; Girardin, M.P.; Xu, H.; Tremblay, F.; Bergeron, Y. In situ comparison of tree–ring responses to climate and population genetics: The need to control for local climate and site variables. Front. Ecol. Evol. 2016, 4, 123. [Google Scholar] [CrossRef]
  16. George, J.P.; Schueler, S.; Karanitsch–Ackerl, S.; Mayer, K.; Klumpp, R.T.; Grabner, M. Inter–and intra–specific variation in drought sensitivity in Abies spec. and its relation to wood density and growth traits. Agric. For. Meteorol. 2015, 214, 430–443. [Google Scholar] [CrossRef]
  17. George, J.P.; Grabner, M.; Karanitsch–Ackerl, S.; Mayer, K.; Weißenbacher, L.; Schueler, S. Genetic variation, phenotypic stability, and repeatability of drought response in European larch throughout 50 years in a common garden experiment. Tree Physiol. 2017, 37, 33–46. [Google Scholar] [CrossRef]
  18. Merian, P.; Bontemps, J.; Berge, L.; Lebourgeois, F. Spatial variation and temporal instability in climate–growth relationships of sessile oak (Quercus petraea [Matt.] Liebl.) under temperate conditions. Plant Ecol. 2011, 212, 1855–1871. [Google Scholar] [CrossRef]
  19. Carrer, M. Individualistic and time–varying tree–ring growth to climate sensitivity. PLoS ONE 2011, 6, e22813. [Google Scholar] [CrossRef]
  20. Carrer, M.; Urbinati, C. Long–term change in the sensitivity of tree–ring growth to climate forcing in Larix decidua. New Phytol. 2006, 170, 861–872. [Google Scholar] [CrossRef]
  21. Chavardès, R.D.; Daniels, L.D.; Waeber, P.O.; Innes, J.L.; Nitschke, C.R. Unstable climate–growth relations for white spruce in southwest Yukon, Canada. Clim. Chang. 2013, 116, 593–611. [Google Scholar] [CrossRef]
  22. Biondi, F. Are climate–tree growth relationships changing in north–central Idaho, USA? Arct. Antarct. Alp. Res. 2000, 32, 111–116. [Google Scholar] [CrossRef]
  23. Dansgaard, W.; Johnsen, S.J.; Clausen, H.B.; Dahl–Jensen, D.; Gundestrup, N.S.; Hammer, C.U.; Hvidberg, C.S.; Steffensen, J.P.; Sveinbjörnsdottir, A.E.; Jouzel, J.; et al. Evidence for general instability of past climate from a 250–kyr ice–core record. Nature 1993, 364, 218–220. [Google Scholar] [CrossRef]
  24. Carrer, M.; Urbinati, C. Age–dependent tree–ring growth responses to climate in Larix decidua and Pinus cembra. Ecology 2004, 85, 730–740. [Google Scholar] [CrossRef]
  25. Savva, Y.; Bergeron, Y.; Denneler, B.; Koubaa, A.; Tremblay, F. Effect of interannual climate variations on radial growth of jack pine provenances in Petawawa, Ontario. Can. J. For. Res. 2008, 38, 619–630. [Google Scholar] [CrossRef]
  26. Herrera, C.M.; Jordano, P.; Guitian, J.; Traveset, A. Annual variability in seed production by woody plants and the masting concept: Reassessment of principles and relationship to pollination and seed dispersal. Am. Nat. 1998, 152, 576–594. [Google Scholar] [CrossRef]
  27. Montoro Girona, M.; Lussier, J.M.; Morin, H.; Thiffault, N. Conifer regeneration after experimental shelterwood and seed–tree treatments in boreal forests: Finding silvicultural alternatives. Front. Plant Sci. 2018, 9, 1145. [Google Scholar] [CrossRef]
  28. Zamorano, J.G.; Hokkanen, T.; Lehikoinen, A. Climate–driven synchrony in seed production of masting deciduous and conifer tree species. J. Plant Ecol. 2018, 11, 180–188. [Google Scholar]
  29. Pearse, I.S.; Koenig, W.D.; Kelly, D. Mechanisms of mast seeding: Resources, weather, cues, and selection. New Phytol. 2016, 212, 546–562. [Google Scholar] [CrossRef]
  30. Suvanto, S.; Nöjd, P.; Henttonen, H.M.; Beuker, E.; Mäkinen, H. Geographical patterns in the radial growth response of Norway spruce provenances to climatic variation. Agric. For. Meteorol. 2016, 222, 10–20. [Google Scholar] [CrossRef] [Green Version]
  31. Selås, V.; Piovesan, G.; Adams, J.M.; Bernabei, M. Climatic factors controlling reproduction and growth of Norway spruce in southern Norway. Can. J. For. Res. 2002, 32, 217–225. [Google Scholar] [CrossRef]
  32. Hacket–Pain, A.J.; Ascoli, D.; Berretti, R.; Mencuccini, M.; Motta, R.; Nola, P.; Piussi, P.; Ruffinatto, F.; Vacchiano, G. Temperature and masting control Norway spruce growth, but with high individual tree variability. For. Ecol. Manag. 2019, 438, 142–150. [Google Scholar] [CrossRef] [Green Version]
  33. Deslauriers, A.; Caron, L.; Rossi, S. Carbon allocation during defoliation: Testing a defense–growth trade–off in balsam fir. Front. Plant Sci. 2015, 6, 1–13. [Google Scholar] [CrossRef] [PubMed]
  34. Bansal, S.; Hallsby, G.; Löfvenius, M.O.; Nilsson, M.C. Synergistic, additive and antagonistic impacts of drought and herbivory on Pinus sylvestris: Leaf, tissue and whole–plant responses and recovery. Tree Physiol. 2013, 33, 451–463. [Google Scholar] [CrossRef]
  35. Grüning, M.; Beule, L.; Meyer, S.; Karlovsky, P.; I–M–Arnold, A. The abundance of fungi, bacteria and denitrification genes during insect outbreaks in Scots pine forests. Forests 2018, 9, 497. [Google Scholar] [CrossRef]
  36. Grüning, M.M.; Simon, J.; Rennenberg, H.; L–M–Arnold, A. Defoliating insect mass outbreak affects soil n fluxes and tree n nutrition in Scots pine forests. Front. Plant Sci. 2017, 8, 954. [Google Scholar] [CrossRef]
  37. Bigler, C.; Bräker, O.U.; Bugmann, H.; Dobbertin, M.; Rigling, A. Drought as an inciting mortality factor in scots pine stands of the Valais, Switzerland. Ecosystems 2006, 9, 330–343. [Google Scholar] [CrossRef]
  38. Netherer, S.; Matthews, B.; Katzensteiner, K.; Blackwell, E.; Henschke, P.; Hietz, P.; Pennerstorfer, J.; Rosner, S.; Kikuta, S.; Schume, H.; et al. Do water–limiting conditions predispose Norway spruce to bark beetle attack? New Phytol. 2015, 205, 1128–1141. [Google Scholar] [CrossRef]
  39. Marini, L.; Ayres, M.P.; Battisti, A.; Faccoli, M. Climate affects severity and altitudinal distribution of outbreaks in an eruptive bark beetle. Clim. Chang. 2012, 115, 327–341. [Google Scholar] [CrossRef]
  40. Krams, I.; Daukšte, J.; Kivleniece, I.; Brumelis, G.; Cibuļskis, R.; Aboliņš–abols, M.; Rantala, M.J.; Mierauskas, P.; Krama, T. Drought–induced positive feedback in xylophagous insects: Easier invasion of Scots pine leading to greater investment in immunity of emerging individuals. For. Ecol. Manag. 2012, 270, 147–152. [Google Scholar] [CrossRef]
  41. Jacquet, J.S.; Bosc, A.; O′Grady, A.; Jactel, H. Combined effects of defoliation and water stress on pine growth and non–structural carbohydrates. Tree Physiol. 2014, 34, 367–376. [Google Scholar] [CrossRef] [PubMed]
  42. Zvereva, E.L.; Lanta, V.; Kozlov, M.V. Effects of sap–feeding insect herbivores on growth and reproduction of woody plants: A meta–analysis of experimental studies. Oecologia 2010, 163, 949–960. [Google Scholar] [CrossRef] [PubMed]
  43. Kaitaniemi, P.; Neuvonen, S.; Nyyssönen, T. Effects of cumulative defoliations on growth, reproduction, and insect resistance in mountain birch. Ecology 1999, 80, 524–532. [Google Scholar] [CrossRef]
  44. Matras, J. Provenances studies on Scots pine conducted by the Section of Seed Science and Selection of the Forest Research Institute. Sylwan 1989, 133, 53–56, (In Polish with English abstract). [Google Scholar]
  45. Boczoń, A.; Kowalska, A.; Gawryś, R. Soil−water determinants of forest management in the perspective of climate change. Sylwan 2017, 161, 763–771, (In Polish with English abstract). [Google Scholar]
  46. Beguería, S.; Vicente–Serrano, S.M.; Reig, F.; Latorre, B. Standardized Precipitation Evapotranspiration Index (SPEI) revisited: Parameter fitting, evapotranspiration models, tools, datasets and drought monitoring. Int. J. Climatol. 2014, 34, 3001–3023. [Google Scholar] [CrossRef]
  47. Hargreaves, G.H.; Samani, Z.A. Reference crop evapotranspiration from temperature. Appl. Eng. Agric. 1985, 1, 96–99. [Google Scholar] [CrossRef]
  48. Allen, R.G.; Pereira, L.S.; Raes, D.; Smith, M. FAO Irrigation and Drainage Paper No. 56; Food and Agriculture Organization of the United Nations: Rome, Italy, 1998; p. e156. [Google Scholar]
  49. IUSS Working Group WRB. World reference base for soil resources 2014, update 2015: International soil classification system for naming soils and creating legends for soil maps. World Soil Resour. Rep. 2015, 160, 192. [Google Scholar]
  50. Kantorowicz, W. Half a century of seed years in major tree species of Poland. Silvae Genet. 2000, 49, 245–249. [Google Scholar]
  51. Geri, C. The pine sawfly in central France. In Dynamics of Forest Insect Populations (Theory and Application); Berryman, A., Ed.; Springer: Boston, MA, USA, 1988; pp. 377–405. [Google Scholar]
  52. Schönherr, J. Nun moth outbreak in Poland 1978–1984. J. Appl. Entomol. 1985, 99, 73. [Google Scholar] [CrossRef]
  53. Barbour, D. The Pine Looper in Britain and Europe. In Dynamics of Forest Insect Populations: Patterns, Causes, Implications; Berryman, A., Ed.; Springer: New York, NY, USA, 1988; pp. 291–309. [Google Scholar]
  54. Straw, N.A.; Armour, H.L.; Day, K.R. The financial costs of defoliation of Scots pine (Pinus sylvestris) by pine looper moth (Bupalus piniaria). Forestry 2002, 75, 525–536. [Google Scholar] [CrossRef]
  55. Straw, N.A. The impact of pine looper moth, Bupalus piniaria L. (Lepidoptera; Geometridae) on the growth of scots pine in Tentsmuir Forest, Scotland. For. Ecol. Manag. 1996, 87, 209–232. [Google Scholar] [CrossRef]
  56. Cedervind, J. Impact of Pine looper Defoliation in Scots Pine: Secondary Attack by Pine Shoot Beetles, Tree Mortality, Top.–Kill, Growth Losses, and Foliage Recovery; Swedish University of Agricultural Sciences: Uppsala, Sweden, 2003. [Google Scholar]
  57. Nakládal, O.; Brinkeová, H. Review of historical outbreaks of the nun moth (Lymantria monacha) with respect to host tree species. J. For. Sci. 2015, 61, 18–26. [Google Scholar]
  58. Pimm, S.L. The complexity and stability of ecosystems. Nature 1984, 307, 321–326. [Google Scholar] [CrossRef]
  59. Wilcoxon, F. Individual comparisons by ranking methods. Biom. Bull. 1945, 1, 80–83. [Google Scholar] [CrossRef]
  60. Krause, C.; Morin, H. Changes in radial increment in stems and roots of balsam fir [Abies balsamea (L.) Mill.] after defoliation spruce budworm. For. Chron. 1995, 71, 747–754. [Google Scholar] [CrossRef]
  61. Cook, E.R.; Peters, K. The smoothing spline: A new approach to standardizing forest interior tree–ring width series for dendroclimatic studies. Tree Ring Bull. 1981, 41, 45–53. [Google Scholar]
  62. Speer, J.H. Fundamentals of Tree–Ring Research; University of Arizona Press: Tucson, AZ, USA, 2010. [Google Scholar]
  63. Cook, E.; Briffa, K.; Shiyatov, S.; Mazepa, A.; Jones, P. Data analysis. In Methods of Dendrochronology: Applications in the Environmental Sciences; Cook, E., Kairiukstis, L., Eds.; International Institute for Applied Systems Analysis, Kluwer: Dordrecht, Switzerland, 1990; pp. 97–162. [Google Scholar]
  64. Eckstein, D.; Bauch, J. Beitrag zur Rationalisierung eines dendrochronologischen Verfahrens und zur Analyse seiner Aussagesicherheit. Forstwiss. Cent. 1969, 88, 230–250. [Google Scholar] [CrossRef]
  65. Buras, A.; Wilmking, M. Correcting the calculation of Gleichläufigkeit. Dendrochronologia 2015, 34, 29–30. [Google Scholar] [CrossRef]
  66. Wigley, T.; Briffa, K.; Jones, P. On the average value of correlated time series, with applications in dendroclimatology and hydrometeorology. J. Clim. Appl. Meteorol. 1984, 23, 201–213. [Google Scholar] [CrossRef]
  67. Douglass, A.E. Evidence of climatic effects in the annual rings of trees. Ecology 1920, 1, 24–32. [Google Scholar] [CrossRef]
  68. Murtagh, F.; Legendre, P. Ward’s Hierarchical Agglomerative clustering method: Which algorithms implement Ward’s criterion? J. Classif. 2014, 31, 274–295. [Google Scholar] [CrossRef]
  69. Sokal, R.; Michener, C. A statistical method for evaluating systematic relationships. Univ. Kans. Sci. Bull. 1958, 38, 1409–1438. [Google Scholar]
  70. Kaufman, L.; Rousseeuw, P. Clustering large applications (Program CLARA). In Finding Groups in Data: An Introduction to Cluster Analysis; Kaufman, L., Rousseeuw, P., Eds.; Willey: Hoboken, NJ, USA, 2008; pp. 126–163. [Google Scholar]
  71. Buras, A.; Van Der Maaten–theunissen, M.; Van Der Maaten, E. Tuning the Voices of a Choir: Detecting ecological gradients in time–series populations. PLoS ONE 2016, 11, e0158346. [Google Scholar] [CrossRef]
  72. Simes, J.R. Improved Bonferroni procedure for multiple tests of significance. Biometrika 1986, 73, 751–754. [Google Scholar] [CrossRef]
  73. Shestakova, T.; Gutiérrez, E.; Voltas, J. A roadmap to disentangling ecogeographical patterns of spatial synchrony in dendrosciences. Trees Struct. Funct. 2018, 32, 359–370. [Google Scholar] [CrossRef]
  74. Schweingruber, F.H.; Eckstein, D.; Serre–Bachet, F.; Bräker, O.U. Identification, presentation and interpretation of event years and pointer years in dendrochronology. Dendrochronologia 1990, 8, 9–38. [Google Scholar]
  75. Cropper, J. Tree–ring skeleton plotting by computer. Tree Ring Bull. 1979, 39, 47–60. [Google Scholar]
  76. Neuwirth, B.; Schweingruber, F.H.; Winiger, M. Spatial patterns of central European pointer years from 1901 to 1971. Dendrochronologia 2007, 24, 79–89. [Google Scholar] [CrossRef]
  77. Hijmans, R.J.; Cameron, S.E.; Parra, J.L.; Jones, P.G.; Jarvis, A. Very high resolution interpolated climate surfaces for global land areas. Int. J. Climatol. 2005, 25, 1965–1978. [Google Scholar] [CrossRef]
  78. R Core Team. R: A Language and Environment for Statistical Computing; R Foundation for Statistical Computing: Vienna, Austria, 2015; Available online: http://www.R-project.org/ (accessed on 19 November 2017).
  79. Hijmans, R.J.; Phillips, S.; Leathwick, J.; Elith, J. Species Distribution Modeling. Available online: http://rspatial.org/sdm/ (accessed on 28 October 2018).
  80. Husson, F.; Josse, J.; Le, S.; Mazet, J. Factominer: Multivariate exploratory data analysis and data mining. R Package Version 2018, 1, 29. [Google Scholar]
  81. Bunn, A.G. A dendrochronology program library in R (dplR). Dendrochronologia 2008, 26, 115–124. [Google Scholar] [CrossRef]
  82. Rousseeuw, P.; Struyf, A.; Hubert, M.; Studer, M.; Roudier, P.; Gonzalez, J.; Kozlowski, K. Finding Groups in Data: Cluster Analysis Extended Rousseeuw. Available online: https://svn.r-project.org/R-packages/trunk/cluster (accessed on 28 October 2018).
  83. van der Maaten–Theunissen, M.; van der Maaten, E.; Bouriaud, O. PointRes: An R package to analyze pointer years and components of resilience. Dendrochronologia 2015, 35, 34–38. [Google Scholar] [CrossRef]
  84. Begueria, S.; Vicente–Serrano, S.M.; Sawasawa, H. SPEI: Calculation of Standardised Precipitation–Evapotranspiration Index. R Package Version 2017, 1, 6. [Google Scholar]
  85. Zang, C.; Biondi, F. Treeclim: An R package for the numerical calibration of proxy–climate relationships. Ecography 2015, 38, 431–436. [Google Scholar] [CrossRef]
  86. Antonova, G.F.; Stasova, V.V. Effects of environmental factors on wood formation in Scots pine stems. Trees 1993, 7, 214–219. [Google Scholar] [CrossRef]
  87. Gruber, A.; Strobl, S.; Veit, B.; Oberhuber, W. Impact of drought on the temporal dynamics of wood formation in Pinus sylvestris. Tree Physiol. 2010, 30, 490–501. [Google Scholar] [CrossRef]
  88. Buras, A.; Schunk, C.; Zeiträg, C.; Herrmann, C.; Kaiser, L.; Lemme, H.; Straub, C.; Taeger, S.; Gößwein, S.; Klemmt, H.J.; et al. Are Scots pine forest edges particularly prone to drought–induced mortality? Environ. Res. Lett. 2018, 13. [Google Scholar] [CrossRef]
  89. Matisons, R.; Jansone, D.; Elferts, D.; Adamovičs, A.; Schneck, V.; Jansons, Ā. Plasticity of response of tree–ring width of Scots pine provenances to weather extremes in Latvia. Dendrochronologia 2019, 54, 1–10. [Google Scholar] [CrossRef]
  90. Gričar, J.; Zupančič, M.; Čufar, K.; Koch, G.; Schmitt, U.; Owen, P. Effect of local heating and cooling on cambial activity and cell differentiation in the stem of Norway spruce (Picea abies). Ann. Bot. 2006, 97, 943–951. [Google Scholar] [CrossRef]
  91. Oribe, Y.; Funada, R.; Kubo, T. Relationships between cambial activity, cell differentiation and the localization of starch in storage tissues around the cambium in locally heated stems of Abies sachalinensis (Schmidt) Masters. Trees Struct. Funct. 2003, 17, 185–192. [Google Scholar]
  92. Hari, P.; Kerminen, V.M.; Kulmala, L.; Kulmala, M.; Noe, S.; Petäjä, T.; Vanhatalo, A.; Bäck, J. Annual cycle of Scots pine photosynthesis. Atmos. Chem. Phys. 2017, 17, 15045–15053. [Google Scholar] [CrossRef] [Green Version]
  93. Oleksyn, J.; Tjoelker, M.G.; Reich, P.B. Adaptation to changing environment in Scots pine populations across a latitudinal gradient. Silva Fenn. 1998, 32, 129–140. [Google Scholar] [CrossRef]
  94. Taeger, S.; Zang, C.; Liesebach, M.; Schneck, V.; Menzel, A. Impact of climate and drought events on the growth of Scots pine (Pinus sylvestris L.) provenances. For. Ecol. Manag. 2013, 307, 30–42. [Google Scholar] [CrossRef]
  95. Semerci, A.; Semerci, H.; Çalişkan, B.; Çiçek, N.; Ekmekçi, Y.; Mencuccini, M. Morphological and physiological responses to drought stress of European provenances of Scots pine. Eur. J. For. Res. 2017, 136, 91–104. [Google Scholar] [CrossRef]
  96. Savva, Y.V.; Schweingruber, F.H.; Kuzmina, N.A.; Vaganov, E.A. Sensitivity of diameter growth to annual weather conditions in Scots pine provenances at a Central Siberian location. Silvae Genet. 2002, 51, 49–55. [Google Scholar]
  97. Davi, H.; Pichot, C.; Fady, B.; Cailleret, M.; Restoux, G.; Amm, A. Disentangling the factors driving tree reproduction. Ecosphere 2016, 7, e01389. [Google Scholar] [CrossRef]
  98. Greene, D.F.; Messier, C.; Asselin, H.; Fortin, M.J. The effect of light availability and basal area on cone production in Abies balsamea and Picea glauca. Can. J. Bot. 2002, 80, 370–377. [Google Scholar] [CrossRef]
  99. Krouchi, F.; Derridj, A.; Lefèvre, F. Year and tree effect on reproductive organisation of Cedrus atlantica in a natural forest. For. Ecol. Manag. 2004, 197, 181–189. [Google Scholar] [CrossRef]
  100. Seifert, T.; Muller–Starck, G. Impacts of fructification on biomass production and correlated genetic effects in Norway spruce (Picea abies [L.] Karst.). Eur. J. For. Res. 2009, 128, 155–169. [Google Scholar] [CrossRef]
  101. Nussbaumer, A.; Waldner, P.; Etzold, S.; Gessler, A.; Benham, S.; Thomsen, I.M.; Jørgensen, B.B.; Timmermann, V.; Verstraeten, A.; Sioen, G.; et al. Patterns of mast fruiting of Common beech, Sessile and Common oak, Norway spruce and Scots pine in Central and Northern Europe. For. Ecol. Manag. 2016, 363, 237–251. [Google Scholar] [CrossRef]
  102. Rebetez, M.; Mayer, H.; Dupont, O. Heat and drought 2003 in Europe: A climate synthesis. Ann. For. Sci. 2006, 63, 569–577. [Google Scholar] [CrossRef]
  103. He, B.; Liu, J.; Guo, L.; Wu, X.; Xie, X.; Zhang, Y.; Chen, C.; Zhong, Z.; Chen, Z. Recovery of ecosystem carbon and energy fluxes from the 2003 drought in Europe and the 2012 drought in the United States. Geophys. Res. Lett. 2018, 45, 4879–4888. [Google Scholar] [CrossRef]
  104. Ericsson, A.; Larsson, S.; Tenow, O. Effects of early and late season defoliation on growth and carbohydrate dynamics in Scots pine. J. Appl. Ecol. 1980, 17, 747–769. [Google Scholar] [CrossRef]
  105. Aitken, S.N.; Yeaman, S.; Holliday, J.A.; Wang, T.; Curtis–McLane, S. Adaptation, migration or extirpation: Climate change outcomes for tree populations. Evolut. Appl. 2008, 1, 95–111. [Google Scholar] [CrossRef]
  106. Savva, Y.; Schweingruber, F.; Milyutin, L.; Vaganov, E. Genetic and environmental signals in tree rings from different provenances of Pinus sylvestris L. planted in the southern taiga, central Siberia. Trees 2002, 16, 313–324. [Google Scholar] [CrossRef]
  107. Ståhl, E.G. Transfer effects and variations in basic density and tracheid length of Pinus sylvestris L. populations. Stud. For. Suec. 1988, 180, 1–15. [Google Scholar]
  108. DeWitt, T.J.; Scheiner, S.M. Phenotypic variation from single genotypes. In Phenotypic Plasticity: Functional and Conceptual Approaches; DeWitt, T.J., Scheiner, S.M., Eds.; Oxford University Press: Oxford, UK, 2004; Volume 13, pp. 1–10. [Google Scholar]
  109. Wójkiewicz, B.; Cavers, S.; Wachowiak, W. Current approaches and perspectives in population genetics of Scots pine (Pinus sylvestris L.). For. Sci. 2016, 62, 343–354. [Google Scholar] [CrossRef]
  110. Hebda, A.; Wójkiewicz, B.; Wachowiak, W. Genetic characteristics of Scots pine in Poland and reference populations based on nuclear and chloroplast microsatellite markers. Silva Fenn. 2017, 51, 1721. [Google Scholar] [CrossRef]
Figure 1. Location of study site. Triangle—experimental site, circles—Scots pine provenances. BO, DL, GU, JE, JL, KA, LI, NT, RO, RU, RY, SP, ST, SU and TA—Scots pine provenances. Red polygon—border of Chojnów Forest District. Top–left panel—distribution of Scots pine (Courtesy of EUFORGEN, http://www.euforgen.org/species/pinus-sylvestris/).
Forests 10 00934 g001
Figure 2. Temporal variations of environmental parameters: standardized precipitation evapotranspiration index (SPEI) integrated over three years (A), seed crop magnitude on a logarithmic scale (grey poligon highlights seed years; (B) and area of insect outbreak (Diprionidae—red square, Lymantria monacha—blue diamond, Bupalus piniarius—green triangle, Panolis flammea—yellow triangle point down); (C) ring width indices (D), interval trend (E), 10–year moving window rbar (F), 10–year coefficient of variation, (G) and common pointer years (red—positive, blue—negative, dashed line—common pointer years; threshold for (H)).
Forests 10 00934 g002
Figure 3. Probability value of Wilcoxon rank–sum test used to demarcate a significant difference in short–term (RGD: relative growth deviation) growth resilience in Scots pine provenances. Colors represent the significance level of the Wilcoxon rank–sum test (yellow—p < 0.05, orange—p < 0.01, red—p < 0.001, grey—insignificant).
Forests 10 00934 g003
Figure 4. Probability value of Wilcoxon rank–sum test (Bonferroni correction) used to demarcate a significant difference in principal component gradient analysis (PCGA)–ranks between provenances for the sub–periods 1970–1987, 1988–2006, and 2007–2014. Colors represent significance level of Wilcoxon rank–sum test (yellow—p < 0.05, orange—p < 0.01, red—p < 0.001, grey—insignificant).
Forests 10 00934 g004
Figure 5. Common pointer years (CPY) for provenances, indicated by upper (positive) and inverted (negative) triangles. BO, DL, GU, JE, JL, KA, LI, NT, RO, RU, RY, SP, ST, SU and TA: Scots pine provenances.
Forests 10 00934 g005
Figure 6. Correlations of the ring–width index (RWI) provenance chronologies with monthly climatic parameters, from March in the previous year through October in the current year: temperature (panel A), precipitation (panel B), SPEI3 (panel C), and SPEI6 (panel D) over the period 1970–2014. Colors represent correlation coefficients; non–significant correlations are not represented (white). * and ** demarcate a significance level of correlation (p < 0.05 and p < 0.01, respectively).
Forests 10 00934 g006
Figure 7. Climate–related variability between provenances and the trial site based on bioclimatic indexes. Explanations: SE: Sękocin trial site; BO, DL, GU, JE, JL, KA, LI, NT, RO, RU, RY, SP, ST, SU and TA: Scots pine provenances. Variable vectors are colored according to their contribution to total variance: orange—low, blue—high.
Forests 10 00934 g007
Table 1. Scots pine provenances included in the study. MAP—mean annual precipitation, Tmin—minimum annual temperature, Tmax—maximum annual temperature.
Provenance IDLatitudeLongitudeAltitudeMAP [mm]Tmin [°C]Tmax [°C]
KA52.908715.112076558−5.224.0
TA53.775920.0241121650−7.423.3
DL53.529620.6719171634−8.623.3
RU53.642421.5867150630−9.223.6
RO53.982022.8266168598−8.122.0
SU53.229823.3395154573−7.722.7
ST52.585023.5362178572−7.523.4
GU51.956314.831061554−4.324.2
RY51.157217.8977202575−5.423.2
BO52.437915.861374552−5.223.9
LI53.737718.1175132585−6.721.8
JE52.595621.6365104523−8.324.0
SP51.592720.1617195565−7.823.4
JL50.620722.4525212571−8.123.4
NT49.508720.0055700927−8.821.3
Table 2. Chronology statistics of Scots pine provenances. TRW: tree–ring width index; glk: gleichläufigkeit; MS: mean sensitivity; EPS: expressed population signal; AR1: first–order autocorrelation.
Provenance IDTRWglkMSrbtEPSAR1
KA2.690.760.720.520.940.61
TA2.500.760.780.520.940.67
DL2.420.750.760.560.950.63
RU2.550.810.740.500.940.53
RO2.550.800.770.520.940.69
SU2.650.740.730.540.950.49
ST2.400.710.700.480.930.55
GU2.530.750.680.490.940.51
RY2.620.680.680.420.920.46
BO2.960.710.720.470.930.57
LI2.700.700.740.580.950.56
JE2.710.710.700.440.920.55
SP2.700.730.730.560.950.54
JL2.530.730.680.450.930.60
NT2.470.750.680.470.930.67
Table 3. Pearson’s correlation coefficients (p–value) between climatic variables and the first two major components, with eigenvalues and the explained variation.
Bioclimatic VariablesAbbreviationPC 1PC 2
Annual mean temperaturebio1−0.250 (<0.001)0.241 (0.075)
Mean monthly temperature rangebio20.201 (0.252)0.0316 (0.987)
Isothermality [(bio2/bio7) × 100)]bio30.141 (0.837)0.276 (0.013)
Temperature seasonality (std × 100)bio4−0.040 (0.385)−0.420 (<0.001)
Max temperature of warmest monthbio5−0.262 (0.001)−0.026 (0.785)
Min temperature of coldest monthbio6−0.193 (0.001)0.364 (0.001)
Temperature annual range (bio5–bio6)bio70.049 (0.130)−0.409 (<0.001)
Mean temperature of wettest quarterbio8−0.290 (<0.001)0.009 (0.892)
Mean temperature of driest quarterbio9−0.107 (0.010)0.308 (0.001)
Mean temperature of warmest quarter bio10−0.290 (<0.001)0.009 (0.892)
Mean temperature of coldest quarter bio11−0.150 (0.002)0.392 (<0.001)
Annual precipitationbio120.305 (0.001)0.076 (0.780)
Precipitation of wettest month bio130.314 (0.010)0.077 (0.433)
Precipitation of driest month bio140.228 (0.847)0.218 (0.036)
Precipitation seasonality (CV)bio150.217 (0.200)−0.097 (0.429)
Precipitation of wettest quarterbio160.316 (0.004)0.052 (0.247)
Precipitation of driest quarterbio170.222 (0.440)0.186 (0.164)
Precipitation of warmest quarterbio180.316 (0.004)0.052 (0.247)
Precipitation of coldest quarterbio190.163 (0.389)0.175 (0.204)
Eigenvalue 9.334.84
Variance explained 49.1125.48

