Article

Different Molecular Characterization of Soil Particulate Fractions under N Deposition in a Subtropical Forest

1
Key Laboratory of Ecosystem Network Observation and Modeling, Institute of Geographic Sciences and Natural Resources Research, Chinese Academy of Sciences, Beijing 100101, China
2
College of Resources and Environment, University of Chinese Academy of Sciences, Beijing 100049, China
3
The Zhongke-Ji’an Institute for Eco-Environmental Sciences, Ji’an 343000, China
4
The State Key Laboratory of Remote Sensing Science, Institute of Remote Sensing and Digital Earth, Chinese Academy of Sciences, Beijing 100101, China
*
Authors to whom correspondence should be addressed.
Forests 2019, 10(10), 914; https://doi.org/10.3390/f10100914
Submission received: 17 September 2019 / Revised: 12 October 2019 / Accepted: 15 October 2019 / Published: 17 October 2019
(This article belongs to the Special Issue Organic Matter Production and Decomposition in Forest Soils)

Abstract

:
Key Findings: Combining physical fractionation and pyrolysis–gas chromatography/mass spectrometry (py-GC/MS) technique can help better understand the dynamics of soil organic matter (SOM). Background and Objectives: SOM plays a critical role in the global carbon (C) cycle. However, its complexity remains a challenge in characterizing chemical molecular composition within SOM and under nitrogen (N) deposition. Materials and Methods: Three particulate organic matter (POM) fractions within SOM and under N treatments were studied from perspectives of distributions, C contents and chemical signatures in a subtropical forest. N addition experiment was conducted with two inorganic N forms (NH4Cl and NaNO3) applied at three rates of 0, 40, 120 kg N ha−1 yr−1. Three particle-size fractions (>250 μm, 53–250 μm and <53 μm) were separated by a wet-sieving method. Py-GC/MS technique was used to differentiate between chemical composition. Results: A progressive proportion transfer of mineral-associated organic matter (MAOM) to fine POM under N treatment was found. Only C content in fine POM was sensitive to N addition. Principal component analyses (PCA) showed that the coarse POM had the largest plant-derived markers (lignins, phenols, long-chain n-alkanes, and n-alkenes). Short-chain n-alkanes and n-alkenes, benzofurans, aromatics and polycyclic aromatic hydrocarbons mainly from black carbon prevailed in the fine POM. N compounds and polysaccharides from microbial products dominated in the MAOM. Factor analysis revealed that the degradation extent of three fractions was largely distinct. The difference in chemical structure among three particulate fractions within SOM was larger than treatments between control and N addition. In terms of N treatment impact, the MAOM fraction had fewer benzofurans compounds and was enriched in polysaccharides, indicating comparatively weaker mineralization and stronger stabilization of these substances. Conclusions: Our findings highlight the importance of chemical structure in SOM pools and help to understand the influence of N deposition on SOM transformation.

1. Introduction

As the largest carbon (C) pool in terrestrial ecosystems [1], soil organic matter (SOM) stores over three times the amount of C in either the atmosphere or biosphere [2], and functions as a net sink or source for atmosphere CO2 in various ecosystems [3]. However, SOM comprises a vast range of different functional pools with varying stabilization mechanisms and turnover rates in soils [4]. Since the accessibility of SOM to organisms is the first requisite for decomposition, physical fractionation method is based on the association of soil particle sizes and their spatial distribution [5]. Different soil particle sizes exhibit distinct chemical and biological properties [6,7], differing in enzyme kinetics [8], organic matter concentration and chemistry [9], which may serve different functions in SOM dynamics. Generally, the turnover rates normally decelerate as the particle size decreases [10,11], as a result of a combination of SOM stabilization mechanisms, including the change in chemical composition, increase in spatial inaccessibility and adsorption with mineral surfaces [12,13]. However, Lützow et al. [4] concluded that smaller particles with a higher allocation of soil organic carbon (SOC) may not conform to longer turnover time. Nevertheless, it remains to be elucidated which manner (i.e., ‘truly’ stabilized, or potentially still ‘labile’ but just not accessible) could account for mineral-associated C with a longer mean turnover time [14]. Therefore, there is increasing emphasis on understanding the nature and contributions of various soil pools to the biogeochemical carbon cycling in the context of future global climate change [15].
SOM is mainly composed of all organic materials derived from vegetal, microbial and animal biomass with high complexity and heterogeneity [16]. Regardless of the environmental importance of SOM, its chemical structure and dynamics, which play a fundamental role in SOM stability, remain largely unknown [17,18]. Thus numerous studies with a suite of specific markers and compound-specific isotope analysis were performed to differentiate and evaluate functional SOM fractions [4,15,19]. In consequence, various organic matter pools have been identified by sensitive pyrolysis products, indicative of plant and microbial contributions, with different resistance to degradation and different behaviors for decay [20]. For instance, coarse and fine fractions (>53 μm) of SOM typically contain more plant-derived materials and have higher C:N ratio than the mineral-associated fraction, which is dominated by an admixture of microbial-processed products [4,16]. However, only a partial picture of SOM molecular composition has been yielded and there still exist knowledge gaps on the identification and quantification of some other products such as N-containing compounds, tannins and benzofurans [19,21]. Compared with other analytical techniques, pyrolysis–gas chromatography/mass spectrometry (py-GC/MS) is more efficient and can provide a larger view of SOM chemical structural information [19,22]. In addition, py-GC/MS also facilitates a better understanding of the extent of the decomposition/preservation in SOM pools and a detailed comparison of the SOM produced under different managements [23,24,25]. Furthermore, advantages of this pyrolysis analysis over others include good repeatability and a relatively small amount of soil samples required [26,27,28]. Therefore, more information is needed on the precise characterization of SOM to determine its fate in mechanistic processes involving the rates of decomposition, transformation, and genesis of individual compounds in various fractions.
Further understanding of the chemical structure and dynamics of SOM should be in relation to key environmental controls like nitrogen (N) deposition mitigation through C sequestration [26,29]. Anthropogenic activities have doubled the rates of reactive N inputs on the global scale in the past century and substantially affected C and N cycles in most terrestrial ecosystems [30,31]. However, there remains large uncertainty in the response of soil organic C dynamic balance of gains and losses to elevated N deposition [32,33]. Previous studies demonstrated N inputs altered the quantity and composition of SOM and interfered in the dynamics of SOM decomposition, both of these consequences having influenced soil C storage [34,35]. Meanwhile, considerable progress has been made in clarifying the response of bulk soil organic C to atmospheric N deposition [36,37,38,39]. However, the responses of various SOC fractions and their chemical composition to exogenous N input varied among different ecosystem types, and N application levels, forms, and duration [40,41]. The biogeochemical mechanism underlying these responses are not well understood [42]. Furthermore, the effect of elevated N deposition on SOM composition using py–GC/MS at the molecular level in subtropical forests is yet understudied.
Here, we conducted a N addition experiment in a subtropical plantation forest to investigate both quality and quantity changes of soil particulate fractions. The aims of this study are (1) to compare the variability of C contents within SOM and under N treatments, (2) to characterize the chemical composition of SOM particulate fractions using py-GC/MS to provide insights into their origins and decomposition extents, (3) to investigate which compounds of particulate fractions were affected by N addition, and (4) to assess the relationships between SOC variation and molecular information.

2. Materials and Methods

2.1. Study Site

This study was carried out at the Qianyanzhou Ecological Experimental Station of Chinese Academy of Sciences, located in Jiangxi Province, South China (26°44′48″ N, 115°04′13″ E, 100 m a.s.l.). This region is classified as a typical subtropical, humid monsoon climate with mean annual temperature of 17.9 °C and mean annual precipitation of 1475 mm, most of which occurs between March and June [43]. The accumulated temperature above 0 °C is 6523 °C with 323 frost-free days annually. The vegetation cover at this study site is a subtropical evergreen broad-leaved forest. The dominated species in the canopy layer are masson pine (Pinus massoniana Lamb.), slash pine (Pinus elliottii Engelm.) and Chinese fir (Cunninghamia lanceolate (Lamb.) Hook.). The understory layer is dominated by Dicranopteris dichotoma (Thunb) Bernh, Woodwardia japonica (L.f.) Sm, and Loropetalum chinese (R.Br.) Oliv [43]. The soil type is red soil and categorized as Cambisols (IUSS classification) with the following characteristics: soil organic matter 20.44 g kg−1, total N 1.10 g kg−1, total phosphorus 1.12 g kg−1, pH 4.26, and soil bulk density 1.54 g cm−3 [43].

2.2. Experimental Design and Soil Sampling

The N fertilization experiment was established during May 2012 in the subtropical slash pine plantation forest. Fifteen 20-m × 20-m plots were set up in a complete randomized block design and separated at least 10 m buffer zones around each plot. Taking into account the local atmospheric N deposition background (32.62 kg N ha−1 yr−1) [44], two inorganic N forms (NH4Cl and NaNO3) were added at three rates of N addition (0, 40, 120 kg N ha−1 yr−1). Control, low-NH4Cl, high-NH4Cl, low-NaNO3 and high-NaNO3 were hereafter referred to as CK, A40, A120, N40, and N120, respectively. The fertilization rates were designed to simulate the predicted N inputs in the future. Each treatment had three replicates. 509.6 g and 1528.8 g of NH4Cl and 809.5 g and 2428.5 g of NaNO3 fertilizers were weighed and dissolved in 40 L water and then were uniformly sprayed into each low and high N plot below the canopy using a backpack sprayer, respectively. Control plots received the same amount of water. The solution was sprayed once a month in 12 equal applications over the entire year. The N addition experiment was conducted over 4 years and continued throughout the study period.
Soils were randomly sampled in August 2016 using an auger of 2.5 cm in diameter. Five soil cores at 0–20 cm depth were randomly collected and combined to one sample for each plot. Each composite sample was placed in a plastic bag and placed into an incubator. After being taken back to the laboratory, soil samples were sieved through a 2 mm mesh and divided into two parts: one part of fresh soil used for general soil properties, and the other part of air-dried soil for physical fractionation and chemical structure analysis.

2.3. Physical Fractionation and C Content Determination

Soils were physically fractionated using the method described by Cambardella and Elliott [45]. Three particulate organic matter (POM) were fractionated, including coarse POM, >250 μm, fine POM, 53–250 μm and mineral-associated organic matter (MAOM), <53 μm. The pretreatment we chose in our study was chemical dispersing with the dispersion agent of sodium hexametaphosphate solution (SHMP) in order to potentially determine the types and amounts of SOM that bind particles into aggregates. It may be valuable in understanding the function of SOM [46]. In brief, a 50 g air-dried soil sample of bulk soil was dispersed using 100 mL 5 g L−1 SHMP and shaken for 15 h on a reciprocating oscillator. Then, the suspension was filtered through a separated container with a stream of water. Coarse POM and fine POM fractions were collected from the sieves after thoroughly rinsing. The MAOM fraction was recovered by evaporation. All materials were dried overnight at 60 °C and weighed for percentages calculation. The collected fractions were ground and stored for organic C concentration determination and py-GC/MS analysis. The C concentrations of three fractions were determined with a CN auto-analyzer (vario EL III, Elementa, Germany).

2.4. Pyrolysis-GC/MS

Before the pytolysis-GC/MC analysis, the MAOM fractions were subject to mineral removal. The MAOM fraction was shaken for 24 h under N2 with 750 mL of 0.1 M NaOH. The suspension was centrifuged for 1 h at 4000× g and dried. Approximately 4 mg of soil sample was loaded in a multi-shot pyrolyzer PY-3030D (610 °C) directly attached to a GC (7890B)/MS (7000B) Agilent system. The pyrolysis products were separated by an Ultra Alloy capillary column (length × thickness × diameter = 30 m × 0.25 mm × 0.25 μm) with helium at a constant flow of 1.2 mL min−1 as the carrier gas. The temperature program of the GC oven was set with an initial temperature of 40 °C for 1 min, heated to 100 °C at 2 °C min−1, and then ramped to a final temperature of 290 °C at 4 °C min−1. The final temperature of 290 °C was maintained for 10 min. The compounds were identified based on the mass spectrometer (mass range m/z 10–650, ionization energy 70 eV), GC retention times and comparison with the NIST MS search 2.0 library.
For each sample, 92 pyrolysis products were identified and quantified using the intensity of two characteristic fragment ions (Table 1). The peak integrations of selected 92 products on total ion current were set as 100% and relative abundances were calculated with respect to this sum. According to the probable origin and chemical similarity, the pyrolysis products were classified into the following groups: n-alkanes, n-alkenes, aromatics, lignins, polyaromatics, N-containing compounds, benzofurans, phenols and polysaccharides (Table 1).

2.5. Statistical Analysis

One-way analysis of variance (ANOVA) was used to investigate the effect of nitrogen treatment on percentages, C contents, and chemical groups of POM fractions. If ANOVAs were significant (p < 0.05), the means were compared with the Duncan test. Principal components analysis (PCA) was performed to provide a general indication with nine chemical groups across three fractions using CANOCO software for Windows 5.0 (Biometrics-Plant Research International Wageningen, The Netherlands). To investigate detailed differentiation among compounds, factor analysis was applied to all 92 quantified pyrolysis products using SPSS software 16.0 (SPSS Inc., Chicago, IL, USA). The relationships between C contents and chemical compositions of POM fractions were evaluated by linear regression analysis. Figures were created using the SigmaPlot 12.5 for Windows.

3. Results and Discussions

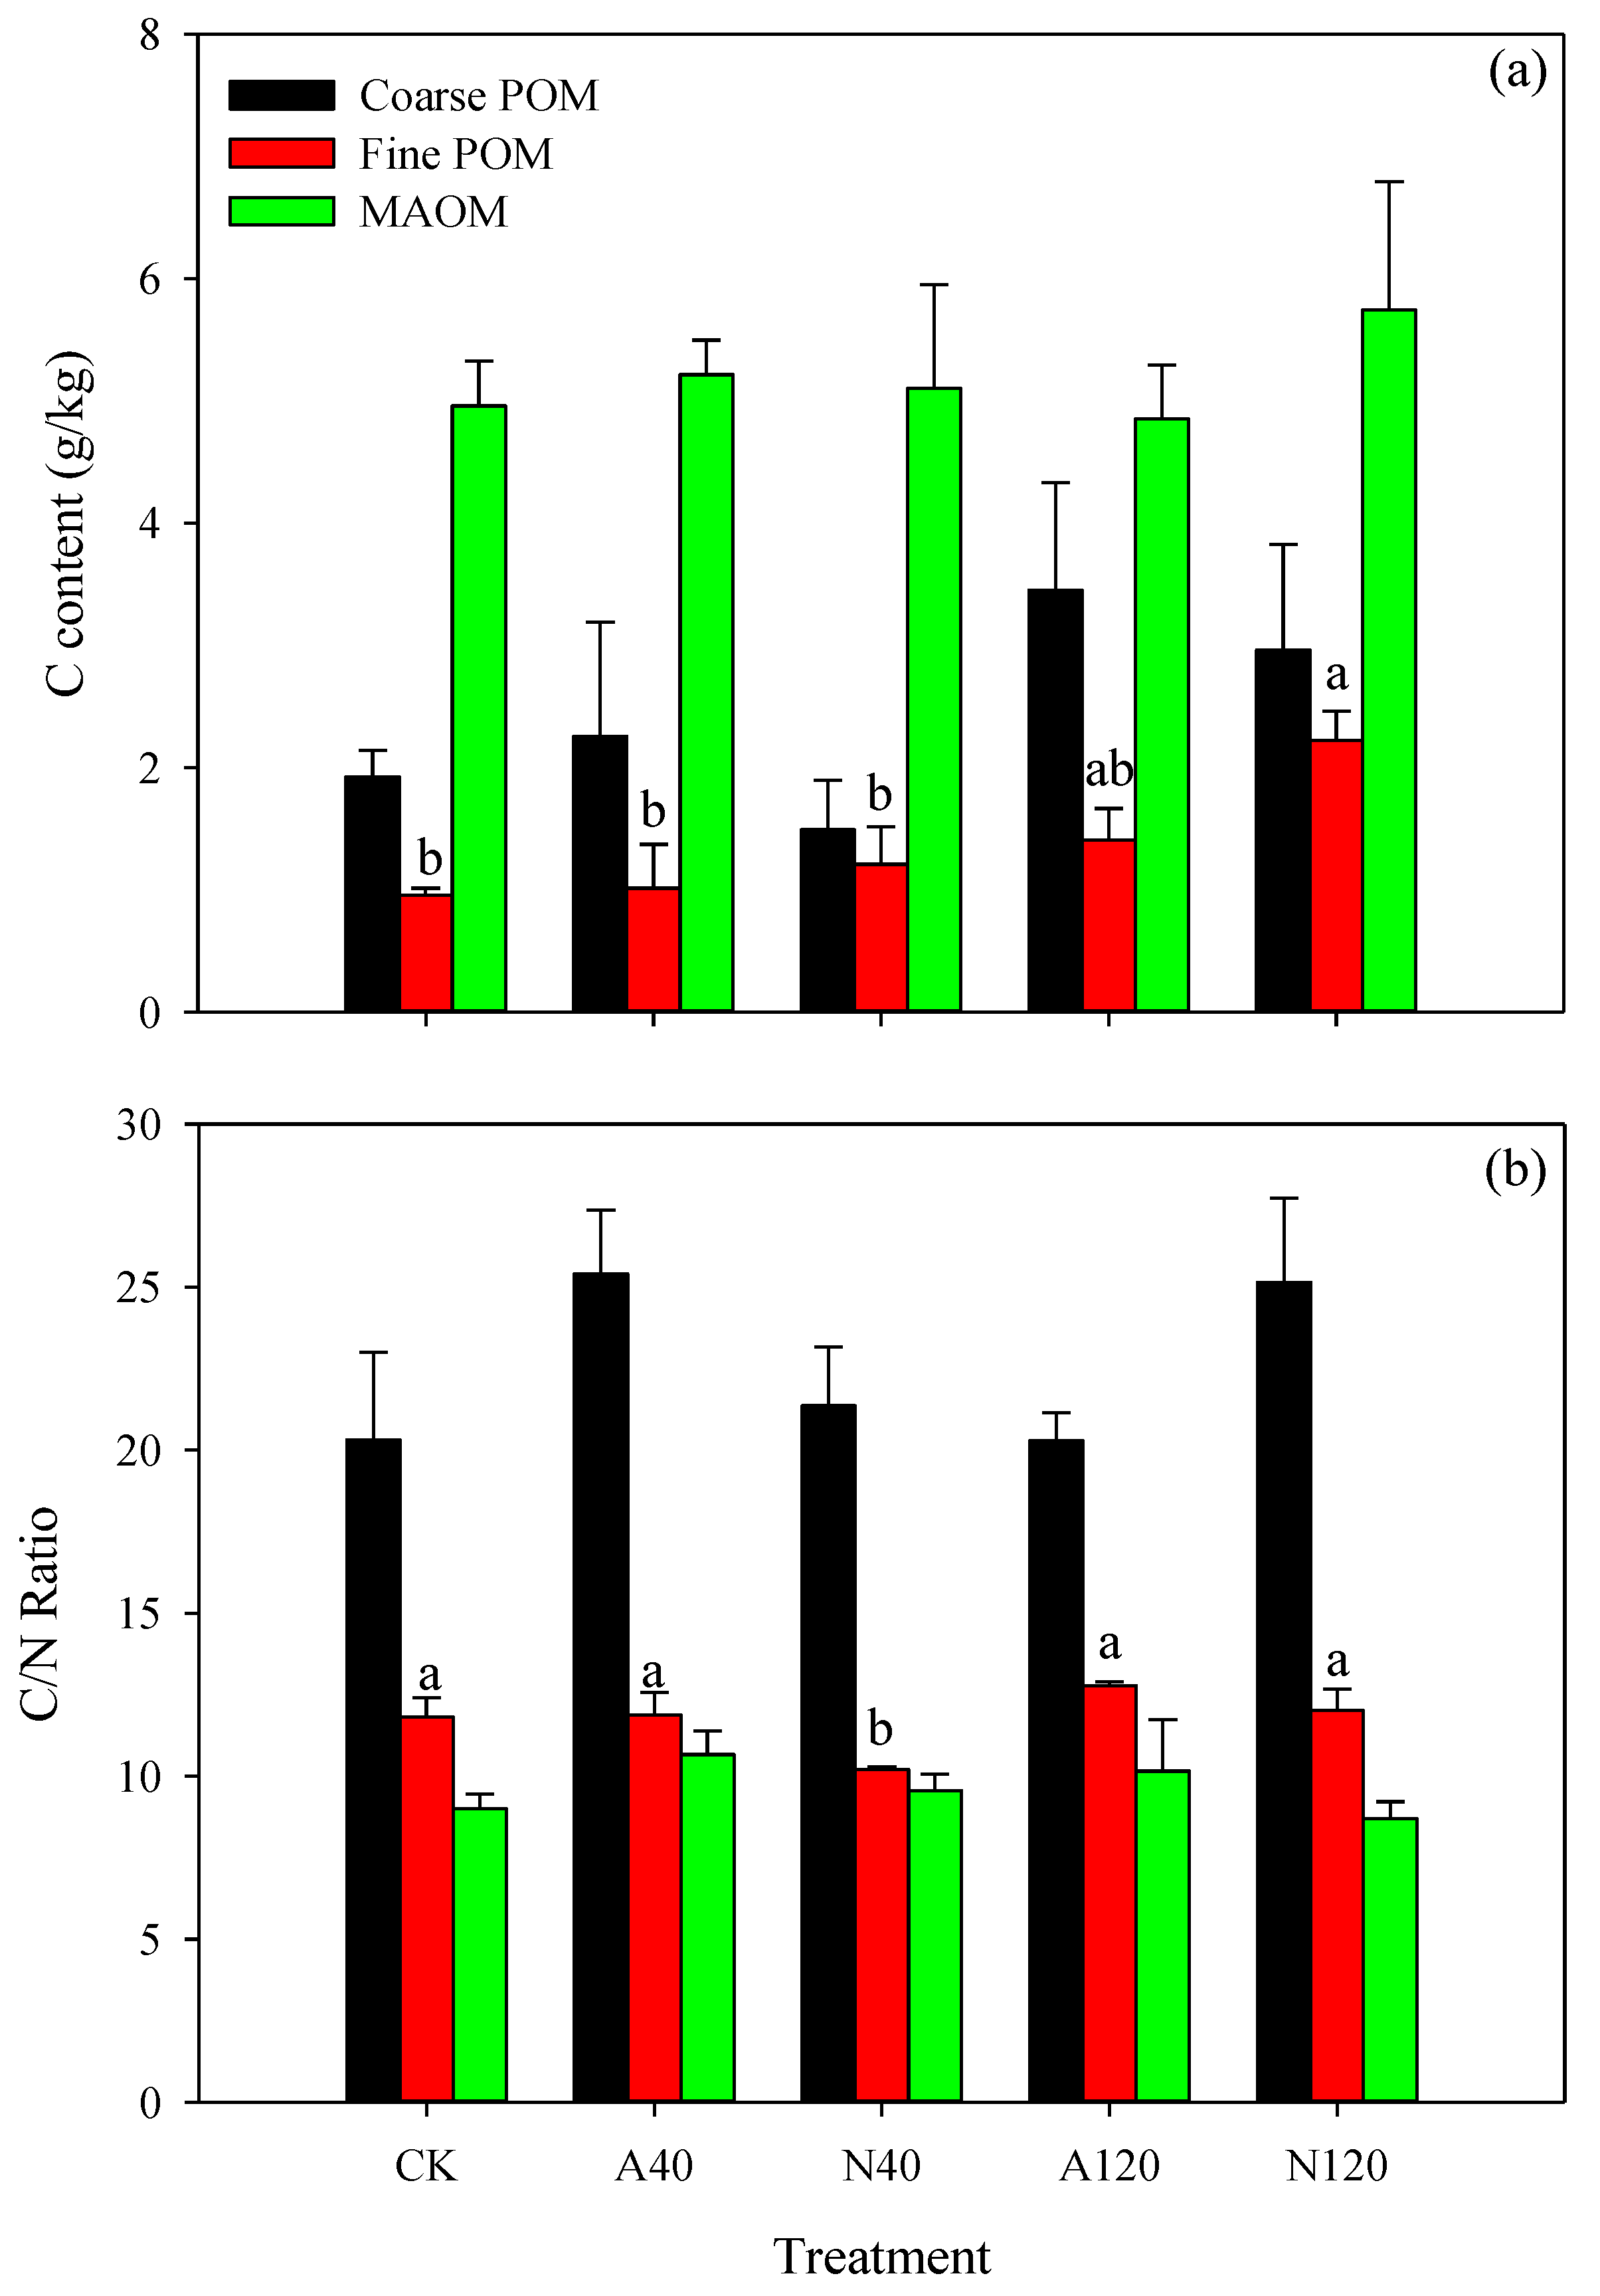
3.1. Percentages and C Contents of Particulate Fractions

In the control plots, the percentages of different particulate fractions were: coarse POM, 8.7%, fine POM, 16.7% and MAOM, 74.6% (Figure 1). The allocation of three fractions was consistent with Stemmer et al. [47], who also found a similar distribution using chemical dispersion in the soil type of Cambisol, the same as the soil type in our study site. In comparison, Grandy et al. [48] reported a totally different pattern that the proportion decreased with the decreasing size using shaking and centrifugation methods in Kalkaska sand. Therefore, the distribution of particle sizes distinctly depends on soil physical or chemical pretreatment, and soil type [47].
Nitrogen addition resulted in a significant increase in the percentage of fine POM and a decline in MAOM proportion compared with control plots (Figure 1). As we discuss below, the added N was firstly transformed to dissolved organic N and subsequently adsorbed to silt and clay particles [49]. However, stable MAOM pools may be disproportionately comprised of microbial-derived N compounds revealed by chemical characterization of SOM [50]. Moreover, increased fresh OM inputs induced by N addition with a higher C:N ratio and hydrophobicity would supplant outer compounds bonding weakly to mineral site [51]. This partly explained the proportion movement from MAOM into fine POM under N addition, which was consistent with several other N application experiments studies [52,53].
Figure 2a showed the carbon distribution of three particulate fractions. The highest C content was found in the MAOM compared with fine POM and coarse POM. This result was consistent with other studies [14,54], which reported that over 80% of organic carbon existed in silt and clay fraction. This could be explained by the fact that the stabilization of organic matter was controlled mainly by the formation of organo-mineral associations through ligand exchange [54], polyvalent cation bridges and hydrophobic interactions [13]. Lower C contents in coarse and fine fractions could be attributed to the poor protection against microbial attacking [4]. The result also showed that the C:N ratio declined with the decrease of pore sizes (Figure 2b). Coarse POM has a higher C:N ratio, which is closer to that of the original plant material from which it is derived [49]. In contrast, C:N ratio in smaller fractions was a result of microbial material and less-available SOM. These results can also reflect different mineralization and humification statuses of the SOM [47].
In our experiment, nitrogen addition did not affect the C contents of coarse POM and MAOM. The C content of fine POM under the high level of NaNO3 treatment was 1.33 times greater than the control plot (p < 0.05) (Figure 2). This is in accordance with previous research on the effect of N deposition on C contents of SOM fractions [41,55]. Though coarse POM and fine POM were not occluded within micro-aggregates, mainly derived from new plant input (litter and root detritus) [56], exogenous N input would be preferably adsorbed in fine POM compared to coarse POM fraction. Because fine POM has a higher ratio of surface area to volume and further provides more chances for microbial cells to attach [57]. Smaller pore sizes also protect microorganisms against attacking by protozoa, in consequence, keeping a longer residence time [58]. Moreover, increasing N deposition could directly accumulate NH4+ concentration and further improve soil electrical conductivity (EC), which would lead to a greater ionic strength [57]. This result would possibly decrease osmotic potential in finer textured soils, and therefore decelerate decomposition of fine POM by microbial communities [59].

3.2. General Distribution and Origin of Pyrolysis Products in the Soil Fractions

A total of 92 identified pyrolytic compounds are presented in Table 1. They were classified into nine groups according to their source and chemical characterization [18], representing a mixture of compounds from plant biopolymers (n-alkane, n-alkene, phenol and lignin) [20,60], microbial material (N compounds and polysaccharides) [19], and black carbon (aromatics, benzofurans and PAH) [61]. The PCA analysis revealed a pronounced difference in molecular composition for each fraction by the first two principal components, which explained 89.8% of the total variation (Figure 3). Along the PC1, the coarse POM fraction was clearly dominated by lignins, polyaromatics, and phenols. The chemical composition in fine POM was mainly associated with n-alkanes, n-alkenes, aromatics, and benzofurans. N compounds and polysaccharides were closely clustered in MAOM fraction. More details are shown as follows:
n-alkanes and alkenes: 48 linear aliphatic compounds containing n-alkanes (A1-A23) and n-alkenes (E1-E25) were identified (Table 1). Different chain lengths of n-alkanes and n-alkenes have various origins [24,62]. For example, short-chain aliphatics (n < 20) may originate from microbial aliphatic cell walls resistant to biodegradation or from chain-length shortening by microbial degradation [63]. The existence of long-chain n-alkanes and n-alkenes is usually ascribed to plant input, such as biopolymers (cutin, suberin) [20]. A larger contribution of aliphatic components was detected in the fine POM compared with coarse POM and MAOM (Table 2). This is indicative of differential decay and preservation under natural circumstances without the effect of N treatment [16]. However, it is still necessary to differentiate between short-chain and long-chain n-alkanes and n-alkenes in three fractions, which will be discussed in the following factor analysis.
Aromatics: Five pyrolysis products in this group were quantified, including benzene (Ar1), Indane (Ar2), Indene (Ar3), Toluene (Ar4) and Methylindene (Ar5). Benzene and toluene made up the greatest proportion (45%) of the pyrolysates as reported by our previous study [64]. Aromatic compounds were largely attributed to proteins [65] or incomplete combustion [66]. There were significantly more aromatics in the fine POM and MAOM than coarse POM, indicating intense decomposition in these two fractions (<250 μm) of SOM [15,20].
Polyaromatics: Polyaromatics comprised about 14 quantified pyrolysis products. The presence of four and five-ring polyaromatics (PA11, PA12, PA13, PA14; Table 1) was unequivocal evidence for burnt material [61]. Retene (PA13) is a breakdown product of terpenes from coniferous trees [67]. Polyaromatics constituted up to 17% in particulate fractions, and the relative abundances of polyaromatics were higher in the coarse POM and fine POM than MAOM (Table 2). Similarly, SOM can be separated into free light fraction (FLF), occluded light fraction (OLF) and extracts (EX) by density fractionation. The distribution of polyaromatics in three particulate fractions was consistent with the finding that a larger number of polyaromatics existed in OLF and FLF than EX [16]. The higher contribution of polyaromatics in particulate fractions (>53 μm) could be attributed to the selective decomposition of charred material [18]. Moreover, regression analysis showed a significant negative correlation between C content and polyaromatics in POM fractions (Figure 4a, R2 = 0.46, p < 0.001). Recent studies also reported that a higher contribution of polyaromatics was associated with a relatively lower SOC content, because black carbon was subject to active biodegradation in tropical climates [15,18,62]. This is consistent with long-term wildfire events, resulting in declines of soil C stock [68].
Lignins: 10 quantified pyrolysis products in this group were classified into p-hydroxyphenyl, guaiacyl lignins, and syringyl lignins, which were originated from the recently deposited plant C and can be degraded rapidly [69]. In this study site, the higher contribution of guaiacyl-type lignins reflected the coniferous forest-dominated vegetation type [24]. As expected, the relative abundance of lignin-derived compounds was decreased with the decrease of particle size, particularly scarce in the fine POM and MAOM fractions (Table 2). Similar studies also reported that the products from lignins were accumulated in coarse fraction while nearly absent in smaller-sized fractions (<53 μm) [14,50]. On the basis of the highest xylanase efficiency in the coarse fractions, this enzyme preferred to be absorbed to the less mineralized POM in the coarser fractions [47]. Taken together, these results demonstrated that lignins were not a persistent compound and may make a minor contribution to the relative recalcitrant pools [3].
Phenols: Phenol compounds are dominated by phenol (Ph1), C1-phenol (Ph2) and C2-phenol (Table 1). Phenols can usually be derived from proteins, lignins, and celluloses [70]. The coarse POM fraction has the largest percentages (up to 17%) of phenols. In contrast, there were only 2.3% and 1.9% of phenols in the fine POM and MAOM fractions under the control plots, respectively (Table 2). It can be inferred that the methoxy phenols in coarse POM fraction were indicative of fresh lignins [60].
N-containing compounds: The pyrolysis products of pyridines (N1), pyrroles (N2), benzonitrile (N4), and indole (N6) are the most common N-containing compounds in this study. In general, N-containing compounds are pyrolysis products of proteins, polypeptide, and amino acids [71]. N-containing compounds accounted for 15.4% and 21.9% of the total quantified products in fine POM and MAOM, respectively. The contribution of this group in coarse POM was much lower (7.2%, Table 2). A large contribution from N-containing compounds is often characterized by a microbial source [16,72]. In addition, several processes for physical protection, such as adsorption and aggregation, may be involved in the stabilization of amino acids or proteins [3]. Therefore, the surface adsorption would become stronger if more N-containing compounds accumulated in small pore size pools. Meanwhile, there was a significant positive correlation between N-containing products and SOC content in our study (Figure 4b, R2 = 0.12, p = 0.02). Previous studies using molecular isotopic analysis showed that N-containing precursors such as proteins, amino acid, and chitin had relatively high residence time and could be preserved during soil decomposition and humification processes [73].
Benzofurans: Three compounds were quantified in the group of benzofurans, including benzofuran (Bf1), C1 benzofuran (Bf2) and dibenzofurans (Bf3) (Table 1). Notably, three of them could be indicative of a black carbon source [74]. Meanwhile, benzofurans were associated with low condensation structures, which was attributable to incompletely charred lignocellulose material [23]. A larger relative contribution from black carbon in the fine POM can be explained by the limitation of water, nutrients and oxygen within aggregates [56]. Moreover, a higher contribution of benzofurans was significantly negatively correlated with SOC content (Figure 4c, R2 = 0.16, p = 0.006). This suggested the promotion of selective decomposition between easily degradable compounds and more recalcitrant ones such as black carbon-derived materials [74].
Polysaccharides: The pyrolysis products of polysaccharides comprised acetic acid (Ps1), 2-Furaldehyde (Ps2) and 5-Methyl-2-furaldehyde (Ps3). Polysaccharides can be derived from either vegetal or microbial organic matter [16]. Compared with the fine POM fraction, the carbohydrates-derived pyrolysis products in the coarse POM and MAOM fractions had higher abundances, accounting for 11–16% of the total peak area (Table 2). Previous research also found that carbohydrates products were abundant in the silt and clay fractions (<63 μm) [14], which was supported by the fact that microbial origins were easily bound to the mineral surface [50]. Of the quantified compounds, 2-Furaldehyde (Ps2) and 5-Methyl-2-furaldehyde (Ps3) were mainly originated from microbial biomass with slower turnover rates [24,73]. These compounds contributed to more humified soil C pools and can be recycled again by the microbes [3]. Further, this was supported by our regression analysis in which a positive relationship between C content and polysaccharides was observed (Figure 4d, R2 = 0.26, p < 0.001).

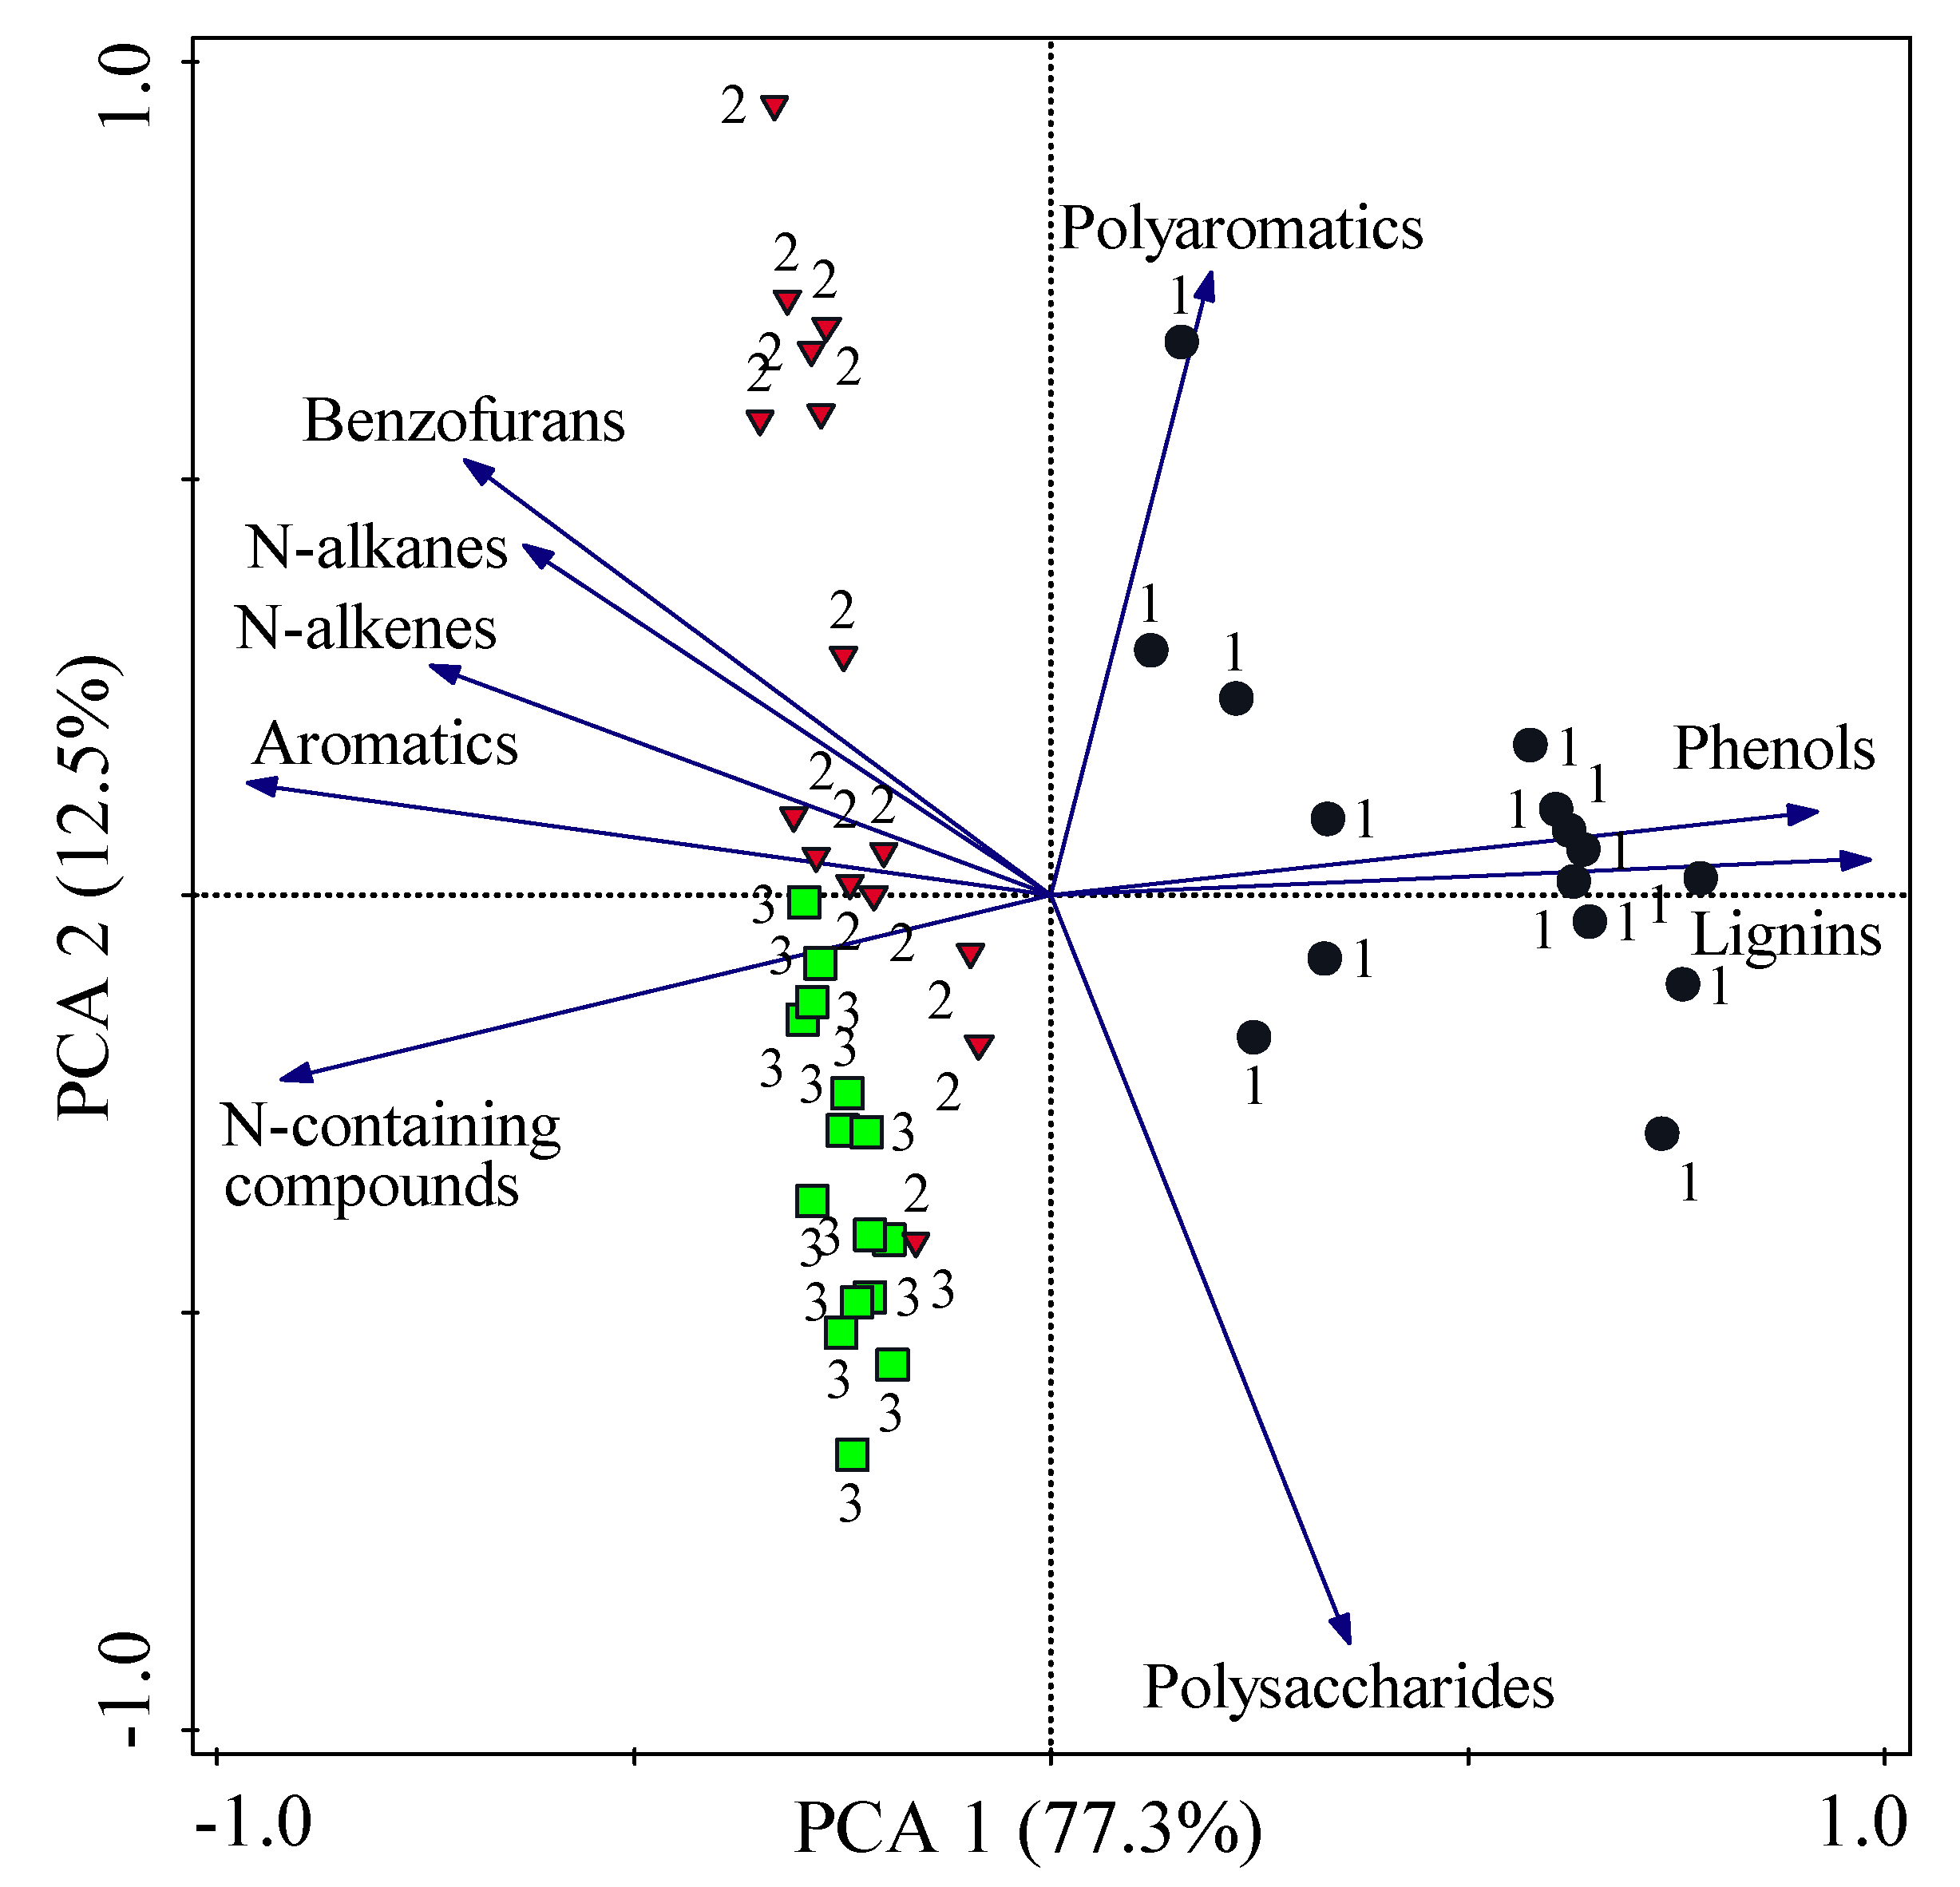
3.3. Factor Analysis Applied on Molecular Composition of Soil Particulate Fractions

All quantified compounds were plotted in Figure 5 based on their differences. And the extracted factor was expressed as factor loading (Figure 5a), while samples values for each factor were expressed as factor scores (Figure 5b) [16]. The decomposition degree, vegetal and microbial contributions in three fractions can be interpreted in factor loading diagram. Meanwhile, samples projections in factor scores could be comprehended through interpretation of factor loading in the same space [18,24,62]. In the total dataset, the first two factors were selected and altogether explained 60.7% of all variations. Three fractions were clearly separated in the score diagram (Figure 5b).
Along with the factor 1 of the loading diagram, a series of n-alkenes and n-alkanes displayed a progressive reduction in chain length from right to left (Figure 5a). All lignins (LgH, LgG, and LgS), phenols, polysaccharides, and long-chain n-alkanes/n-alkenes showed high positive loadings, while N compounds, short-chain n-alkanes/n-alkenes and low molecular weight aromatics were plotted to the left (negative factor 1) (Figure 5a). Therefore, factor 1 can be interpreted to reflect decomposition. Specifically, positive values represented relative fresh plant litter input [75] while negative values denoted more advanced degradation state of the plant debris [24,63].
Positive scores on factor 2 were largely determined by polyaromatics, aromatics, benzofurans, and n-alkanes and n-alkenes. Negative scores on factor 2 were related to nitrogen compounds, polysaccharides, and lignins. The lower left quadrant represented a microbial source and relatively degraded soil organic matter, coupled with a lower C:N ratio due to a higher proportion of N-containing compounds in this quadrant. In the upper left quadrant, the combination of short-chain aliphatic from longer-chain breakdown and benzofurans from charred material suggested relatively recalcitrant compounds without fresh litter input.
In conclusion, the coarse POM was characterized by abundant lignins and long-chain n-alkenes/n-alkanes (Figure 5a,b), all of which were indicative of higher plant origin [16]. The larger contribution of root litter input led to a much lower residual accumulation of recalcitrant compounds in the coarse POM fraction [15]. Meanwhile, chain-length shortening in the fine POM fraction suggested a stronger decomposition of n-alkanes and n-alkenes than in both coarse POM and MAOM fractions [76]. In addition, we highlight large contributions from N-containing compounds and polysaccharide compounds in MAOM fraction, representing a microbial source and a strong decomposition especially under tropical conditions [18,72].

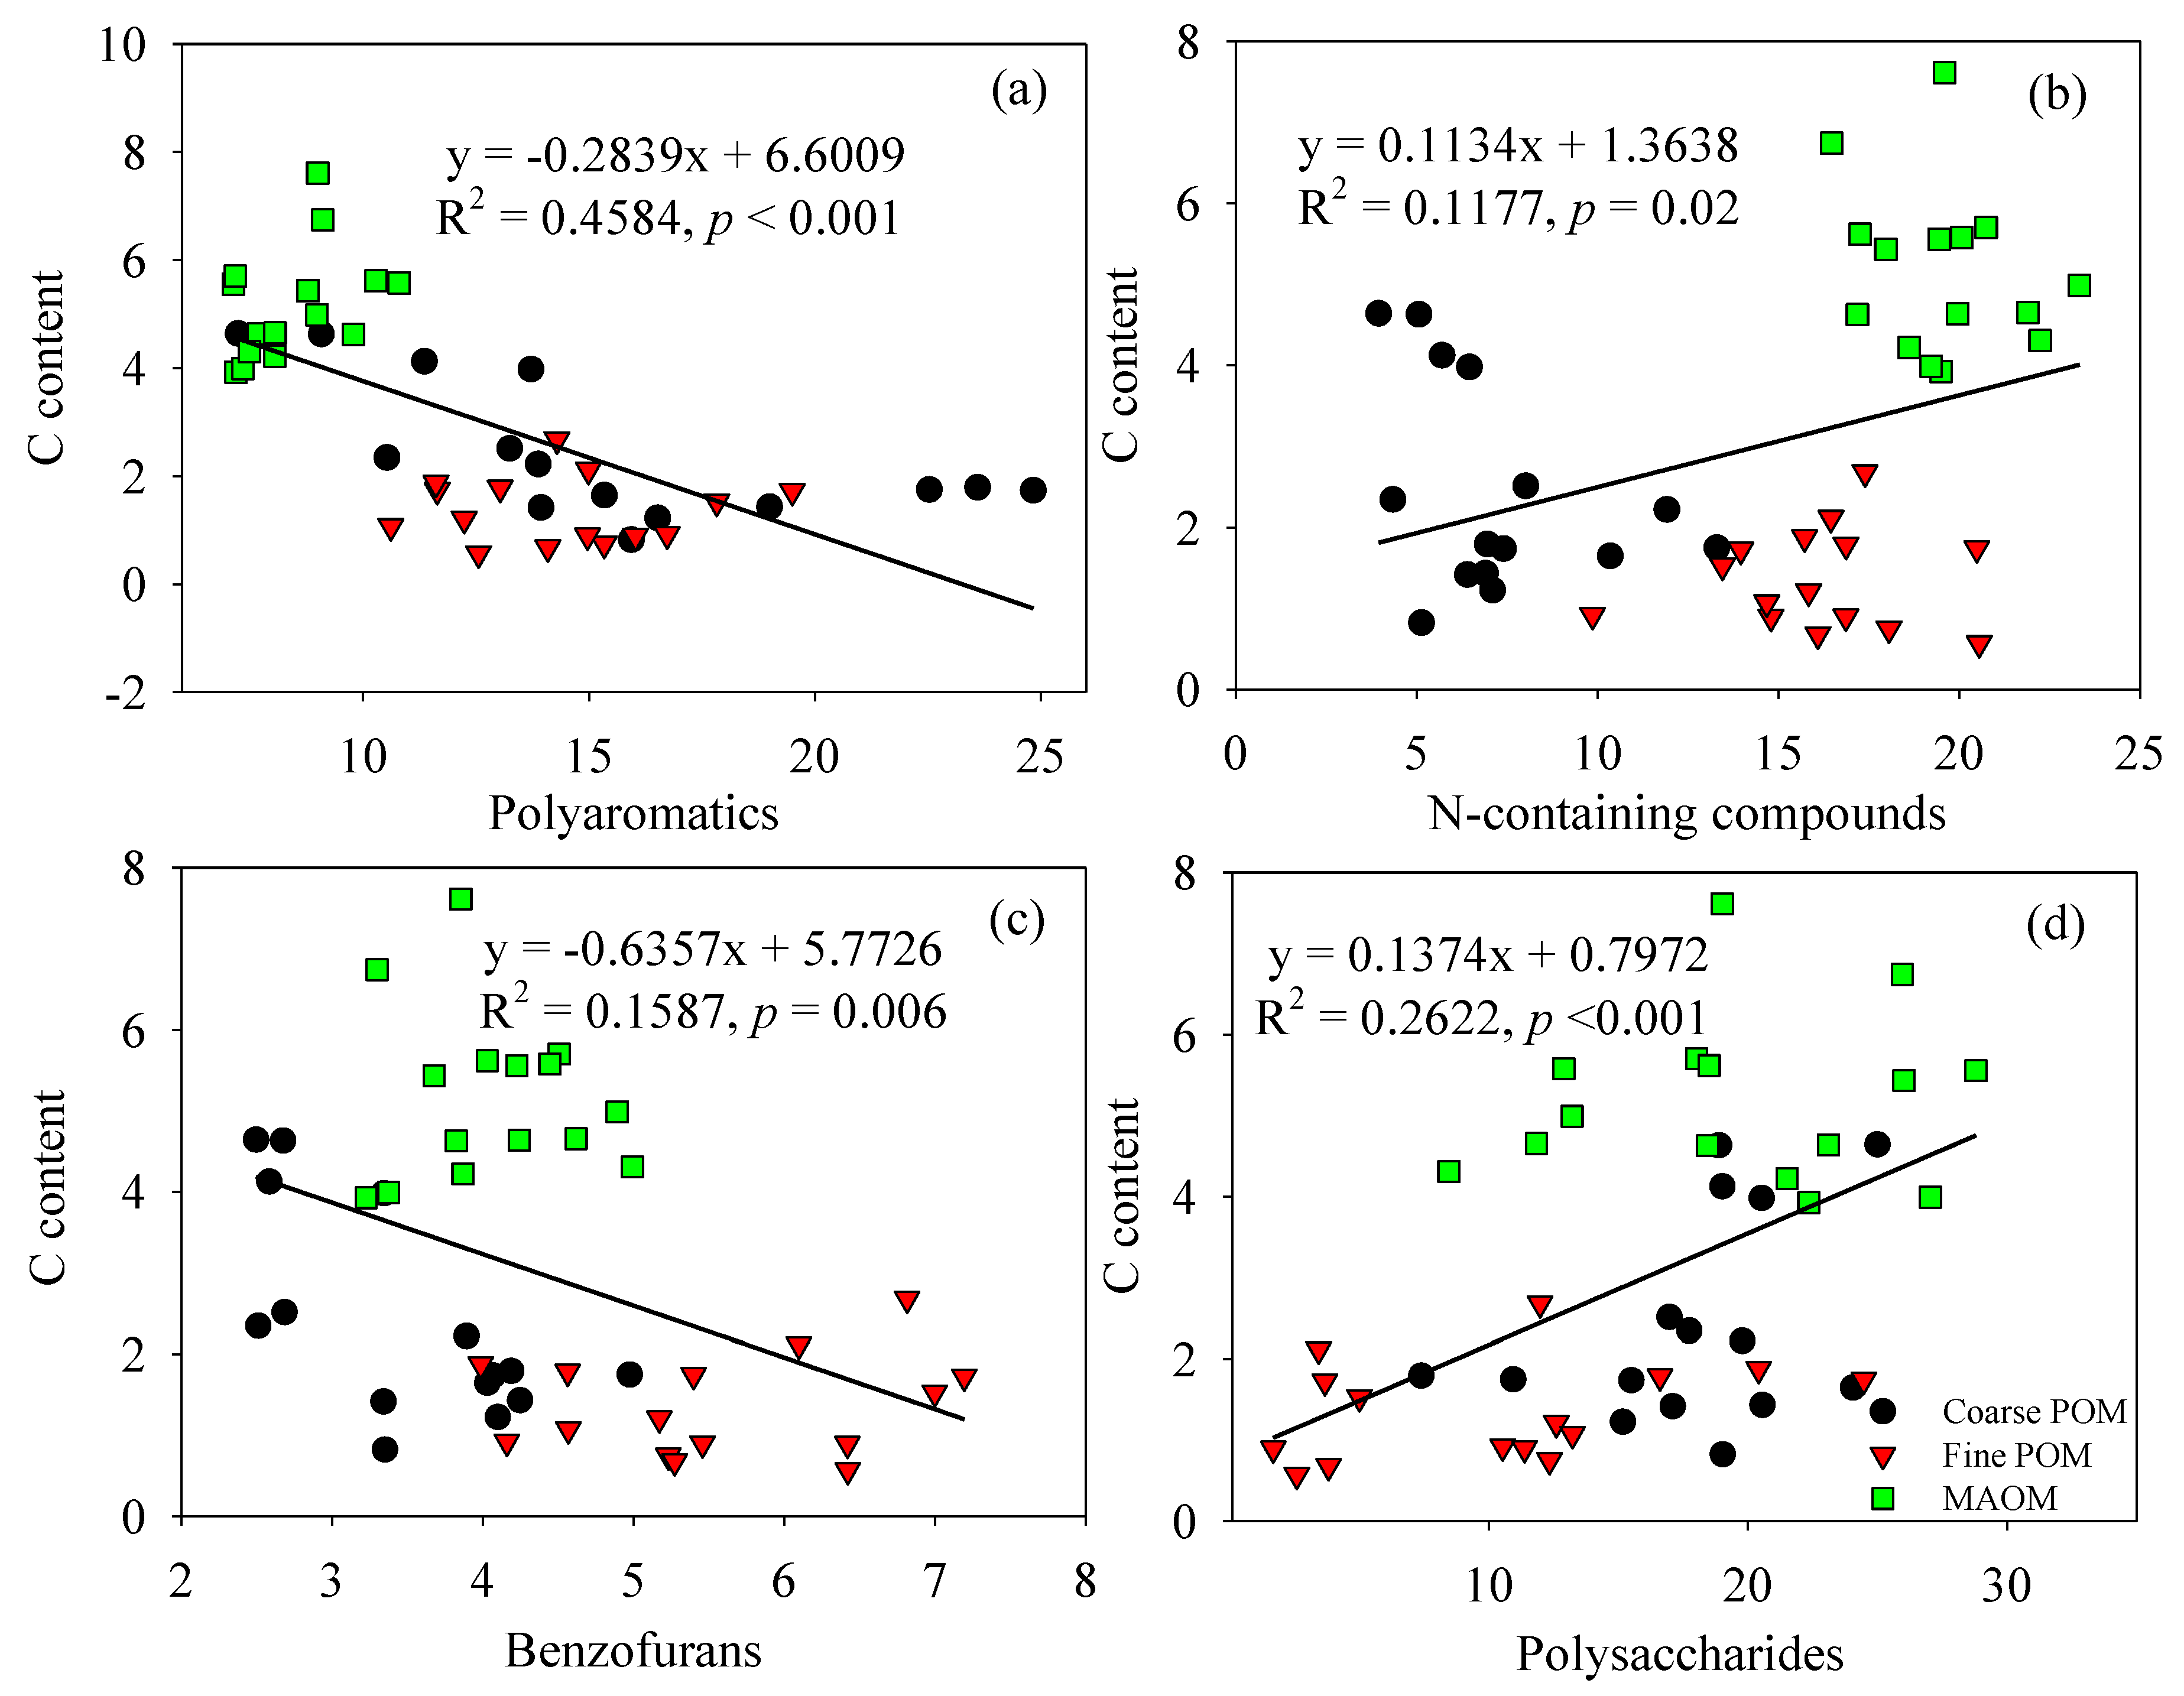
3.4. Effects of N Addition on Chemical Compositions in Three Particulate Fractions

In our study, there were no chemical changes detected in coarse POM and fine POM fractions under N fertilization. However, there were significant differences in the relative abundances of benzofurans and polysaccharides in the MAOM fraction between the control and N treatments. Specifically, under low and high levels of NaNO3 treatment, the relative abundance of benzofurans was 21–24% less than that of control plots (Table 2). Most benzofurans products were related to black carbon material, which can be influenced by fire intensity, fire frequency and the rate at which it is decomposed [77]. Because all treatments were in close vicinity, fire factors were similar [74]. Therefore, a lower abundance of benzofurans could be attributed to a slower decomposition rate of incompletely charred lignocellulose material under NaNO3 treatment.
The relative abundance of polysaccharides of NaNO3 and NH4Cl treatments was 1.86 to 2.13 times greater than control plots (Table 2). On the one hand, previous studies demonstrated the selective stabilization of O-alkyl C such as carbohydrates could defend against microbial attack through interactions with pedogenic oxides under mineral N application [78]. On the other hand, the glycanolytic activity (e.g., α-1-4-glucosidase and β-1-4-glucosidase) associated with degradation of polysaccharide was inhibited under N enrichment in our study site [79], thus leading to an accumulation of carbohydrates. Naafs et al. [80] also pointed out that the polysaccharides was accumulated due to reduced bacterial activity. Furthermore, the increase of polysaccharides suggested that the SOM was mostly microbial under N treatment [18], and these polysaccharides could be recycled again by microbes or physically stabilized or incorporated in soil humic substances [3,81]. Taken together, these results indicated soil inert organic carbon pool would be more slowly decomposed and more stabilized under N addition in the subtropical forest.

4. Conclusions

This study aims to determine the quantity and chemical signatures of SOM particulate fractions, and how they are affected by N inputs. With respect to the general distribution pattern of SOM particulate fractions in the subtropical forest, we found the proportion increased with the decrease of particle size. And N application would tend to increase the percentage of fine POM while decreasing that of MAOM, indicating the acceleration of aggregation process. Compared with other two fractions, C content in fine POM was more sensitive to N fertilizers.
Our results showed that chemical composition of particulate fractions. In details, coarse POM contained less decomposed material such as lignins, phenols, long-chain n-alkanes and n-alkenes. Fine POM contained more black carbon and decomposed materials, including short-chain n-alkanes and n-alkenes, benzofurans, aromatics, and polyaromatics. MAOM contained more N-containing compounds and polysaccharides from microbial material. Therefore, it can be confirmed that particle size fractions are not homogeneous with reference to their chemical composition and should not be equivalent in soil C model pools. Moreover, decreased relative abundance of benzofurans and polysaccharides enrichment in MAOM under N treatment played a major role in stabilization of SOM, which suggested a slower decomposition in the subtropical forest. These findings highlight the importance of understanding individual compound in various soil pools of SOM, and help to predict mechanistic process controls on the SOM turnover under N deposition and to further improve global C and N models.

Author Contributions

Conceptualization, J.G., H.F. and S.C.; methodology, J.G., J.P., S.C. and H.F.; software, J.P.; formal analysis, J.G., J.P., S.C., H.F., M.X., M.L., Y.Y., Z.C. and Y.L.; investigation, H.F.; resources, H.F. and S.C.; data curation, J.G., H.F. and S.C.; writing—original draft preparation, J.G. and J.P.; writing—review and editing, J.G., J.P., S.C. and H.F.; visualization, J.G. and J.P.; supervision, H.F. and S.C.; project administration, H.F.; funding acquisition, H.F. and S.C.

Funding

This research was funded by National Natural Science Foundation of China (Nos. 31770558, 41977041, 41907036), the Second Tibetan Plateau Scientific Expedition and Research Program (STEP) (No. 2019QZKK1003), the National Key R&D Program of China (Nos. 2017YFA0604802, 2017YFA0604804, 2016YFC0500603, 2016YFC0503603), CAS Strategic Priority Program (Nos. XDA200204020, XDA23060401), and the commissioned program of Ji’an city, Jiangxi Provience (JXRC(JA)-2019-CG75).

Acknowledgments

The authors would like to thank Zuodong Wang at the University of Chinese Academy of Sciences for his kind help in data processing.

Conflicts of Interest

The authors declare no conflict of interest.

References

  1. Hedges, J.I.; Eglinton, G.; Hatcher, P.G.; Kirchman, D.L.; Arnosti, C.; Derenne, S.; Evershed, R.P.; Kögel-Knabner, I.; de Leeuw, J.W.; Littke, R. The molecularly-uncharacterized component of nonliving organic matter in natural environments. Org. Geochem. 2000, 31, 945–958. [Google Scholar] [CrossRef]
  2. Schmidt, M.W.; Torn, M.S.; Abiven, S.; Dittmar, T.; Guggenberger, G.; Janssens, I.A.; Kleber, M.; Kögel-Knabner, I.; Lehmann, J.; Manning, D.A. Persistence of soil organic matter as an ecosystem property. Nature 2011, 478, 49. [Google Scholar] [CrossRef] [PubMed]
  3. Gleixner, G.; Poirier, N.; Bol, R.; Balesdent, J. Molecular dynamics of organic matter in a cultivated soil. Org. Geochem. 2002, 33, 357–366. [Google Scholar] [CrossRef]
  4. Von Lützow, M.; Kögel-Knabner, I.; Ekschmitt, K.; Flessa, H.; Guggenberger, G.; Matzner, E.; Marschner, B. SOM fractionation methods: Relevance to functional pools and to stabilization mechanisms. Soil Biol. Biochem. 2007, 39, 2183–2207. [Google Scholar] [CrossRef]
  5. Christensen, B.T. Physical fractionation of soil and organic matter in primary particle size and density separates. In Advances in Soil Science; Springer: Berlin, Germany, 1992; pp. 1–90. [Google Scholar]
  6. Six, J.; Guggenberger, G.; Paustian, K.; Haumaier, L.; Elliott, E.; Zech, W. Sources and composition of soil organic matter fractions between and within soil aggregates. Eur. J. Soil Sci. 2001, 52, 607–618. [Google Scholar] [CrossRef]
  7. Sollins, P.; Swanston, C.; Kleber, M.; Filley, T.; Kramer, M.; Crow, S.; Caldwell, B.A.; Lajtha, K.; Bowden, R. Organic C and N stabilization in a forest soil: Evidence from sequential density fractionation. Soil Biol. Biochem. 2006, 38, 3313–3324. [Google Scholar] [CrossRef] [Green Version]
  8. Marx, M.-C.; Kandeler, E.; Wood, M.; Wermbter, N.; Jarvis, S. Exploring the enzymatic landscape: Distribution and kinetics of hydrolytic enzymes in soil particle-size fractions. Soil Biol. Biochem. 2005, 37, 35–48. [Google Scholar] [CrossRef]
  9. Grandy, A.S.; Neff, J.C.; Weintraub, M.N. Carbon structure and enzyme activities in alpine and forest ecosystems. Soil Biol. Biochem. 2007, 39, 2701–2711. [Google Scholar] [CrossRef]
  10. Derrien, D.; Marol, C.; Balabane, M.; Balesdent, J. The turnover of carbohydrate carbon in a cultivated soil estimated by 13C natural abundances. Eur. J. Soil Sci. 2006, 57, 547–557. [Google Scholar] [CrossRef]
  11. Quénéa, K.; Largeau, C.; Derenne, S.; Spaccini, R.; Bardoux, G.; Mariotti, A. Molecular and isotopic study of lipids in particle size fractions of a sandy cultivated soil (Cestas cultivation sequence, southwest France): Sources, degradation, and comparison with Cestas forest soil. Org. Geochem. 2006, 37, 20–44. [Google Scholar] [CrossRef]
  12. Christensen, B.T. Matching measurable soil organic matter fractions with conceptual pools in simulation models of carbon turnover: Revision of model structure. In Evaluation of Soil Organic Matter Models; Powlson, D.S., Smith, P., Smith, J.U., Eds.; Springer: Berlin, Germany, 1996; pp. 143–159. [Google Scholar]
  13. Lützow, M.V.; Kögel-Knabner, I.; Ekschmitt, K.; Matzner, E.; Guggenberger, G.; Marschner, B.; Flessa, H. Stabilization of organic matter in temperate soils: Mechanisms and their relevance under different soil conditions—A review. Eur. J. Soil Sci. 2006, 57, 426–445. [Google Scholar] [CrossRef]
  14. Bol, R.; Poirier, N.; Balesdent, J.; Gleixner, G. Molecular turnover time of soil organic matter in particle-size fractions of an arable soil. Rapid Commun. Mass Spectrom. Int. J. Devoted Rapid Dissem. Up Minute Res. Mass Spectrom. 2009, 23, 2551–2558. [Google Scholar] [CrossRef] [PubMed]
  15. Carr, A.S.; Boom, A.; Chase, B.M.; Meadows, M.E.; Roberts, Z.E.; Britton, M.N.; Cumming, A.M. Biome-scale characterisation and differentiation of semi-arid and arid zone soil organic matter compositions using pyrolysis–GC/MS analysis. Geoderma 2013, 200, 189–201. [Google Scholar] [CrossRef]
  16. Buurman, P.; Roscoe, R. Different chemical composition of free light, occluded light and extractable SOM fractions in soils of Cerrado and tilled and untilled fields, Minas Gerais, Brazil: A pyrolysis-GC/MS study. Eur. J. Soil Sci. 2011, 62, 253–266. [Google Scholar] [CrossRef]
  17. Crow, S.E.; Lajtha, K.; Filley, T.R.; Swanston, C.W.; Bowden, R.D.; Caldwell, B.A. Sources of plant-derived carbon and stability of organic matter in soil: Implications for global change. Glob. Chang. Biol. 2009, 15, 2003–2019. [Google Scholar] [CrossRef]
  18. Da Silva Oliveira, D.M.; Schellekens, J.; Cerri, C.E.P. Molecular characterization of soil organic matter from native vegetation–pasture–sugarcane transitions in Brazil. Sci. Total Environ. 2016, 548, 450–462. [Google Scholar] [CrossRef] [PubMed]
  19. Derenne, S.; Quenea, K. Analytical pyrolysis as a tool to probe soil organic matter. J. Anal. Appl. Pyrolysis 2015, 111, 108–120. [Google Scholar] [CrossRef] [Green Version]
  20. Nierop, K.G.; Pulleman, M.M.; Marinissen, J.C. Management induced organic matter differentiation in grassland and arable soil: A study using pyrolysis techniques. Soil Biol. Biochem. 2001, 33, 755–764. [Google Scholar] [CrossRef]
  21. Yassir, I.; Buurman, P. Soil organic matter chemistry changes upon secondary succession in Imperata Grasslands, Indonesia: A pyrolysis–GC/MS study. Geoderma 2012, 173, 94–103. [Google Scholar] [CrossRef]
  22. Parsi, Z.; Hartog, N.; Górecki, T.; Poerschmann, J. Analytical pyrolysis as a tool for the characterization of natural organic matter—A comparison of different approaches. J. Anal. Appl. Pyrolysis 2007, 79, 9–15. [Google Scholar] [CrossRef]
  23. Kaal, J.; Brodowski, S.; Baldock, J.A.; Nierop, K.G.; Cortizas, A.M. Characterisation of aged black carbon using pyrolysis-GC/MS, thermally assisted hydrolysis and methylation (THM), direct and cross-polarisation 13C nuclear magnetic resonance (DP/CP NMR) and the benzenepolycarboxylic acid (BPCA) method. Org. Geochem. 2008, 39, 1415–1426. [Google Scholar] [CrossRef]
  24. Abelenda, M.S.; Buurman, P.; Camps Arbestain, M.; Kaal, J.; Martinez-Cortizas, A.; Gartzia-Bengoetxea, N.; Macías, F. Comparing NaOH-extractable organic matter of acid forest soils that differ in their pedogenic trends: A pyrolysis-GC/MS study. Eur. J. Soil Sci. 2011, 62, 834–848. [Google Scholar] [CrossRef]
  25. Kim, C.; Kim, S.; Baek, G.; Yang, A.-R. Carbon and Nitrogen responses in litterfall and litter decomposition in red pine (Pinus densiflora S. et Z.) stands disturbed by pine wilt disease. Forests 2019, 10, 244. [Google Scholar] [CrossRef]
  26. De Assis, C.P.; González-Pérez, J.A.; de la Rosa, J.M.; Jucksch, I.; de Sá Mendonça, E.; González-Vila, F.J. Analytical pyrolysis of humic substances from a Latosol (Typic Hapludox) under different land uses in Minas Gerais, Brazil. J. Anal. Appl. Pyrolysis 2012, 93, 120–128. [Google Scholar] [CrossRef]
  27. Martin, F. Pyrolysis gas chromatography of humic substances from different origin. Zeitschrift Pflanzenernährung Bodenkunde 1975, 138, 407–416. [Google Scholar] [CrossRef]
  28. Martin, F.; Saiz-Jimenez, C.; Gonzalez-Vila, F. Pyrolysis-gas chromatography-mass spectrometry of lignins. Holzforschung 1979, 33, 210–212. [Google Scholar]
  29. De Vries, W.; Du, E.; Butterbach-Bahl, K. Short and long-term impacts of nitrogen deposition on carbon sequestration by forest ecosystems. Curr. Opin. Environ. Sustain. 2014, 9, 90–104. [Google Scholar] [CrossRef]
  30. Vitousek, P.M.; Aber, J.D.; Howarth, R.W.; Likens, G.E.; Matson, P.A.; Schindler, D.W.; Schlesinger, W.H.; Tilman, D.G. Human alteration of the global nitrogen cycle: Sources and consequences. Ecol. Appl. 1997, 7, 737–750. [Google Scholar] [CrossRef]
  31. Galloway, J.N.; Townsend, A.R.; Erisman, J.W.; Bekunda, M.; Cai, Z.; Freney, J.R.; Martinelli, L.A.; Seitzinger, S.P.; Sutton, M.A. Transformation of the nitrogen cycle: Recent trends, questions, and potential solutions. Science 2008, 320, 889–892. [Google Scholar] [CrossRef]
  32. Neff, J.C.; Townsend, A.R.; Gleixner, G.; Lehman, S.J.; Turnbull, J.; Bowman, W.D. Variable effects of nitrogen additions on the stability and turnover of soil carbon. Nature 2002, 419, 915. [Google Scholar] [CrossRef]
  33. Maaroufi, N.I.; Nordin, A.; Hasselquist, N.J.; Bach, L.H.; Palmqvist, K.; Gundale, M.J. Anthropogenic nitrogen deposition enhances carbon sequestration in boreal soils. Glob. Chang. Biol. 2015, 21, 3169–3180. [Google Scholar] [CrossRef] [PubMed]
  34. Keeler, B.L.; Hobbie, S.E.; Kellogg, L.E. Effects of long-term nitrogen addition on microbial enzyme activity in eight forested and grassland sites: Implications for litter and soil organic matter decomposition. Ecosystems 2009, 12, 1–15. [Google Scholar] [CrossRef]
  35. Currey, P.M.; Johnson, D.; Sheppard, L.J.; Leith, I.D.; Toberman, H.; Van Der WAL, R.; Dawson, L.A.; Artz, R.R. Turnover of labile and recalcitrant soil carbon differ in response to nitrate and ammonium deposition in an ombrotrophic peatland. Glob. Chang. Biol. 2010, 16, 2307–2321. [Google Scholar] [CrossRef]
  36. Nave, L.; Vance, E.; Swanston, C.; Curtis, P. Impacts of elevated N inputs on north temperate forest soil C storage, C/N, and net N-mineralization. Geoderma 2009, 153, 231–240. [Google Scholar] [CrossRef]
  37. Liu, L.; Greaver, T.L. A global perspective on belowground carbon dynamics under nitrogen enrichment. Ecol. Lett. 2010, 13, 819–828. [Google Scholar] [CrossRef] [PubMed]
  38. Lu, M.; Zhou, X.; Luo, Y.; Yang, Y.; Fang, C.; Chen, J.; Li, B. Minor stimulation of soil carbon storage by nitrogen addition: A meta-analysis. Agric. Ecosyst. Environ. 2011, 140, 234–244. [Google Scholar] [CrossRef]
  39. Yue, K.; Peng, Y.; Peng, C.; Yang, W.; Peng, X.; Wu, F. Stimulation of terrestrial ecosystem carbon storage by nitrogen addition: A meta-analysis. Sci. Rep.UK 2016, 6, 19895. [Google Scholar] [CrossRef]
  40. Liu, J.; Wu, N.; Wang, H.; Sun, J.; Peng, B.; Jiang, P.; Bai, E. Nitrogen addition affects chemical compositions of plant tissues, litter and soil organic matter. Ecology 2016, 97, 1796–1806. [Google Scholar] [CrossRef]
  41. Chen, H.; Li, D.; Feng, W.; Niu, S.; Plante, A.; Luo, Y.; Wang, K. Different responses of soil organic carbon fractions to additions of nitrogen. Eur. J. Soil Sci. 2018, 69, 1098–1104. [Google Scholar] [CrossRef]
  42. Cheng, S.; He, S.; Fang, H.; Xia, J.; Tian, J.; Yu, G.; Geng, J.; Yu, G. Contrasting effects of NH4+ and NO3− amendments on amount and chemical characteristics of different density organic matter fractions in a boreal forest soil. Geoderma 2017, 293, 1–9. [Google Scholar] [CrossRef]
  43. Wang, Y.; Cheng, S.; Fang, H.; Yu, G.; Xu, X.; Xu, M.; Wang, L.; Li, X.; Si, G.; Geng, J. Contrasting effects of ammonium and nitrate inputs on soil CO 2 emission in a subtropical coniferous plantation of southern China. Biol. Fert. Soils 2015, 51, 815–825. [Google Scholar] [CrossRef]
  44. Zhu, J.; He, N.; Wang, Q.; Yuan, G.; Wen, D.; Yu, G.; Jia, Y. The composition, spatial patterns, and influencing factors of atmospheric wet nitrogen deposition in Chinese terrestrial ecosystems. Sci. Total Environ. 2015, 511, 777–785. [Google Scholar] [CrossRef] [PubMed]
  45. Cambardella, C.; Elliott, E. Particulate soil organic-matter changes across a grassland cultivation sequence. Soil Sci. Soc. Am. J. 1992, 56, 777–783. [Google Scholar] [CrossRef]
  46. Elliott, E.; Cambardella, C. Physical separation of soil organic matter. Agric. Ecosyst. Environ. 1991, 34, 407–419. [Google Scholar] [CrossRef]
  47. Stemmer, M.; Gerzabek, M.H.; Kandeler, E. Organic matter and enzyme activity in particle-size fractions of soils obtained after low-energy sonication. Soil Biol. Biochem. 1998, 30, 9–17. [Google Scholar] [CrossRef]
  48. Grandy, A.S.; Sinsabaugh, R.L.; Neff, J.C.; Stursova, M.; Zak, D.R. Nitrogen deposition effects on soil organic matter chemistry are linked to variation in enzymes, ecosystems and size fractions. Biogeochemistry 2008, 91, 37–49. [Google Scholar] [CrossRef]
  49. Castellano, M.J.; Kaye, J.P.; Lin, H.; Schmidt, J.P. Linking carbon saturation concepts to nitrogen saturation and retention. Ecosystems 2012, 15, 175–187. [Google Scholar] [CrossRef]
  50. Grandy, A.S.; Neff, J.C. Molecular C dynamics downstream: The biochemical decomposition sequence and its impact on soil organic matter structure and function. Sci. Total Environ. 2008, 404, 297–307. [Google Scholar] [CrossRef]
  51. Bingham, A.H.; Cotrufo, M.F. Organic nitrogen storage in mineral soil: Implications for policy and management. Sci. Total Environ. 2016, 551, 116–126. [Google Scholar] [CrossRef]
  52. Yu, H.; Ding, W.; Luo, J.; Geng, R.; Ghani, A.; Cai, Z. Effects of long-term compost and fertilizer application on stability of aggregate-associated organic carbon in an intensively cultivated sandy loam soil. Biol. Fert. Soils 2012, 48, 325–336. [Google Scholar] [CrossRef]
  53. Cheng, S.; Fang, H.; Yu, G. Threshold responses of soil organic carbon concentration and composition to multi-level nitrogen addition in a temperate needle-broadleaved forest. Biogeochemistry 2018, 137, 219–233. [Google Scholar] [CrossRef]
  54. Flessa, H.; Amelung, W.; Helfrich, M.; Wiesenberg, G.L.; Gleixner, G.; Brodowski, S.; Rethemeyer, J.; Kramer, C.; Grootes, P.M. Storage and stability of organic matter and fossil carbon in a Luvisol and Phaeozem with continuous maize cropping: A synthesis. J. Plant Nutr. Soil Sci. 2008, 171, 36–51. [Google Scholar] [CrossRef] [Green Version]
  55. Tian, J.; Lou, Y.; Gao, Y.; Fang, H.; Liu, S.; Xu, M.; Blagodatskaya, E.; Kuzyakov, Y. Response of soil organic matter fractions and composition of microbial community to long-term organic and mineral fertilization. Biol. Fert. Soils 2017, 53, 523–532. [Google Scholar] [CrossRef]
  56. Six, J.; Conant, R.T.; Paul, E.A.; Paustian, K. Stabilization mechanisms of soil organic matter: Implications for C-saturation of soils. Plant Soil 2002, 241, 155–176. [Google Scholar] [CrossRef]
  57. Zhong, X.-L.; Li, J.-T.; Li, X.-J.; Ye, Y.-C.; Liu, S.-S.; Hallett, P.D.; Ogden, M.R.; Naveed, M. Physical protection by soil aggregates stabilizes soil organic carbon under simulated N deposition in a subtropical forest of China. Geoderma 2017, 285, 323–332. [Google Scholar] [CrossRef]
  58. Zhang, S.; Li, Q.; Lü, Y.; Zhang, X.; Liang, W. Contributions of soil biota to C sequestration varied with aggregate fractions under different tillage systems. Soil Biol. Biochem. 2013, 62, 147–156. [Google Scholar] [CrossRef]
  59. DeForest, J.L.; Zak, D.R.; Pregitzer, K.S.; Burton, A.J. Atmospheric nitrate deposition, microbial community composition, and enzyme activity in northern hardwood forests. Soil Sci. Soc. Am. J. 2004, 68, 132–138. [Google Scholar] [CrossRef]
  60. Ralph, J.; Hatfield, R.D. Pyrolysis-GC-MS characterization of forage materials. J. Agr. Food Chem. 1991, 39, 1426–1437. [Google Scholar] [CrossRef]
  61. González-Pérez, J.A.; Almendros, G.; De la Rosa, J.; González-Vila, F.J. Appraisal of polycyclic aromatic hydrocarbons (PAHs) in environmental matrices by analytical pyrolysis (Py–GC/MS). J. Anal. Appl. Pyrolysis 2014, 109, 1–8. [Google Scholar] [CrossRef]
  62. Buurman, P.; Peterse, F.; Almendros Martin, G. Soil organic matter chemistry in allophanic soils: A pyrolysis-GC/MS study of a Costa Rican Andosol catena. Eur. J. Soil Sci. 2007, 58, 1330–1347. [Google Scholar] [CrossRef]
  63. Buurman, P.; Nierop, K.; Pontevedra-Pombal, X.; Cortizas, A.M. Molecular chemistry by pyrolysis–GC/MS of selected samples of the Penido Vello peat deposit, Galicia, NW Spain. Dev. Earth Surf. Process. 2006, 9, 217–240. [Google Scholar]
  64. Geng, J.; Cheng, S.L.; Fang, H.J.; Pei, J.; Xu, M.; Lu, M.Z.; Yang, Y.; Cao, Z.C. Nitrogen fertilization changes the molecular composition of soil organic matter in a subtropical plantation forest. Soil Sci. Soc. Am. J. in press.
  65. Chiavari, G.; Galletti, G.C. Pyrolysis—Gas chromatography/mass spectrometry of amino acids. J. Anal. Appl. Pyrolysis 1992, 24, 123–137. [Google Scholar] [CrossRef]
  66. Kaal, J.; Rumpel, C. Can pyrolysis-GC/MS be used to estimate the degree of thermal alteration of black carbon? Org. Geochem. 2009, 40, 1179–1187. [Google Scholar] [CrossRef]
  67. Simoneit, B.; Rogge, W.; Lang, Q.; Jaffé, R. Molecular characterization of smoke from campfire burning of pine wood (Pinus elliottii). Chemosphere Glob. Chang. Sci. 2000, 2, 107–122. [Google Scholar] [CrossRef]
  68. Mayle, F.E.; Burbridge, R.; Killeen, T.J. Millennial-scale dynamics of southern Amazonian rain forests. Science 2000, 290, 2291–2294. [Google Scholar] [CrossRef] [PubMed]
  69. Kögel-Knabner, I. The macromolecular organic composition of plant and microbial residues as inputs to soil organic matter. Soil Biol. Biochem. 2002, 34, 139–162. [Google Scholar] [CrossRef]
  70. Van Heemst, J.D.; van Bergen, P.F.; Stankiewicz, B.A.; de Leeuw, J.W. Multiple sources of alkylphenols produced upon pyrolysis of DOM, POM and recent sediments. J. Anal. Appl. Pyrolysis 1999, 52, 239–256. [Google Scholar] [CrossRef]
  71. Galletti, G.C.; Reeves, J.B. Pyrolysis/gas chromatography/ion-trap detection of polyphenols (vegetable tannins): Preliminary results. Org. Mass Spectrom. 1992, 27, 226–230. [Google Scholar] [CrossRef]
  72. Vancampenhout, K.; Schellekens, J.; Slaets, J.; Hatté, C.; Buurman, P. Fossil redox-conditions influence organic matter composition in loess paleosols. Quat. Int. 2016, 418, 105–115. [Google Scholar] [CrossRef]
  73. Gleixner, G.; Bol, R.; Balesdent, J. Molecular insight into soil carbon turnover. Rapid Commun. Mass Spectrom. 1999, 13, 1278–1283. [Google Scholar] [CrossRef]
  74. Justi, M.; Schellekens, J.; de Camargo, P.B.; Vidal-Torrado, P. Long-term degradation effect on the molecular composition of black carbon in Brazilian Cerrado soils. Org. Geochem. 2017, 113, 196–209. [Google Scholar] [CrossRef]
  75. Klotzbücher, T.; Kaiser, K.; Guggenberger, G.; Gatzek, C.; Kalbitz, K. A new conceptual model for the fate of lignin in decomposing plant litter. Ecology 2011, 92, 1052–1062. [Google Scholar] [CrossRef] [PubMed]
  76. Marques, F.A.; Buurman, P.; Schellekens, J.; Vidal-Torrado, P. Molecular chemistry in humic Ferralsols from Brazilian Cerrado and forest biomes indicates a major contribution from black carbon in the subsoil. J. Anal. Appl. Pyrolysis 2015, 113, 518–528. [Google Scholar] [CrossRef]
  77. Bento-Gonçalves, A.; Vieira, A.; Úbeda, X.; Martin, D. Fire and soils: Key concepts and recent advances. Geoderma 2012, 191, 3–13. [Google Scholar] [CrossRef]
  78. Kleber, M.; Mertz, C.; Zikeli, S.; Knicker, H.; Jahn, R. Changes in surface reactivity and organic matter composition of clay subfractions with duration of fertilizer deprivation. Eur. J. Soil Sci. 2004, 55, 381–391. [Google Scholar] [CrossRef]
  79. Zhang, C.; Zhang, X.-Y.; Zou, H.-T.; Kou, L.; Yang, Y.; Wen, X.-F.; Li, S.-G.; Wang, H.-M.; Sun, X.-M. Contrasting effects of ammonium and nitrate additions on the biomass of soil microbial communities and enzyme activities in subtropical China. Biogeosciences 2017, 14, 4815–4827. [Google Scholar] [CrossRef] [Green Version]
  80. Naafs, D.F.W. What Are Humic Substances?: A Molecular Approach to the Study of Organic Matter in Acid Soils. Ph.D. Thesis, Utrecht University, Utrecht, The Netherlands, 2004. [Google Scholar]
  81. Spaccini, R.; Piccolo, A.; Haberhauer, G.; Gerzabek, M. Transformation of organic matter from maize residues into labile and humic fractions of three European soils as revealed by 13C distribution and CPMAS-NMR spectra. Eur. J. Soil Sci. 2000, 51, 583–594. [Google Scholar] [CrossRef]
Figure 1. Percentages of three fractions under different treatments. CK, A40, A120, N40, and N120 are control, low (40 kg N ha−1 yr−1), and high (120 kg N ha−1 yr−1) rates of NH4Cl and NaNO3 application, respectively. Different lowercases and uppercases represent significant differences between control and N treatments in fine particulate organic matter (POM) and mineral-associated organic matter (MAOM), respectively.
Forests 10 00914 g001
Figure 2. Soil C contents (a) and C:N ratios (b) of three fractions under different treatments. CK, A40, A120, N40, and N120 are control, low (40 kg N ha−1 yr−1), and high (120 kg N ha−1 yr−1) rates of NH4Cl and NaNO3 application, respectively. Error bars represent the standard errors of the means (n = 3). Different lowercases above the columns represent significant differences between control and N treatments.
Forests 10 00914 g002
Figure 3. Principal component analysis (PCA) of nine chemical groups in three fractions. Different numbers represent three fractions, 1 for coarse POM, 2 for fine POM and 3 for MAOM, respectively.
Forests 10 00914 g003
Figure 4. Relationships between C contents and chemical groups: (a) polyaromatics, (b) N-containing compounds, (c) benzofurans, and (d) polysaccharides in three particulate fractions.
Forests 10 00914 g004
Figure 5. Factor loadings (a) and scores (b) for the F1-F2 projection of a factor analysis applied to the quantified pyrolysis products of coarse POM, fine POM and MAOM fractions from all samples. A1−A23 = n-alkanes; E1−E25 = n-alkenes; Ar1−Ar5 = Aromatics; Lg1−Lg10 = Lignins (LgH: p-hydroxyphenyl lignin; LgG: guaiacol lignin; LgS: syringyl lignin); PA1−PA14 = Polyaromatics; Bf1−Bf3 = Benzofurans; N1−N6 = N-containing compounds; Ph1−Ph3 = Phenols; Ps1−Ps3 = Polysaccharides. See Table 1 for compounds.
Forests 10 00914 g005
Table 1. Quantified pyrolysis products in the three fractions.
CompoundCodem/z1RT 2CompoundCodem/zRT
n-alkanes Aromatics
n-C6:0A157 + 712.47BenzeneAr1783.06
n-C7:0A257 + 713.56IndaneAr2117 + 11817.47
n-C8:0A357 + 715.86IndeneAr3115 + 11618.01
n-C9:0A457 + 719.92TolueneAr491 + 924.92
n-C10:0A557 + 7115.63MethylindeneAr5115 + 13024.98
n-C11:0A657 + 7122.24Lignins
n-C12:0A757 + 7129.094-AcetylphenolLg1121 + 13625.96
n-C13:0A857 + 7135.81GuaiacolLg2109 + 12421.25
n-C14:0A957 + 7142.274-MethylguaiacolLg3123 + 13828.32
n-C15:0A1057 + 7148.414-EthylguaiacolLg4137 + 15234.10
n-C16:0A1157 + 7154.244-VinylguaiacolLg5135 + 15036.38
n-C17:0A1257 + 7159.824-FormylguaiacolLg6151 + 15241.787
n-C18:0A1357 + 7165.104-(Prop-2-enyl)guaiacol, transLg716445.00
n-C19:0A1457 + 7170.154-AcetylguaiacolLg8151 + 16647.19
n-C20:0A1557 + 7174.96SyringolLg9139 + 15438.884
n-C21:0A1657 + 7179.564-EthylsyringolLg10167 + 18249.13
n-C22:0A1757 + 7184.01Polyaromatics
n-C23:0A1857 + 7187.63NaphthalenePA112827.18
n-C24:0A1957 + 7190.58MethylnaphthalenePA2141 + 14234.61
n-C25:0A2057 + 7193.13BiphenylPA315440.22
n-C26:0A2157 + 7195.40C2 naphthalenePA4141 + 15641.05
n-C27:0A2257 + 7197.49MethylbiphenylPA5168 + 16741.64
n-C28:0A2357 + 7199.44FluorenePA6165 + 16652.19
n-alkenes PhenanthrenePA717862.77
n-C4:1E157 + 711.78AnthracenePA817863.28
n-C5:1E257 + 711.92MethylphenanthrenePA9192 + 19168.68
n-C6:1E357 + 712.412-PhenylnaphthalenePA10204 + 20272.53
n-C7:1E457 + 713.43FluoranthenePA1120276.36
n-C8:1E557 + 715.59PyrenePA1220278.63
n-C9:1E657 + 719.53RetenePA13219 + 23483.65
n-C10:1E757 + 7115.08PerylenePA14252 + 25084.91
n-C11:1E857 + 7121.66N-containing compounds
n-C12:1E957 + 7128.50PyridineN152 + 794.41
n-C13:1E1057 + 7135.24PyrroleN2674.71
n-C14:1E1157 + 7141.74Methyl-1 H-pyrroleN380 + 817.32
n-C15:1E1257 + 7147.92BenzonitrileN476 + 10314.35
n-C16:1E1357 + 7153.81IndoleN590 + 11734.94
n-C17:1E1457 + 7159.40IsoquinolinN612930.82
n-C18:1E1557 + 7164.72Benzofurans
n-C19:1E1657 + 7169.79BenzofuranBf189 + 11815.06
n-C20:1E1757 + 7174.65MethylbenzofuranBf2131 + 13222.00
n-C21:1E1857 + 7179.26DibenzofuranBf3139 + 16848.34
n-C22:1E1957 + 7183.74Phenols
n-C23:1E2057 + 7187.43PhenolPh166 + 9414.88
n-C24:1E2157 + 7190.43MethylphenolPh210719.35
n-C25:1E2257 + 7192.99C2 phenolPh3107 + 12225.54
n-C26:1E2357 + 7195.30Polysaccharides
n-C27:1E2457 + 7197.39Acetic acidPs1603.63
n-C28:1E2557 + 7199.352-FuraldehydePs295 + 966.25
5-Methyl-2-furaldehydePs3109 + 11013.23
1 Mass fragments used for quantification; 2 Retention time (min).
Table 2. Relative abundance of chemical groups in three fractions under different treatments.
FractionsTreatments 1Relative Abundance (%) 2
n-alkanesn-alkenesAromaticsLigninsPolyaromaticsN-Containing CompoundsBenzofuransPhenolsPolysaccharides
Coarse POMCK4.8 ± 1.92.0 ± 0.521.9 ± 5.011.2 ± 9.116.5 ± 3.87.2 ± 1.73.6 ± 0.516.5 ± 2.616.4 ± 4.9
A403.3 ± 0.31.5 ± 0.219.0 ± 0.714.7 ± 2.113.9 ± 1.56.4 ± 0.43.3 ± 0.420.7 ± 2.017.1 ± 1.1
N403.6 ± 0.91.8 ± 0.422.9 ± 2.18.9 ± 4.316.3 ± 1.58.0 ± 2.03.8 ± 0.314.9 ± 1.119.8 ± 0.4
A1203.0 ± 0.81.5 ± 0.419.1 ± 2.615.8 ± 7.915.3 ± 5.15.9 ± 1.03.3 ± 0.515.8 ± 2.420.3 ± 2.7
N1203.1 ± 0.71.5 ± 0.419.2 ± 3.316.8 ± 8.415.0 ± 4.08.8 ± 2.43.4 ± 0.816.7 ± 0.315.6 ± 2.4
Fine POMCK6.5 ± 0.53.3 ± 0.444.2 ± 2.60.1 ± 0.013.9 ± 1.715.4 ± 0.75.5 ± 0.52.3 ± 0.78.8 ± 3.6
A404.9 ± 0.32.9 ± 0.443.5 ± 2.60.2 ± 0.115.8 ± 2.017.5 ± 1.96.3 ± 0.62.8 ± 0.46.2 ± 3.1
N404.6 ± 0.63.2 ± 0.740.8 ± 5.80.1 ± 0.012.7 ± 0.717.5 ± 1.55.3 ± 0.12.3 ± 0.513.6 ± 6.0
A1206.9 ± 1.44.0 ± 1.139.3 ± 3.50.1 ± 0.015.9 ± 1.413.4 ± 2.05.2 ± 0.94.4 ± 2.210.7 ± 3.3
N1205.6 ± 0.22.8 ± 0.439.5 ± 5.00.2 ± 0.013.6 ± 1.016.5 ± 0.55.6 ± 0.84.2 ± 2.311.9 ± 4.9
MAOMCK4.6 ± 0.42.5 ± 0.443.6 ± 2.90.1 ± 0.09.1 ± 1.021.9 ± 1.04.8 ± 0.2 a1.9 ± 0.111.5 ± 1.5 b
A403.9 ± 0.72.3 ± 0.337.5 ± 3.60.1 ± 0.08.0 ± 0.519.8 ± 1.14.2 ± 0.3 ab2.0 ± 0.322.2 ± 5.3 a
N404.3 ± 0.92.4 ± 0.236.4 ± 2.20.1 ± 0.08.0 ± 0.618.6 ± 1.13.6 ± 0.3 b2.8 ± 0.823.8 ± 1.1 a
A1204.3 ± 0.22.7 ± 0.140.2 ± 0.90.1 ± 0.08.3 ± 0.818.8 ± 1.04.1 ± 0.2 ab2.1 ± 0.419.3 ± 1.1 ab
N1205.4 ± 0.92.6 ± 0.236.2 ± 1.50.1 ± 0.08.9 ± 0.918.7 ± 0.73.8 ± 0.2 b2.8 ± 0.421.5 ± 2.8 a
1 CK, A40, A120, N40, and N120 are control, low (40 kg N ha−1 yr−1), and high (120 kg N ha−1 yr−1) rates of NH4Cl and NaNO3 application, respectively. 2 The values are expressed as mean ± standard error (n = 3). Different letters indicate significant differences among five treatments at the level of p < 0.05.

