Article

Drought Superimposes the Positive Effect of Silver Fir on Water Relations of European Beech in Mature Forest Stands

1
Institute of Forest Sciences, Chair of Tree Physiology, University of Freiburg, Georges-Koehler-Allee 53/54, 79110 Freiburg, Germany
2
Institute of Meteorology and Climate Research, Atmospheric Environmental Research (IMK-IFU), Karlsruhe Institute of Technology (KIT), Kreuzeckbahnstrasse 19, 82467 Garmisch-Partenkirchen, Germany
3
Urban Ecosystem Science, School of Social Sciences, Western Sydney University, Locked Bag 1797, Penrith, NSW 2751, Australia
4
Center of Molecular Ecophysiology (CMEP), College of Resources and Environment, Southwest University No. 2, Tiansheng Road, Beibei district, Chongqing 400715, China
5
College of Sciences, King Saud University, P.O. Box 2455, Riyadh 11451, Saudi Arabia
*
Author to whom correspondence should be addressed.
Forests 2019, 10(10), 897; https://doi.org/10.3390/f10100897
Submission received: 9 September 2019 / Revised: 9 October 2019 / Accepted: 9 October 2019 / Published: 11 October 2019

Abstract

:
Research Highlights: Investigations of evapotranspiration in a mature mixed beech-fir forest stand do not indicate higher resilience towards intensified drying-wetting cycles as compared with pure beech stands. Background and Objectives: Forest management seeks to implement adaptive measures, for example, the introduction of more drought resistant species into prevailing monospecific stands to minimize forest mortality and monetary losses. In Central Europe this includes the introduction of native silver fir (Abies alba) into monospecific beech (Fagus sylvatica) stands. In order to determine, if the introduction of fir would improve the resilience against drier conditions, this study investigates water relations of a mature pure beech and a mature mixed beech-fir stand under natural as well as reduced water availability. Materials and Methods: Sap flow rates and densities were measured in two consecutive years using the heat ratio method and scaled using stand inventory data and modeling. Results: Transpiration rates estimated from sap flow were significantly higher for beech trees as compared with silver fir which was attributed to the more anisohydric water-use strategy of the beech trees. We estimate that stand evapotranspiration was slightly higher for mixed stands due to higher interception losses from the mixed stand during times of above average water supply. When precipitation was restricted, beech was not able to support its transpiration demands, and therefore there was reduced sap flow rates in the mixed, as well as in the pure stand, whereas transpiration of fir was largely unaffected, likely due to its more isohydric behavior toward water use and access to moister soil layers. Thus, we found the rates of evapotranspiration in the mixed beech-fir stand to be smaller during times with no precipitation as compared with the pure beech stand, which was accountable to the severely reduced transpiration of beech in the mixed stand. Conclusions: We conclude that smaller evapotranspiration rates in the mixed beech-fir stand might not be the result of increased water use efficiency but rather caused by restricted hydraulic conductivity of the root system of beech, making mixed beech-fir stands at this site less resilient towards drought.

1. Introduction

Forest ecosystems have to cope with various stresses during their long lifespan. Anthropogenic climate change happens at an accelerating speed and implications for forest ecosystems are expected to be severe [1,2]. Climate projections for forested areas in Central Europe indicate a shift in the seasonal distribution of rainfall, with the effect of prolonged drought spells during the vegetation period [3] prone to disrupt the natural regeneration cycles of forest ecosystems.
Against this background, the future performance of native tree species in Central Europe is frequently and critically discussed [4,5,6]. In this context, forest management concepts have been proposed and implemented in the past decades to mitigate future climate change by improving resistance and resilience of forest ecosystems [7,8,9,10,11]. For the latter purpose, fostering compositional, functional, and structural complexity of forests is a central aim of forest policy in Germany [12,13]. These measures follow the principles of ecological resilience introduced by Holling [14], assuming that the ability of any system to endure disturbances before shifting in structure or function is enhanced by diversification [10,15,16,17].
In the Black Forest in Southwest Germany, monospecific stands of beech (Fagus sylvatica L.) are currently diversified by reintroducing species that are assumed to belong to the potential natural vegetation at these sites, such as silver fir (Abies alba Mill.) [12,18,19]. Although it is considered drought sensitive (e.g., [20]), beech is the most abundant deciduous tree species in Central Europe as well as in the Black Forest area [12], and is able to dominate most other tree species under moderate site conditions because of its high shade tolerance [21]. Beech trees react to drought by decreasing root growth and root exudates, thereby potentially decreasing not only their water, but also their nutrient uptake capacity [22]. Fir trees, on the contrary, are described as less distressed by drought conditions, due to their ability to form extensive tap-root systems [23,24].
In this study, we investigated the hydrological balance of a mature mixed beech-fir plot on the foothills of the Black Forest in comparison to an adjacent pure beech plot. We investigated tree sap flow over two consecutive vegetation periods in 2016 and 2017. As the rate of sap flow is tightly related to the trees’ transpiration, and thus to stomatal control, it provides a powerful indicator of drought stress and water availability within the soil–plant–atmosphere system [25,26,27,28]. We estimated changes in transpiration by comparing sap flow of beech trees in pure beech plots with sap flow of both beech and fir trees in mixed plots. To simulate a severe drought, we artificially excluded rain within large sections of the mixed and pure plots (hereafter, treatment). This allowed us to examine responses of tree water use to drought stress and recovery from drought after rewetting. In order to identify effects of rain exclusion at the stand level, we used a comprehensive ecosystem model to estimate the various components of the water budget of all trial variants.
The aim of the present study was to elucidate if a mixed beech-fir stand is more water use efficient than a pure beech forest and, thus, supports the management aim to create more resilient forests. Within this framework, we addressed the following questions/hypotheses: (1) If the transpiration in the mixed plot will be smaller due to a more isohydric behavior of fir, (2) rain exclusion will affect the more shallowly rooted beech more so than the deep, tap-rooted fir which have more access to moisture in deeper soil layers, and (3) if hypotheses one and two are valid, then rain exclusion will have less effect on water use in the mixed beech-fir plot than the pure beech plot because of differences in water acquisition strategies of beech and fir, and also because of differences in crown architecture, altering rainfall interception and evaporation from the stand.

2. Materials and Methods

2.1. Field Site Conditions and Experimental Setup

This study was conducted at a field site close to Freiamt (48°8’52.0116” N, 7°54’18.7596” E) on the foothills of the Black Forest in Southwest Germany. The site is located at approximately 400 m a.s.l. (above sea level), mean annual temperature is 9.6 °C, and annual precipitation amounts to 1100 mm (DWD, Elzach-Fissnacht”, 30 year long-term average: 1981–2010). The soil, derived from sandstone, constitutes a dystric cambisol of 80–100 cm depth with a field capacity of approximately 18 vol%. On average, the vegetation comprises 70% beech, 15% silver fir, and 15% larch. Individual trees were approximately 24 m high and between 40 to 60 years old. For further information about the site see [29].
At the site, two subplots (~0.1 ha) were selected, a beech plot and a beech-silver fir plot, hereafter referred to as pure and mixed, respectively. We included dominant, as well as suppressed trees, in the measurements to cover a representative range of transpiring trees for the calculation of sap flow per site (Tables S1 and S2 provide inventory data of the subplots and are available as Supplementary Data at Forests Online). The 0.1 ha subplots included 36 individuals of beech in the pure stand, and 33 beech trees and 19 fir trees in the mixed stand. Measurements were performed during a period of ~180 and 120 days in the vegetation period (April–October) of 2016 and 2017, respectively. In the pure stand, six beech trees were equipped with sap flow sensors in 2016, as well as 2017; in the mixed stand, three (2016) and six (2017) sap flow sensors were installed in beech trees and six in fir trees (both years). After tree selection, diameter at breast height (DBH), and bark width (Bw) were measured (Table 1).
In 2017, we installed roofs over subplots (~200 m2) within both pure and mixed stands to exclude precipitation from May to mid-August (3.5 months). At the pure stand one roof of 200 m2 was installed, while at the mixed stand two roofs of 100 m2 each covered the projected crown area of the investigated trees. Roofs were built from transparent foil installed 1.5 m above ground in order to keep environmental conditions such as solar radiation, air temperature (Tair), and wind conditions, as natural as possible. The foil was tightly wrapped around the tree stems to prevent stem flow from reaching the soil beneath, and wooden frames were inclined downhill allowing precipitation to run off the plot (Figure S1 available as Supplementary Data at Forests Online). Rewetting was conducted with two precipitation events, one of 40 mm within 4 h on 18 August and a second one of 60 mm within 6 h on 28 August. We ensured even distribution by using lawn sprinklers at frequently changing positions.

2.2. Meteorological and Soil Data

Meteorological data were obtained from a weather station nearby (~0.6 km distance) and kindly provided by Netze BW GmbH (Stuttgart, Germany). Raw data were checked for drifts as well as missing values, which then were either linearly interpolated or interpolated with data from a close by weather station (e.g., DWD station Elzach-Fissnacht 16.3 km ENE, LUBW station Schwarzwald-Süd 39 km SSW, or LUBW station Freiburg 17.1 km SW). VPD was calculated from Tair and relative humidity (rH) using Equation (1) following Alduchov et al. [30]:
V P D = 6.112 × 0.1   17.62 × T a i r 243.12 + T a i r ×   1 r H 100
Soil water content (SWC) was measured continuously at 10, 15, 25, 50, and 80 cm depth (GS1 and 5TM, METER Group, Munich, Germany) at pure and mixed stands in the control (2016 and 2017) and treatment plots (2017 only). Sensor calibration was achieved by gravitational water content measurements.

2.3. Tree Water Use

In order to determine sap flow rates and densities, we installed sap flow sensors of the SFM1 type (ICT International Pty Ltd., Armidale, Australia). Data were recorded every 15 min and tree water use was calculated using the method described by Burgess et al. [31,32].
Wood cores of fir trees were taken with an increment borer (5.15 mm Haglöf Company Group, Långsele, Sweden) at breast height. Bark width (Bw) was read from the core using a caliper. Fresh cores were stained with 40% perchloric acid, dying sapwood light green, and heartwood dark green to brown [33]. Sapwood width (Sw) was then read from the stained core with a caliper. For the determination of Sw of the beech trees we adapted the method described in Meinzer et al. and Genauer et al. [34,35]. The dye “Brilliantblau extra” (Waldeck GmbH & Co.KG, Münster, Germany) was injected into boreholes previously drilled with an increment corer by attaching a reservoir filled with dye to the borehole. After three hours we took another core sample approximately 3–4 cm above the dye hole. Wood sections that were completely colored by the dye and those that revealed at least two connecting spots of dye were considered to be conducting sapwood, and the resulting depth of maximal Sw was measured with a caliper. The maximal Sw determined by this technique was consistent with the data reported by Gebauer et al. [35]. Finally, the sapwood area (As) for both species was calculated from the DBH, Bw, and Sw (Table 1) using Equation (2):
A s = ( D B H 2 B w ) 2   ( D B H 2 B w S w ) 2
To correct for probe misalignment causing zero baseline offsets, we defined a weather index where we assumed zero flow conditions to occur as follows: Global radiation = 0, Tair ≤ 15 °C, VPD = 0, and rH ≥ 90%. All conditions had to be fulfilled on two consecutive days between midnight and 5 a.m. The resulting dates were then identified in the sensor data set and the lowest data value was taken as a correction factor to provide a zero baseline. We identified 14 such events in 2016 and 13 in 2017, allowing us to correct the data every 10 to 12 days.
The mean flow rates of xylem sap were summarized to hourly and daily sums. For this purpose, individual trees were categorized into the following three groups in 2016: beech trees in pure, beech trees in mixed, and fir trees in mixed plots (Table 2). In the subsequent year, we split the experimental design additionally into a rain exclusion treatment and controls, resulting in six different groups of trees. Five groups are shown, since fir trees in the control plots could not be used for analysis in 2017 (Table 3).

2.4. Upscaling Approach

The relationship between DBH and sapwood area was calculated for individual trees to obtain the area of sapwood per area forest stand. For both species the relationship followed a power law equation (R2beech = 0.99, R2fir = 0.98, Figure S2 available as Supplementary Data at Forests Online). With this relationship, the sapwood area of the 0.1 ha plots studied was calculated accounting for the species distribution obtained from the stand inventory (Tables S1 and S2). From the measured tree individuals, we calculated an average xylem sap flow density (mL cm2 sapwood day−1, hereafter SFD), which allowed assessment of differences and similarities in sap flow of both species independent of tree diameter. The product of sap density and sapwood area for each 0.1 ha plot was summed up and resulted in the stand level sap flow, which was then scaled up to 1 ha. Sapwood area for the pure and the mixed 1 ha beech stand was 14.9 m2 ha−1 and 15.7 m2 ha−1, respectively (Table 4 and Table 5).
Because of an error in the installation of sap flow sensors in fir trees of the control plot in 2017, there were no data of fir sap flow in the control plot in this year. For the upscaling approach, we used the data of the treatment group instead, because we compared transpiration rates of the previous season (2016) without the rain exclusion to the ones obtained in 2017 in the treatment group and did not see significant differences.

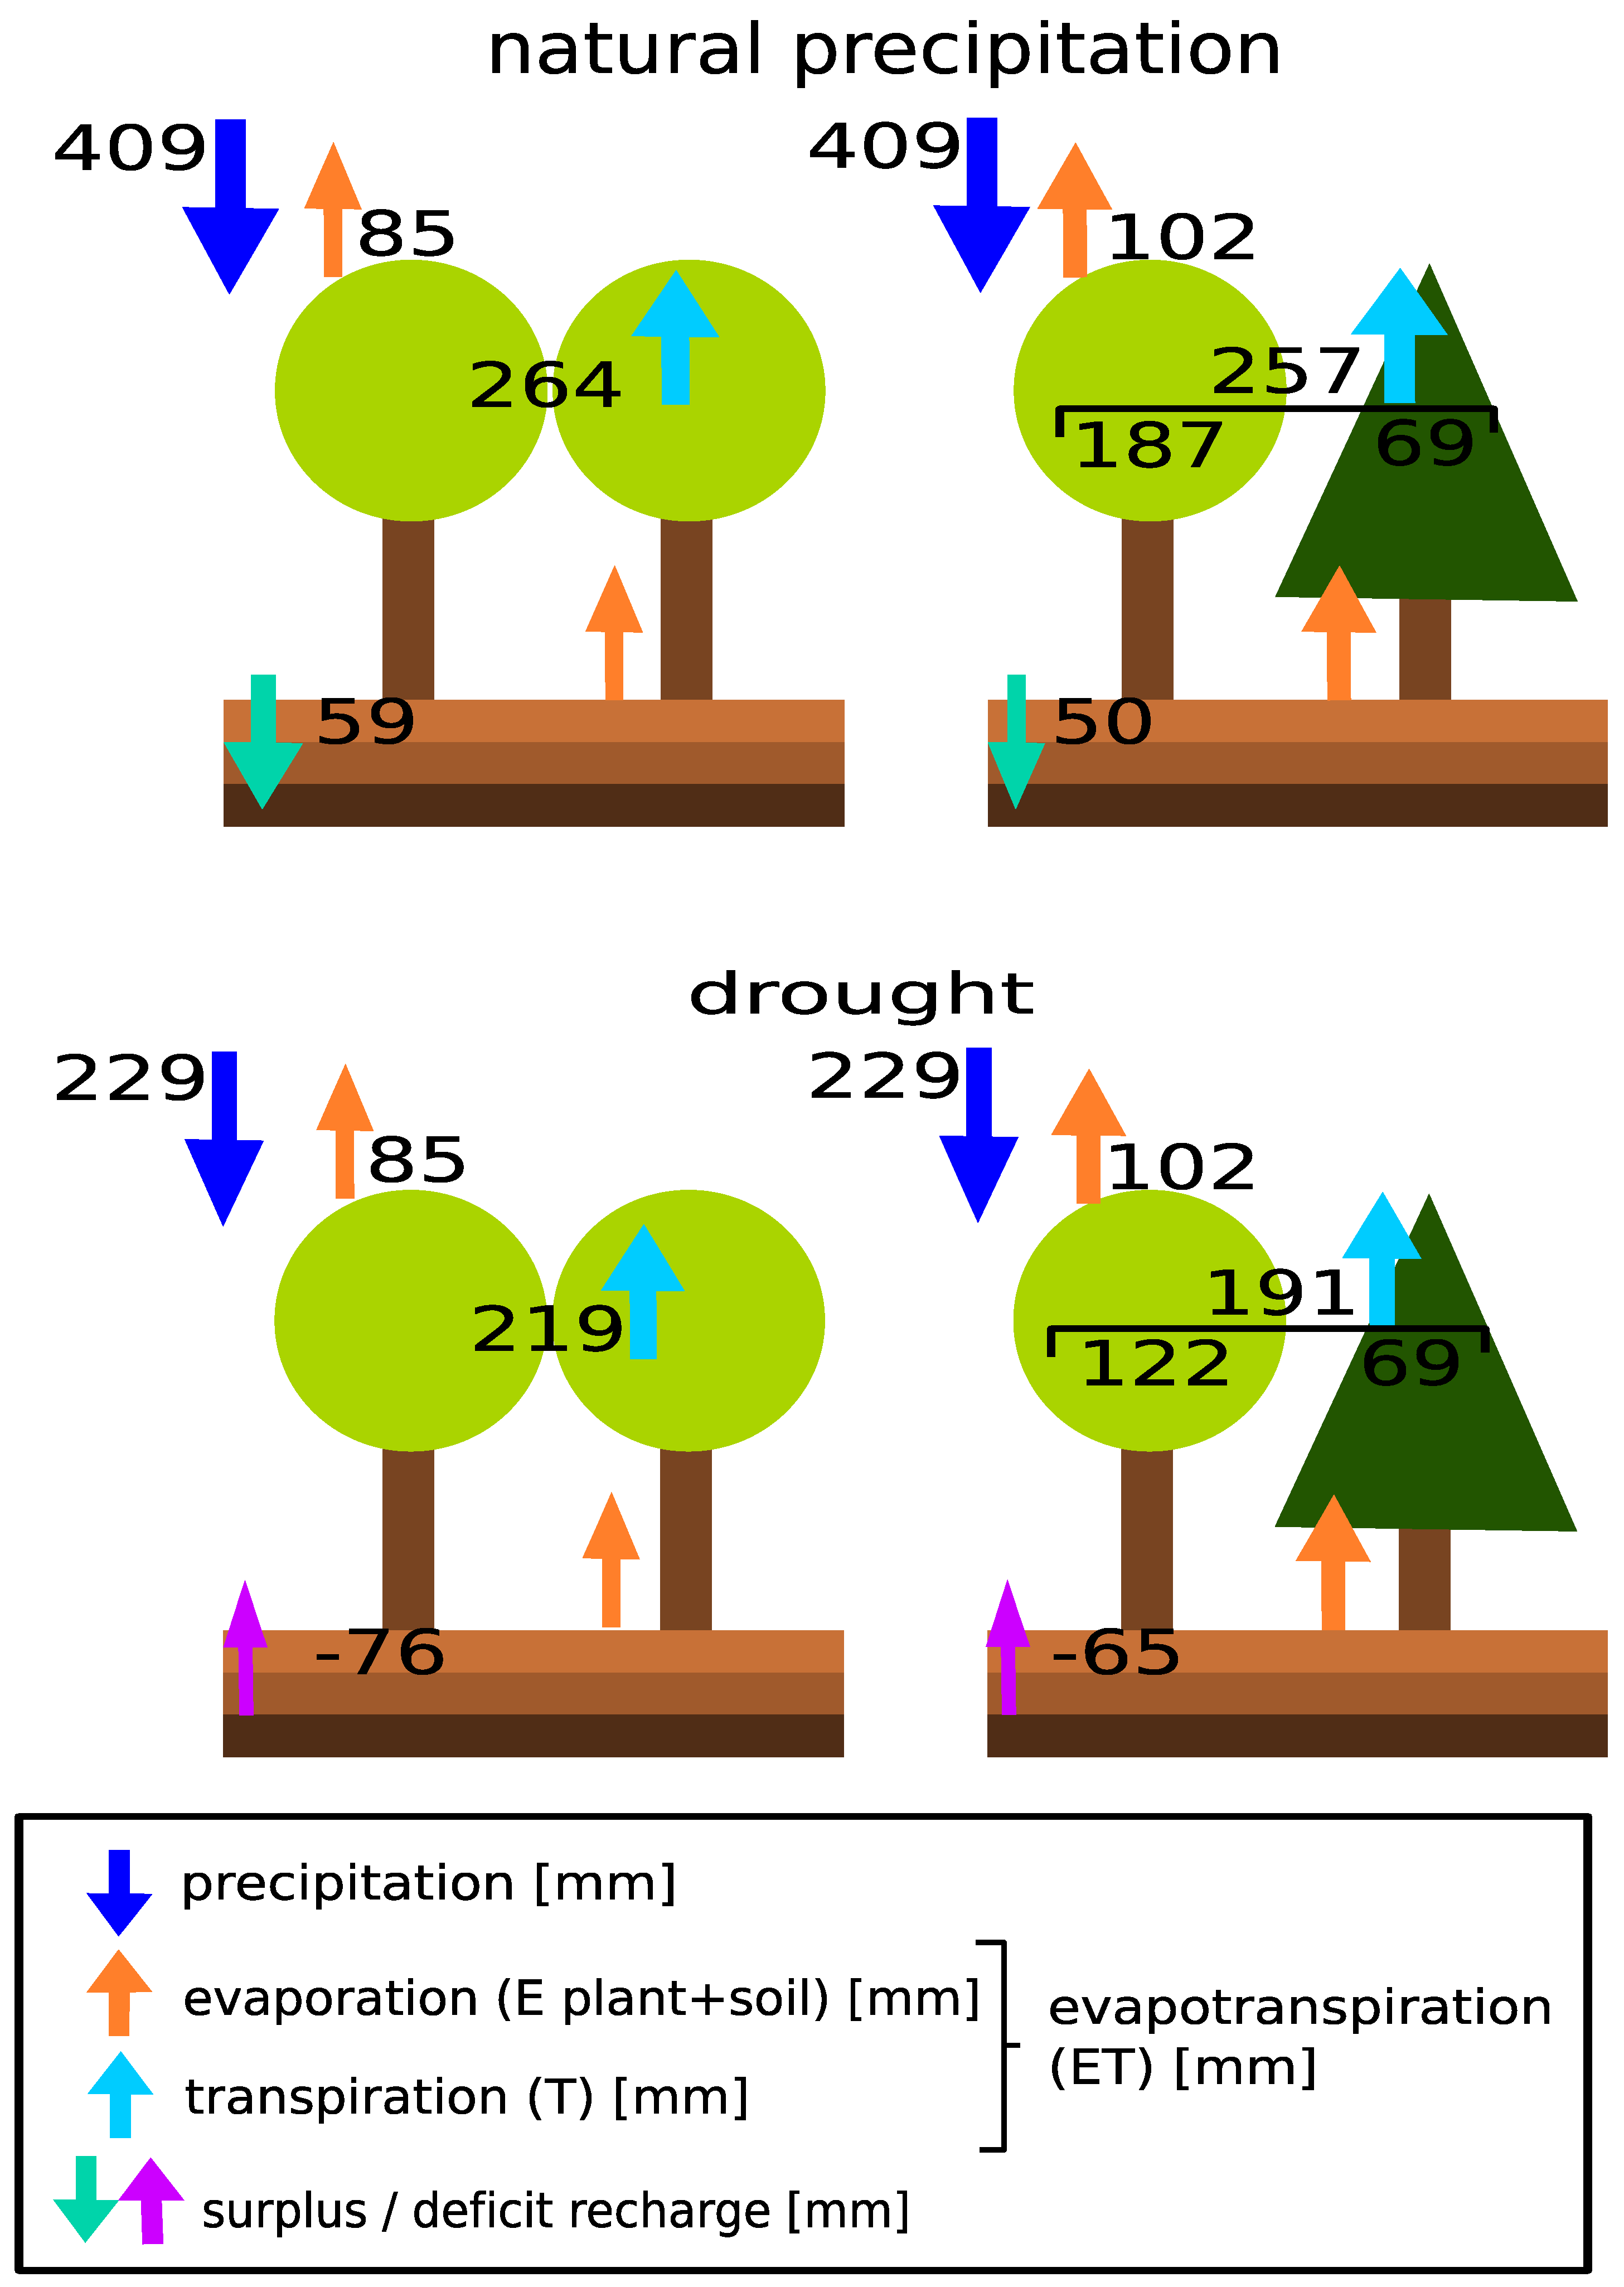
2.5. Stand Water Budget

We estimated stand water budgets, using a simplified approach of a hydrologic water balance:
R p o t = P E T
where Rpot is the potential water recharge rate for the specific forest stand, P is the amount of precipitation (m3 ha-1), and ET the evapotranspiration (m3 ha−1). This equation does not take into account the changes in soil water storage, nor considers stream-, surface- or groundwater runoff. However, since the variations in water storage are temporary and runoff in these mature forests is small, the simplified model is assumed to constitute a good indicator for the potential water recharge in pure- vs. mixed-beech forest stands during the vegetation period.
Precipitation (mm) derived from the closest weather station was rescaled to a 1 ha basis. Potential and actual evaporation (mm) was modeled using the LandscapeDNDC model [36] that has been refined to be applicable for forests (e.g., [37,38,39]), and is now featuring the PSIM model for aboveground ecosystem processes that is also able to consider various plant types or species simultaneously [40,41,42].

2.6. Statistics

Comparisons of means were either performed by an unpaired two-sample Wilcoxon test, or, when comparing more than two means, by the Kruskal–Wallis test with post hoc pairwise comparisons and adjustment for multiple testing (pairwise Wilcox test). This was required, as data did not follow normal distribution and neither revealed homogeneous variances. Correlations between sap flow rates and environmental data were conducted using Spearman’s rho (ρ), again due to the non-normality of the data. Therefore, sap flow data of each tree were correlated with environmental data over the whole measurement period separately for each hour of the day.
All Figures and statistics were computed using R version 3.5.2 [43].

3. Results

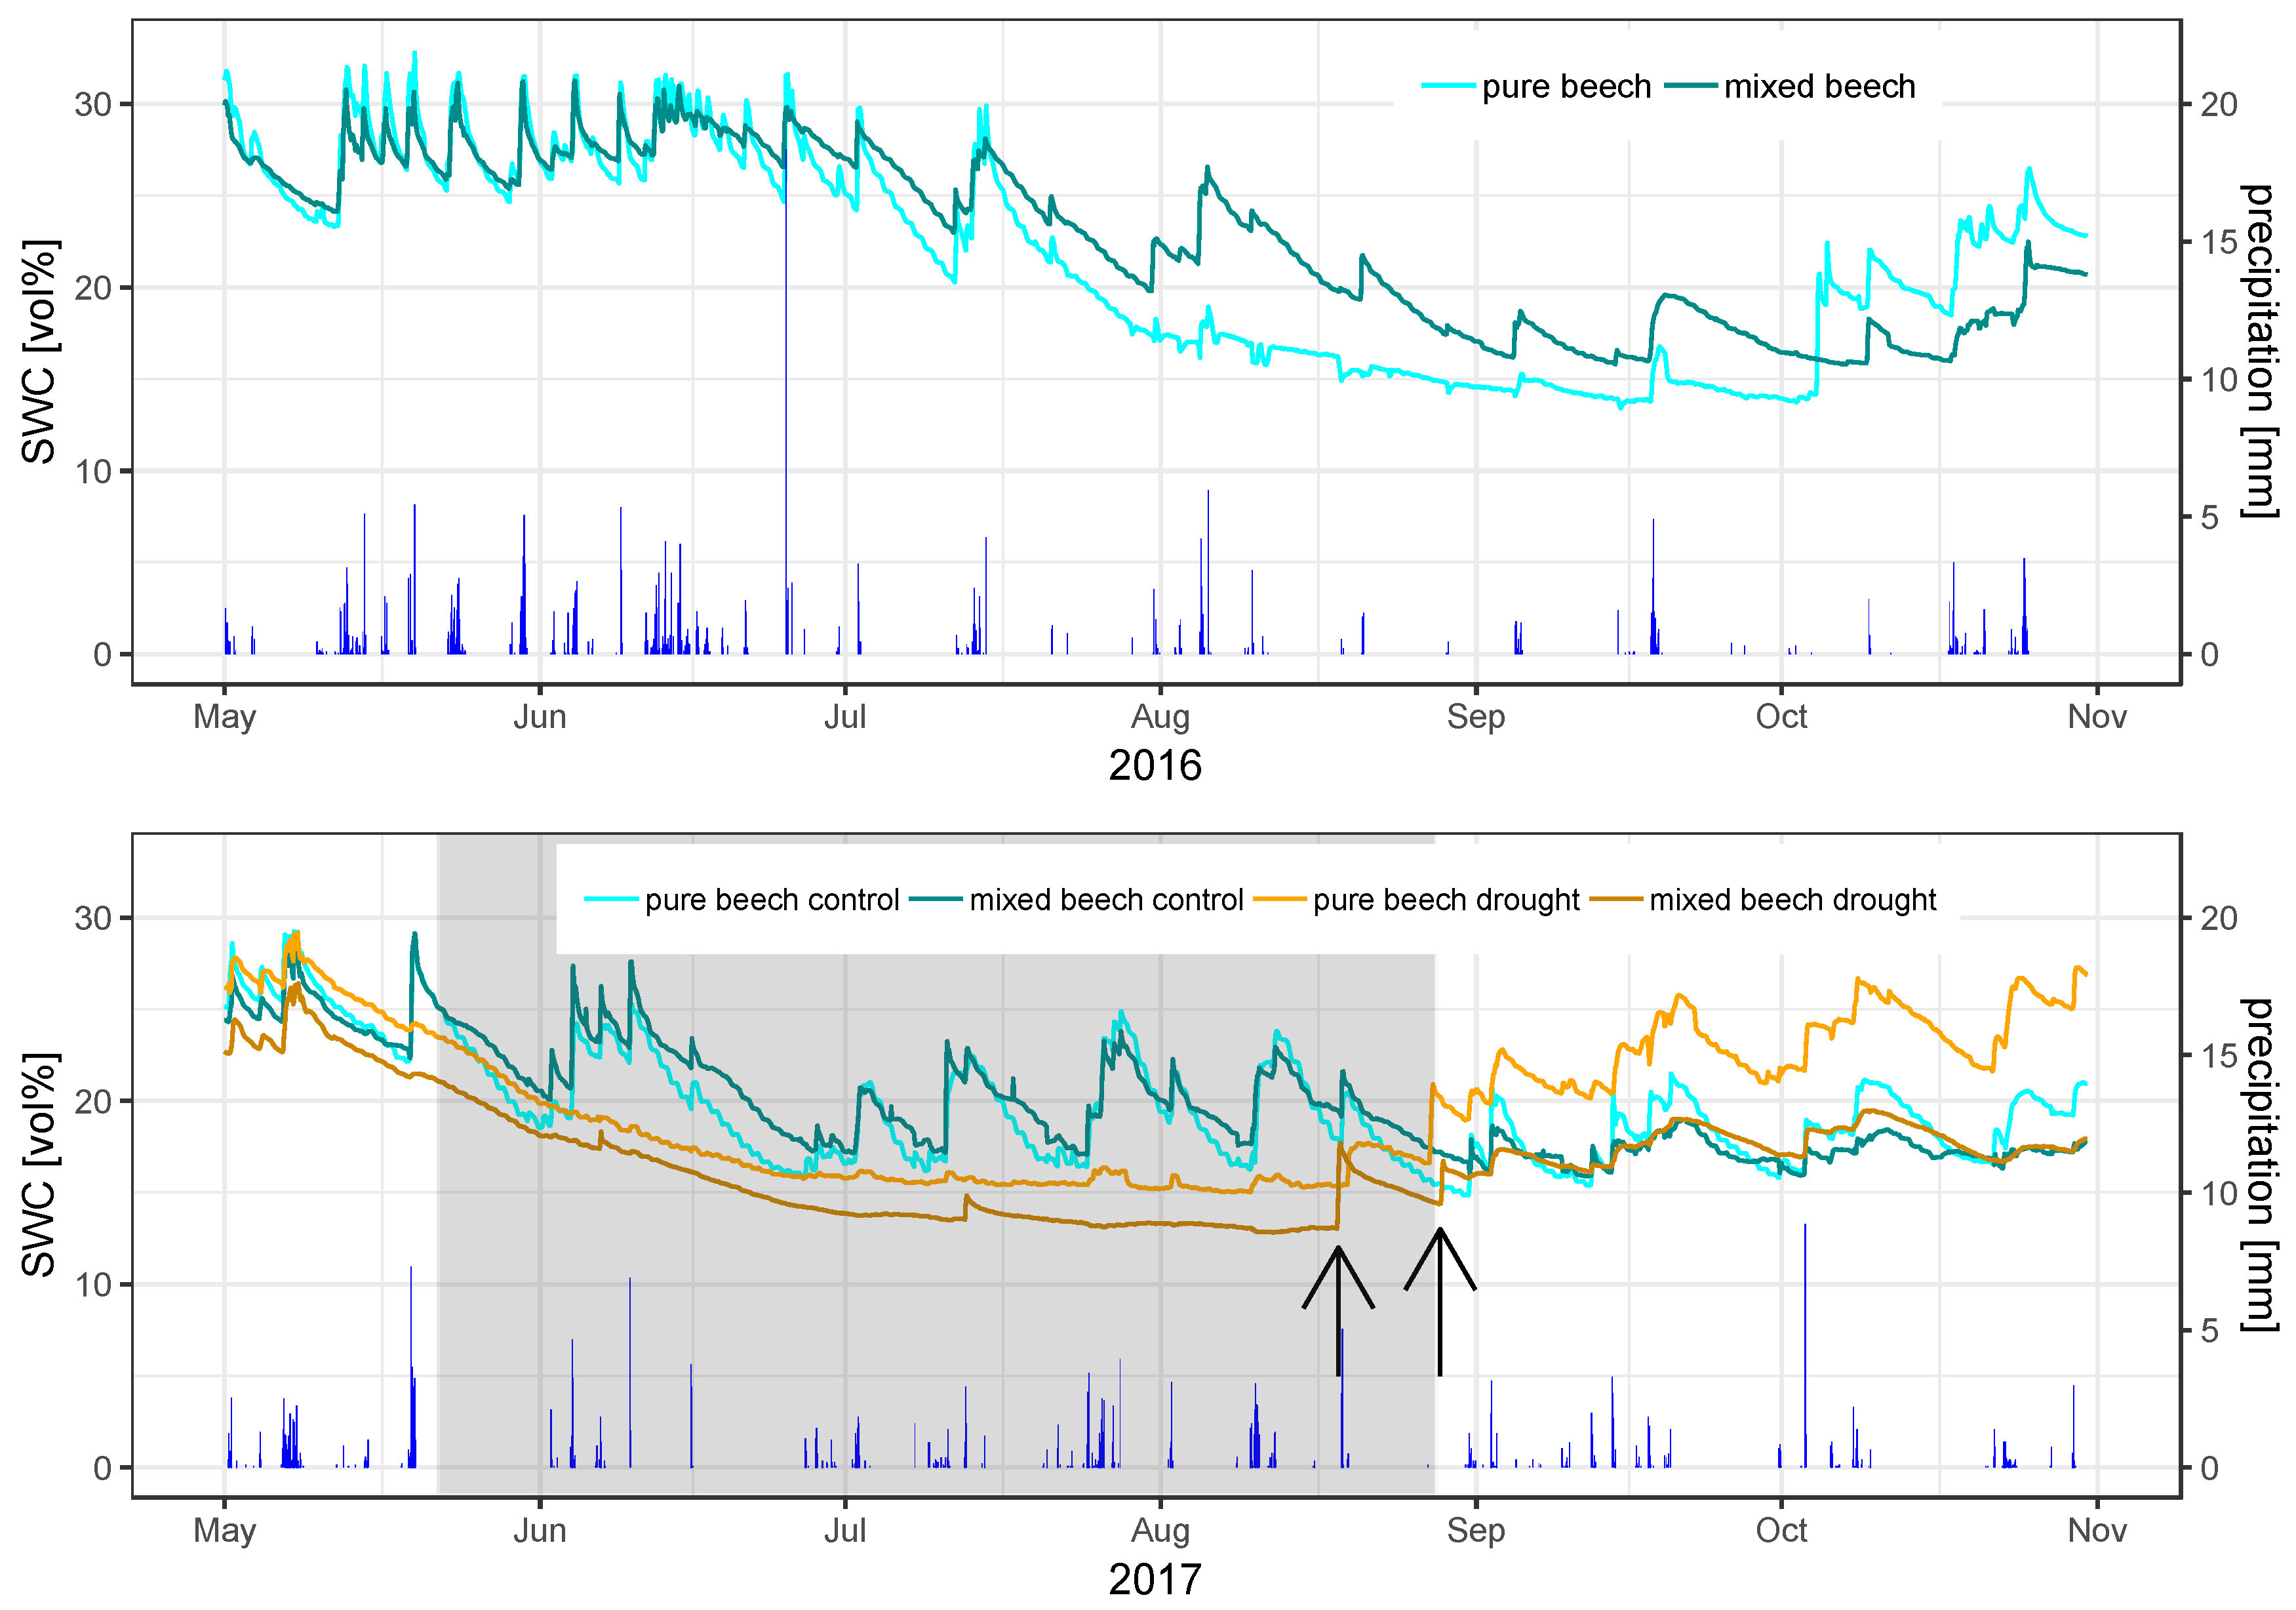
3.1. Meteorological and Soil Moisture Conditions

While the first half of the vegetation period (April–June) in 2016 was cold and wet as compared with the long-term average climate, in 2017 Tair was warmer than the long-term average of the area (Figures S3 and S4). Soil moisture in 2016 declined approximately 27 vol% from July onwards, reaching the lowest values of around 13 vol% in pure and approximately 15 vol% in mixed plots in September (Figure 1, upper panel). In 2017, soil moisture of the control plots (i.e., no rain exclusion) frequently dropped to low values (~15 vol%) varying in accordance with precipitation in both stand types (Figure 1, lower panel). In the plots subjected to rain exclusion, soil moisture steadily decreased from mid-May (installation of the roofs) until reaching lowest values in mid-July, and then remained low until the first irrigation event in mid-August.

3.2. Individual Tree Sap Flow Rates and Correlation with Environmental Parameters

The properties of the individual trees in which we installed sap flow sensors are shown in Table 1. DBH of beech ranged from 21.2 to 40.6 cm, whereas that of fir ranged from 21.5 to 47.4 cm. The resulting sapwood areas did differ between the species, because beech exhibits larger Sw at similar DBH as compared with fir. Thus, the largest sapwood area (926.1 cm2) belonged to a beech, even though it did not have the largest DBH (Table 1).
During the 2016 season, average tree water use was the highest in the pure beech plot (e.g., 159 L d−1 in June), closely followed by the beech in the mixed plots, while for fir it was the lowest throughout the season (except for May, when beech and fir in the mixed plot revealed similar mean sap flow (Table 2).
In 2017, beech trees in mixed plots (control) exhibited the highest mean water use throughout the season with the highest rates in June (189 L d−1, Table 3). Generally, trees in the control group revealed higher water use as compared to trees in the treatment (Table 3). Tree water use within the treatment decreased to ~70% and ~40% of the control in beech trees of the pure and mixed plots, respectively. After rewetting (end of August) the water use in the pure plot was similar to the control, while in the mixed plot water use amounted to only 30% to 40% of the control (Table 3).
The data show that irrespective of year, sap flow rates in beech trees were higher than in fir trees. The rain exclusion did decrease rates of sap flow in beech trees by more than half in the mixed plot, while in the pure plot the reduction was less severe. Sap flow of fir in 2017 was not reduced by rain exclusion below the 2016 control.
We correlated several environmental factors with the sap flow rates of every individual tree. Figure 2 exemplifies correlations over a daily course for one beech (15) and one fir (16), while the other trees of the same species revealed similar relationships with environmental parameters (see Figures S5 and S6). For both species, the vapor pressure deficit (VPD) was the key explanatory variable for daytime sap flow rates (ρ = 0.85 beech, ρ = 0.9 fir) and at night, this relationship did not change in beech, but fir showed a decline in correlation between 9 p.m. and 7 a.m. (Figure 2). Tair indicated a similarly strong relationship with sap flow for both species but not as pronounced as VPD (Figure 2). Global radiation (GR) revealed the third important relationship with sap flow in both species, strongly dependent on daytime (Figure 2). Soil moisture correlated negatively with both species in the morning hours (Figure 2).

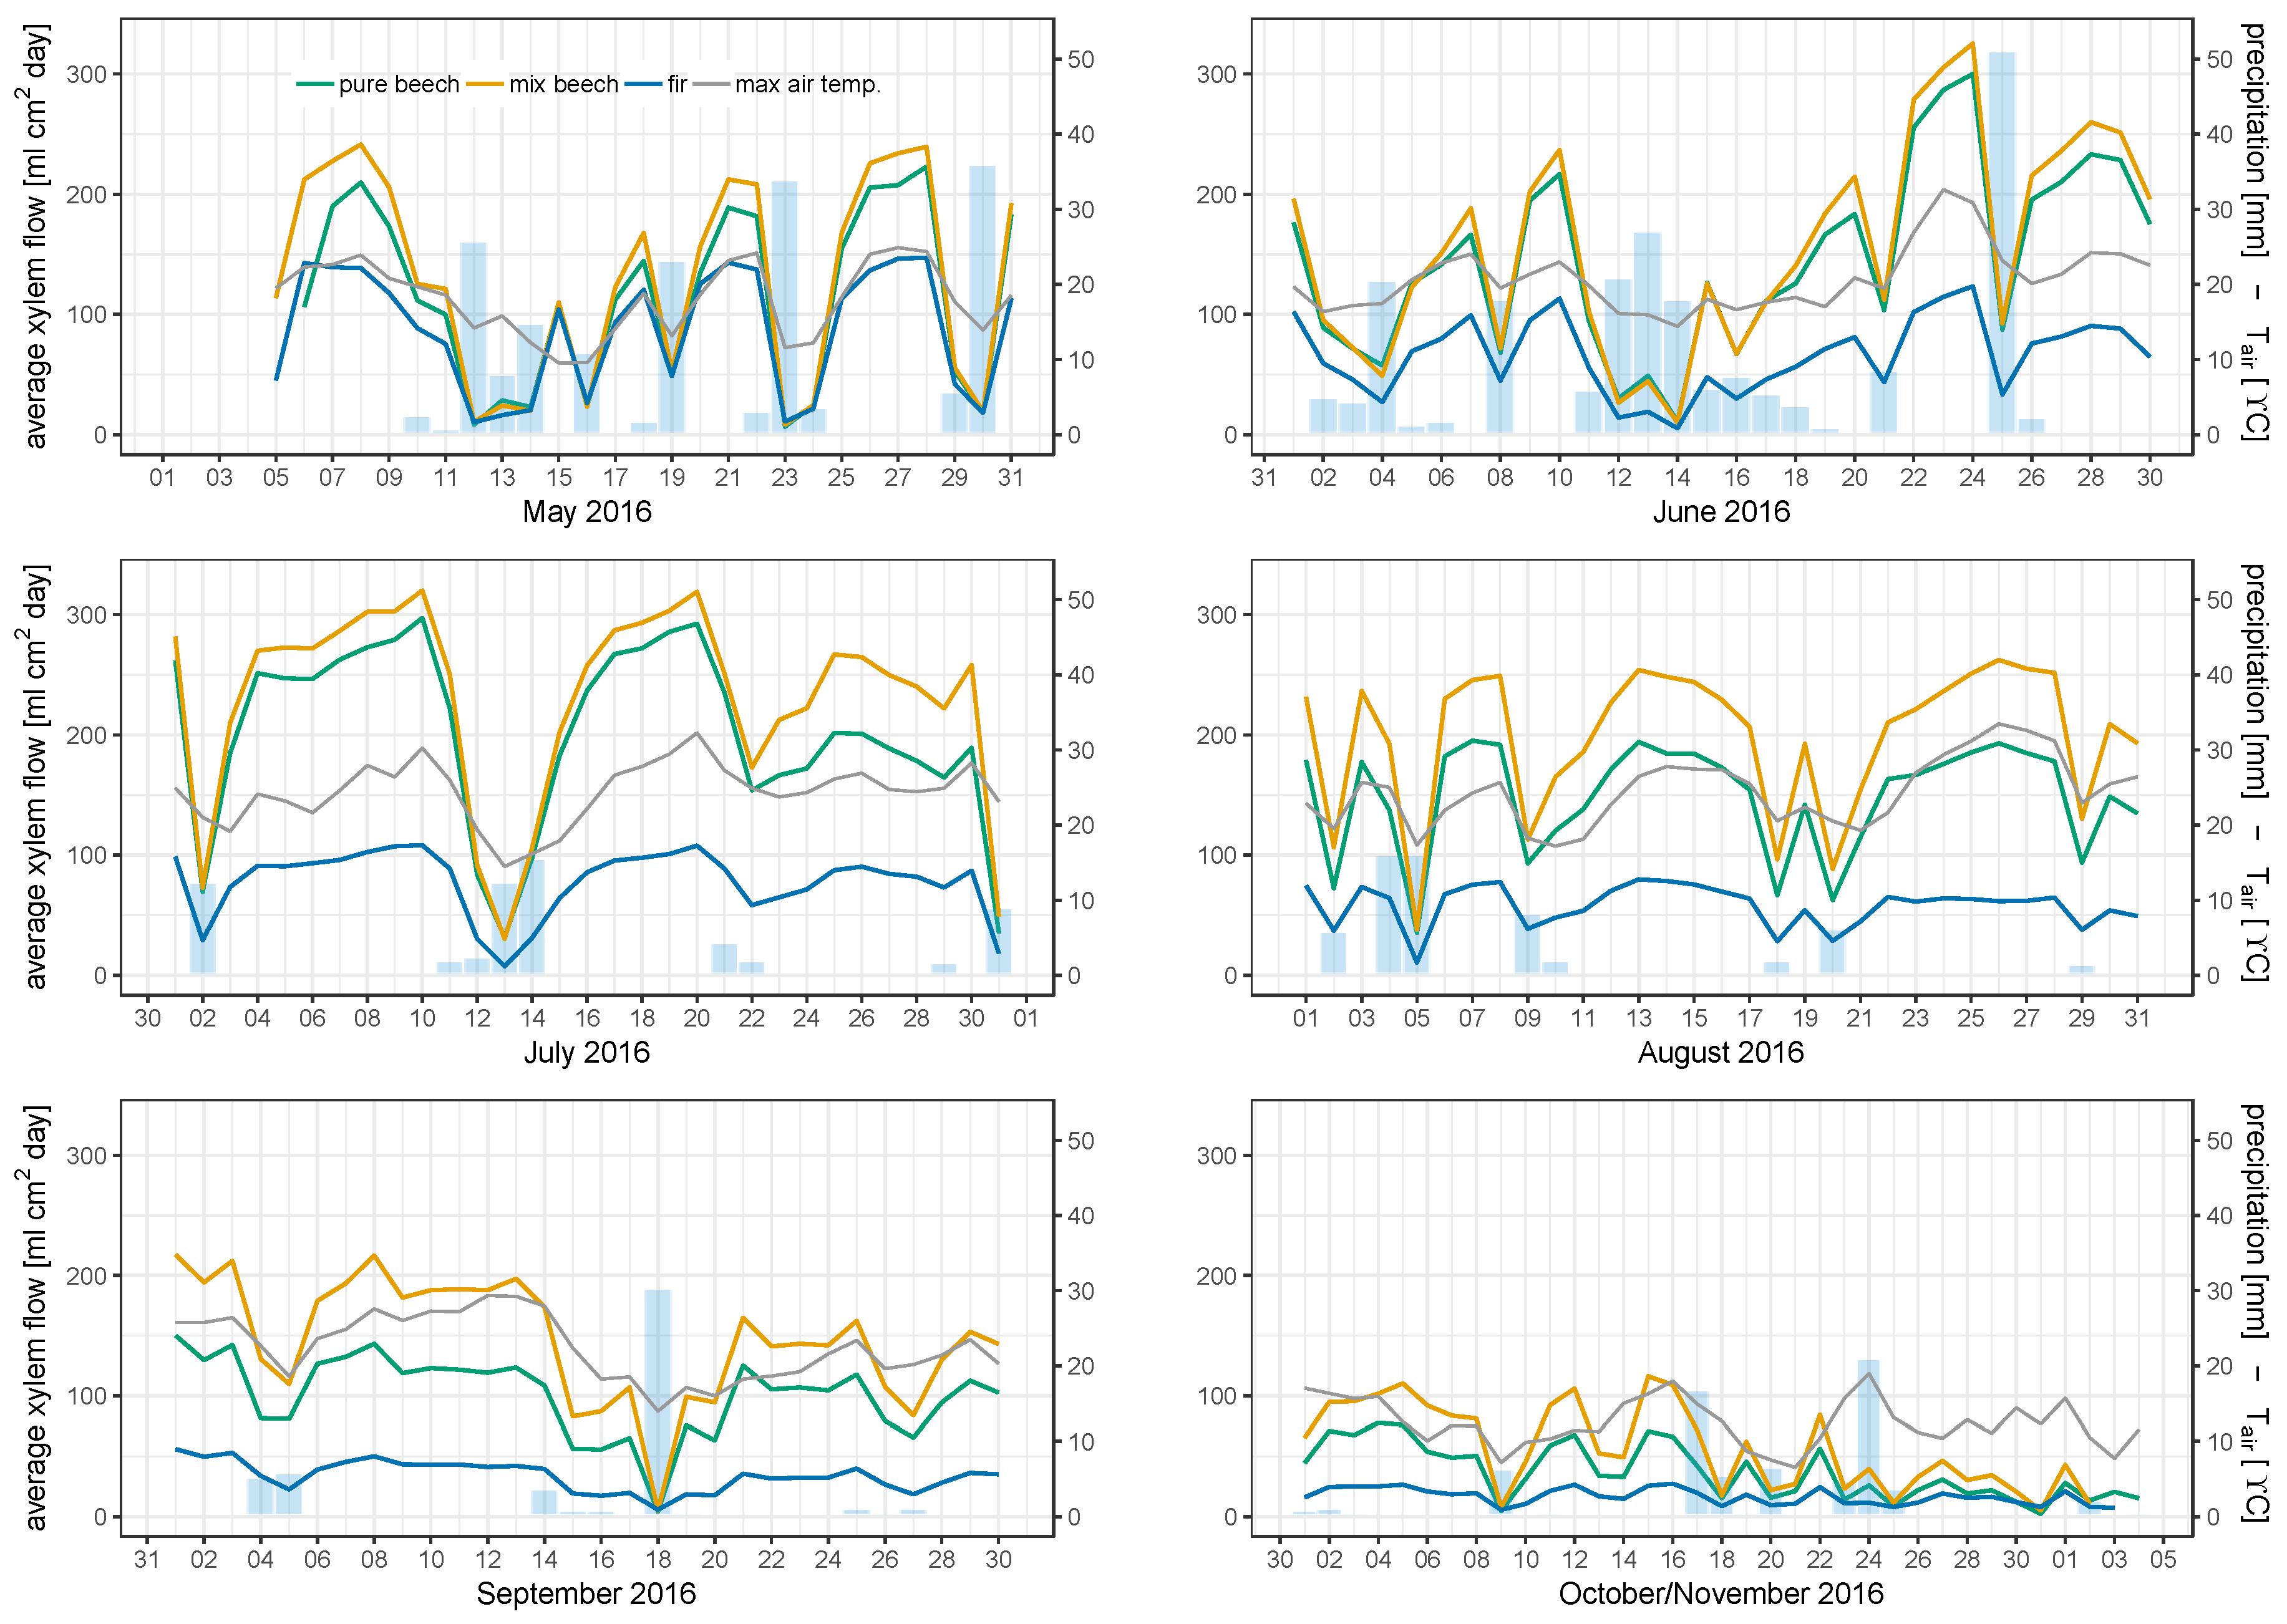
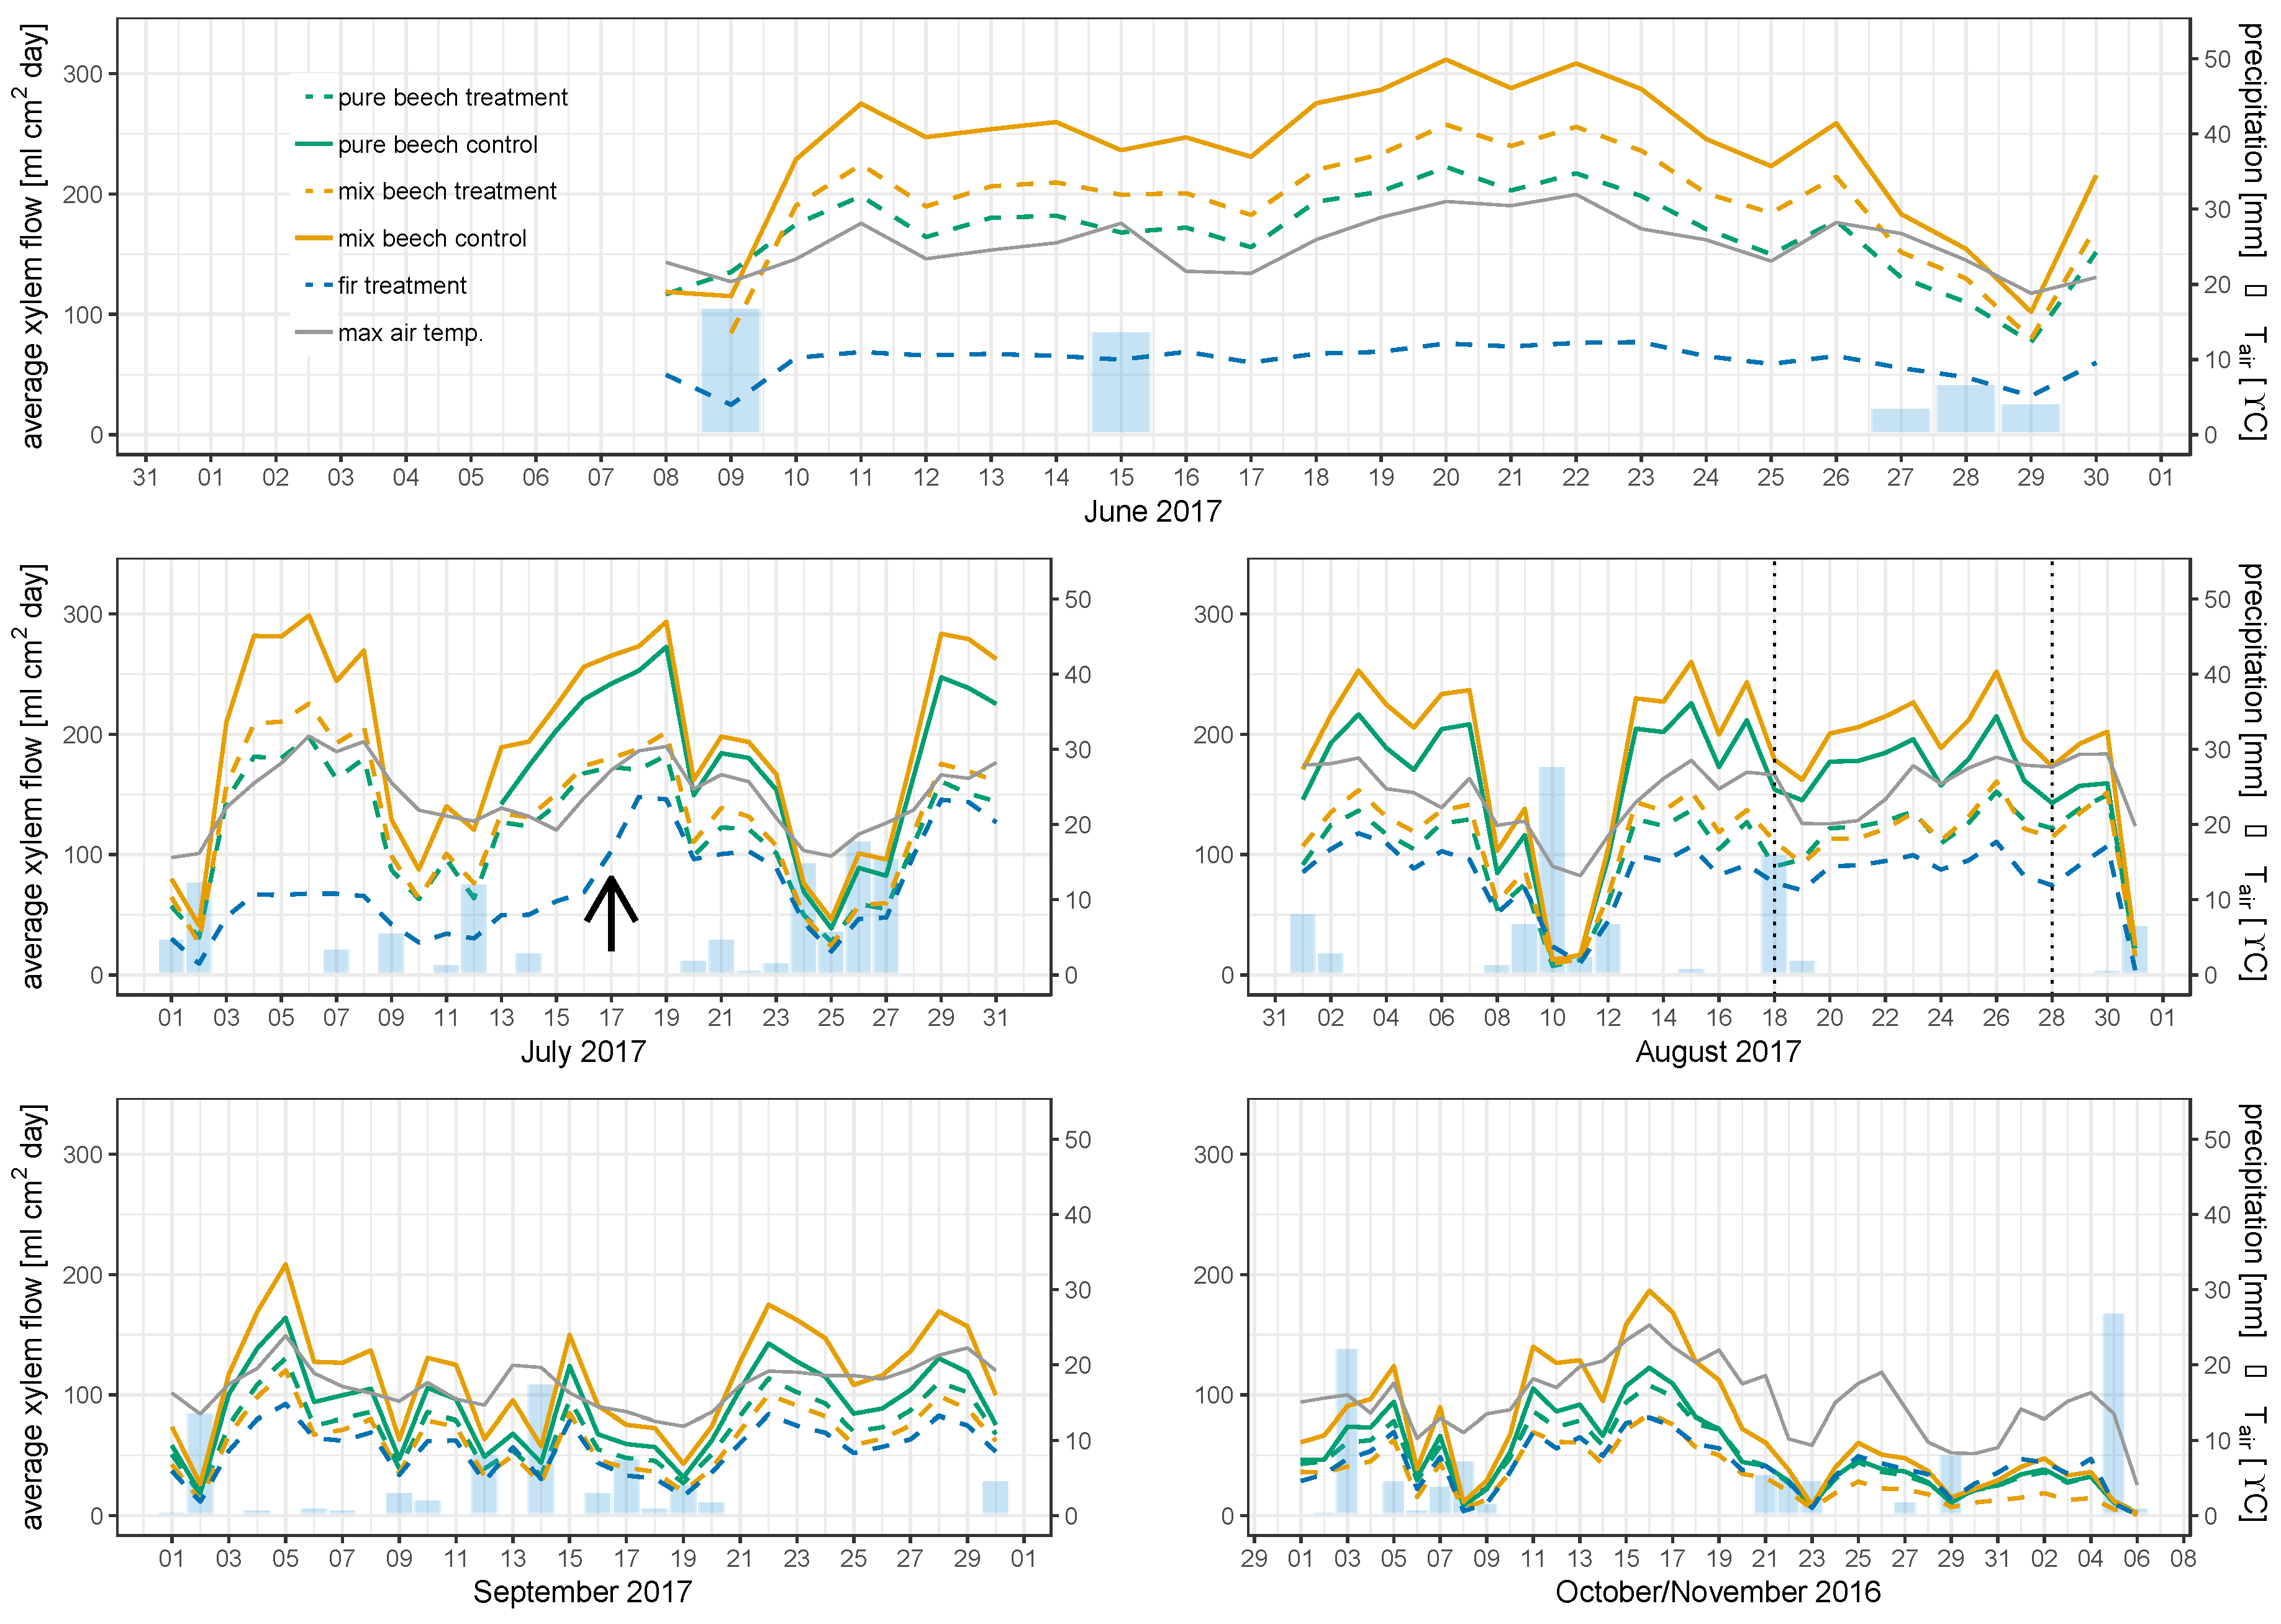
3.3. Mean Sap Flow Density

We calculated SFD (ml cm2 d−1) for each month, species and association to assess differences in flow irrespective of tree size (Figure 3 for 2016, Figure 4 for 2017). Figure 3 shows that 2016 late spring and early summer (May and June) were characterized by exceptionally high amounts of precipitation. In comparison, June 2017 was rather dry (Figure 4). In 2016, maximum air temperature follows the typical seasonal course (increase in spring towards summer and decreasing thereafter), whereas October 2017 was relatively warm, explaining SFD peaks in mid-October. Still, SFD followed the typical seasonal course in both years studied, i.e., increasing in early summer, peaking in summer (June and July), and decreasing towards fall. Additionally, we observed that SFD decreased significantly during rainfall events, the more when associated with a decrease in Tair, regardless of species and association.
When comparing SFD between species, we identified lower values for fir as compared with beech in both years (Figure 3 and Figure 4). In 2016, beech in the mixed plots showed higher tree water use as compared with beech in pure plots; these differences increased in summer and became smaller towards fall (Table 2, Figure 3). In 2017, we identified similar patterns, but beech in the treatment revealed lower water usage as compared with control trees. While SFD in the control of the mixed beech plot was higher as compared with the pure control, it was lower in the mixed treatment (Figure 4). The same was observed for the pure plot under treatment, which showed the lowest water use and SFD of all investigated plots during the rain exclusion (Table 3, Figure 4). In the pure control, low flow rates of beech recovered from approximately 70% of the control flow rates to 88% and 91% once soil moisture was restored upon rewatering, while in the mixed beech plot reduction of SFD intensified even more.
Rain exclusion reduced SFD of beech in both mixed and pure plots, and while flow rates in the pure plots almost reached the same levels as the control group, this was not the case for beech in the mixed plot.

3.4. Stand Water Use

Evaporation was calculated separately for pure and mixed plots and was higher in the mixed plots throughout the season (Table 4). Rates of evaporation modeled in May and June 2016 were highest, decreased thereafter until reaching a minimum in September (mixed) and October (pure) (Table 4). In contrast to evaporation, stand transpiration sums for each month were similar for both pure and mixed plots, except in July, where stand transpiration of the pure plot well exceeded that of the mixed plot (Table 4). Generally, transpiration followed the course of temperature and radiation by increasing from late spring into early summer, peaking in summer (July) and decreasing again thereafter (Table 4).
In 2017, we manipulated the hydrologic regime for part of both pure and mixed beech plots by excluding precipitation for June, July, and most of August. The highest amount of precipitation was observed in July 2017 and the lowest in June (Table 5); while the overall amount of precipitation was decreased when compared to 2016 and it was more evenly distributed over the vegetation period in 2017 (Table 5, Figure S3 available as Supplementary Data at Forests Online). Similar to 2016, modeled evaporation indicated higher rates for the mixed plot, with highest rates in July for both, pure and mixed plots in 2017 (Table 5). Regardless of treatment, stand transpiration followed the development of climate conditions similar to that in 2016 (Table 5). Again, daily means of transpiration were significantly higher in the pure beech plot than in the mixed beech-fir plot in the control groups. When comparing the treatment groups among each other, transpiration was lower in the mixed plot for the whole measurement period, but this difference was only significant in June (Table 5). Rain exclusion considerably lowered the stand transpiration in both pure and mixed beech-fir plots, during the period of roof coverage (except for the mixed plot in July, Table 5). Stand transpiration between pure beech in 2016 and 2017 (control) was not significantly different, while in the mixed plots daily means of stand transpiration were lower in July and September, and higher in August of 2017 (Table 4 and Table 5).
Evapotranspiration in pure versus mixed beech plots did not differ significantly either in 2016, 366 and 349 mm, respectively (June through October) or in 2017 (control plots, 314 and 359 mm, respectively (June through October). The higher stand transpiration rates of the pure beech plot were almost compensated by the higher evaporation rates in the mixed plots, so that evapotranspiration was similar. The treatment in 2017 had a significant influence on the stand transpiration rates in both pure and mixed plots, and decreased evapotranspiration rates in comparison to the control plots (i.e., pure beech, control 314 vs. treatment 305 mm and mixed beech, control 359 vs. treatment 294 mm).

4. Discussion

In a year with higher than average precipitation, we found the water use of the mixed plot exceeded that of the pure plot, indicating a competition reduction of water use for beech in the mixed plot with silver fir. During times with no precipitation we found the rates of evapotranspiration in a mature mixed plot to be smaller as compared with a pure plot, which is unlikely to be due to a higher water use efficiency of beech in the mixed stand, but rather to restricted hydraulic conductivity of its root system, making this mixed stand less resilient towards drought.

4.1. Sap Flow of Individual Trees Provide a Good Estimate for Upscaling to Stand Transpiration

With the present setup of sap flow sensors, we covered sap wood depths to 27 mm from below the bark and estimated a linear decrease from there to the sap wood boundary. Sap flow rates calculated with this approach were in the same range as data obtained for beech on the Swabian Alb [44], in northern Brandenburg [45], or in southern Bavaria [46]. Annual transpiration rates of beech estimated in a Central European beech forest ranged from 213 to 421 mm year−1 [47]. Even though we obtained sap flow data only from May to October (2016), this range covers the vegetation period of beech almost entirely and, hence, our estimate for the transpiration of beech trees in the pure plot of 337 mm year−1 is well in the range previously reported [47,48].
Much less is known about the water use of silver fir, but SFDs determined in our study are similar to those obtained in previous studies [49,50]. Nourtier et al. [50] claimed that sap flux densities obtained in their study of 0.2 to 1 L dm−2 h−1 ranged below the values previously obtained for other conifers of approximately 1 to 2 L dm−2 h−1 [28,51,52]. Our findings support the reported sap flow densities by Nourtier et al. [49,50], indicating that SFDs of silver fir are in fact lower than that of other conifers.
Additional support for the consistency of the present transpiration data with previous studies was provided by the LandscapeDNDC model that provided not only evaporation data for the upscaling approach, but also simulated transpiration of the pure and mixed plots (see Section 2.5). Differences in sums of transpiration simulated by the model and measured were almost negligible (Table 6), supporting the assumption that the obtained sap flow rates are suitable for upscaling water uptake to the stand level.

4.2. Sap Flow of Beech Trees in Pure and Mixed Stands Differs Considerably

It has previously been reported that sap flow rates of trees in mixture differ from those of monospecific stands [53,54]. In the present study this is confirmed for pure and mixed plots as sap flux densities of beech in the pure plot were significantly smaller as compared with beech in the mixed plot in both 2016 and 2017 (control). Beech, is considered a more anisohydric species (i.e., delaying stomatal closure and maintenance of photosynthesis during times of water shortage) and it is known for its low self-tolerance in monospecific stands [55]. Thus, the mixture with silver fir likely means a reduction of competition stress for beech regarding resources [56,57], which is supported by the higher SFDs of beech in mixture observed in our study. This reduction of competition in the mixed plot can have more than one reason. For one, in a pure beech stand, the monolayered structure can change in a multilayered structure in the mixture with e.g., fir [58], thereby altering the access to light. More importantly, it can alter the access to soil water as firs are considered to develop and maintain a taproot system [24] that was previously found to root preferably between 20 and 80 cm soil depth [59]. Beech on the other hand mostly exploits soil layers between 0 and 30 cm [60,61,62]. Hence, reduced intraspecific competition (compared to the pure beech plot) for soil water from the same soil layers might explain the increased transpiration rate of beech in the mixed plot, even more so as the mixed stand did reveal a higher tree density. This higher density was partly compensated by the smaller diameter of beech trees in the mixed stand, with beech often not being the dominant species as opposed to the pure stand. Complementary water use has been reported for mixed stands of Quercus petraea and Pinus sylvestris, relieving drought stress as compared with each species growing in pure stands [63]. In a mixed oak beech forest, Zapater et al. [64] found evidence of oak utilizing water from soil layers as deep as 0.95 m, while beech was not able to shift its water uptake depth towards deeper soil layers with progressing soil drought. Theoretically, beech also profited belowground from the lower water usage of the more isohydric fir (i.e., closing stomates at water limitation) during times of short-term soil water depletion [65]. Hydraulic lift (HL) potentially conducted by fir through their taproot system [23,24] might be an additional asset in the mixed beech-fir stand. HL is the redistribution of water obtained by roots in (deeper) moister soil layers into more (shallow) dry soil layers [66]. With this process water distributed by fir from deeper and moister soil layers to more shallow and dryer soil layers, where beech has access, might release short-term drought stress not only for fir trees, but also for beech trees and, furthermore, can facilitate the performance of beech trees in the mixed stand [53]. We previously found an indication that silver fir presence released water stress in beech trees from δ13C (ratio between 13C/12C isotopes) signatures of beech leaves [67] and could now partially explain how the mixture with fir lead to depleted δ13C signatures in beech leaves.
Nevertheless, the higher sap flux densities of beech in mixture did not result in higher transpiration rates in the mixed plot, as the sapwood area of beech in the mixed plot was smaller than in the pure plot. We were, thus, unable to confirmed hypothesis one, as transpiration rates in the mixed plot were not significantly smaller than at the pure plot, likely due to the reduced intraspecific competition of beech, overcompensating the isohydric water use of fir. Transpiration rates of beech trees well exceed those of fir trees but evapotranspiration (ET) rates in the mixed plot were similar to those in the pure plot (±20 mm) in 2016 and 2017 (control). This effect was, in addition to the aforementioned similar transpiration rates, also due to higher interception rates in fir and, consequently, higher evaporation rates from surfaces as compared with the pure beech plots, as also reported for Norway spruce [68]. It is conceivable that the higher interception rates also apply to fir, as they reveal similar characteristics in crown structure and phenology as Norway spruce. Generally, it has been reported that interception rates for deciduous trees rate below 25%, whereas for conifers interception rates can add up to 40% [69,70].

4.3. Rain Exclusion Superimposes Facilitation in Mixed Stands

The rain exclusion treatment during the vegetation period 2017 caused reduced sap flow densities, and therefore transpiration rates in both pure and mixed plots to varying extents. Apparently, silver fir was not severely affected by the precipitation exclusion, as the sum of transpiration from June to October is the same in the vegetation period of 2016 and the precipitation exclusion treatment in 2017. This is explainable considering the more isohydric strategy of fir towards drought, and by the access of fir to deeper and moister soil layers with their taproot [24] and, hence, the avoidance of competition for water with beech by spatial partitioning of soil water uptake [71,72]. From this result we can confirm hypothesis two, as fir transpiration indeed was little affected by rain exclusion.
Gebauer et al. [54] found that the annual sums of canopy transpiration in a dry year were similar for three investigated stands (pure beech, mixed beech-ash-linden, and mixed beech-ash-linden-maple-hornbeam), while they were different in the moist year. They concluded that tree stands (i.e., mixed and pure stands) converge in their water use in drier seasons [54,73]. The similar sums of transpiration rates obtained in our study at the end of the water exclusion support this conclusion, since we observed 20% to 30% reduced rates of transpiration in beech in both the pure and the mixed plots during the rain exclusion as compared with the control plots. Nevertheless, after rewetting the reduction in transpiration of beech in the mixed plot increased to −52%, while in the pure plot it recovered to −9% as compared with the control, respectively. Hence, the question arises, why the reduction of transpiration in beech in the mixed plot was so much higher after rewetting?
This may partially be explained by the exhaustion of the soil water pool at the mixed plot, revealing a stronger depletion of soil water as compared with the pure plot. This soil water depletion could have caused cavitation of vessels in the root system of beech trees leading to lower hydraulic conductivity during water uptake, eventually facing severe damage of the root system further impairing water and nutrient relations [74]. As well, since the fine root biomass is likely to be most affected by the drought, fine root biomass die-off could have increased hydraulic resistance in the root system additionally impairing water uptake [22]. Fir, as a conifer species, transpires water throughout the year (when conditions are favorable), and hence provides an additional water user in the mixed plot. This can become particularly critical by the end of summer, when soil water becomes depleted and beech reduces its transpiration (due to decreases in radiation, temperature, and VPD), but fir does not. This advantage of conifers over deciduous species is likely to have caused the additional decrease in soil moisture during the treatment and can additionally explain the lower soil moisture conditions after rewetting in the mixed as compared with the pure plot. Similarly, Rötzer et al. [68] found soil moisture beneath a Norway spruce stand to decrease earlier and longer as compared with a beech stand, as soil became depleted with the onset of photosynthesis in Norway spruce. The same possibly applies to other conifers such as fir. As transpiration rates were similarly decreased during the rain exclusion treatment, we had to reject hypothesis three, as rain exclusion in both plots lead to a similar reduction of water use in beech. The rewetting though had an influence on the mixed plot, which was almost exclusively accountable to beech.

5. Conclusions

Facing climate change impacts, such as drought on forested ecosystems, silviculture management strives to enhance resilience of forest stands. The frequent observation of overyielding in mixed forest stands as compared with the respective pure stand [16,56,75,76], indicated one way to achieve higher resilience. Here, we investigated the water balance comparatively in pure beech and mixed beech-fir stands during times with above average precipitation and during drought. Figure 5 illustrates and highlights the basic processes of the stand water balance. While during times of above average precipitation, transpiration in both pure and mixed beech stands can be completely supported, drought disrupts the water balance in both stands severely (Figure 5). On the one hand, the mixed stand uses less water in comparison to the pure beech stand, which results in a smaller potential soil water deficit. On the other hand, this lower water utilization of the mixed beech-fir stand was probably not initiated by increased water use efficiency of beech, but rather by severely decreased hydraulic conductivity of its root system. Nevertheless, the results of this work are limited to the study site, and miss replication, as factors such as soil type and location, as well as history and management are likely to influence the performance of pure and mixed stands.
Hence, we conclude that mixed beech-fir stands at this site did not indicate higher resilience towards drought, although their water use was lower in comparison to the pure beech stand, and call at the same time for further studies investigating stands on different sites, with different soil and climatic conditions.

Supplementary Materials

The following are available online at https://www.mdpi.com/1999-4907/10/10/897/s1.

Author Contributions

Conceptualization, R.-K.M., T.B., and H.R.; data curation, R.-K.M., B.B., and R.G.; formal analysis, R.-K.M.; funding acquisition, H.R.; investigation, R.-K.M., and S.P.; methodology, R.-K.M. and S.P.; project administration, T.B. and H.R.; resources, T.B.; supervision, H.R.; visualization, R.-K.M., and B.B.; writing—original draft, R.-K.M.; writing—review and editing, B.B., R.G., T.B., S.P., and H.R.

Funding

The present study is part of the project “Buchen-Tannen-Mischwälder zur Anpassung von Wirtschaftswäldern an Extremereignisse des Klimawandels (BuTaKli)” within the program “Waldklimafonds” (No. 22WC106901) which was financially supported via the Fachagentur Nachwachsende Rohstoffe (FNR), Germany, by the Bundesministerium für Ernährung und Landwirtschaft (BMEL) and the Bundesministerium für Umwelt, Naturschutz, Bau und Reaktorsicherheit (BMUB) based on the decision of the German Federal Parliament.

Acknowledgments

The authors express their gratitude to Michael Ritter and Martin Burger for their help with the sap flow sensor installation and maintenance. Without their help and support, this study would not have been possible. The stand inventory data were kindly provided by Julia Schwarz from the Chair of Silviculture at the University of Freiburg.

Conflicts of Interest

The authors declare no conflict of interest. The funders had no role in the design of the study; in the collection, analyses, or interpretation of data; in the writing of the manuscript, or in the decision to publish the results.

References

  1. Keenan, R.J. Climate Change Impacts and Adaptation in Forest Management: A Review. Ann. For. Sci. 2015, 72, 145–167. [Google Scholar] [CrossRef]
  2. Seppala, R.; Buck, A.; Katila, P. (Eds.) Adaption of Forests and People to Climate Change—A Global Assessment Report; International Union of Forest Research Organizations (IUFRO): Helsinki, Finland, 2009; Volume 22. [Google Scholar]
  3. Kliwa. Klimawandel in Suddeutschland Veranderungen von Meteorologischen Und Hydrologischen Kenngroßen Klimamonitoring Im Rahmen Der Kooperation; KLIWA: Berlin, Germany, 2016. [Google Scholar]
  4. Rennenberg, H.; Seiler, W.; Matyssek, R.; Gessler, A.; Kreuzwieser, J. European Beech (Fagus sylvatica L.)—A Forest Tree without Future in the South of Central Europe. Allg. For. Und Jagdztg. 2004, 175, 210–224. [Google Scholar]
  5. Lindner, M.; Maroschek, M.; Netherer, S.; Kremer, A.; Barbati, A.; Garcia-Gonzalo, J.; Seidl, R.; Delzon, S.; Corona, P.; Kolström, M.; et al. Climate Change Impacts, Adaptive Capacity, and Vulnerability of European Forest Ecosystems. For. Ecol. Manag. 2010, 259, 698–709. [Google Scholar] [CrossRef]
  6. Intergovernmental Panel on Climate Change (IPCC). Climate Change 2013—The Physical Science Basis; Cambridge University Press: Cambridge, UK, 2014. [Google Scholar]
  7. Millar, C.I.; Stephenson, N.L.; Stephens, S.L. Climate Change and Forest of the Future: Managing in the Face of Uncertanity. Ecol. Appl. 2007, 17, 2145–2151. [Google Scholar] [CrossRef] [PubMed]
  8. Griess, V.C.; Knoke, T. Bioeconomic Modeling of Mixed Norway Spruce-European Beech Stands: Economic Consequences of Considering Ecological Effects. Eur. J. For. Res. 2013, 132, 511–522. [Google Scholar] [CrossRef]
  9. Griess, V.C.; Acevedo, R.; Härtl, F.; Staupendahl, K.; Knoke, T. Does Mixing Tree Species Enhance Stand Resistance against Natural Hazards? A Case Study for Spruce. For. Ecol. Manag. 2012, 267, 284–296. [Google Scholar] [CrossRef]
  10. Lebourgeois, F.; Gomez, N.; Pinto, P.; Mérian, P. Mixed Stands Reduce Abies Alba Tree-Ring Sensitivity to Summer Drought in the Vosges Mountains, Western Europe. For. Ecol. Manag. 2013, 303, 61–71. [Google Scholar] [CrossRef]
  11. Pretzsch, H.; Schütze, G.; Uhl, E. Resistance of European Tree Species to Drought Stress in Mixed versus Pure Forests: Evidence of Stress Release by Inter-Specific Facilitation. Plant Biol. 2013, 15, 483–495. [Google Scholar] [CrossRef]
  12. Bundesministerium Für Ernährung Und Landwirtschaft (BMEL). Der Wald in Deutschland: Ausgewählte Ergebnisse Der Dritten Bundeswaldinventur; Bundesministerium für Ernährung und Landwirtschaft: Berlin, Germany, 2014. [Google Scholar]
  13. Puettmann, K.J.; Coates, K.D.; Messier, C. A Critique of Silviculture. Managing for Complexity; Island Press: Washington, DC, USA, 2008. [Google Scholar]
  14. Holling, C.S. Resilience and Stability of Ecological Systems. Annu. Rev. Ecol. Syst. 1973, 4, 1–23. [Google Scholar] [CrossRef] [Green Version]
  15. Paluch, J.G.; Gruba, P. Effect of Local Species Composition on Topsoil Properties in Mixed Stands with Silver Fir (Abies alba Mill.). Forestry 2012, 85, 413–426. [Google Scholar] [CrossRef]
  16. Pretzsch, H.; Bielak, K.; Block, J.; Bruchwald, A.; Dieler, J.; Ehrhart, H.P.; Kohnle, U.; Nagel, J.; Spellmann, H.; Zasada, M.; et al. Productivity of Mixed versus Pure Stands of Oak (Quercus petraea Matt.) Liebl. and Quercus robur L.) and European Beech (Fagus sylvatica L.) along an Ecological Gradient. Eur. J. For. Res. 2013, 132, 263–280. [Google Scholar] [CrossRef]
  17. Zang, C.; Hartl-Meier, C.; Dittmar, C.; Rothe, A.; Menzel, A. Patterns of Drought Tolerance in Major European Temperate Forest Trees: Climatic Drivers and Levels of Variability. Glob. Chang. Biol. 2014, 20, 3767–3779. [Google Scholar] [CrossRef] [PubMed]
  18. Fritz, P. Ökologischer Waldumbau in Deutschland: Fragen, Antworten, Perspektiven; Oekom: München, Germany, 2006; Volume 153. [Google Scholar]
  19. Robakowski, P.; Wyka, T.; Samardakiewicz, S.; Kierzkowski, D. Growth, Photosynthesis, and Needle Structure of Silver Fir (Abies alba Mill.) Seedlings under Different Canopies. For. Ecol. Manag. 2004, 201, 211–227. [Google Scholar] [CrossRef]
  20. Mérian, P.; Lebourgeois, F. Size-Mediated Climate-Growth Relationships in Temperate Forests: A Multi-Species Analysis. For. Ecol. Manag. 2011, 261, 1382–1391. [Google Scholar] [CrossRef]
  21. Ellenberg, H.; Leuschner, C. Vegetation Mitteleuropas Mit Den Alpen: In Ökologischer, Dynamischer Und Historischer Sicht; UTB Ulmer: Stuttgart, Germany, 2010. [Google Scholar]
  22. Meier, I.C.; Leuschner, C. Belowground Drought Response of European Beech: Fine Root Biomass and Carbon Partitioning in 14 Mature Stands across a Precipitation Gradient. Glob. Chang. Biol. 2008, 14, 2081–2095. [Google Scholar] [CrossRef]
  23. Kölling, C.; Ewald, J.; Walentowski, H. Lernen von Der Natur: Die Tanne in Den Natürlichen Waldgesellschaften Bayerns. Ber. Bayer. Landesanst. Wald Forstwirtsch. 2004, 45, 24–29. [Google Scholar]
  24. Köstler, J.; Brückner, E.; Bibelriether, H. Die Wurzeln Der Waldbäume: Untersuchungen Zur Morphologie Der Waldbäume in Mitteleropa; Parey: Hamburg, Germany, 1968. [Google Scholar]
  25. Granier, A.; Bobay, V.; Gash, J.H.C.; Gelpe, J.; Saugier, B.; Shuttleworth, W.J. Vapour Flux Density and Transpiration Rate Comparisons in a Stand of Maritime Pine (Pinus pinaster Ait.) in Les Landes Forest. Agric. For. Meteorol. 1990, 51, 309–319. [Google Scholar] [CrossRef]
  26. Granier, A.; Biron, P.; Köstner, B.; Gay, L.W.; Najjar, G. Comparisons of Xylem Sap Flow and Water Vapour Flux at the Stand Level and Derivation of Canopy Conductance for Scots Pine. Theor. Appl. Climatol. 1996, 53, 115–122. [Google Scholar] [CrossRef]
  27. Kostner, B.M.M.; Schulze, E.D.; Kelliher, F.M.; Hollinger, D.Y.; Byers, J.N.; Hunt, J.E.; McSeveny, T.M.; Meserth, R.; Weir, P.L. Transpiration and Canopy Conductance in a Pristine Broad-Leaved Forest of Nothofagus: An Analysis of Xylem Sap Flow and Eddy Correlation Measurements. Oecologia 1992, 91, 350–359. [Google Scholar] [CrossRef]
  28. Köstner, B.; Granier, A.; Cermak, J. Sapflow Measurements in Forest Stands: Methods and Uncertainties. Ann. For. Sci. 1998, 55, 13–27. [Google Scholar] [CrossRef]
  29. Magh, R.-K.; Yang, F.; Rehschuh, S.; Burger, M.; Dannenmann, M.; Pena, R.; Burzlaff, T.; Ivankovic, M.; Rennenberg, H. Nitrogen Nutrition of European Beech Is Maintained at Sufficient Water Supply in Mixed Beech-Fir Stands. Forests 2018, 9, 733. [Google Scholar] [CrossRef]
  30. Alduchov, O.A.; Eskridge, R.E. Improved Magnus Form Approximation of Saturation Vapor Pressure. J. Appl. Meteorol. 1996, 35, 601–609. [Google Scholar] [CrossRef]
  31. Burgess, S.S.O.; Adams, M.A.; Bleby, T.M. Measurement of Sap Flow in Roots of Woody Plants: A Commentary. Tree Physiol. 2000, 20, 909–913. [Google Scholar] [CrossRef] [PubMed]
  32. Burgess, S.S.O.; Adams, M.A.; Turner, N.C.; Beverly, C.R.; Ong, C.K.; Khan, A.A.H.; Bleby, T.M. An Improved Heat Pulse Method to Measure Low and Reverse Rates of Sap Flow in Woody Plants. Tree Physiol. 2001, 21, 589–598. [Google Scholar] [CrossRef] [PubMed]
  33. Kutscha, N.P.; Sachs, I.B. Color Tests for Differentiating Heartwood and Sapwood in Certain Softwood Tree Species (Report 2246); United States Department of Agriculture and Forest Service: Madison WI, USA, 1962. [Google Scholar]
  34. Meinzer, F.C.; Goldstein, G.; Andrade, J.L. Regulation of Water Flux through Tropical Forest Canopy Trees: Do Universal Rules Apply? Tree Physiol. 2001, 21, 19–26. [Google Scholar] [CrossRef] [PubMed]
  35. Gebauer, T.; Horna, V.; Leuschner, C. Variability in Radial Sap Flux Density Patterns and Sapwood Area among Seven Co-Occurring Temperate Broad-Leaved Tree Species. Tree Physiol. 2008, 28, 1821–1830. [Google Scholar] [CrossRef] [PubMed]
  36. Haas, E.; Klatt, S.; Fröhlich, A.; Kraft, P.; Werner, C.; Kiese, R.; Grote, R.; Breuer, L.; Butterbach-Bahl, K. LandscapeDNDC: A Process Model for Simulation of Biosphere–Atmosphere–Hydrosphere Exchange Processes at Site and Regional Scale. Landsc. Ecol. 2013, 28, 615–636. [Google Scholar] [CrossRef]
  37. Li, C.; Aber, J.; Stange, F.; Butterbach-bahl, K.; Papen, H. A Process-Oriented Model of and NO. 1 Model Development. J. Geophys. Res. 2000, 105, 4369–4384. [Google Scholar] [CrossRef]
  38. Kiese, R.; Li, C.; Hilbert, D.W.; Papen, H.; Butterbach-Bahl, K. Regional Application of PnET-N-DNDC for Estimating the N2O Source Strength of Tropical Rainforests in the Wet Tropics of Australia. Glob. Chang. Biol. 2005, 11, 128–144. [Google Scholar] [CrossRef]
  39. Holst, J.; Grote, R.; Offermann, C.; Ferrio, J.P.; Gessler, A.; Mayer, H.; Rennenberg, H. Water Fluxes within Beech Stands in Complex Terrain. Int. J. Biometeorol. 2010, 54, 23–36. [Google Scholar] [CrossRef]
  40. Grote, R.; Lehmann, E.; Brummer, C.; Bruggemann, N.; Szarzynski, J.; Kunstmann, H. Modelling and Observation of Biosphere–Atmosphere Interactions in Natural Savannah in Burkina Faso, West Africa. Phys. Chem. Earth Parts A/B/C 2009, 34, 251–260. [Google Scholar] [CrossRef]
  41. Grote, R.; Kiese, R.; Grunwald, T.; Ourcival, J.-M.; Granier, A. Modelling Forest Carbon Balances Considering Tree Mortality and Removal. Agric. For. Meteorol. 2011, 151, 179–190. [Google Scholar] [CrossRef]
  42. Grote, R.; Korhonen, J.; Mammarella, I. Challenges for Evaluating Process-Based Models of Gas Exchange. For. Syst. 2011, 20, 389. [Google Scholar] [CrossRef]
  43. R Core Team. R: A Language and Environment for Statistical Computing; R Foundation for Statistical Computing: Vienna, Austria, 2017. [Google Scholar]
  44. Hentschel, R.; Bittner, S.; Janott, M.; Biernath, C.; Holst, J.; Ferrio, J.P.; Gessler, A.; Priesack, E. Simulation of Stand Transpiration Based on a Xylem Water Flow Model for Individual Trees. Agric. For. Meteorol. 2013, 182–183, 31–42. [Google Scholar] [CrossRef]
  45. Lüttschwager, D.; Remus, R. Radial Distribution of Sap Flux Density in Trunks of a Mature Beech Stand. Ann. For. Sci. 2007, 64, 431–438. [Google Scholar] [CrossRef]
  46. Gessler, A.; Rienks, M.; Dopatka, T.; Rennenberg, H. Radial Variation of Sap Flow Densities in the Sap-Wood of Beech Trees (Fagus sylvatica L.). Phyton Ann. Rei Bot. 2005, 45, 257–266. [Google Scholar]
  47. Schipka, F.; Heimann, J.; Leuschner, C. Regional Variation in Canopy Transpiration of Central European Beech Forests. Oecologia 2005, 143, 260–270. [Google Scholar] [CrossRef]
  48. Lyr, H.; Fiedler, J.; Tranquillini, W. Wachstum Und Umwelt. Physiologie Und Ökologie Der Gehölze; Gustav Fischer Verlag: Jena, Germany, 1992. [Google Scholar]
  49. Nourtier, M.; Chanzy, A.; Granier, A.; Huc, R. Sap Flow Measurements by Thermal Dissipation Method Using Cyclic Heating: A Processing Method Accounting for the Non-Stationary Regime. Ann. For. Sci. 2011, 68, 1255–1264. [Google Scholar] [CrossRef]
  50. Nourtier, M.; Chanzy, A.; Cailleret, M.; Yingge, X.; Huc, R.; Davi, H. Transpiration of Silver Fir (Abies alba Mill.) during and after Drought in Relation to Soil Properties in a Mediterranean Mountain Area. Ann. For. Sci. 2014, 71, 683–695. [Google Scholar] [CrossRef]
  51. Cermak, J.; Nadezhdina, N.; Meiresonne, L.; Ceulemans, R. Scots Pine Root Distribution Derived from Radial Sap Flow Patterns in Stems of Large Leaning Trees. Plant Soil 2008, 305, 61–75. [Google Scholar] [CrossRef]
  52. Nadezhdina, N.; Cermak, J.; Meiresonne, L.; Ceulemans, R. Transpiration of Scots Pine in Flanders Growing on Soil with Irregular Substratum. For. Ecol. Manag. 2007, 243, 1–9. [Google Scholar] [CrossRef]
  53. Jonard, F.; Andre, F.; Ponette, Q.; Vincke, C.; Jonard, M. Sap Flux Density and Stomatal Conductance of European Beech and Common Oak Trees in Pure and Mixed Stands during the Summer Drought of 2003. J. Hydrol. 2011, 409, 371–381. [Google Scholar] [CrossRef]
  54. Gebauer, T.; Horna, V.; Leuschner, C. Canopy Transpiration of Pure and Mixed Forest Stands with Variable Abundance of European Beech. J. Hydrol. 2012, 442–443, 2–14. [Google Scholar] [CrossRef]
  55. Pretzsch, H.; Biber, P. A Re-Evaluation of Reineke’s Rule and Stand Density Index. For. Sci. 2005, 51, 304–320. [Google Scholar]
  56. Pretzsch, H.; Dieler, J.; Seifert, T.; Rotzer, T. Climate Effects on Productivity and Resource-Use Efficiency of Norway Spruce (Picea abies [L.] Karst.) and European Beech (Fagus sylvatica [L.]) in Stands with Different Spatial Mixing Patterns. Trees 2012, 26, 1343–1360. [Google Scholar] [CrossRef]
  57. Kelty, M.J. Comparative Productivity of Monocultures and Mixed-Species Stands. In The Ecology and Silviculture of Mixed-Species Forests: A Festschrift for David M. Smith; Kelty, M.J., Larson, B.C., Oliver, C.D., Eds.; Springer: Dordrecht, The Netherlands, 1992; pp. 125–141. [Google Scholar]
  58. Otto, H.-J. Waldökologie; Ulmer, UTB für Wissenschaft: Stuttgart, Germany, 1994. [Google Scholar]
  59. Potępa, B.; Szynkiewicz, A.; Udyrysz-Krawec, M. GPR Survey for Fir (Abies alba) and Spruce (Picea abies) Root Systems in Different Locations in the Western Carpathians Mts. (Poland). J. Geol. Resour. Eng. 2018, 6, 194–209. [Google Scholar]
  60. Schmid, I.; Kazda, M. Vertical Distribution and Radial Growth of Coarse Roots in Pure and Mixed Stands of Fagus sylvatica and Picea abies. Can. J. For. Res. 2001, 31, 539–548. [Google Scholar] [CrossRef]
  61. Leuschner, C.; Hertel, D.; Schmid, I.; Koch, O.; Muhs, A.; Hölscher, D. Stand Fine Root Biomass and Fine Root Morphology in Old-Growth Beech Forests as a Function of Precipitation and Soil Fertility: Plant and Soil. Plant Soil 2004, 258, 43–56. [Google Scholar] [CrossRef]
  62. Grossiord, C.; Gessler, A.; Granier, A.; Berger, S.; Brechet, C.; Hentschel, R.; Hommel, R.; Scherer-Lorenzen, M.; Bonal, D. Impact of Interspecific Interactions on the Soil Water Uptake Depth in a Young Temperate Mixed Species Plantation. J. Hydrol. 2014, 519, 3511–3519. [Google Scholar] [CrossRef]
  63. Bello, J.; Hasselquist, N.J.; Vallet, P.; Kahmen, A.; Perot, T.; Korboulewsky, N. Complementary Water Uptake Depth of Quercus petraea and Pinus sylvestris in Mixed Stands during an Extreme Drought. Plant Soil 2019, 437, 93–115. [Google Scholar] [CrossRef]
  64. Zapater, M.; Hossann, C.; Bréda, N.; Brechet, C.; Bonal, D.; Granier, A. Evidence of Hydraulic Lift in a Young Beech and Oak Mixed Forest Using 18O Soil Water Labelling. Trees 2011, 25, 885–894. [Google Scholar] [CrossRef]
  65. Camarero, J.J.; Gazol, A.; Sangüesa-Barreda, G.; Oliva, J.; Vicente-Serrano, S.M. To Die or Not to Die: Early Warnings of Tree Dieback in Response to a Severe Drought. J. Ecol. 2015, 103, 44–57. [Google Scholar] [CrossRef]
  66. Caldwell, M.M.; Dawson, T.E.; Richards, J.H. Hydraulic Lift: Consequences of Water Efflux from the Roots of Plants. Oecologia 1998, 113, 151–161. [Google Scholar] [CrossRef] [PubMed]
  67. Magh, R.-K.; Grün, M.; Knothe, V.E.; Stubenazy, T.; Tejedor, J.; Dannenmann, M.; Rennenberg, H. Silver-Fir (Abies alba Mill.) Neighbors Improve Water Relations of European Beech (Fagus sylvatica L.), but Do Not Affect N Nutrition. Trees 2018, 32, 337–348. [Google Scholar] [CrossRef]
  68. Rotzer, T.; Haberle, K.H.; Kallenbach, C.; Matyssek, R.; Schutze, G.; Pretzsch, H. Tree Species and Size Drive Water Consumption of Beech/Spruce Forests—A Simulation Study Highlighting Growth under Water Limitation. Plant Soil 2017, 418, 337–356. [Google Scholar] [CrossRef]
  69. Mitscherlich, G. Waldklima Und Wasserhaushalt. In Wald, Wachstum Und Umwelt; Sauerländer Verlag: Frankfurt, Germany, 1998; p. 365. [Google Scholar]
  70. Oke, T. Boundary Layer Climates, 2nd ed.; Routledge: London, UK, 1996. [Google Scholar]
  71. Meinzer, F.C.; Clearwater, M.J.; Goldstein, G. Water Transport in Trees: Current Perspectives, New Insights and Some Controversies. Environ. Exp. Bot. 2001, 45, 239–262. [Google Scholar] [CrossRef]
  72. Rennenberg, H. Communities and Ecosystem Functioning. In Ecological Biochemistry—Environmental and Interspecies Interactions; Krauss, G., Nies, D., Eds.; Wiley-VCH Verlag GmbH & Co. KGaA: Weinheim, Germany, 2015; pp. 77–91. [Google Scholar]
  73. Huxman, T.E.; Smith, M.D.; Fay, P.A.; Knapp, A.K.; Shaw, M.R.; Loik, M.E.; Smith, S.D.; Tissue, D.T.; Zak, J.C.; Weltzin, J.F.; et al. Convergence across Biomes to a Common Rain-Use Efficiency. Nature 2004, 429, 651–654. [Google Scholar] [CrossRef]
  74. Breda, N.; Huc, R.; Granier, A.; Dreyer, E. Temperate Forest Trees and Stands under Severe Drought: A Review of Ecophysiological Responses, Adaptation Processes and Long-Term Consequences. Ann. For. Sci. 2006, 63, 625–644. [Google Scholar] [CrossRef]
  75. Morin, X.; Fahse, L.; Scherer-Lorenzen, M.; Bugmann, H. Tree Species Richness Promotes Productivity in Temperate Forests through Strong Complementarity between Species. Ecol. Lett. 2011, 14, 1211–1219. [Google Scholar] [CrossRef]
  76. Pretzsch, H.; Block, J.; Dieler, J.; Dong, P.H.; Kohnle, U.; Nagel, J.; Spellmann, H.; Zingg, A. Comparison between the Productivity of Pure and Mixed Stands of Norway Spruce and European Beech along an Ecological Gradient. Ann. For. Sci. 2010, 67, 712. [Google Scholar] [CrossRef]
Figure 1. Soil water content (SWC) in 10 cm depth during the vegetation periods of 2016 (upper) and 2017 (lower). Soil water contents (vol%) of pure and mixed (light and dark cyan, respectively) and control/treatment (treatment in light orange for the pure, and dark orange for the mixed, respectively) plots are depicted by solid colored lines. Natural precipitation (mm) is depicted by blue bars and scaled on the secondary y-axis. The grey shaded area depicts the time during which the treatment plots did not receive natural precipitation. Two arrows indicate the date on which the treatment plots were irrigated with 40 and 60 mm, respectively.
Forests 10 00897 g001
Figure 2. Daily course of sap flow correlation with environmental parameters over the period from May to October (exemplified here for beech and fir). Correlation coefficient (Spearman’s rho) of sap flow over time (hour) represented by lines: with VPD (black); global radiation (orange); soil temperature (Tsoil; dark red); air temperature (Tair, light blue); precipitation (cyan); relative humidity (rH; pink); and soil moisture in different depths (VWC), 80 cm (dark green), 50 cm (green), 25 cm (neon green), 15 cm (green yellow), and 10 cm (yellow).
Forests 10 00897 g002
Figure 3. Average xylem sap flow density from May to November 2016. Pure beech (green line, n = 5); mixed beech (orange line, n = 3); and fir (blue line, n = 5); bars (light blue) show the sum of daily precipitation and grey lines indicate maximal Tair. Note that the second y-axis holds values for both precipitation and Tair. The graph representing the SFD for October 2016 also holds the first four days of November.
Forests 10 00897 g003
Figure 4. Average xylem sap flow density from June to November 2017. Pure beech in the treatment (dashed green line, n = 3); pure beech in the control (solid green line, n = 3; mixed beech in the treatment (dashed orange line, n = 3); mixed beech in the control (solid orange line, n = 3); and fir in the treatment (dashed blue line, n = 3); bars (light blue) show the sum of daily precipitation and solid grey lines indicate maximal Tair. Note that the second y-axis holds values for both precipitation and Tair. The graph representing the SFD for October 2017 also holds the first four days of November. The arrow in the July graph depicts the date on which we reinstalled two sap flow sensors in the fir trees, and the vertical dotted lines in the August graph depict the rewatering events for the treatment plots. Sensor failure due to low battery power caused missing data of the pure beech control group.
Forests 10 00897 g004
Figure 5. Illustration of the water balance for pure beech vs. mixed beech-fir stands, during natural precipitation conditions (upper panel) in comparison to rain exclusion conditions (lower panel).
Forests 10 00897 g005
Table 1. Properties of trees used for sap flow measurements at the Freiamt site in 2016 and 2017. ID, tree identification number; DBH, diameter at breast height over bark; Sw, sapwood width determined from two tree cores; As, sapwood area at the site of sap flow sensor installation. The tree IDs in the upper part of the table belong to the pure beech plot, the ones below were part of the mixed plot.
20162017
IDSpeciesDBH (cm)Sw (cm)As (cm²)IDSpeciesDBH (cm)Sw (cm)As (cm²)
209Beech25.46.6376.6209Beech26.46.8405.7
208Beech30.97.8547.7208Beech32.18.0591.1
6Beech29.87.5512.56Beech31.27.8559.4
207Beech33.78.4648.6207Beech35.68.8723.0
202Beech27.57.0437.6201Beech36.38.9750.1
203Beech31.88.0576.1203Beech33.98.4652.4
102Beech21.25.7269.7102Beech22.66.0304.6
101Fir40.16.5661.6101Fir41.46.5687.8
15Beech25.16.5368.115Beech26.96.9420.0
16Fir34.86.0508.916Fir36.46539.9
302Beech22.35.9296.2302Beech22.96.0311.6
301Fir25.84.4280.1301Fir27.74.4306.0
24Fir28.74.2310.624Fir30.14.3333.4
103Fir37.16.1548.119Beech40.69.8926.1
99Fir21.53.6192.520Fir40.78.5815.5
105Beech28.67.3474.7
106Beech30.17.6519.5
104Fir47.44.7595.3
Table 2. Daily xylem flow rates during the vegetation period of 2016. Daily flow rates of individual trees are grouped into pure beech (n = 6), mixed beech (n = 3), and mixed fir (n = 5); rates are given as minimum (min) and maximum (max) flow rate during the month indicated, as well as mean and median. Statistically significant differences between species and association are marked with different small letters. Significance level was p ≤ 0.05.
2016Tree Water Use (L day−1)
Mayminmeanmedianmax
pure beech3.5961.48 (a)61.10118.14
mix beech2.6642.14 (b)41.0979.34
mix fir5.2042.65 (c)47.8077.89
June
pure beech5.7876.95 (a)71.67158.97
mix beech3.2850.17 (b)46.81104.23
mix fir2.2125.76 (c)25.6846.72
July
pure beech16.61107.48 (a)110.62157.33
mix beech9.9073.82 (b)82.36102.57
mix fir3.0928.79 (c)31.9940.67
August
pure beech19.1781.09 (a)91.00106.07
mix beech12.4063.46 (b)70.8783.95
mix fir3.9921.73 (c)23.7229.75
September
pure beech2.2255.66 (a)59.2183.01
mix beech1.6546.83 (b)47.2269.35
mix fir2.1613.00 (c)13.6921.62
October
pure beech1.0521.60 (a)19.1143.63
mix beech1.5518.74 (a)16.8736.83
mix fir2.096.51 (b)6.4610.44
Table 3. Daily xylem flow rates during the vegetation period of 2017. Daily flow rates of individual trees are grouped into pure beech treatment and control (n = 3, respectively), mixed beech treatment and control (n = 3, respectively) and mixed fir treatment/control (n = 3); rates are given as minimum (min) and maximum (max) flow rate during the month indicated, as well as mean and median. Statistically significant differences between treatments (treatment and control) are marked with different small letters, differences between species and association but the same treatment group (pure, mix beech, and mix fir) with different capital letters. Significance level was p ≤ 0.05. Sensor failure due to low battery power caused missing data of the pure beech control group in June.
2017Tree Water Use (L day−1)
Juneminmeanmedianmax
pure beech treatment49.07103.00 (A)107.40136.43
pure beech controlNANANANA
mix beech treatment26.3965.91 (aB)68.3087.87
mix beech control62.53142.91(bA)148.34189.48
mix fir treatment15.2131.33 (C)33.0239.77
July
pure beech treatment18.1276.76 (aA)79.80120.65
pure beech control20.5392.56 (aA)95.36143.43
mix beech treatment8.1144.39 (aB)44.9276.29
mix beech control24.19114.77 (bA)116.15181.91
mix fir treatment4.8836.16 (B)34.3975.01
August
pure beech treatment4.7568.41 (aA)78.2696.21
pure beech control5.8882.98 (bA)90.72118.18
mix beech treatment3.0537.86 (aB)41.4554.71
mix beech control8.04111.38 (bB)123.16155.43
mix fir treatment1.8340.63 (B)44.2059.12
September
pure beech treatment11.0947.06 (aA)48.1983.69
pure beech control10.0846.91 (aA)50.4486.12
mix beech treatment4.3022.08 (aB)23.2341.48
mix beech control16.6569.72 (bB)73.82126.23
mix fir treatment6.1527.50 (C)29.7745.26
October
pure beech treatment5.7932.55 (aA)29.2369.33
pure beech control4.1028.38 (aA)24.0962.74
mix beech treatment2.0412.67 (aB)12.3729.04
mix beech control6.3247.93 (bB)40.97114.72
mix fir treatment2.3421.65 (C)20.1941.39
Table 4. Stand xylem sap flow scaled up to a one hectare basis in 2016. Sap flow rates were calculated for pure and mixed plots from May to October. Values depict m3 xylem sap flow per ha−1 forest floor for each tree species and association, “sum” indicates the monthly sum of sap flow, “daily mean” is the average sap flow during the same month, and “sd” is the standard deviation from the “daily mean”. Daily means were compared for each month between the pure and the mixed stands and are indicated by small letters; values sharing the same letter are not significantly different. Differences between 2016 and 2017 (control group) are indicated by asterisks.
SiteSpecies Sapwood Area
(m2 ha−1)
Xylem Sap Flow (m3 ha−1)
MayJuneJulyAugustSeptemberOctober
pureFagus sylvatica 14.99
sum 445.58651.97934.3688.77455.14181.63
daily mean 17.14 (a)21.73 (a)30.14 (a)22.22 (a)15.17 (a)5.86 (a)
sd 11.111.4111.216.744.893.47
mixedFagus sylvatica 8.23
sum 290.07385.7587.93506.69363.77150.95
daily mean 10.7412.8618.9716.3412.134.87
sd 6.977.076.64.874.092.88
Abies alba 7.51
sum 176.19148.93180.91135.1676.5939.9
daily mean 6.534.965.844.362.551.29
sd 3.852.382.071.280.930.49
total sum15.75466.26534.63768.84641.85440.36190.85
daily mean 17.27 (a)17.82 (a)24.8 (b *)20.7 (a *)14.68 (a *)6.16 (a)
total sd 7.967.466.915.034.192.92
precipitation16542048575549454630.1
evaporation pure2193021331598675
evaporation mixed246360164185102108
surplus/deficit pure9891094−493−299−87374
surplus/deficit mixed9421153−358−278−88332
Table 5. Stand xylem sap flow scaled up to a one hectare basis in 2017. Sap flow rates were calculated for pure and mixed plots from June to October. Values depict m3 xylem flow per ha-1 forest floor for each tree species and association, “sum” indicates the monthly sum of sap flow, “daily mean” is the average sap flow amount during the same month, and “sd” is the standard deviation from the “daily mean”. Daily means were compared for each month between the pure and the mixed stand daily means (small letters), as well as between control and treatment (capital letters). Values sharing the same letter are not significantly different. Differences between 2016 and 2017 (control group) are indicated by asterisks. ° indicates an estimate from the LandscapeDNDC model, as data are missing here due to sensor failure.
Site/TreatmentSpecies Sapwood Area
(m2 ha−1)
Xylem Sap Flow (m3 ha−1)
JuneJulyAugustSeptemberOctober
pure controlFagus sylvatica 14.99
sum 750 °500.56733.42402.31258.02
daily mean 26.34 (aA)23.65 (aA)13.41 (aA)8.32 (aA)
sd 10.228.735.314.86
pure treatmentFagus sylvatica 14.99
sum 577.47559.14495.2326.6233.91
daily mean 25.1 (a)18.03 (aB)15.97 (aB)10.88 (aA)7.54 (aA)
sd 5.387.65.774.224.06
mixed controlFagus sylvatica 8.23
sum 440.73488.18469.62282.08197.66
daily mean 19.1615.7415.149.46.37
Abies alba 7.51
sum 111.13168.53192.07124.5100.22
daily mean 5.055.436.194.153.23
total sum15.75547.44656.73661.70406.59297.89
daily mean 23.8 (A)21.2 (bA *)21.35 (bA *)13.55 (aA *)9.61 (aA)
sd 5.127.315.913.944.32
mixed treatmentFagus sylvatica 8.23
sum 351.04336.98286.03157.5994.08
daily mean 15.9510.879.225.253.03
Abies alba 7.51
sum 106.70168.53192.07124.5100.22
daily mean 4.635.436.194.153.23
total sum 15.75457.75505.52478.11282.10194.31
daily mean 20.6 (bB)16.33 (aA)15.42 (aB)9.4 (aA)6.27 (aA)
sd 4.035.683.952.72.41
precipitation4361576794660631
precipitation treatment001000660631
evaporation pure 15527115418199
evaporation mixed172331177211134
surplus/deficit pure control−469 °804−9376273
surplus/deficit pure treatment−732−829350152297
surplus/deficit mixed control−283588−4542198
surplus/deficit mixed treatment−629−836344167302
Table 6. Sums of transpiration modeled vs. measured for the vegetation period in 2016.
Plot/AssociationSum of Transpiration (mm) Measured (May–October)Sum of Transpiration (mm) Simulated (May–October)
pure beech337328
mixed beech-fir304301

