Article

Temporal Analysis of Bacterial Leaf Blight in Clonal Eucalyptus Plantations in Brazil

by
Mara Elisa Soares de Oliveira
1,2,*,
Fabiano Silva Fernandes
2,
Murilo A. Glória Junior
2,
Alvaro Soares de Oliveira
3,
Reginaldo Gonçalves Mafia
4 and
Maria Alves Ferreira
1,*
1
Department of Plant Pathology, Universidade Federal de Lavras/UFLA, Lavras, MG 37200-000, Brazil
2
Forest Pathology Laboratory, Universidade Federal do Tocantins/UFT, Gurupi, TO 77402-970, Brazil
3
InfoRural, Gurupi, TO 7710-600, Brazil
4
Centro de Tecnologia, Fibria Celulose S.A., Rod. Aracruz Barra do Riacho, Km 25., Aracruz-ES 29197-900, Brazil
*
Authors to whom correspondence should be addressed.
Forests 2019, 10(10), 839; https://doi.org/10.3390/f10100839
Submission received: 1 July 2019 / Revised: 30 August 2019 / Accepted: 17 September 2019 / Published: 25 September 2019
(This article belongs to the Section Forest Ecology and Management)

Abstract

:
Bacterial leaf blight is an important disease in Eucalyptus spp. plantations since it can cause defoliation, affecting plant development. A better understanding of the disease epidemiology is important for its control. Thus, the aim of this study was to analyze bacterial leaf blight temporal progress in the initial establishment in the field of different eucalyptus clones. It also targeted to correlate the incidence and area under the disease-progress curve (AUDPC), with variables related to growth and meteorological data. Bacterial leaf blight progress curves were analyzed based on incidence and carried out AUDPC calculation. Pearson’s coefficient was used to verify the correlations between bacterial leaf blight incidence and AUDPC with clone initial growth and meteorological factors. Gompertz or Logistic models were the best adjustment to data, according to the assessed clones. A difference in AUDPC was observed between clones regarding bacterial leaf blight incidence during the assessment period. Clones were divided into three groups with different tolerance levels. A negative correlation was observed between bacterial leaf blight incidence, AUDPC, and growth variables of clones. During the assessment period, average air temperature, rainfall, and air relative humidity favored disease incidence. The clones A469, VM01, and 373 were the most tolerant to the disease.

1. Introduction

Eucalyptus production has a prominent position in the Brazilian forestry sector due to its adaptability, rapid growth, and productivity. Currently, eucalyptus plantations occupy 5.7 million hectares in the country, representing about 72% of the total area of planted trees for industrial purposes in Brazil. Eucalyptus plantations have undergone rapid expansion toward the northern and north-eastern regions of the country [1]. Edaphoclimatic conditions in these regions, such as temperature, air humidity, radiation, and rainfall, provide a favorable environment for the emergence of fungal and bacterial diseases [2]. Among the diseases affecting eucalyptus is bacterial leaf blight.
Different bacterial species have been associated with bacterial leaf blight in several countries [3]. According to Gonçalves et al. [4], the first records of bacterial leaf blight in Brazil are from the early 1990s, when Pseudomonas cichorii and Xanthomonas sp. pathogens were detected in Eucalyptus spp. seedlings in nurseries in São Paulo State. Subsequently, other pathogens including Xanthomonas axonopodis, X. campestris, Pseudomonas syringae, P. putida, and Erwinia sp. were also discovered in diseased eucalyptus trees, both in nurseries and in the field in various regions of the country [4].
The disease is characterized by the presence of water-soaked lesions in leaves, and interveinal necrosis, frequently accompanied by central perforations. It can also affect stems and branches. Bacterial leaf blight can cause significant damage and intense defoliation in susceptible genotypes under conditions favorable for the disease [2,3,4]. Is considered one of the most important diseases of eucalyptus during the seedling production phase in Brazil, especially in warmer regions and times of the year (between October and April), principally when associated with greater intensity and frequency of rainfall [5].
Control of bacterial leaf blight can be efficiently performed by selection and planting of resistant eucalyptus clones. However, the selection of clones specifically resistant to bacterial leaf blight has not been prioritized, due to the difficulties of aggregating several productive and technological characteristics of the wood, as well as resistance to other diseases [6]. However, it is possible that, among the clones available in the market, there is variability for resistance or tolerance to bacterial leaf blight, as observed also for other diseases caused by bacteria [6,7].
Research on the epidemiology of diseases in forest species is scarce. In fact, for bacterial diseases, there are no epidemiological studies in the field. Therefore, the effect of bacterial leaf blight on different eucalyptus clones and behavior under the field conditions are yet unknown. Thus, this study aimed: to analyze bacterial leaf blight temporal progress in different eucalyptus clones during initial establishment in the field in Novo Acordo, TO, Brazil; check for resistance or tolerance levels between different eucalyptus clones; determine the correlations between bacterial spot, initial clone growth, and meteorological data.

2. Materials and Methods

2.1. Characterization of the Experimental Area and Genetic Material

This study was conducted in Jamp Florestal company, Farm Desafio I, located at the geographical coordinates 10°14′88” S and 47°9′89” W, city of Novo Acordo-TO, Brazil, between February and August 2014, totaling 210 days after planting eucalyptus seedlings.
The soil of the experimental area is classified as Entisol (Quartzipsamment, Soil Taxonomy, USDA) [8]. Soil tillage before planting consisted of liming, conventional harrowing, and subsoiling at 60 cm. Soil chemical fertilization was carried out in three stages. The first, five days before planting, comprised base fertilization with 200 kg ha−1 single superphosphate. The second, ten days after planting, was a start-up fertilization with 160 kg ha−1 of 06–30–06 NPK fertilizer, plus micronutrients such as boron and zinc. And thirdly, 40 days after planting, topdressing was performed with 200 kg ha−1 of 18–00–18 NPK fertilizer and also micronutrients.
Seedlings were 80 days old at the time of planting. The experimental design was a randomized block design with four replications. Treatments consisted of eight eucalyptus clones from different selection sites: VM01, 373, 1250, 1253, 1407, VE41 (hybrids of Eucalyptus grandis Hill ex Maiden × Eucalyptus urophylla S.T. Blake), A05 (a hybrid of E. urophylla × Eucalyptus camaldulensis Dehnh) and A469 (Eucalyptus platyphylla F. Muell). The experimental plots were composed of 36 trees spaced at 2 × 3 m (three lines with 12 plants).

2.2. Bacterial Leaf Blight Progress

To measure disease progress, assessments were performed on five occasions; at 30, 60, 120, 180, and 240 days after planting. In all occasions, only the 10 central plants of each plot were assessed to avoid edge effects. Disease incidence, under natural conditions of infection of the pathogen, was assessed by quantifying plants with and without symptoms (presence of leaf blight and/or defoliation). Subsequently, the percentage of plants showing symptoms was calculated in relation to the total plants assessed in each plot. Leaves with symptoms were collected for disease confirmation by exudation of bacterial ooze using a light microscope, as used by Gonçalves et al. [4].
Bacterial leaf blight progress curves were analyzed by using incidence values as a function of time for each clone. For bacterial leaf blight progress, empirical, Logistic, Gompertz, and Monomolecular models were tested [9,10]. Original or linearized forms of disease intensity data in proportion (y = incidence/100) of Monomolecular [y = ln[1/(1 − y)]], Logistic [y = ln [y/(1 − y)]], and Gompertz [y = −ln[−ln(y)]] models were adjusted to simple linear regression models [10], with time in days as an independent variable. Determination of R2 and coefficients (Xo: linear coefficient; r: angular coefficient) of logit, monit, and gompit were performed by means of a regression between real values and assessment period in days. They were adjusted according to real and projected data, obtaining the coefficients of determination (R2) and adjusting the coefficient of determination (R2*) of the regression analysis [9,11].
The better adjustments were selected based on statistical significance (Pr > F) of regression analysis, with the highest coefficient of determination of regression (R2*) for reciprocity between observed and predicted values of disease incidence in the absence of undesirable tendencies in the scatterplot of residuals and in the lower mean squared error (MSE). Using the best adjustment, disease progress rate (r) was estimated, being determined by the parameter b of the regression equation and initial incidence (Yo). Regression analyses were performed using the software SigmaPlot 12.0 (SigmaPlot, SYSTAT Software, Inc., San Jose, CA, USA) [12].

2.3. Area under the Disease-Progress Curve

A comparison of disease incidence among the clones was made during assessment period in the field; then, area under the disease-progress curve (AUDPC) was calculated according to Equation (1):
AUDPC = i n 1 ( Y i + Y i + 1 2 ) × ( T i + 1 T i )
where n is the number of assessments, Y is the disease incidence, T is the time when disease incidence was assessed, (Yi + Yi + 1)/2 is the rectangle average height between the points Yi and Yi + 1, and (Ti + 1Ti) is the interval between the sampling times Ti + 1 and Ti (the rectangle base).
Statistical analyses were performed by using the software program SISVAR, version 5.4 (SISVAR, Universidade Federal de Lavras (UFLA), Lavras, MG, Brazil) [13], being AUDPC values of each clone submitted to the F-test (analysis of variance) and means grouped by the Scott-Knott test.

2.4. Correlation Analysis

Shapiro–Wilks normality test was performed. Pearson and Spearman correlation coefficients at 5% and 1% significance level were used to determine correlations among bacterial leaf blight, initial growth of clones, and meteorological data, using the software program SigmaPlot 12.0 (SigmaPlot, SYSTAT Software, Inc., San Jose, CA, USA) [12]. The variables used to assess the growth of clones were diameter at base height (DBaH), diameter at breast height (DBH), and total height. Diameters were measured by using a caliper and graduated ruler. Height was measured by using a graduated ruler. Average rainfall, average air temperature, and air relative humidity were obtained from the database of the National Institute of Meteorology (INMET), station of Palmas-TO, Brazil. To illustrate the influence of disease on growth variables, regression analyses were performed between height, DBH, and incidence, AUDPC.

3. Results

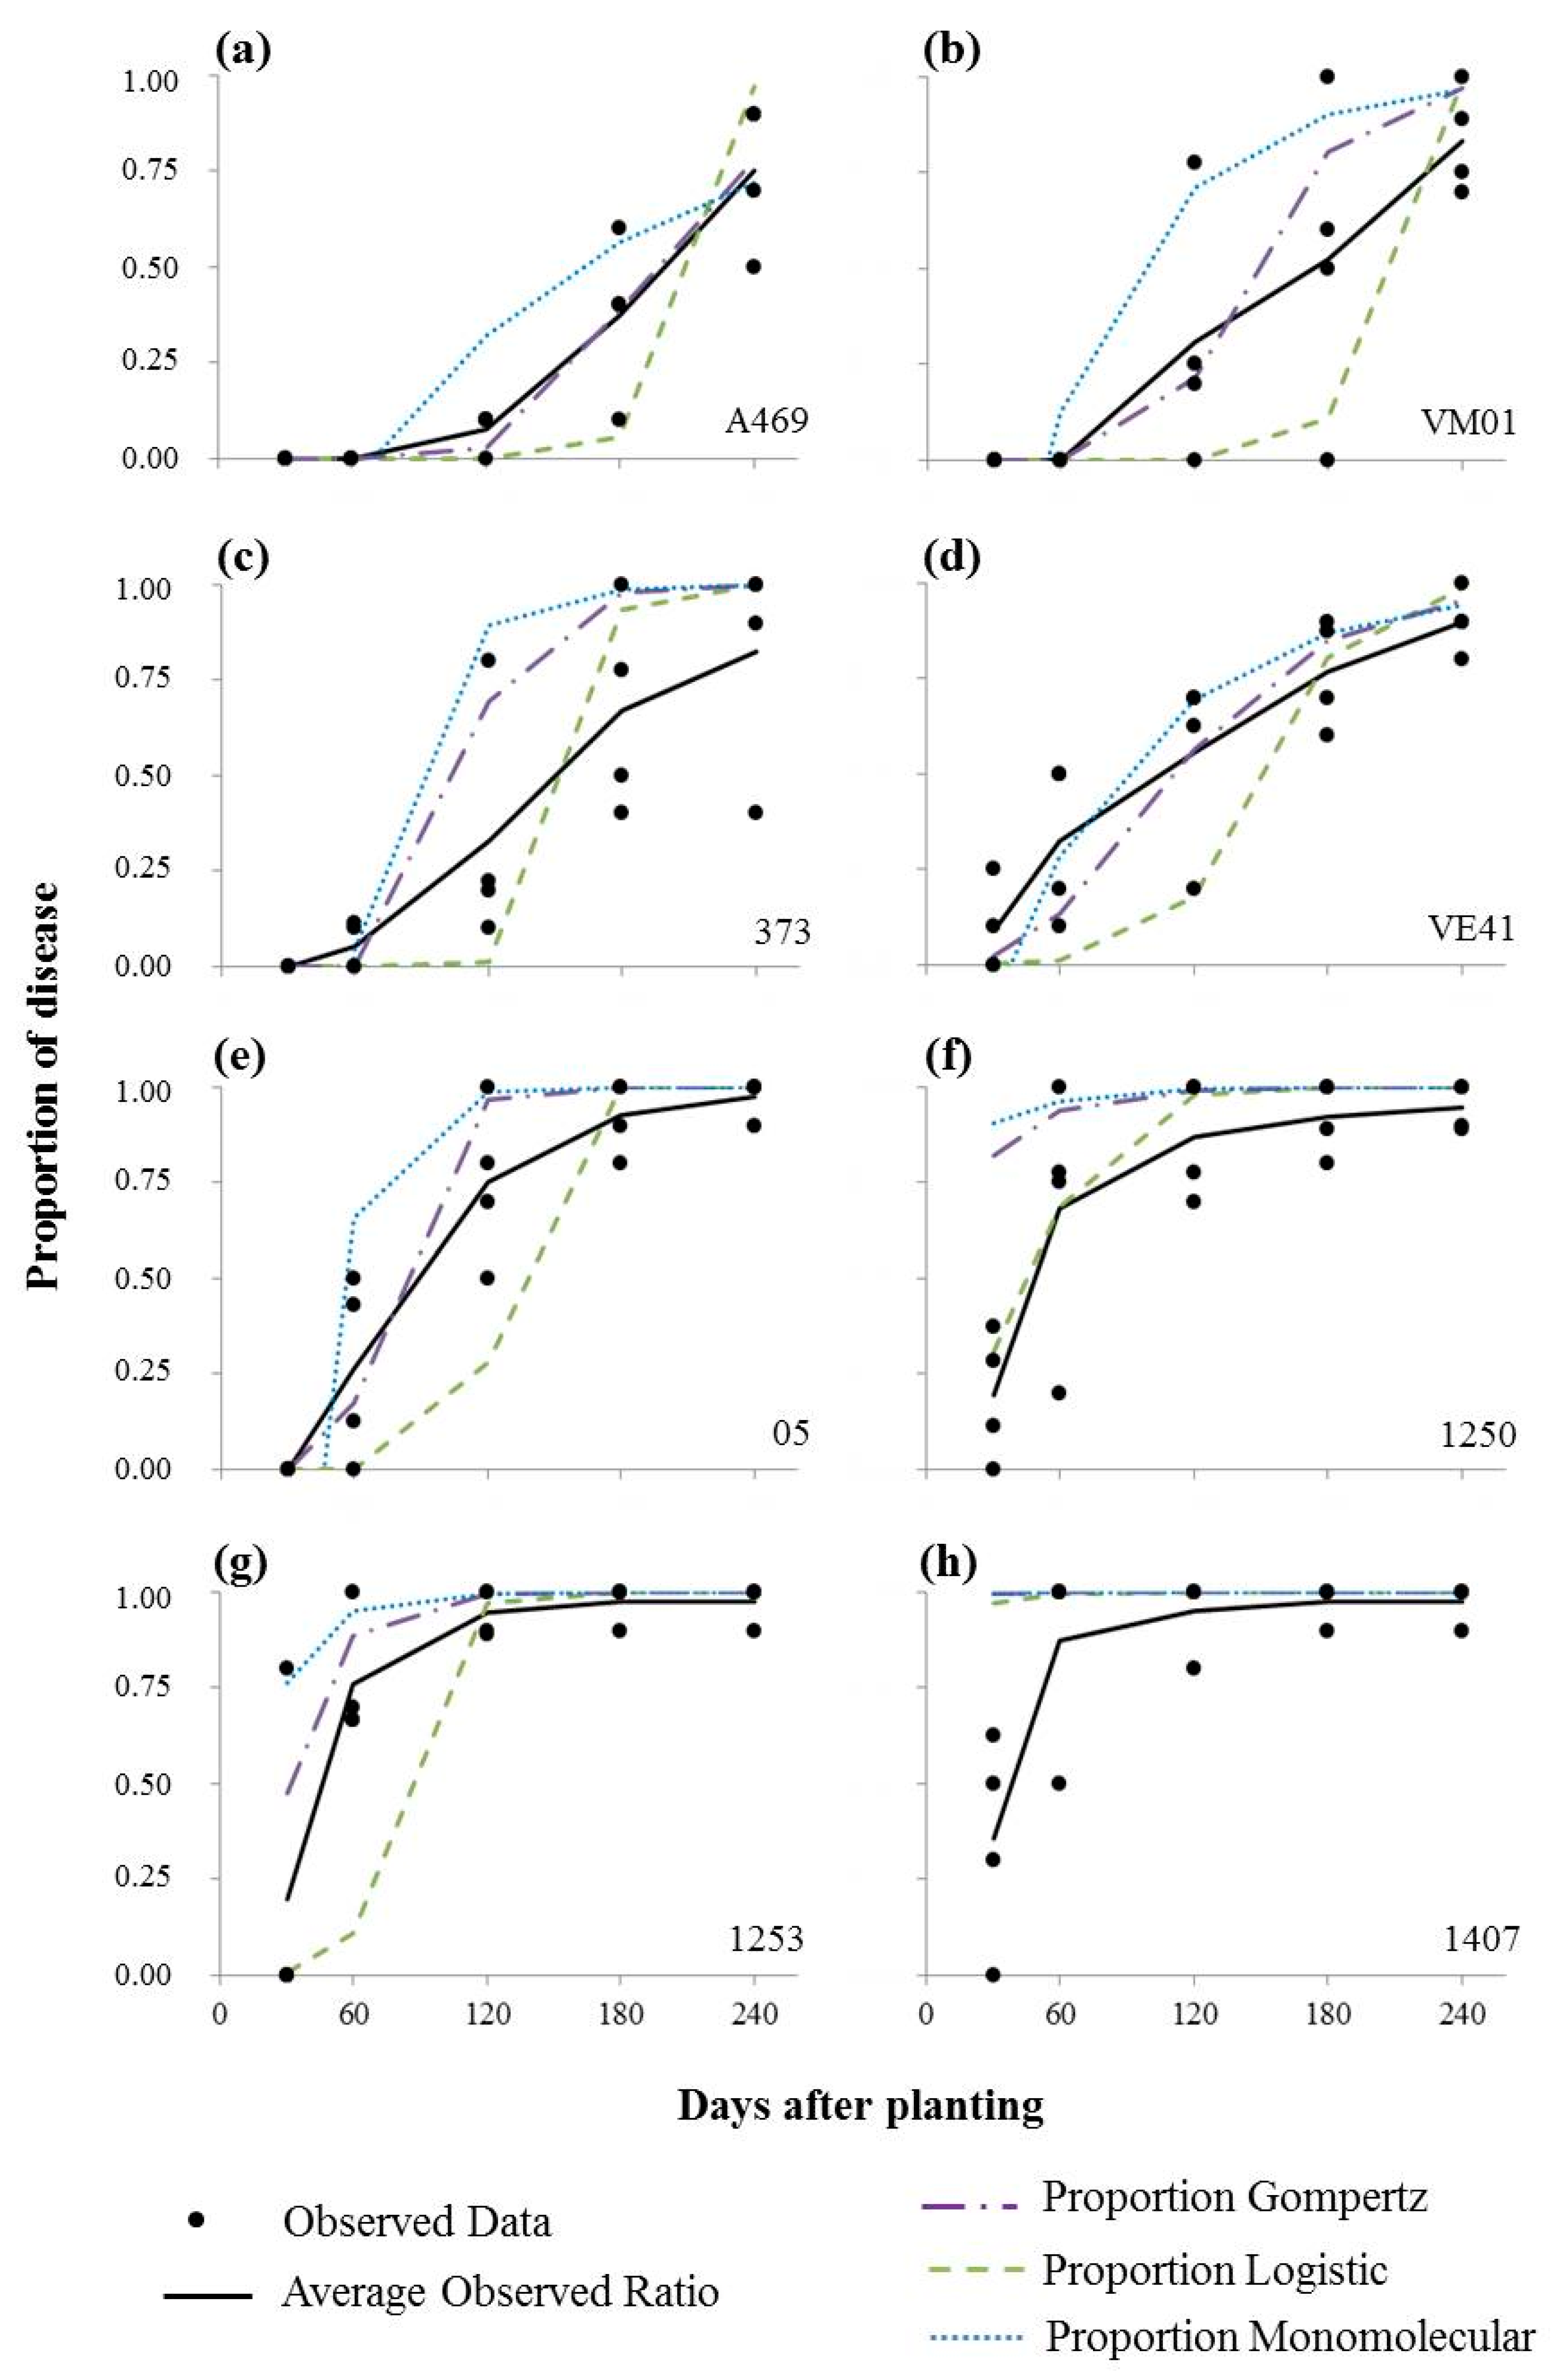
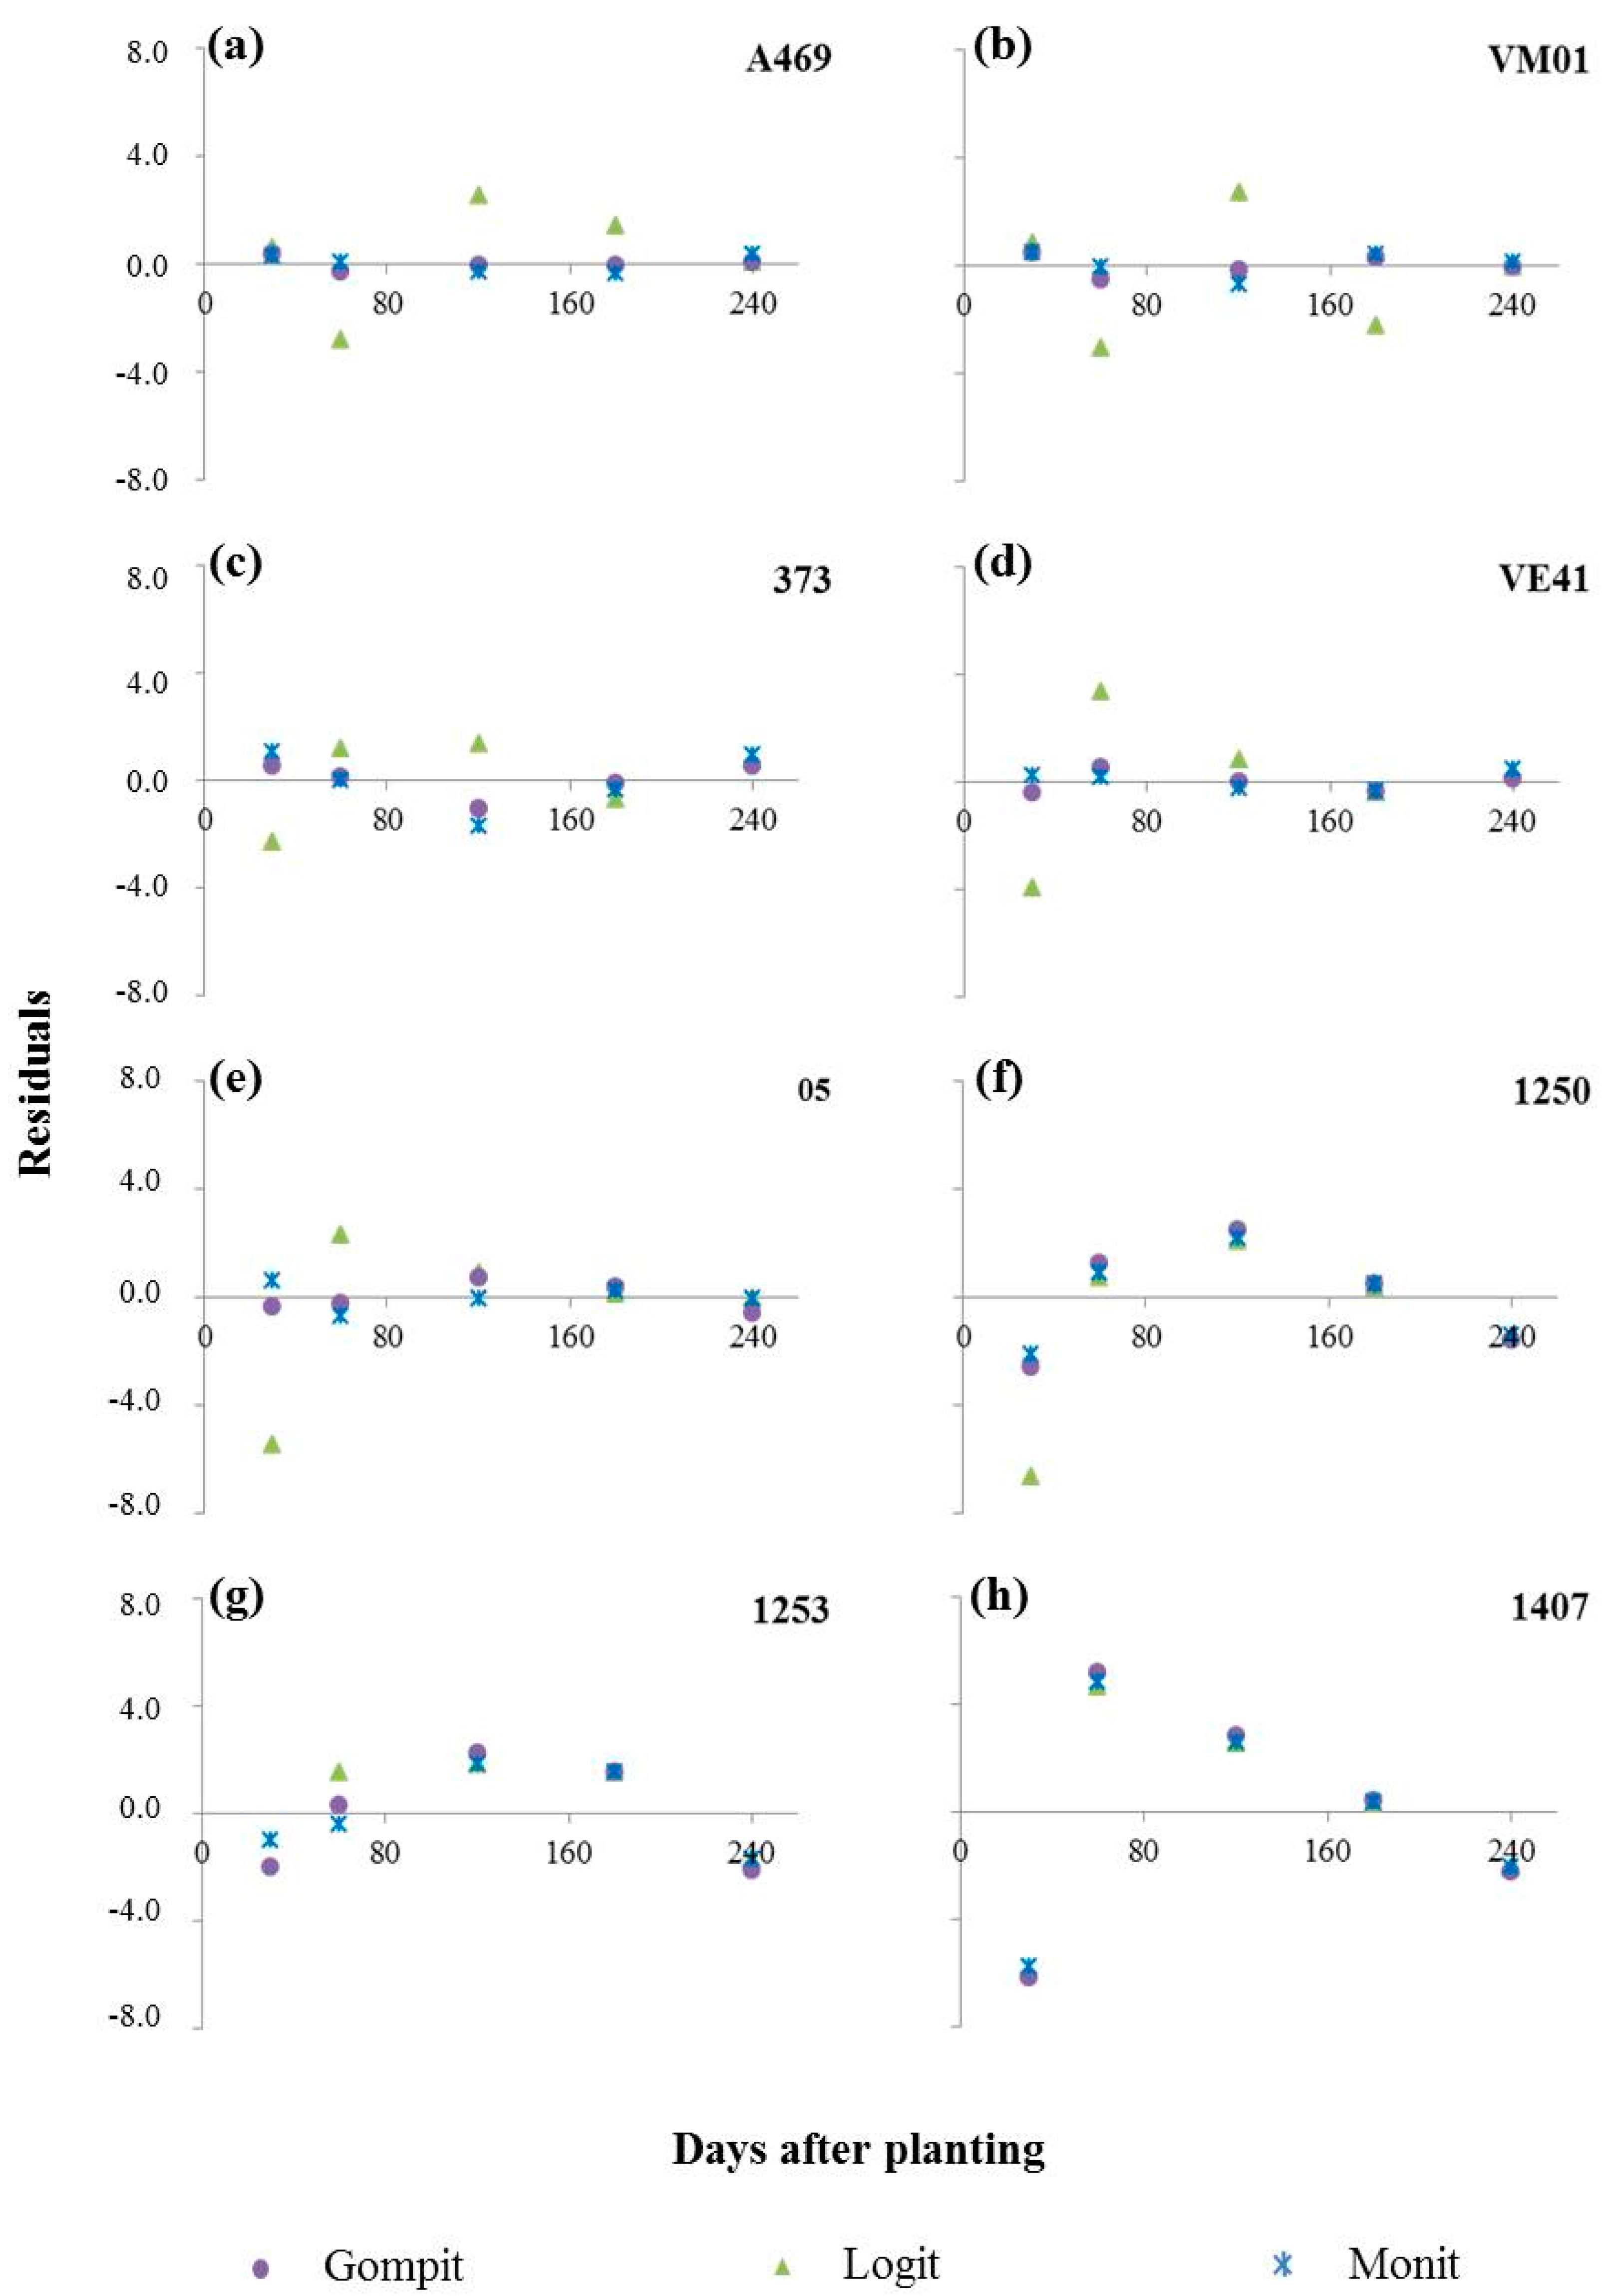
3.1. Bacterial Leaf Blight Progress

Regression model adjustment varied according to the clone. Among the tested models, Gompertz was the best adjustment for the studied pathosystem for clones A469, VM01, 373, VE41, 05, and 1253 (Figure 1). The R2* values were higher, and the residual scatterplot (Figure 2) was lower when this model was used (Table 1).
For clone 1250, the highest R2* was observed when using the Monomolecular model. However, the regression analysis of this model was not significant (p > 0.05); whereas when the Gompertz model was used, regression was significant (p < 0.01). Therefore, the Gompertz model was also best fitted for clone 1250 (Table 1). For clone 1407, only the Logistic model presented significant regression (p < 0.05) and the highest R2* (Table 1).
For most of the clones, initial incidence was 0%. Conversely, clones 1250 and 1407 showed an initial incidence above 50%. Disease progress rate varied among clones. Lower rates were observed for clones VE41 and A469, with values of 0.021 and 0.022, respectively; whereas the higher progress rates were obtained for clones 05, 1253, and 1407, with values of 0.067, 0.061, and 0.058, respectively (Table 1).

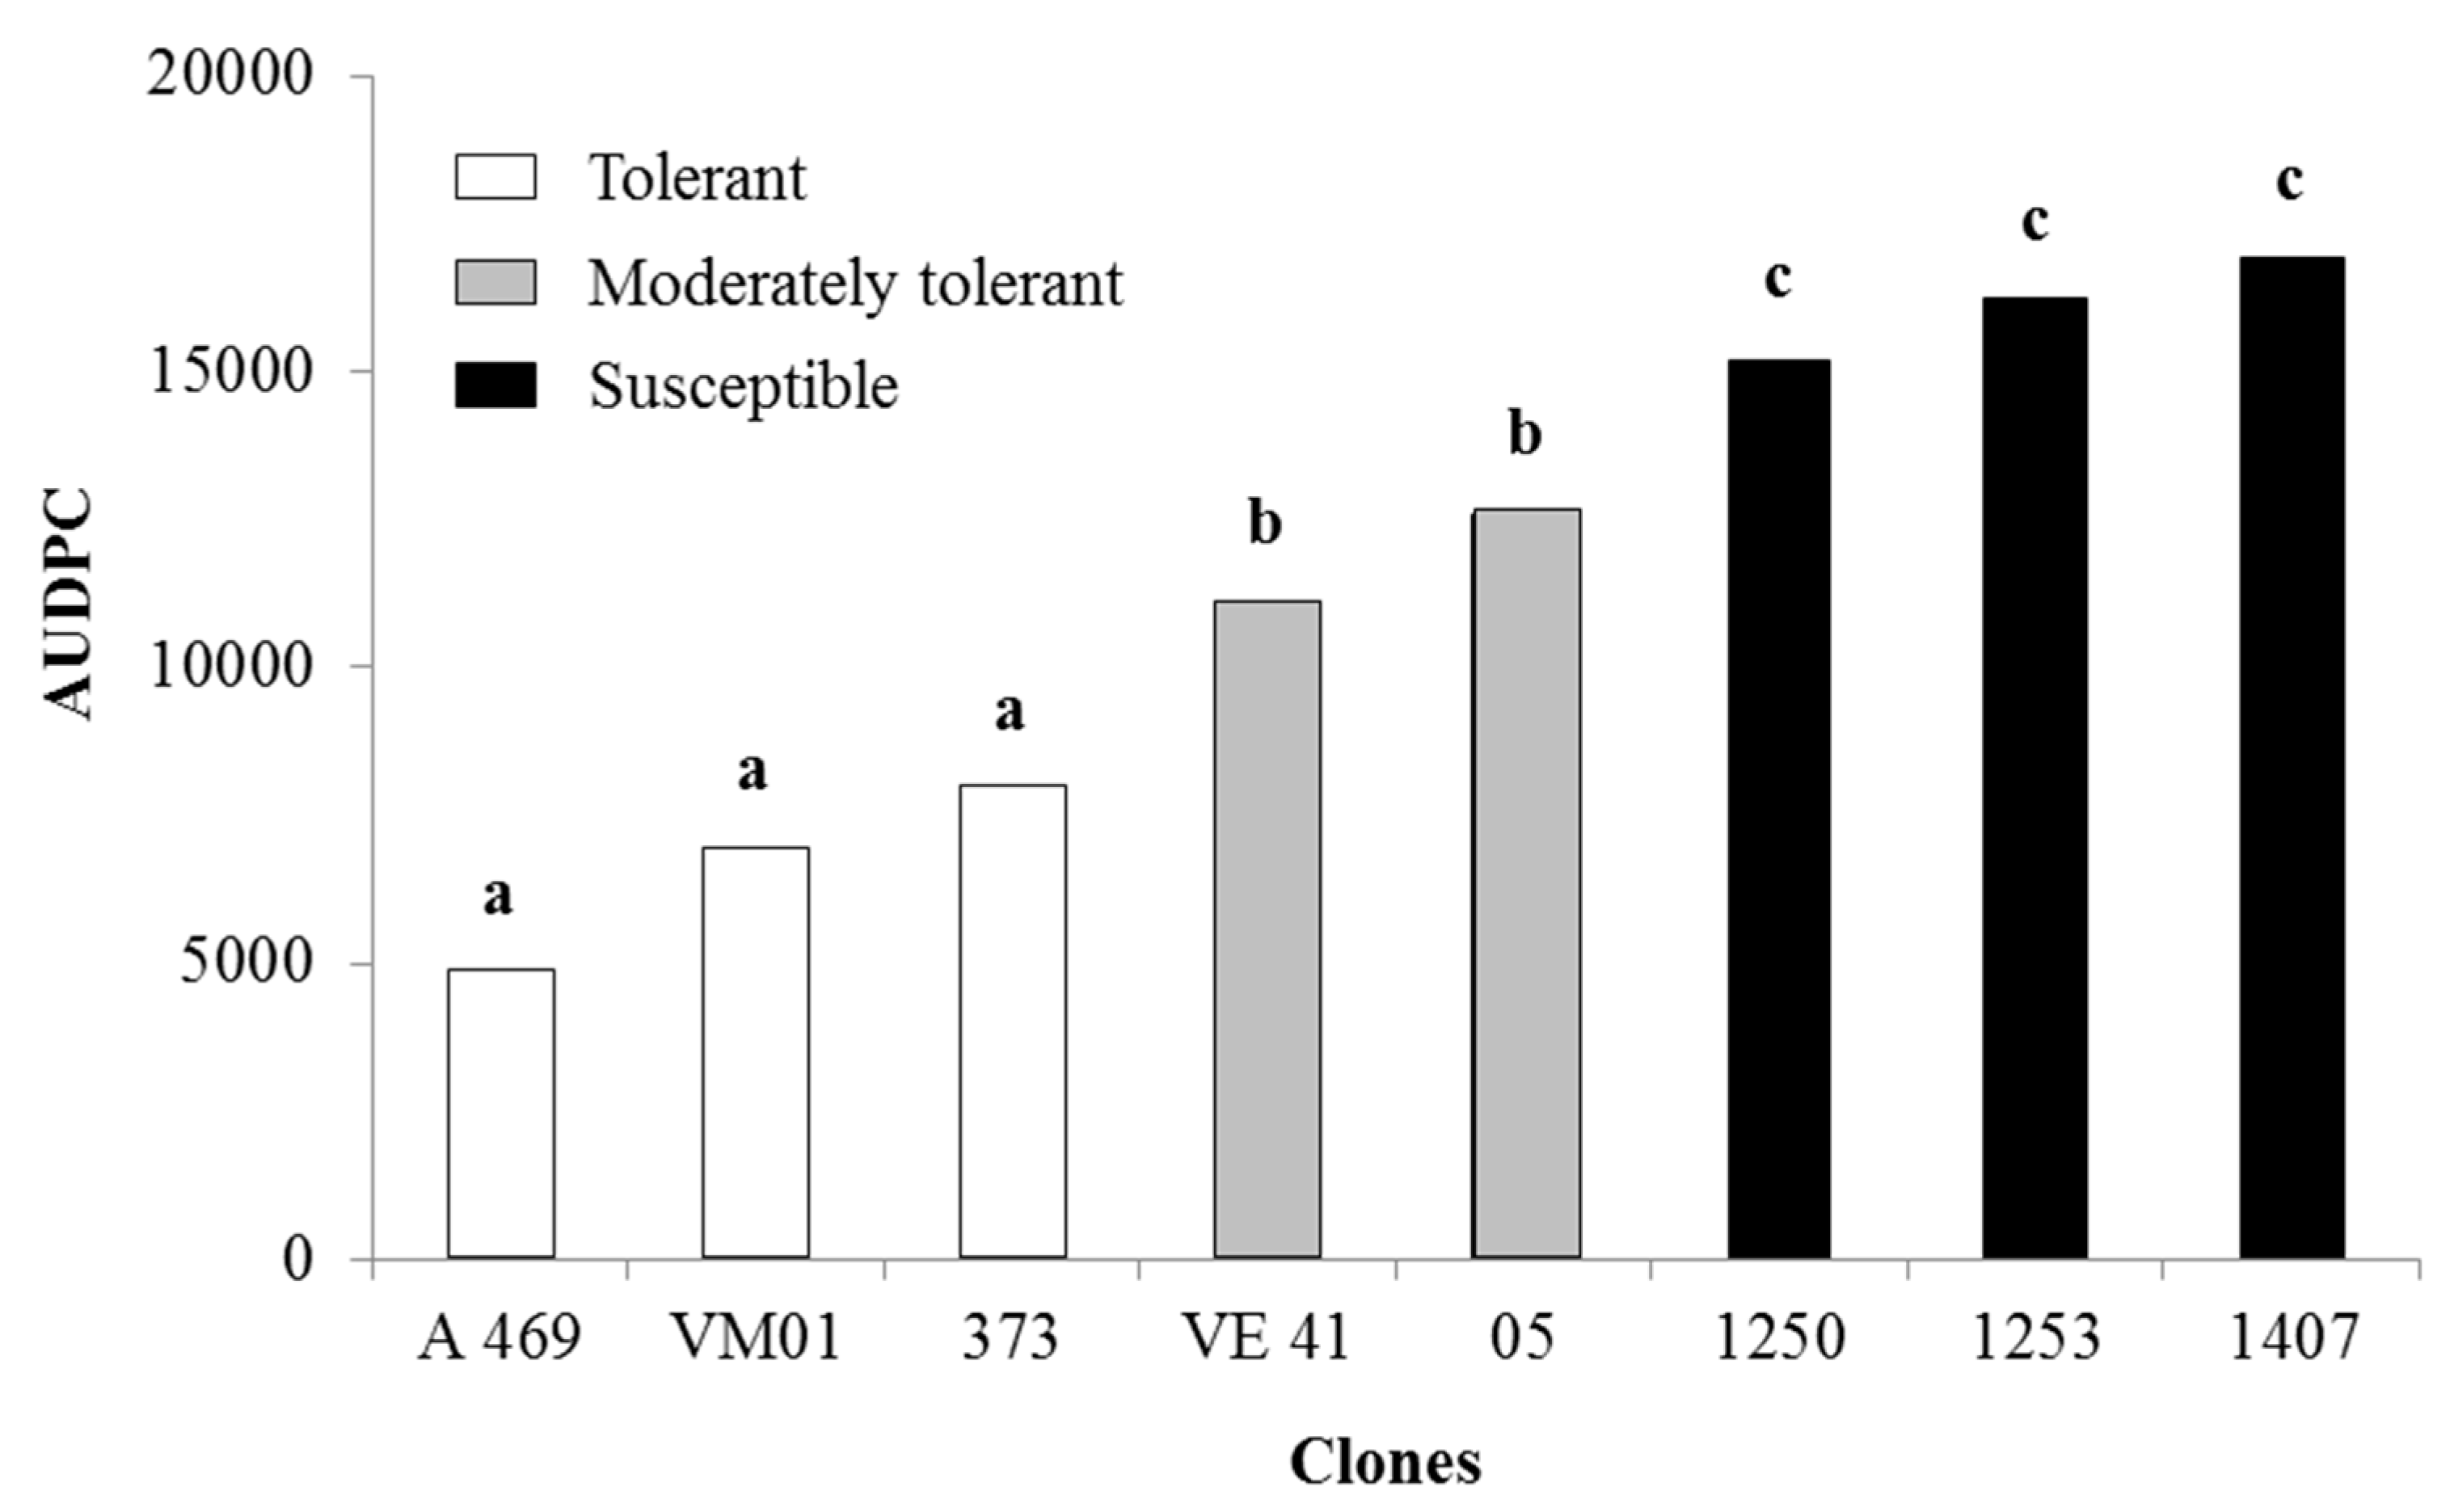
3.2. Area under the Disease-Progress Curve

A difference among clones was found (p < 0.01) in AUDPC. The averages were grouped into three tolerance levels (Figure 3). Clones A469, VM01, and 373 were considered the most tolerant to bacterial blight; clones VE41 and 05 were classified as moderately tolerant; and clones 1250, 1253, and 1407 were regarded as susceptible.

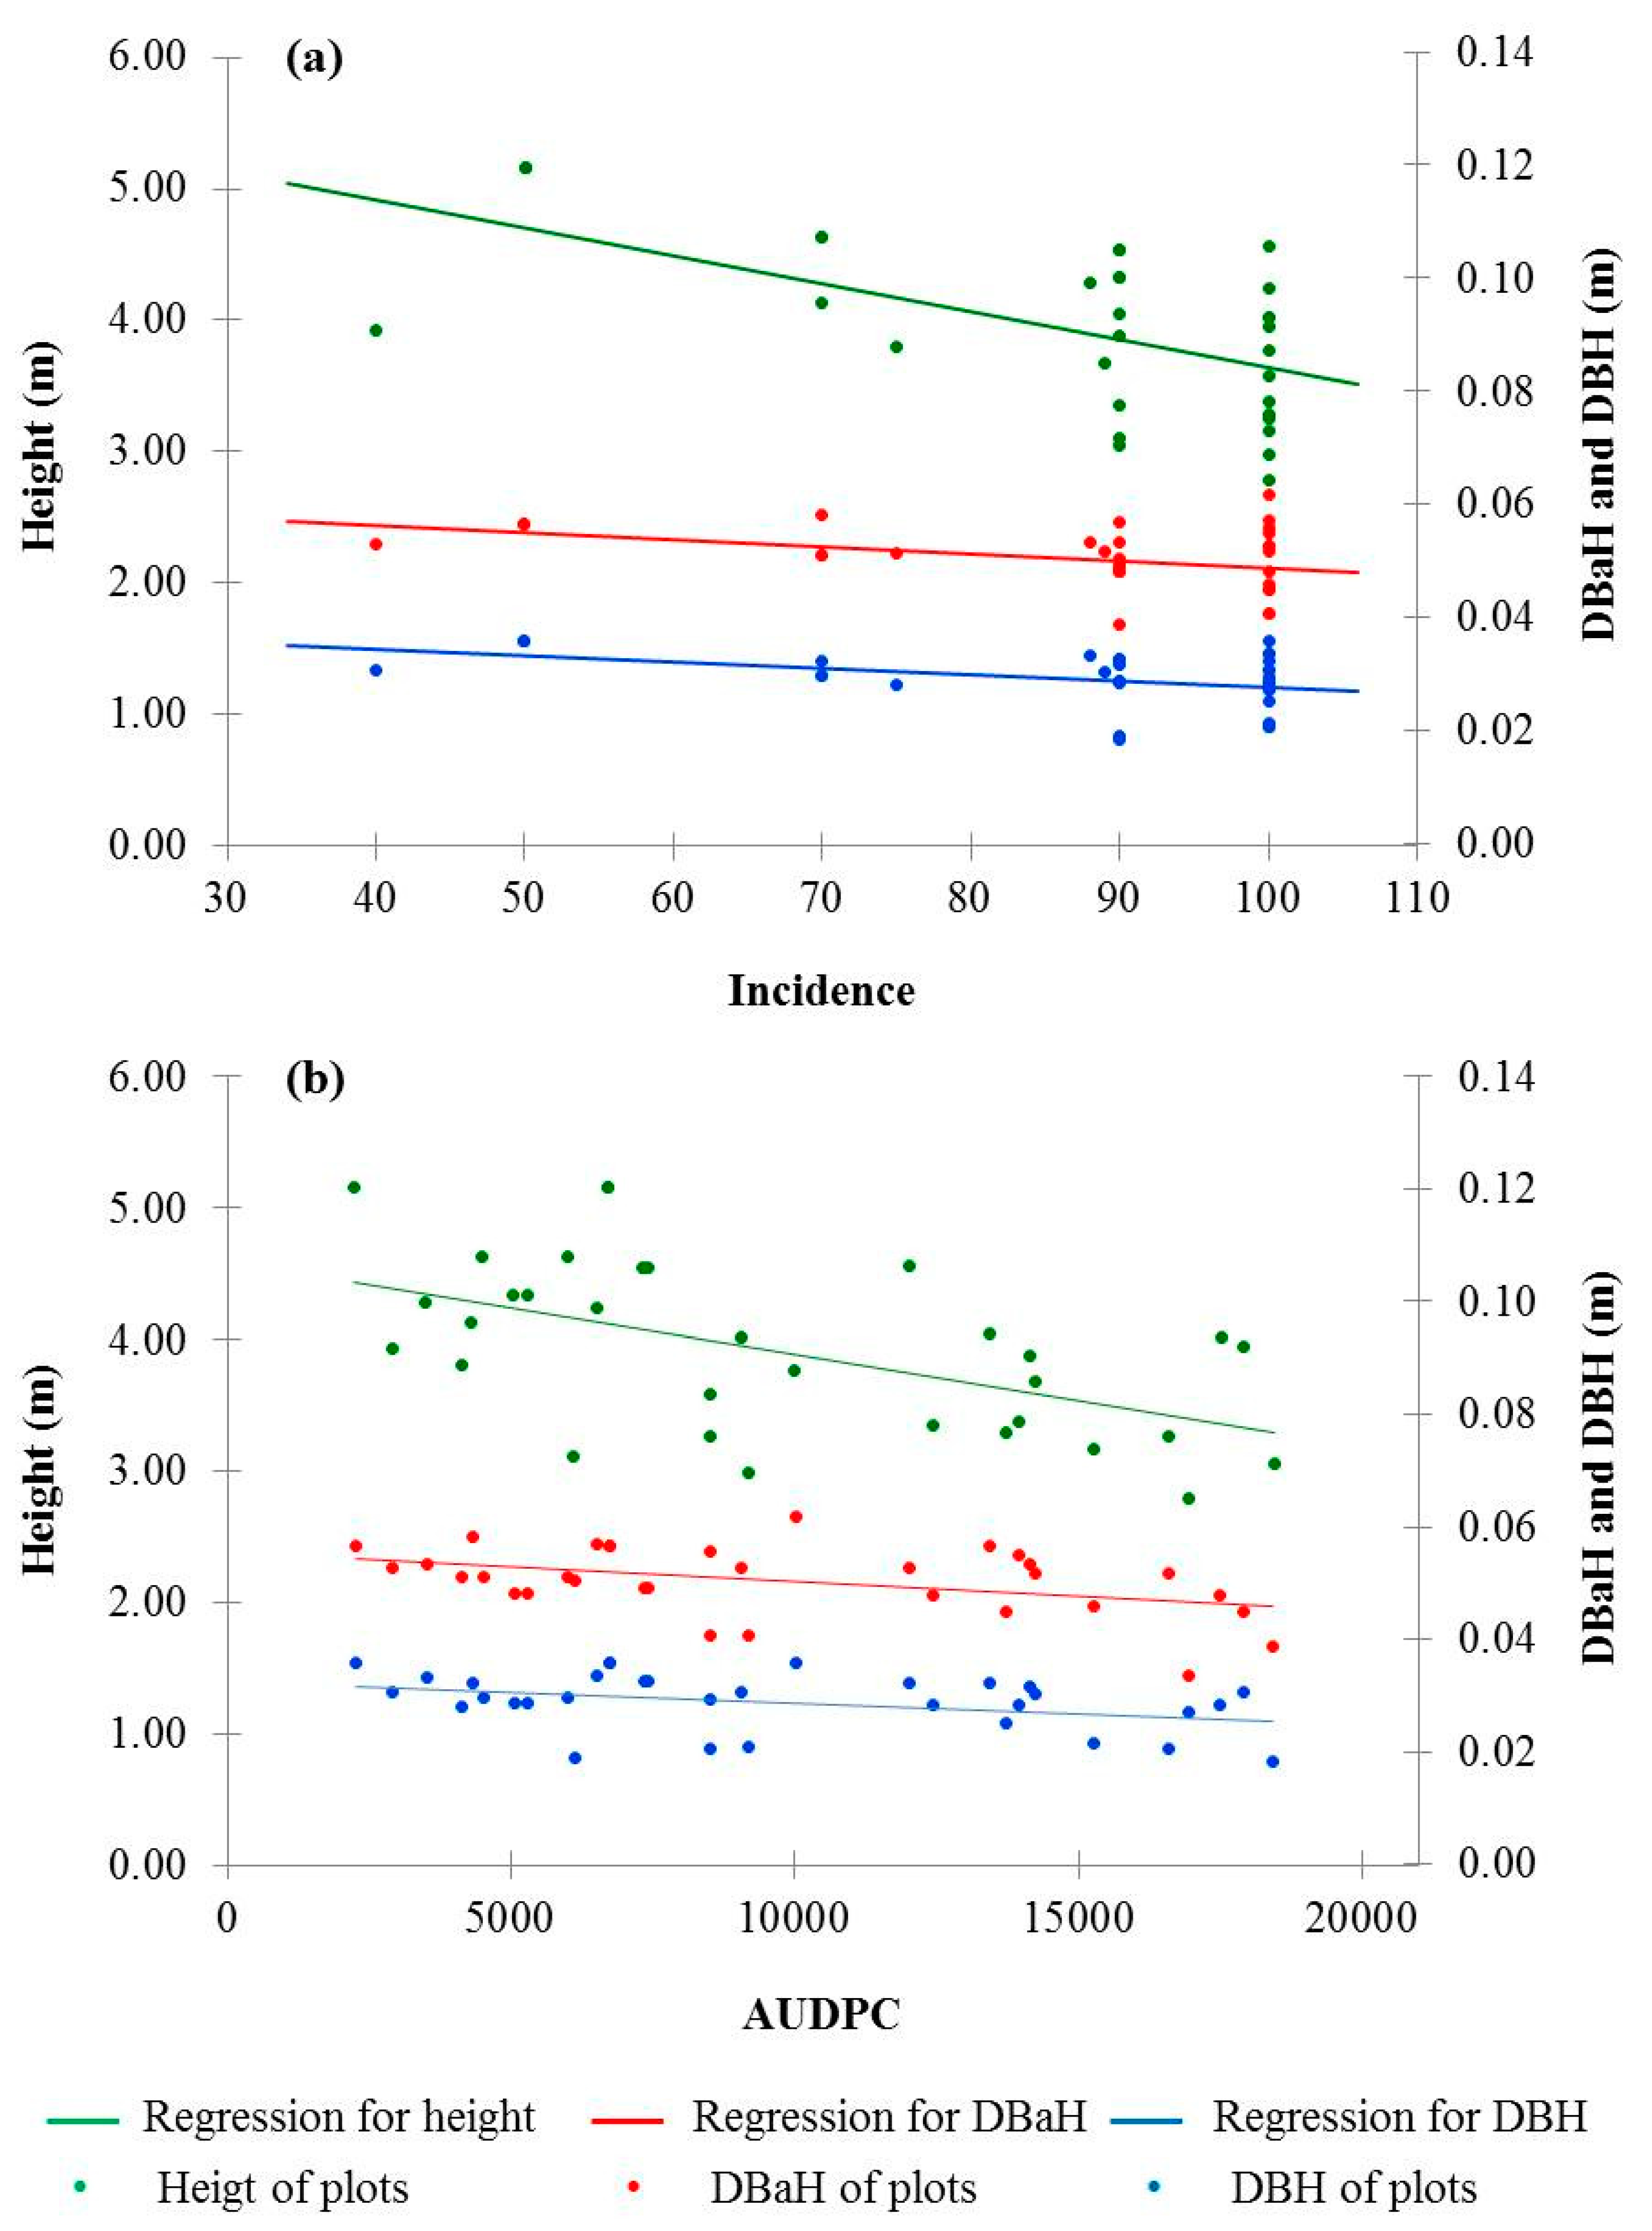
3.3. Correlation Analysis

Significant correlations (p < 0.05) were verified among bacterial leaf blight incidence, AUDPC values, and plant growth indicators. A negative correlation was found between AUDPC and the variables DBaH, DBH, and height; that is, the higher the AUDPC value, the lower the clone growth variables (DBaH, DBH, and height). Likewise, a negative correlation was observed for bacterial incidence versus DBH and height; i.e., the higher the incidence, the lower the values of plant DBH and height (Table 2). Regression analyzes were significant (p < 0.05) for all growth variables, both for incidence and for AUPDC, evidencing the influence of bacterial leaf blight on the initial growth of eucalyptus clones tested. It is also possible to note that height is the growth variable most affected by the disease (Figure 4).
During the assessment period, there was a significant influence of meteorological data on bacterial leaf blight incidence (p < 0.01) (Figure 5), which showed a negative correlation with rainfall and air relative humidity, but positive with average air temperature (Table 2).

4. Discussion

Bacterial leaf blight incidence and plant defoliation were observed in different eucalyptus clones under field conditions. Moreover, genetic material and assessment time showed a significant interaction. Gompertz and Logistic models were the best fit for the data presented in this study. According to Bergamim Filho et al. [14], in general, the Logistic and Gompertz models have the best fit in polycyclic diseases where pathogens spread among plants and/or leaves. On the other hand, monomolecular models best fit data for monocyclic diseases, such as soilborne pathogens. Foliar bacterial diseases are pathosystems polycyclic, in which the bacterial spreads between leaves and plants, mainly by water splash [15,16]. Several other studies with bacterial diseases have shown the above-mentioned models as a better fit for pathogen incidence data, both in the nursery and in the field [15,17,18,19].
Disease progress curves of the studied clones presented different rates and initial incidence. For clones A469 and VM01, initial incidence was zero, which led to a late onset of disease. In these clones, bacterial leaf blight incidence started only 60 days after planting. Whereas in clones 1250, 1253, and 1407, which had an initial incidence different from zero, it began 30 days after planting. The beginning of an outbreak relies, among other factors, on the initial inoculum source. In this study, the initial inoculum source might have been due to the presence of infected seedlings, since, after 20 days, plants had already shown leaf blight symptoms. Although it is impossible to compare disease progress rates for clones adjusted by different models [9], seven of the eight clones were adjusted with the same model, and those with the highest incidence rates also had the highest AUDPC values.
When assessing AUDPC values to observe the tolerance level of each clone, three of them were considered the most tolerant to bacterial blight, since they had the lowest AUDPC values. Two clones were classified as moderately tolerant, and the others as susceptible to bacterial leaf blight, i.e., presented the highest AUDPC. AUDPC value is used for comparing different treatments, such as pathogen resistance or tolerance between species, varieties, and clones. Vargas et al. [20] analyzed AUDPC values to determine resistance of Citrus spp. varieties to X. citri subsp. citri under field conditions; they reported differences among genotypes. Nociti et al. [21] also used AUDPC to assess the aggressiveness of strains of X. axonopodis pv. aurantifolii towards ‘Mexican’ lime; they found two groups in terms of relative aggressiveness. Similarly, Halfeld-Vieira and Souza [22] used the same kind of data to investigate the aggressiveness of X. axonopodis pv. phaseoli and its variant fuscans towards common beans; these authors found nine distinct groups. Considering other pathogens, resistance and susceptibility of eucalyptus clones and species have commonly been compared by means of AUDPC data [23,24,25,26].
About the disease resistance, there are species considered susceptible to bacterial leaf blight, such as E. urophylla, E. globulus, E. robusta, E. maidenii, E. pellita, E. saligna, E.viminalis, and E. cloeziana [2]. Occurrence of bacterial leaf blight has also been reported in the hybrid E. urophylla × E. grandis, commonly known as “urograndis” [27]. The clones tested in this study are hybrids of eucalyptus species considered susceptible, except for A469 (E. platiphylla), which stood out from the others and was considered the most tolerant, because it presented the lowest AUDPC value and one of the smallest disease progress rates.
Growth indicators, when correlated with incidence and AUDPC values, were influenced by the disease incidence, confirming the deleterious effect of bacterial infection on the initial growth of the clones. Bacterial leaf blight decreases the photosynthetic area of leaves in the plant and causes severe defoliation, resulting in decelerating plant growth [17]. Palladino et al. [28], studying products for bacterial leaf blight control in young plantations of E. dunni and E. grandis in Uruguay, observed that nine months after planting, even in plants with disease severity between 16% and 36%, plant growth was not different between treatments, specifically regarding plant height.
A negative correlation between rainfall and air relative humidity with bacterial leaf blight incidence was observed considering the total study period. However, at the beginning of this study, rainfall and air relative humidity were high, favoring bacteria spread and penetration through water film on the leaves. Even after a significant decrease in rainfall and air relative humidity, 100 days of after planting of seedlings, incidence continued to increase, since leaf wetting prior to infection is more critical than in the post-infection stage [17]. According to Fukui et al. [29], water availability is solely essential at the pathogen penetration stage, rather than after infection and colonization by bacteria. The increase in average temperature may have contributed to an increase in disease incidence. In other studies, incidence and severity of symptoms caused by bacteria rise with increasing temperatures [30,31]. According to Neves et al. [17], the optimum temperature range for development of bacterial leaf blight in eucalyptus is between 26 and 30 °C.

5. Conclusions

Under the conditions studied, the temporal progress of bacterial leaf spot was different among eucalyptus clones. Among the evaluated clones, none showed disease resistance, however clones A469, VM01, and 373 were the most tolerant. The disease impaired the initial growth of clones. The meteorological conditions, such as precipitation between 290 and 360 mm, temperature between 26 and 27 °C, and relative humidity between 80% and 84%, favored the increased incidence of bacterial leaf spot.
Considering that the establishment of plantations in the northern and north-eastern regions of Brazil will take place in climatic conditions favorable for bacterial leaf blight progress and that its incidence affects the initial growth of clones, preventive management measures should be performed, such as the choice of resistant clones or more tolerant and the use of disease-free seedlings.
However, in order for a clone to be recommended for the region, further studies are needed to investigate the behavior of these clones in relation to other diseases and also in relation to water stress, volumetric production, and wood quality.

Author Contributions

For Conceptualization, M.E.S.d.O., F.S.F., M.A.G.J., and A.S.d.O.; Methodology, M.E.S.d.O., F.S.F., and M.A.G.J.; Software, M.E.S.d.O.; Validation, M.E.S.d.O., F.S.F., M.A.G.J., A.S.d.O., and M.A.F.; Formal Analysis, M.E.S.d.O.; Investigation, M.E.S.d.O., F.S.F., M.A.G.J.; Resources, M.E.S.d.O.; Data Curation, M.E.S.d.O., F.S.F., M.A.G.J., A.S.d.O., R.G.M., and M.A.F.; Writing—Original Draft Preparation, M.E.S.d.O.; Writing—Review & Editing, M.E.S.d.O., F.S.F., R.G.M., and M.A.F.; Visualization, M.E.S.d.O., F.S.F., M.A.G.J., A.S.d.O., R.G.M., and M.A.F.; Supervision, M.A.F.; Project Administration, M.E.S.d.O.

Acknowledgments

We would like to acknowledge the scholarships from the Coordenação de Aperfeiçoamento de Pessoal de Nível Superior Coordination for the Improvement of Higher Education Personnel (CAPES).

Conflicts of Interest

The authors declare no conflict of interest.

References

  1. Ibá. Indústria Brasileira de Árvores. Available online: http://iba.org/images/shared/Biblioteca/IBA_RelatorioAnual2017.pdf (accessed on 15 December 2018).
  2. Alfenas, A.C.; Zauza, E.A.V.; Mafia, R.G.; Assis, T.F. Clonagem e Doenças do Eucalipto, 2nd ed.; UFV: Viçosa, Brazil, 2009; p. 500. [Google Scholar]
  3. Ferraz, H.G.M.; Badel, J.L.; Da Silva Guimarães, L.M.; Reis, B.P.; Tótola, M.R.; Gonçalves, R.C.; Alfenas, A.C. Xanthomonas axonopodis pv. eucalyptorum pv. nov. Causing Bacterial Leaf Blight on Eucalypt in Brazil. Plant Pathol. J. 2018, 34, 269–285. [Google Scholar]
  4. Gonçalves, R.C.; Lau, D.; Oliveira, J.R.; Maffia, L.A.; Cascardo, J.C.M.; Alfenas, A.C. Etiology of bacterial leaf blight of eucalyptus in Brazil. Trop. Plant Pathol. 2008, 33, 180–188. [Google Scholar] [CrossRef]
  5. Mafia, R.G.; Teixeira, L.P.; Ferreira, M.A. Produção de mudas de eucalipto sob dois sistemas de irrigação e a ocorrência da bacteriose foliar Xanthomonas axonopodis Vauterin. Sci. For. 2017, 45, 697–704. [Google Scholar] [CrossRef]
  6. Assis, T.F.; Mafia, R.G. Hibridação e clonagem. In Biotecnologia Florestal; Borém, A., Ed.; Suprema: Viçosa, Brazil, 2007; pp. 93–121. [Google Scholar]
  7. Arriel, D.A.A.; Fonseca, N.R.; Guimarães, L.M.S.; Hermenegildo, P.S.; Mafia, R.G.; Borges, N.; Souza, H.P.; Alfenas, A.C. Wilt and die-back of Eucalyptus spp. caused by Erwinia psidii in Brazil. For. Pathol. 2014, 44, 255–265. [Google Scholar] [CrossRef]
  8. EMBRAPA. Sistema Brasileiro de Classificação de Solos, 2nd ed.; Embrapa Solos: Rio de Janeiro, Brazil, 2006; p. 306. [Google Scholar]
  9. Jesus Junior, W.C.; Pozza, E.A.; Vale, F.X.R.; Aguilera, G.M. Análise temporal de epidemias. In Epidemiologia Aplicada ao Manejo de Doenças de Plantas; Vale, F.X.R., Jesus Junior, W.C., Zambolim, L., Eds.; Perffil: Belo Horizonte, Brazil, 2004; pp. 127–188. [Google Scholar]
  10. Campbell, C.L.; Madden, L.V. Introduction to Plant Disease Epidemiology; John Wiley & Sons: New York, NY, USA, 1990; p. 532. [Google Scholar]
  11. Cornell, J.A.; Berger, R.D. Factors that influence the value of the coefficient of determination in simple linear and non linear regression models. Phytopathology 1987, 77, 63–70. [Google Scholar] [CrossRef]
  12. Systat Software. SigmaPlot for Windows Version 12.0; Systat Software Inc.: San Jose, CA, USA, 2011. [Google Scholar]
  13. Ferreira, D.F. SISVAR Versão 5.3; Departamento de Ciências Exatas-UFLA: Lavras, Brazil, 2010. [Google Scholar]
  14. Bergamin Filho, A.; Amorim, L.; Hau, B. Análise temporal e espacial de epidemias. In O Essencial da Fitopatologia: Epidemiologia de Doenças de Planta; Zambolim, L., Jesus Júnior, W.C., Rodrigues, F.A., Eds.; UFV: Viçosa, Brazil, 2014; pp. 101–165. [Google Scholar]
  15. Marcuzzo, L.L.; Becker, W.F.; Fernandes, J.M.C. Alguns aspectos epidemiológicos da mancha bacteriana (Xanthomonas spp.) do tomateiro na região de Caçador/SC. Summa Phytopathol. 2009, 35, 132–135. [Google Scholar] [CrossRef]
  16. Romeiro, R.S. Bactérias Fitopatogênicas, 2nd ed.; UFV: Viçosa, Brazil, 2007. [Google Scholar]
  17. Neves, D.A.; Guimarães, L.M.S.; Ferraz, H.G.M.; Alfenas, A.C. Favorable conditions for X. axonopodis infection in Eucalyptus spp. Trop. Plant Pathol. 2014, 39, 428–433. [Google Scholar] [CrossRef]
  18. Behlau, F.; Belasque Junior, J.; Bergamin Filho, A.; Leite Junior, R.P. Incidência e severidade de cancro cítrico em laranja ‘Pêra Rio’ sob condições de controle químico e proteção com quebra-vento. Fitopatol. Bras. 2007, 32, 311–317. [Google Scholar] [CrossRef]
  19. Fininsa, C.; Yuen, J. Temporal progression of bean common bacterial blight (Xanthomonas campestris pv. Phaseoli) in sole and intercropping systems. Eur. J. Plant Pathol. 2002, 108, 485–495. [Google Scholar] [CrossRef]
  20. Vargas, R.G.; Gonçalves-Zuliani, A.M.O.; Croce Filho, J.; Carvalho, S.A.; Nocchi, P.T.R.; Nunes, W.M.C. Avaliação da resistência de variedades de Citrus spp. à Xanthomonas citri subsp. citri na região Noroeste Paranaense, em condições de campo. Summa Phytopathol. 2013, 39, 235–241. [Google Scholar] [CrossRef]
  21. Nociti, L.A.S.; Camargo, M.; Rodrigues Neto, J.; Francischini, F.J.B.; Belasque Júnior, J. Agressividade de linhagens de X. axonopodis pv. aurantifolii Tipo C em lima ácida ‘Galego’. Fitopatol. Bras. 2006, 31, 140–146. [Google Scholar] [CrossRef]
  22. Halfeld-Vieira, B.A.; Sousa, R.M. Virulência de isolados de X. axonopodis pv. phaseoli e sua variante fuscans. Ciênc. Agrotéc. 2000, 24, 94–102. [Google Scholar]
  23. Rossi, A.P. Ferrugem do Eucalipto: Análise Temporal e Quantificação de Danos. Master’s Thesis, Universidade Federal do Espírito Santo; Centro de Ciências Agrárias, Jerônimo Monteiro, Brazil, 2013. [Google Scholar]
  24. Silva, D.E.M. Quantificação da Resistência Parcial em Espécies de Eucalipto à Ferrugem (Puccinia Psidii Winter). Master’s Thesis, Universidade Federal do Rio de Janeiro, Seropédica, Brazil, 2012. [Google Scholar]
  25. Gonçalves, J.L. Sazonalidade de Ocorrência de Mofo Cinzento, Oídio e Manchas Bacterianas Foliares em Dois Viveiros de Produção de Mudas Clonais de Eucalipto. Master’s Thesis, Universidade Estadual Paulista “Júlio de Mesquita Filho”, Faculdade de Ciências Agronômicas, Botucatu, Brazil, 2014. [Google Scholar]
  26. Valeriano, R.; Pozza, E.A.; Santos, L.A.; Chaves, E.; Barbosa Junior, M.P.; Ferreira, M.A. Escala diagramática e reação diferencial de clones para Oídio do Eucalipto. Sci. For. 2015, 43, 51–61. [Google Scholar]
  27. Auer, C.G.; Santos, A.F.; Rodrigues, L.M.R.; Rodrigues Neto, J. Ocorrência de mancha foliar bacteriana em plantios de eucalipto no Estado do Paraná. Summa Phytopathol. 2010, 36, 82. [Google Scholar]
  28. Palladino, C.; Pérez, G.; Alonso, R.; Pérez, C.A. Identificación y control de enfermedades bacterianas em plantaciones jóvenes de Eucalyptus dunnii Y E. grandis. In Jornada Técnica de Protección Forestal: Avances de Investigación en Plagas y Enfermedades Forestales; Balmelli, G., Simeto, S., Martínez, G., Gómez, D.V., Eds.; INIA: Montevideo, Uruguay, 2013; pp. 29–38. [Google Scholar]
  29. Fukui, R.; Fukui, H.; Alvarez, A.M. Effect of temperature on the incubation period and leaf colonization in bacterial blight of Anthurim. Phytopathology 1999, 89, 1007–1014. [Google Scholar] [CrossRef] [PubMed]
  30. Zerh, E.; Shepard, D.P.; Bridges, W.C. Bacterial spot of peach as influenced by water congestion, leaf, wetness duration, and temperature. Plant Dis. 1996, 80, 339–341. [Google Scholar]
  31. Pria, M.D.; Christiano, R.C.S.; Furtado, E.L.; Amorim, L.; Bergamin Filho, A. Effects of temperature and leaf wetness duration on infection of sweet oranges by Asiatic citrus canker. Plant Pathol. 2006, 55, 657–663. [Google Scholar] [CrossRef]
Figure 1. Bacterial leaf blight incidence as a function of time in different eucalyptus clones. Comparison between observed data and disease progress curves obtained by observed means and those obtained by applying the Logistic, Gompertz, and Monomolecular models. (a) Clone A49; (b) Clone VM01; (c) Clone 373; (d) Clone VE41; (e) Clone 05; (f) Clone 1250; (g) Clone 1253; (h) Clone 1407.
Forests 10 00839 g001
Figure 2. Residual scatterplot of transformed data (Gompit, Logit, and Monit) as a function of time for the Logistic, Gompertz, and Monomolecular models in different eucalyptus clones. (a) Clone A49; (b) Clone VM01; (c) Clone 373; (d) Clone VE41; (e) Clone 05; (f) Clone 1250; (g) Clone 1253; (h) Clone 1407.
Forests 10 00839 g002
Figure 3. Area under the bacterial-blight-progress curves in different eucalyptus clones. Bars with the same letters indicate grouping of clones (p ≤ 0.05) by the Scott–Knott test.
Forests 10 00839 g003
Figure 4. Growth variables (Height; DBaH; DBH) as a function of incidence (a) and AUDPC (b) of bacterial leaf blight. DBaH: diameter at base height; DBH: diameter at breast height; AUDPC: area under the disease-progress curve.
Forests 10 00839 g004
Figure 5. Bacterial leaf blight incidence (monthly average) in eucalyptus, rainfall (accumulated in the month), air relative humidity (monthly average) and average air temperature (monthly average) recorded between February and September 2014.
Forests 10 00839 g005
Table 1. Parameters used in the regression analysis of linear models to compare model fits (Logistic, Gompertz, and Monomolecular) for bacterial leaf blight in eight eucalyptus clones.
ClonesModelR2R2*MSE(1)YoXo (Intercept)Xo (SD)r (rate)r (SD)
A469Log0.798 **0.81718.289 **0.000−21.918 **1.9650.106 *0.013
Gom0.873 **0.9960.462 **0.000−3.967 **0.3120.022 **0.002
Mon0.610 **0.7380.225 **−0.660−0.507 *0.2180.007 **0.001
VM01Log0.644 **0.69744.533 **0.000−22.095 **2.8660.111 **0.019
Gom0.477 **0.9367.658 **0.000−4.344 *1.1880.033 **0.008
Mon0.273 *0.7345.876 *−1.643−0.9721.0410.018 *0.007
373Log0.699 **0.87639.479 **0.000−18.598 **2.6990.118 **0.018
Gom0.486 **0.91917.144 **0.000−4.052 *1.7780.050 **0.012
Mon0.3440.59316.824−7.645−2.1571.7620.0370.012
VE41Log0.392 **0.84724.773 **0.0005−7.454 **2.1380.049 **0.015
Gom0.630 **0.9691.714 **0.0007−1.973 **0.5620.021 **0.004
Mon0.519 **0.9681.222 **−0.6820−0.5200.4750.014 **0.003
05Log0.667 **0.79552.971 **0.000−16.179 **3.1260.127 **0.021
Gom0.582 **0.96221.055 **0.000−4.579 *1.9710.067 **0.013
Mon0.495 **0.74520.258 **−8.309−2.2311.9330.055 **0.013
1250Log0.249 *0.97955.791 *0.082−2.4093.2080.053 *0.022
Gom0.209 *0.99635.723 *0.5420.4892.5670.038 *0.017
Mon0.1810.99733.5420.7411.3492.4870.0340.017
1253Log0.505 **0.71156.223 **0.000−7.719 *3.2200.094 **0.022
Gom0.497 **0.99624.445 **0.010−1.5272.1230.061 **0.014
Mon0.460 **0.99422.118 **−0.184−0.1692.0200.054 **0.014
1407Log0.213 *0.99880.525 *0.8531.7623.8540.058 *0.026
Gom0.1920.98653.1070.9874.3663.1300.0440.021
Mon0.1780.97949.5550.9935.0193.0230.0410.021
** Significant (p < 0.01); * Significant (p < 0.05); Log: Logistic; Gom: Gompertz; Mon: Monomolecular. R2: coefficients of determination of the linear regression analysis; R2*: coefficients of determination for adjustment between observed and predicted values of x; MSE(1): mean square of the residue of the linear regression analysis; Yo: initial incidence; Xo: linear coefficient; SD: standard deviation; r: angular coefficients, rate.
Table 2. Pearson’s and Spearman’s correlation among bacterial leaf blight incidence, area under the disease-progress curve, growth-related variables, and correlation between bacterial leaf blight incidence and meteorological data over time.
VariablesSpearman’s CorrelationPearson’s Correlation
IncidenceAUDPC
AUDPC−0.037 *
DBaH−0.299 *−0.425 *
DBH−0.360 *−0.379 *
Height−0.523 **−0.564 **
Rainfall−0.587 **-
Average air temperature0.687 **-
Air relative humidity−0.687 **-
Pearson’s correlation was applied for the variables with the normal distribution according to the Shapiro–Wilks (W) test. While the Spearman’s correlation was applied for the variables with the non-normal distribution according to the Shapiro-Wilks test (W). ** Significant correlations (p < 0.01); * Significant correlations (p < 0.05); AUDPC: area under the disease-progress curve; DBaH: diameter at base height; DBH: diameter at breast height.

