Article

DNA Barcoding Analysis and Phylogenetic Relation of Mangroves in Guangdong Province, China

1
Key Laboratory of State Forestry Administration on Tropical Forestry Research, Research Institute of Tropical Forestry, Chinese Academy of Forestry, Guangzhou 510520, China
2
Zhaoqing Xinghu National Wetland Park Management Center, Zhaoqing 526060, China
3
Key Laboratory of Plant Resources Conservation and Sustainable Utilization, South China Botanical Garden, Chinese Academy of Sciences, Guangzhou 510650, China
4
University of Chinese Academy of Sciences, Beijing 100049, China
*
Author to whom correspondence should be addressed.
Forests 2019, 10(1), 56; https://doi.org/10.3390/f10010056
Submission received: 9 December 2018 / Revised: 3 January 2019 / Accepted: 4 January 2019 / Published: 12 January 2019

Abstract

:
Mangroves are distributed in the transition zone between sea and land, mostly in tropical and subtropical areas. They provide important ecosystem services and are therefore economically valuable. DNA barcoding is a useful tool for species identification and phylogenetic reconstruction. To evaluate the effectiveness of DNA barcoding in identifying mangrove species, we sampled 135 individuals representing 23 species, 22 genera, and 17 families from Zhanjiang, Shenzhen, Huizhou, and Shantou in the Guangdong province, China. We tested the universality of four DNA barcodes, namely rbcL, matK, trnH-psbA, and the internal transcribed spacer of nuclear ribosomal DNA (ITS), and examined their efficacy for species identification and the phylogenetic reconstruction of mangroves. The success rates for PCR amplification of rbcL, matK, trnH-psbA, and ITS were 100%, 80.29% ± 8.48%, 99.38% ± 1.25%, and 97.18% ± 3.25%, respectively, and the rates of DNA sequencing were 100%, 75.04% ± 6.26%, 94.57% ± 5.06%, and 83.35% ± 4.05%, respectively. These results suggest that both rbcL and trnH–psbA are universal in mangrove species from the Guangdong province. The highest success rate for species identification was 84.48% ± 12.09% with trnH-psbA, followed by rbcL (82.16% ± 9.68%), ITS (66.48% ± 5.97%), and matK (65.09% ± 6.00%), which increased to 91.25% ± 9.78% with the addition of rbcL. Additionally, the identification rate of mangroves was not significantly different between rbcL + trnH-psbA and other random fragment combinations. In conclusion, rbcL and trnH-psbA were the most suitable DNA barcode fragments for species identification in mangrove plants. When the phylogenetic relationships were constructed with random fragment combinations, the optimal evolutionary tree with high supporting values (86.33% ± 4.16%) was established using the combination of matK + rbcL + trnH-psbA + ITS in mangroves. In total, the 476 newly acquired sequences in this study lay the foundation for a DNA barcode database of mangroves.

1. Introduction

In 2003, Hebert [1] proposed a novel DNA barcoding technology to expedite the process of species identification. Around 2005, the concept of DNA barcoding was introduced into botanical research [2,3]. In 2009, the CBOL(Consortium for the Barcode of Life) Plant Working Group initially identified and recommended the use of the chloroplast-derived DNA barcode fragments rbcL and matK [4]. In addition, trnH-psbA, the internal spacer region of the chloroplast gene, and the ITS region of the nuclear genome were also investigated [5,6,7]. Further research is required to compare DNA barcode fragments to test their efficacy for species identification [8,9,10,11]. Previous studies on the DNA barcoding of plants have mainly focused on tropical and subtropical forests [12,13,14,15]. In addition, sequences obtained from DNA barcode fragments can also be used to reconstruct the phylogenetic relationships of specific biological groups, and this has become a new research hotspot in recent years [16,17,18]. This research promotes the integration of phylogenetic analysis, ecology, and barcoding technology and develops our understanding of evolutionary biology and other related disciplines [19,20,21,22].
Mangroves, in the broad sense, are woody plant communities growing in tropical and subtropical intertidal zones, which play an important role in maintaining the ecological balance of coastal zones [23,24]. There are 84 species of 24 genera and 16 families of mangrove plants in the world, including 70 species of 16 genera and 11 families of true mangrove plants and 14 species of eight genera and five families of semi-mangrove plants [25]. There are 25 species of mangrove plants from Guangdong, including 16 true mangroves and 9 semi-mangroves [26]. There are many similar species of mangroves, and their distribution areas are overlapped. It is difficult to identify similar mangrove species using the external morphology of plants, such as Sonneratia alba J. Smith, Sonneratia caseolaris (L.) Engl., Sonneratia Hainanesis Ko, E. Y. Chen et W. Y. Chen, Sonneratia paracaseolaris W. C. Ko et al. or Bruguiera sexangula (Lour.) Poir and Bruguiera sexangula (Lour.) Poir. var. rhynchopetala Ko. Moreover, it is hard to understand the evolutionary relationship between mangrove species with traditional classification methods. DNA barcoding in animals [27,28], insects [29,30], tropical and subtropical plants [19,31], and microorganisms [32,33] have achieved reliable reconstructions of evolutionary relationships, successfully identified species of the same genus, and discovered new species or cryptic species. In this study, we aimed to investigate the universality of DNA barcoding in the mangrove flora, which is in the transition zone between land and water, and to construct the phylogenetic trees of mangrove flora, to provide a scientific basis for the conservation of mangrove biodiversity.

2. Materials and Methods

2.1. Plant Material

In this study, the main distribution areas of mangroves in Guangdong were selected, namely the mangrove protection areas in Shenzhen, Huizhou, and Shantou in Eastern Guangdong and Zhanjiang in Western Guangdong. Specific sampling location information is shown in Table 1. According to the DNA barcode sample collection specifications of Gao [34], two to three individuals of each mangrove species were sampled. This involved taking fresh leaves and buds to facilitate the extraction of DNA molecular materials. Each individual sampled was more than 20 m apart. The test material was dried with silica gel after collection. A total of 135 individuals of mangrove plants were collected. Based on expert (LIAO and LI) identification, the individuals were classified into 23 species (including two mangrove companion species) of 22 genera belonging to 17 families. The number of true mangrove and semi-mangrove species sampled in this study accounted for 84% of the 25 species of mangrove plants in Guangdong province [26]. Among them, B. sexangula (Lour.) Poir and B. sexangula (Lour.) Poir. var. rhynchopetala Ko, which were introduced by humans, are almost extinct, so they were not sampled.

2.2. DNA Extraction and Sequence Analysis

The DNA of mangrove plants was extracted from silica gel-dried leaf material following a modified version of the cetyltrimethyl ammonium bromide (CTAB) protocol of DoyleandDoyle [35]. According to the recommendation of the international union for biological barcoding [4] and previous studies [13,36,37] on regional plant DNA barcoding, a total of four molecular sequences including chloroplast rbcL, matK, trnH–psbA, and nuclear genome ITS were selected for use as amplification fragments. Referrals to the PCR system recommended by the plant working group of the international DNA barcode alliance for life, optimization, and adjustment were made. Primer information and amplification procedures are provided in Table 2. All amplification products were sent to Guangzhou after gel electrophoresis detection for complete sequencing; BLAST (Basic Local Alignment Search Tool) searches were performed using GenBank for the sequences obtained after bidirectional sequencing of the four fragments. If significant inconsistencies were found between the sequences and the original species, reasons were found and reextracted or reconfirmed by consulting experts, until the BLAST results of the sequences and the original species were of the same genus or family. SeqMan 5.00 (DNASTAR package, Madison, WI, USA) was used to splice and proofread the obtained sequences. The sequences were aligned in Geneious 11.1.3 (Biomatters Ltd, Auckland, New Zealand) using the MAFFT (Multiple Alignment using Fast Fourier Transform) algorithm with the default parameters.

2.3. Statistical Analysis

PCR amplification success rates and sequencing success rates were calculated following Kress [19]. The success rate of PCR amplification refers to the percentage of successful individuals of a segment in all individuals of the segment. BLAST was used to evaluate the efficacy of the species identification method. Firstly, a local database was established for the four DNA fragments in Geneious 11.1.3 [41], and all sequence comparisons were saved as *. fasta files to adjust the sequence direction and clear the gap between sequences. BLAST-2.7.1+ (https://www.ncbi.nlm.nih.gov/ package, National Center for Biotechnology Information, USA) was used to compare each sequence with all sequences in the database, and the percentage of identical sites was used as the quantification standard. If the minimum value of the identical sites of the same species was greater than the value between individuals of all other species, then we considered that the sequence of this species had been accurately identified. The success rate of identifications was determined by multiplying the percentage of species successfully identified by the success rate of sequencing the segment. Joint fragment identification is the result of accumulation on a single fragment [13,41].

3. Results

3.1. Sequence Universality

Sequence statistics were calculated for 135 individuals of 23 species of mangrove plants. The results (Table 3) showed a total of 496 DNA barcode fragments were obtained, with a sequence acquisition rate of 88.15% (476 divided by 540). Among them, a total of 118 sequences of mangrove plants from the Zhanjiang mangrove reserve were obtained. The highest success rate for PCR amplification were with rbcL and trnH-psbA fragments, followed by ITS and matK. The highest sequencing success rate was 100% with the rbcL fragment, followed by trnH-psbA, ITS, and matK.
A total of 131 sequences of mangrove plants from the mangrove reserve of Shenzhen were obtained. The highest amplification success rates were with both rbcL and trnH-psbA, followed by ITS and matK. The highest sequencing success rate was 100% with rbcL, followed by trnH-psbA, ITS, and matK. A total of 141 sequences of mangrove plants from the Huizhou mangrove reserve were obtained. The highest amplification success rates were with rbcL, followed by ITS, trnH-psbA, and matK. The highest sequencing success rate was 100% with rbcL, followed by trnH-psbA, ITS, and matK. A total of 86 sequences of mangrove plants from the Shantou mangrove reserve were obtained. The amplification success rates were 100% with rbcL, trnH-psbA or ITS, and 91.67% with matK. The highest sequencing success rate was 100% for rbcL, followed by trnH-psbA, ITS, and matK.

3.2. Species Delimitation

The true mangroves and semi-mangroves distributed in Guangdong are all single-genus and single-species, except Sonneratia and Bruguiera. Therefore, only the success rates of species-level identification are discussed here. BLAST results showed that the highest success rate of species identification was 84.48% ± 12.09% with trnH-psbA, followed by 82.16% ± 9.68% with rbcL, 66.48% ± 5.97% with ITS, and 65.09% ± 6.00% with matK (Figure 1). However, more species were successfully identified with rbcL fragments than with trnH-psbA fragments in any region, except for Shantou. The main difference was that trnH-psbA could accurately distinguish S. caseolaris (L.) Engl. and Sonneratia apetala Buch.-Ham, but rbcL could not.
According to the statistical analysis of different combinations of multiple fragments, the identification success rate of rbcL + trnH-psbA was 91.25% ± 9.78%, which increased to 91.88% ± 8.62% with the addition of ITS. The success rate of species identification with all fragments was consistent with that of rbcL + trnH-psbA + matK (94.38% ± 4.48%). These results suggest that the combination of certain fragments can increase the success rate of barcoding for species identification.

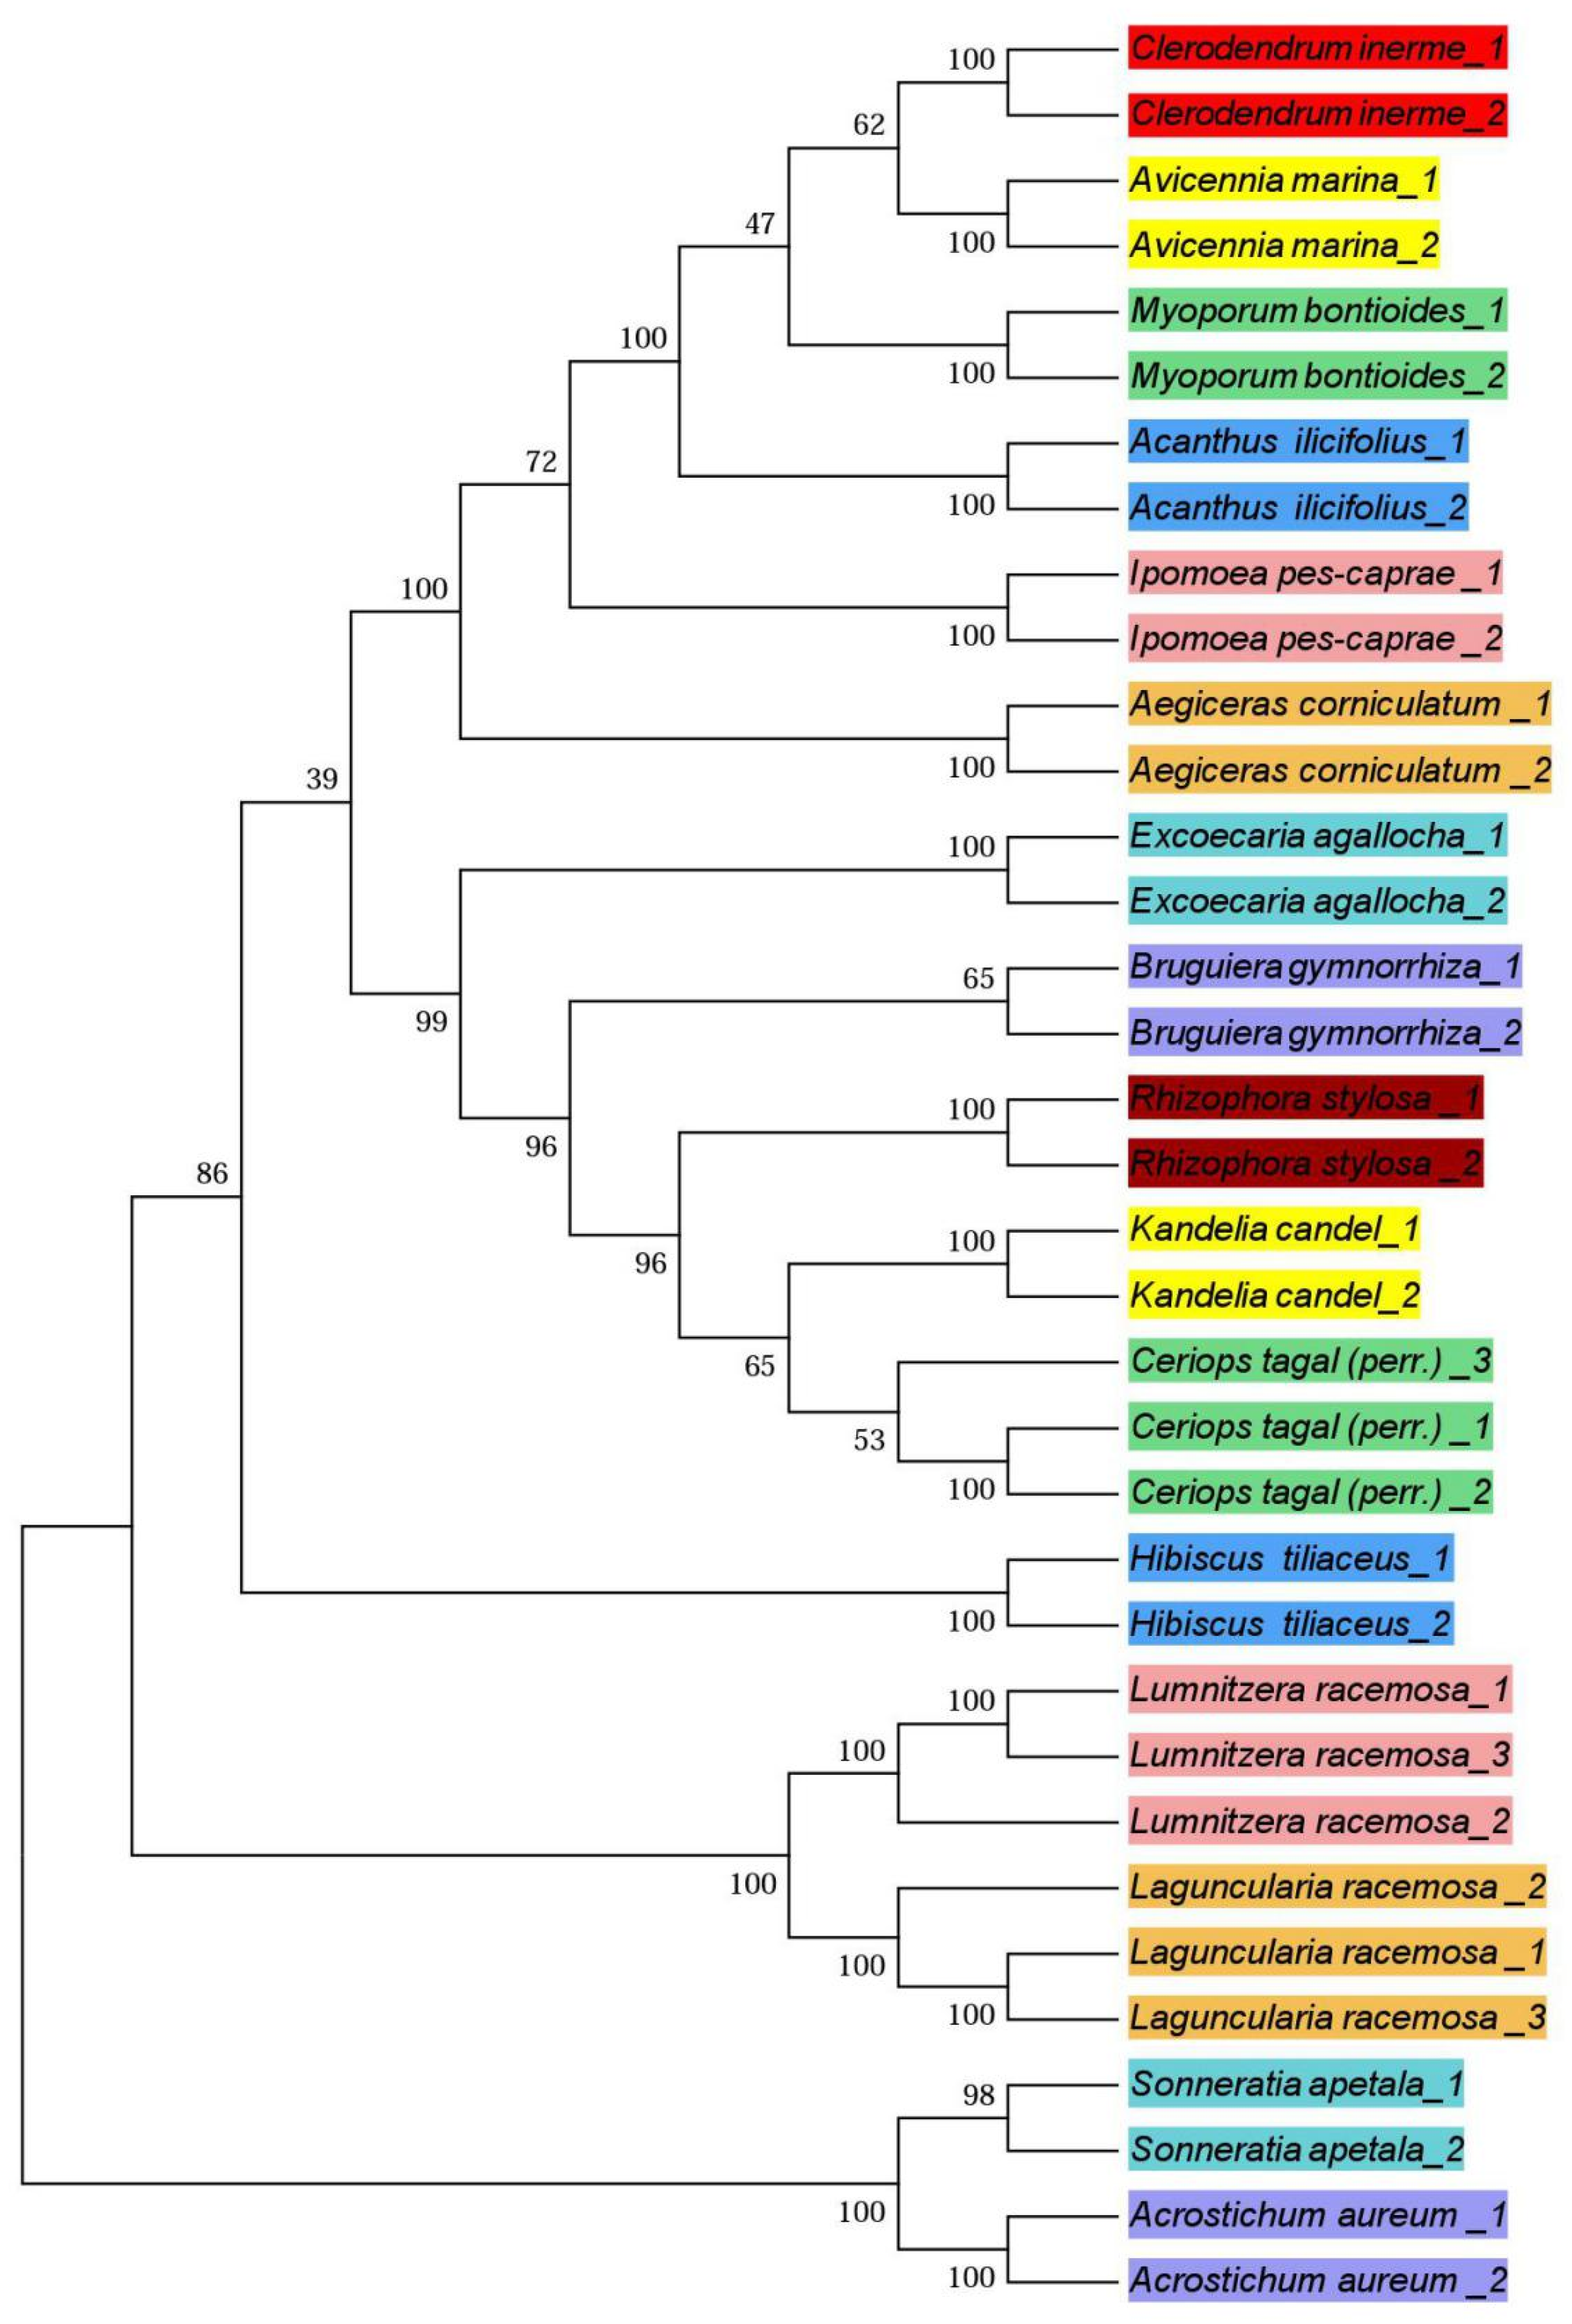
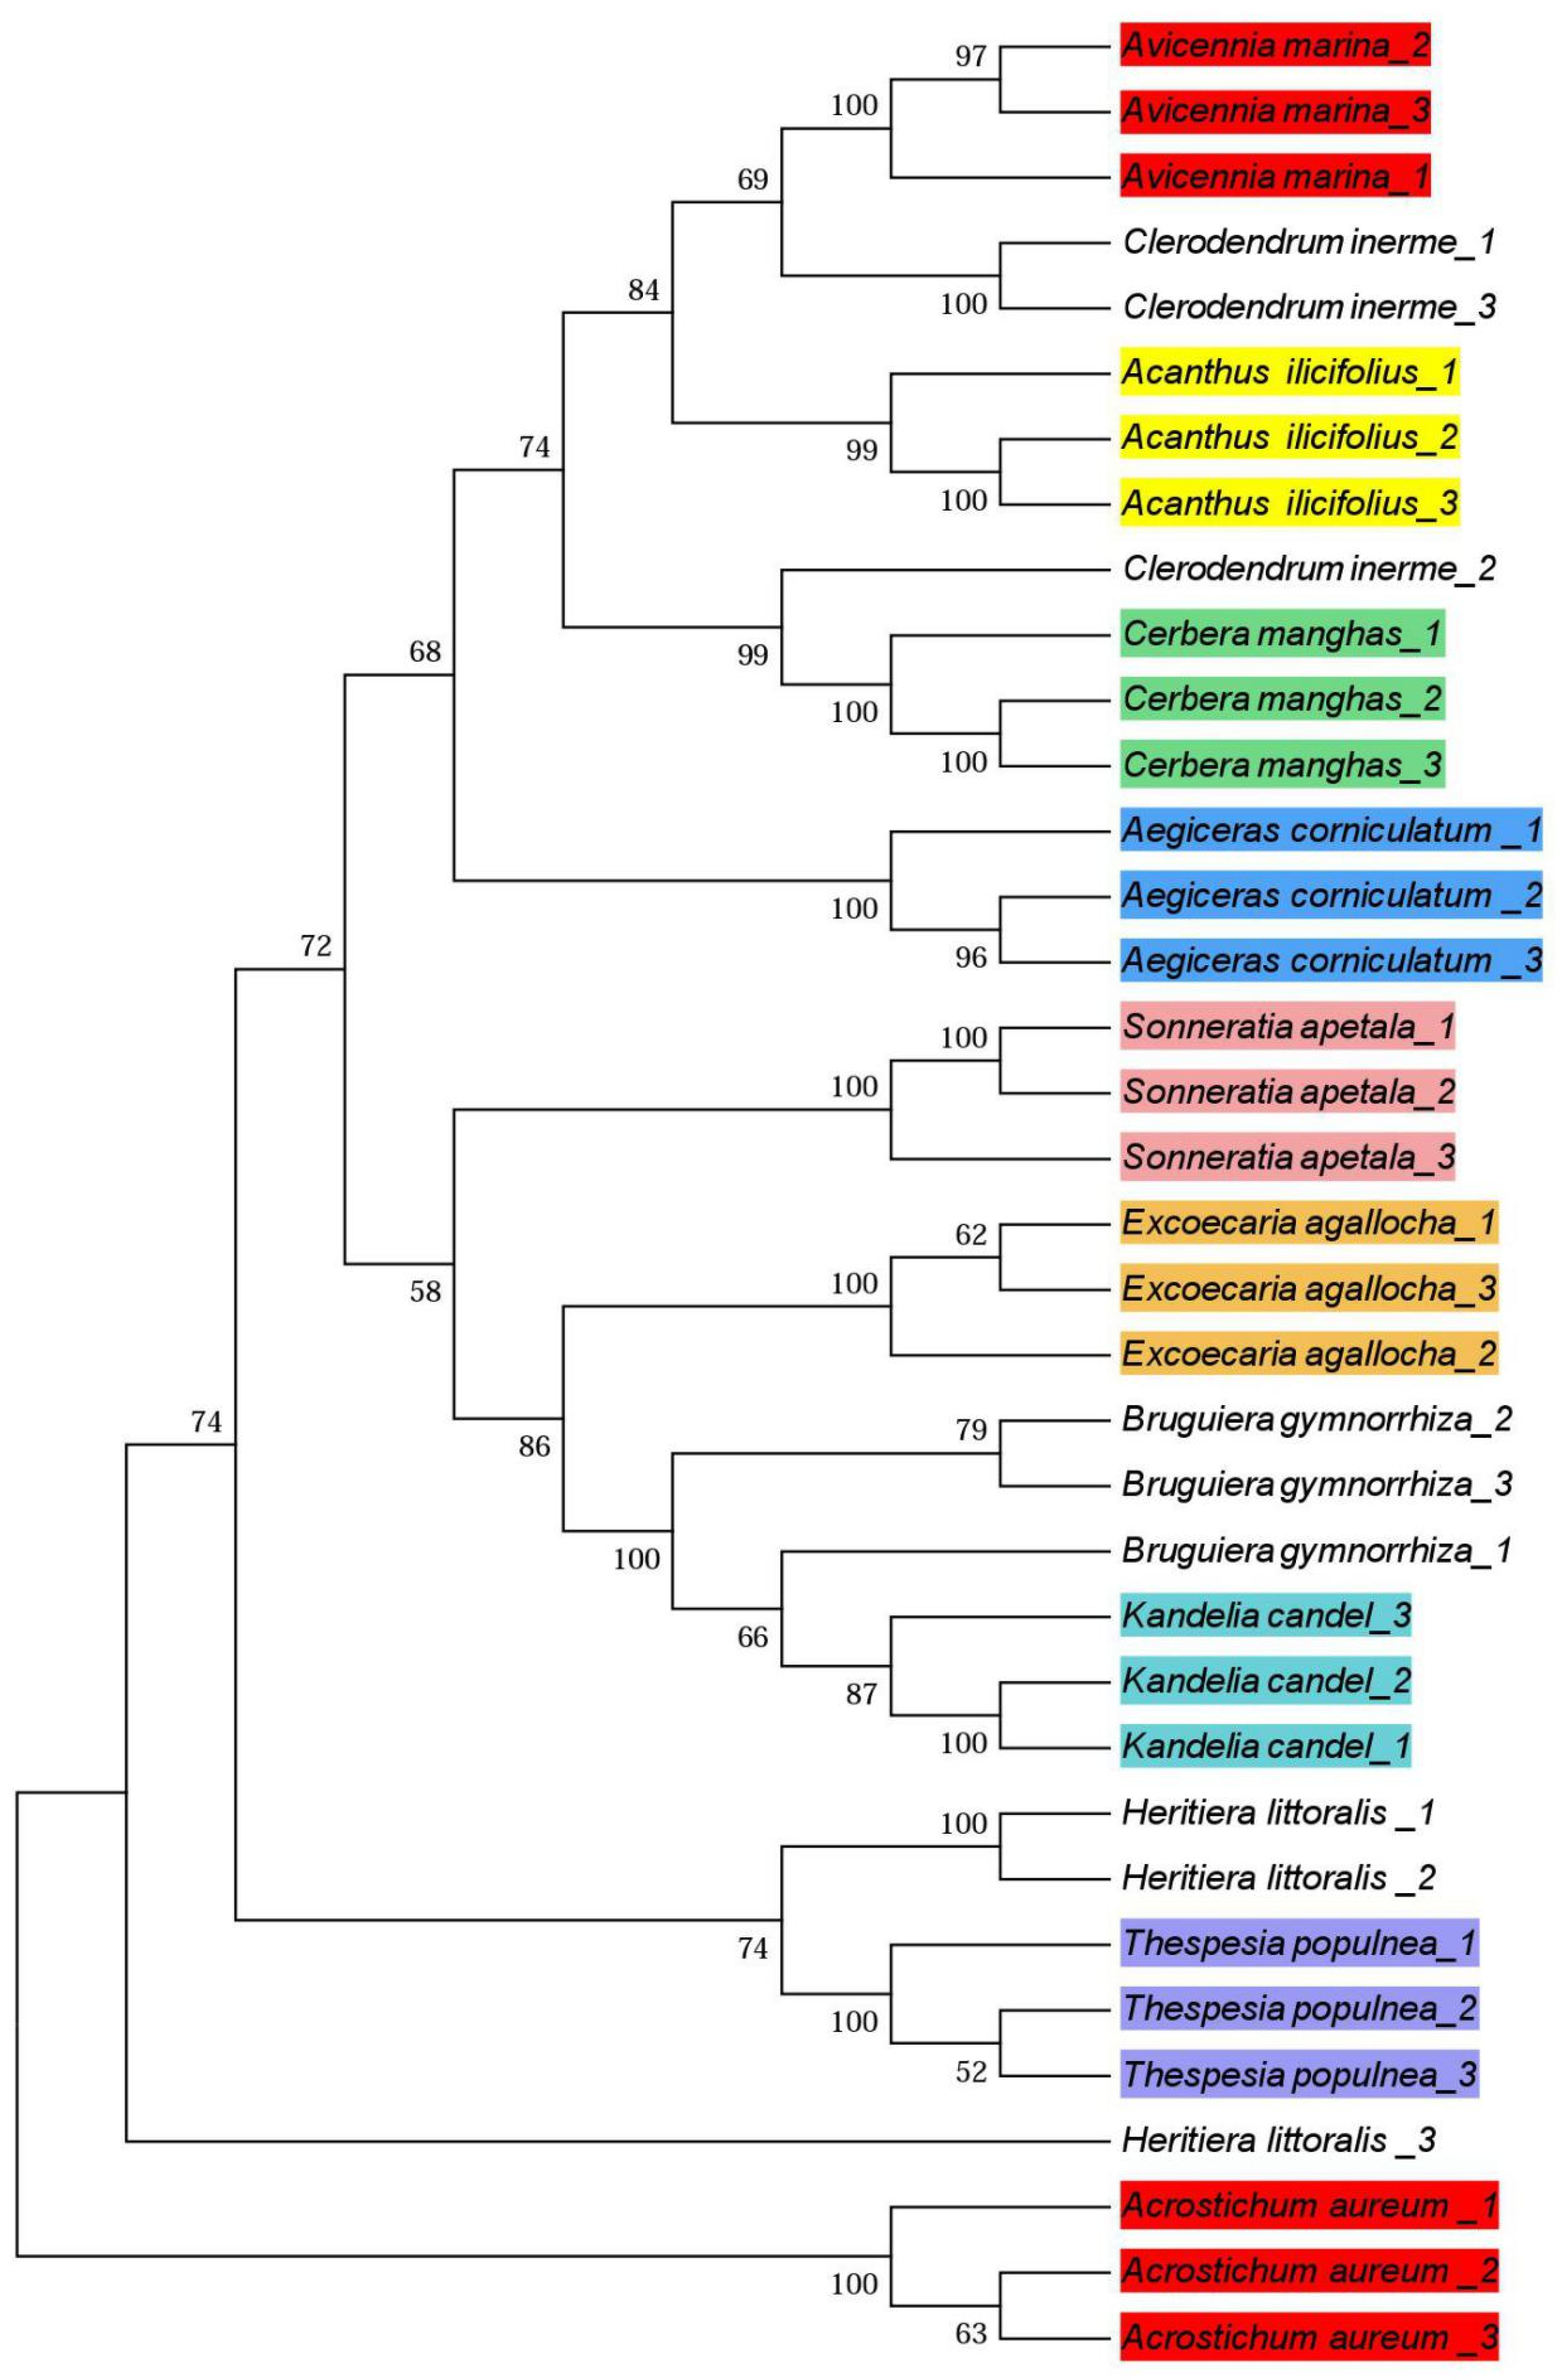
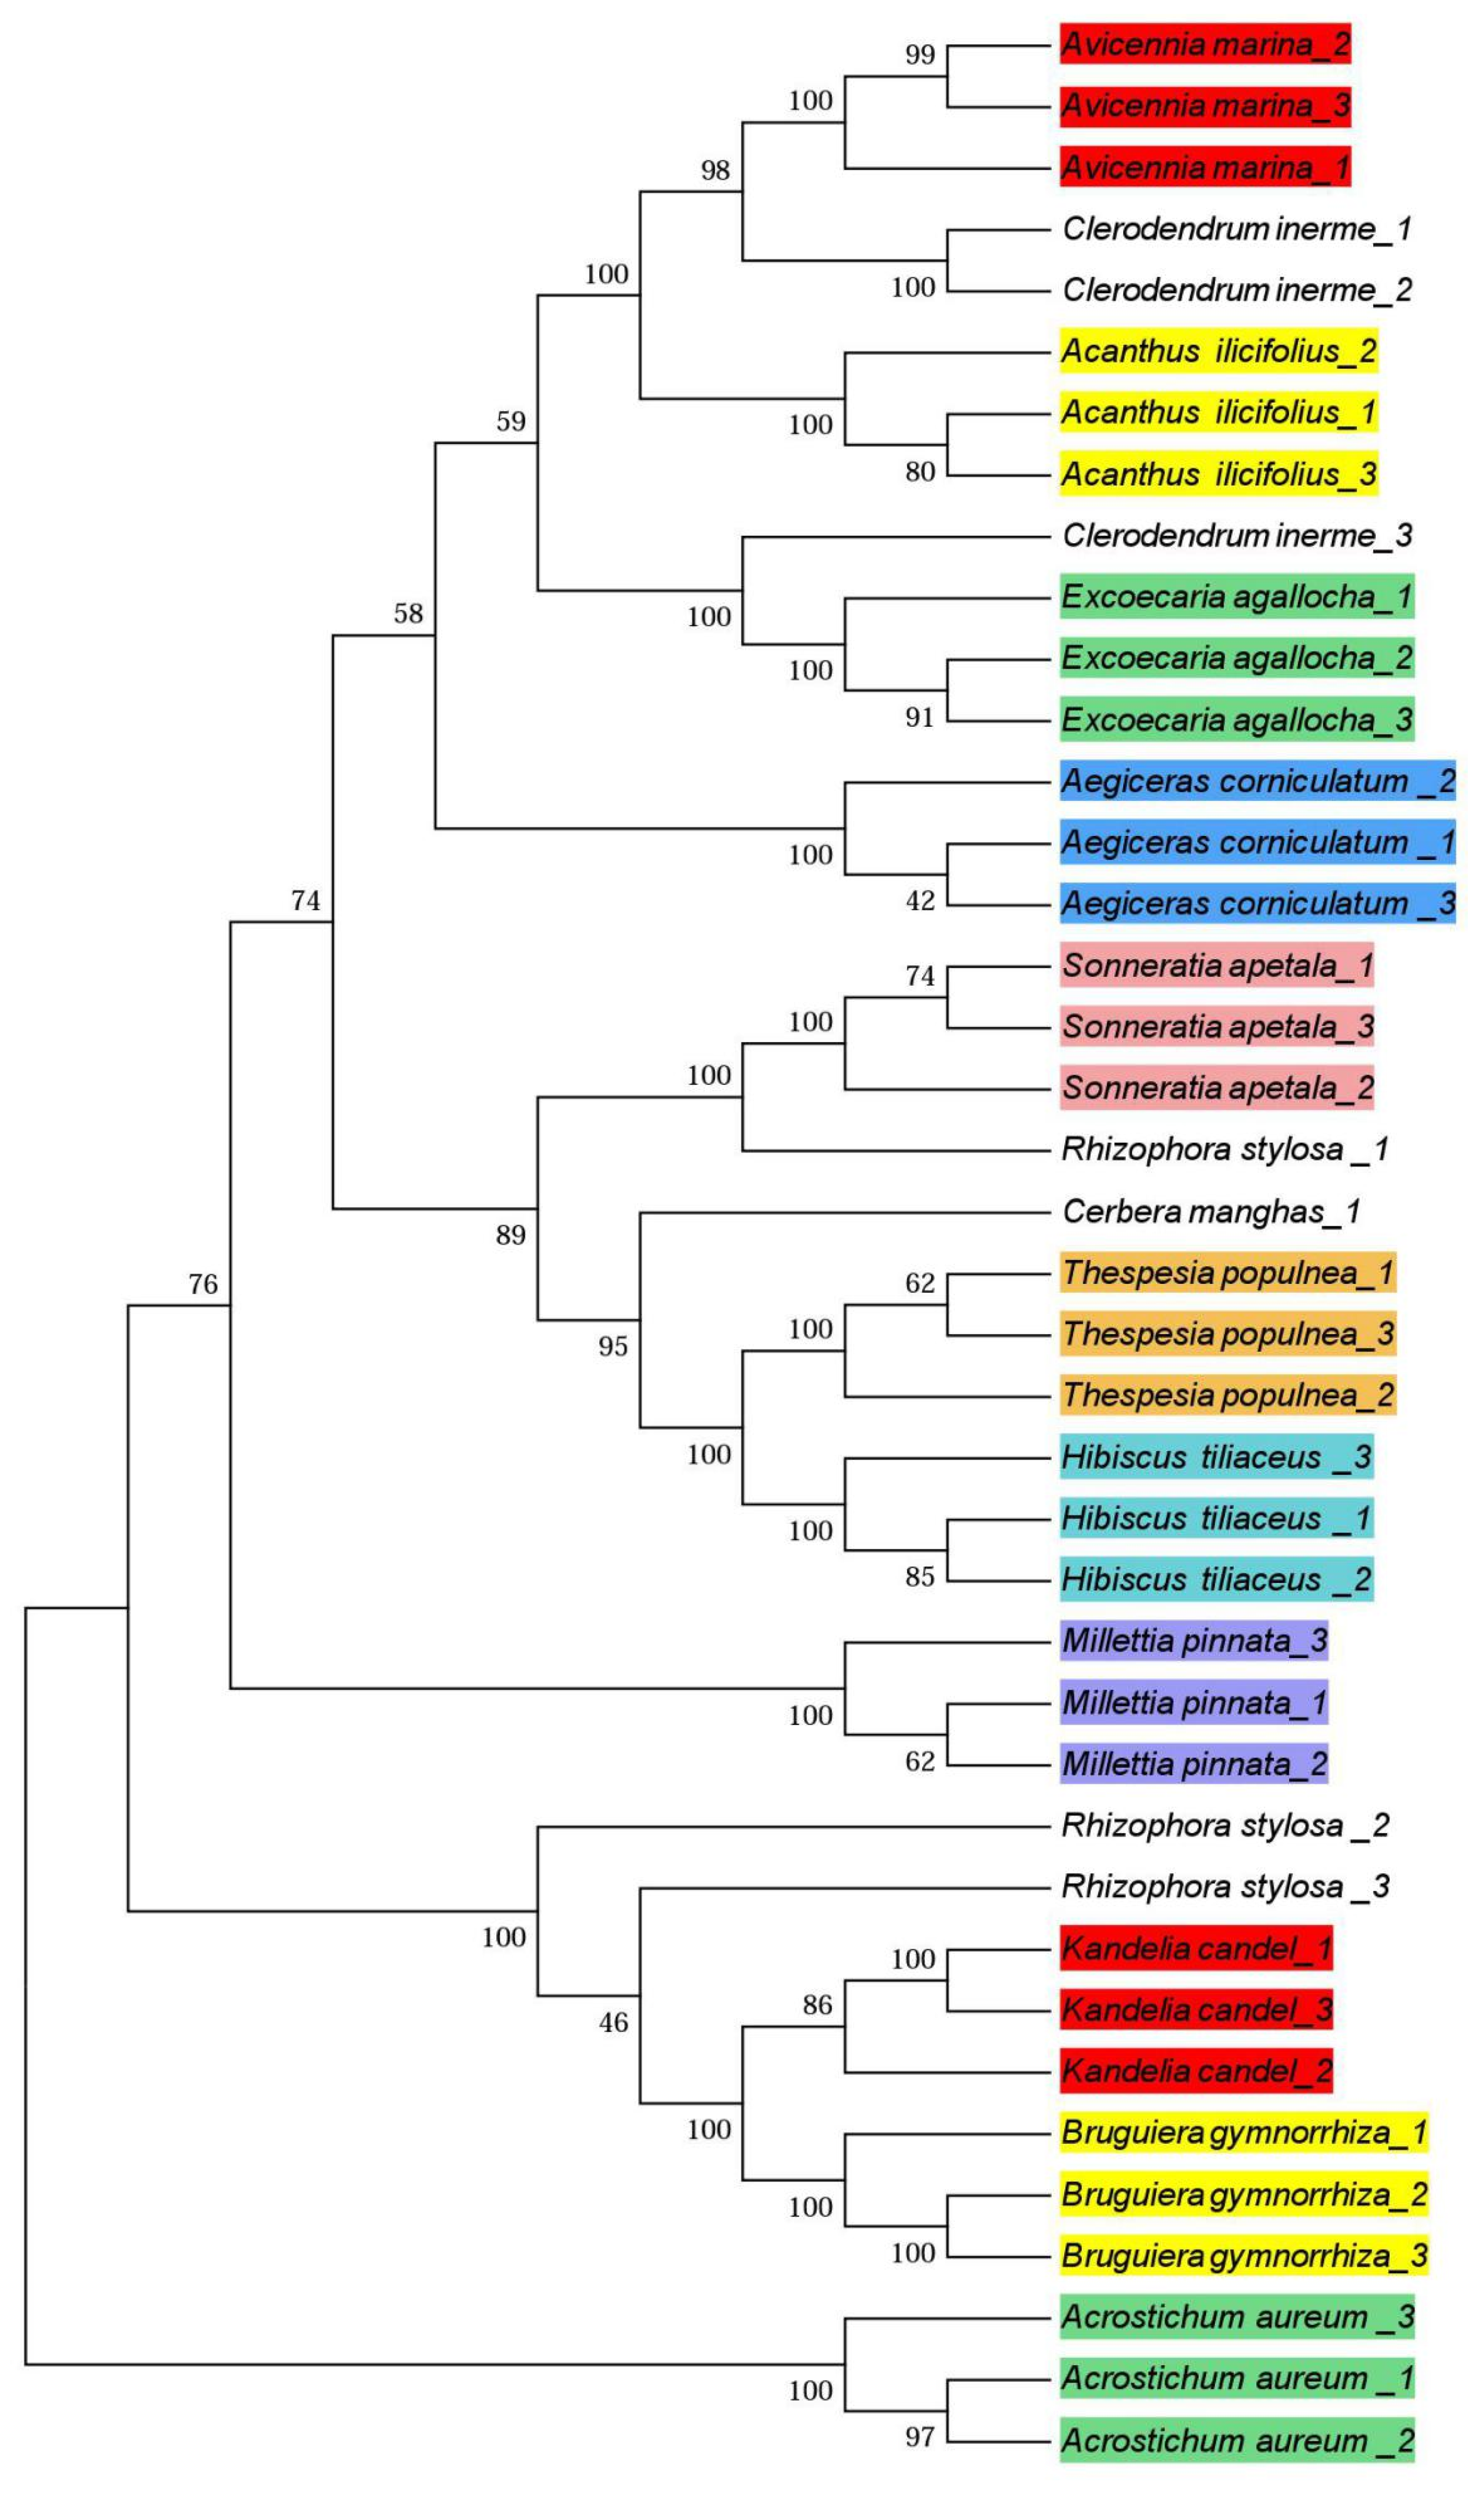
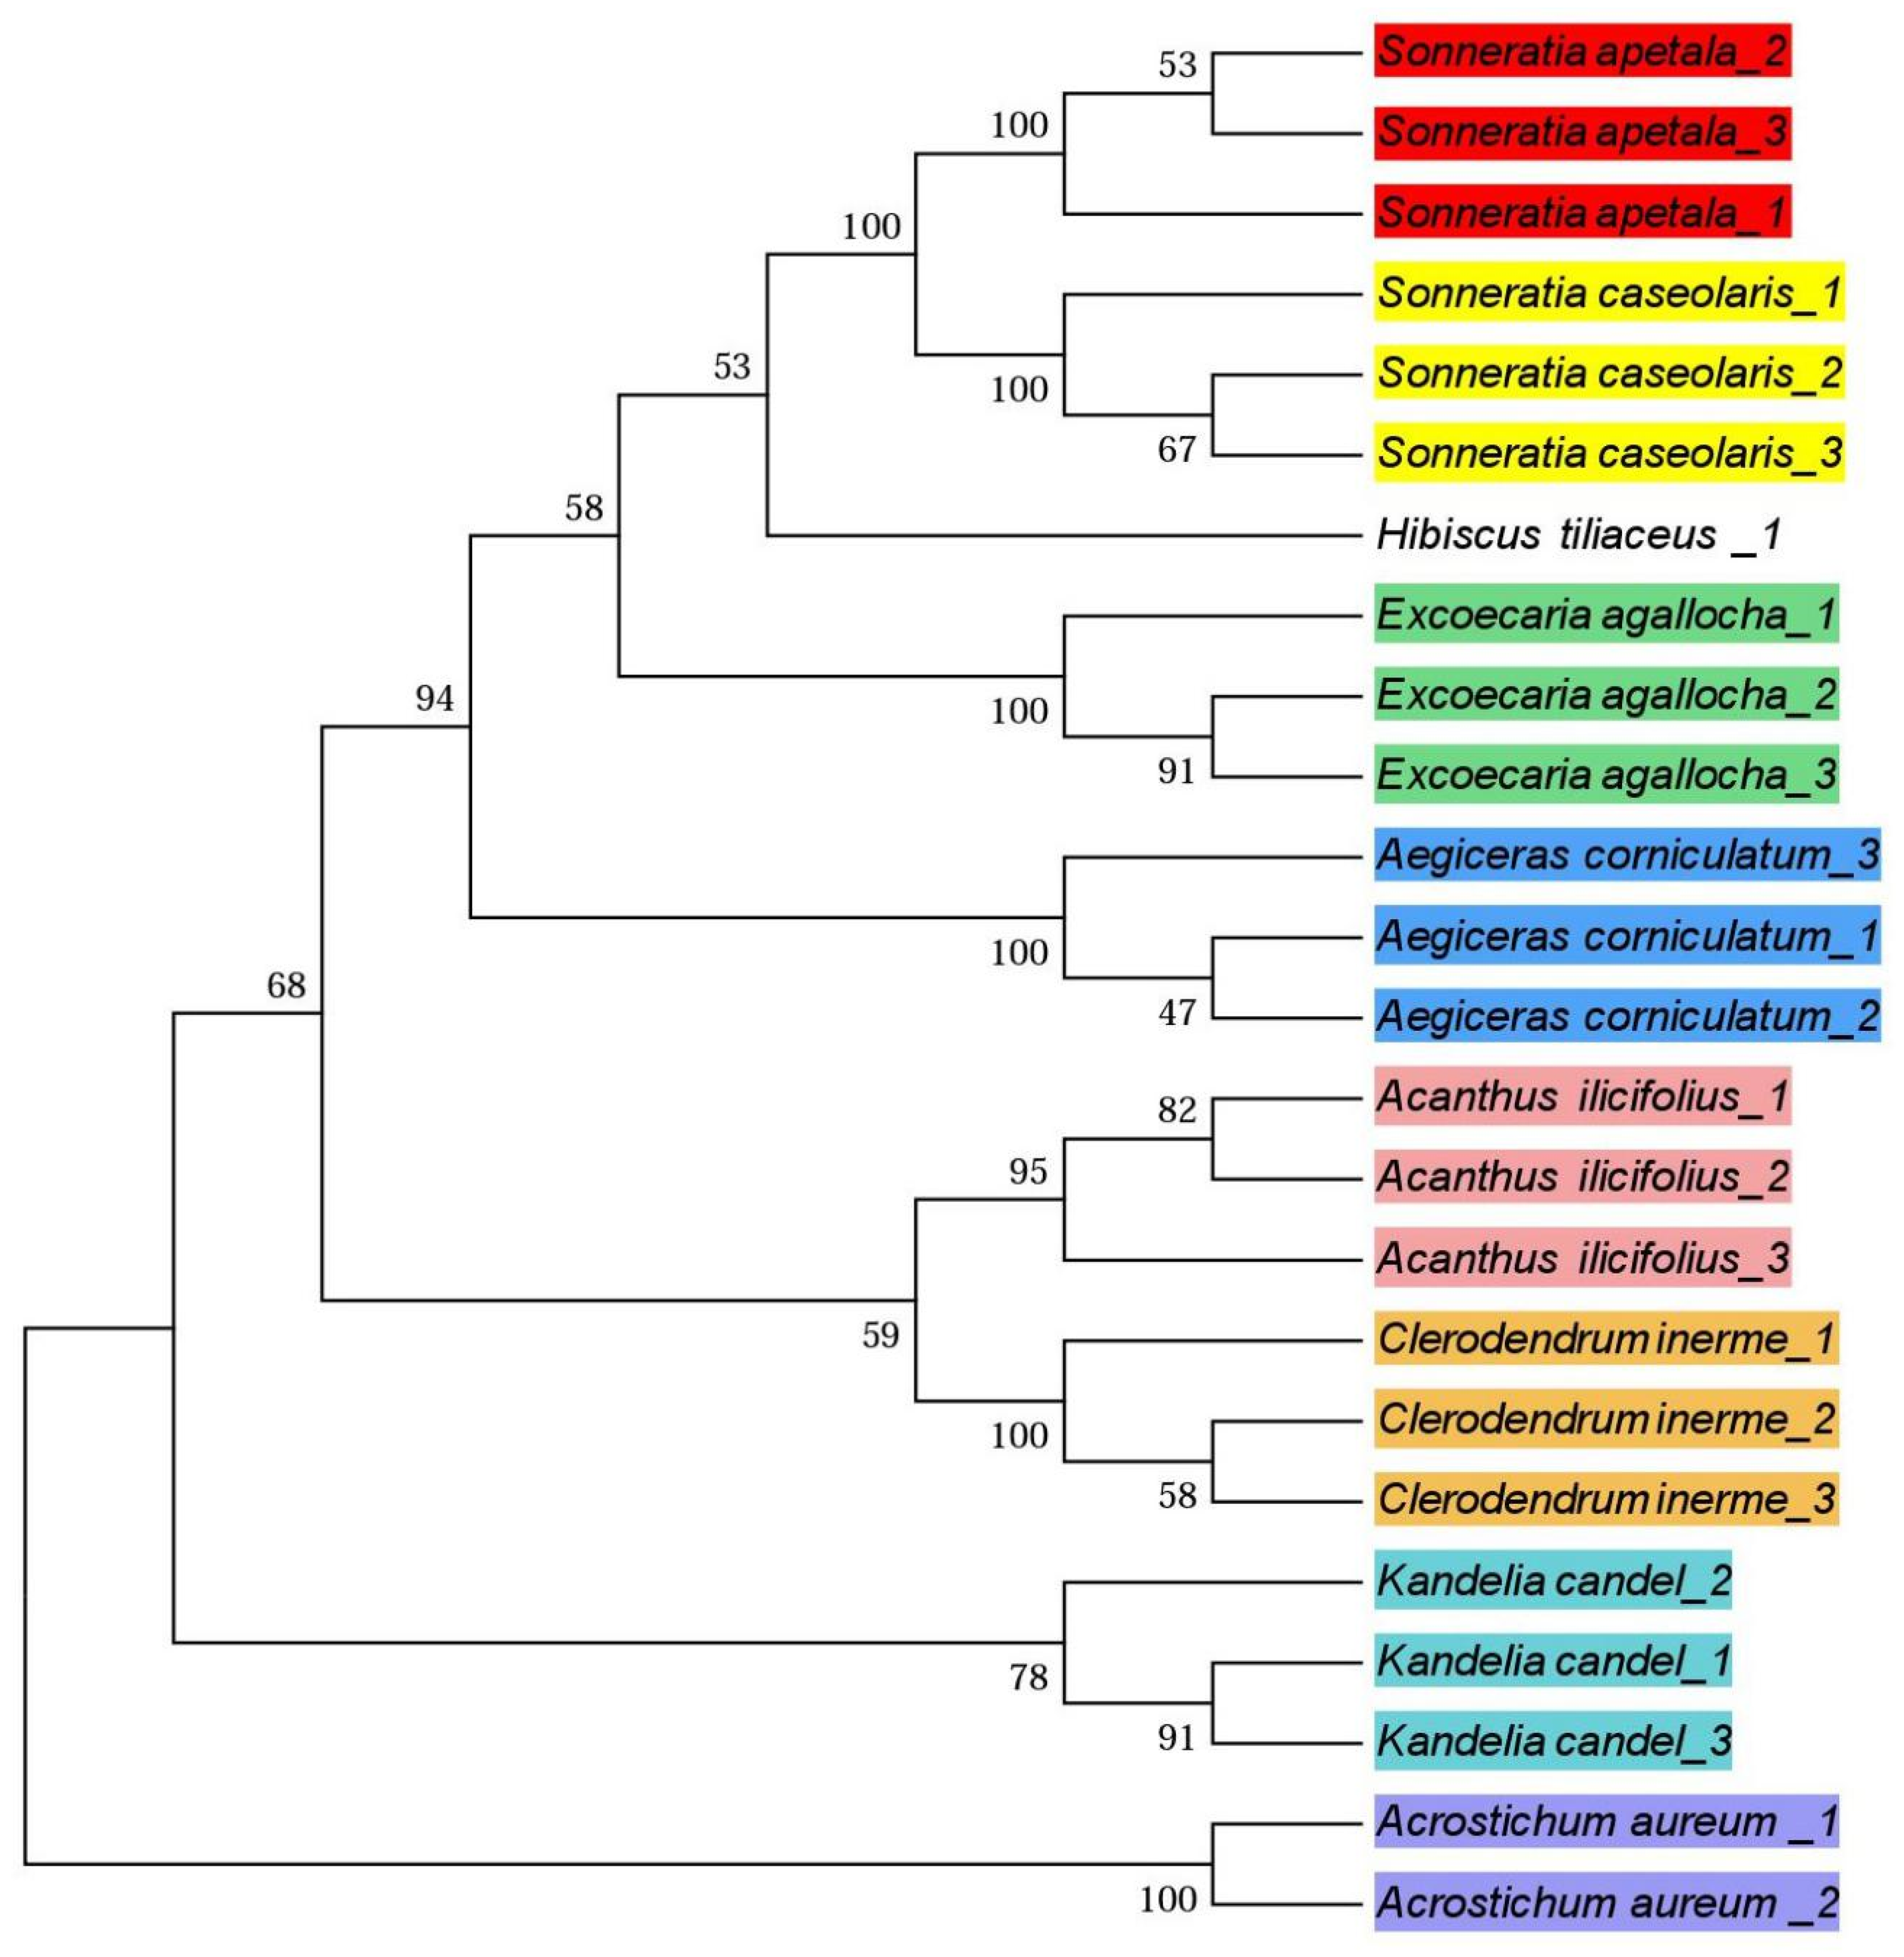
3.3. Phylogenetic Trees

Phylogenetic trees were constructed in MEGA6.0 (Tamura, Stecher, Peterson, Filipski, and Kumar) using the neighbor-joining (NJ) method based on the Kimura’2-parameter model. Phylogenetic trees were constructed with the individual or random combined fragments and the average node support rate was calculated. The results showed that the highest average node support rate of phylogenetic trees using the combination rbcL + matK + trnH-psbA + ITS was 86.33% ± 4.16% (as shown in Figure 2, Figure 3, Figure 4 and Figure 5). Phylogenetic trees were fan-shaped, with one branch of the same or similar species. The average node support rate for mangrove phylogenetic trees in the four regions was 89.66% ± 18.50% in Zhanjiang, 88.49% ± 17.25% in Huizhou, 86.85% ± 15.60% in Shenzhen, and 80.33% ± 19.89% in Shantou.

4. Discussion

Our study investigated mangrove plants in the Guangdong province using DNA barcoding technology. The purpose of this study was to evaluate the performance of DNA barcoding in terms of primer universality, successful identification rate, and phylogenetic tree construction.

4.1. The Universality of DNA Barcoding in Mangrove Communities

The success rate of PCR amplification and the sequencing of rbcL fragments in core barcodes of mangrove DNA samples reached 100%. Compared with Kress [19], our results showed higher universality and success rates, and were the same as those of Pei [42], with 90%–100% in the forest plant communities in tropical and subtropical regions. This indicates that rbcL has the fewest numbers of variable sites and that the selected primer sequence has strong universality. Therefore, rbcL is recommended as an effective fragment for DNA barcoding in mangroves. The success rate of another core fragment, matK, was the lowest of the four fragments. With this fragment, the amplification or sequencing of Ceriops tagal (perr.) C. B. Rob. and Kandelia candel (L.) Druce were not successful, and only a small number of individuals were successfully sequenced in, e.g., Bruguiera gymnorrhiza (L.) Poir., Acrostichum aureum L., and Rhizophora stylosa Griff., indicating a lack of universality for this fragment compared to rbcL. This may be due to the existence of single nucleotide repeat sequences. The amplification rate of matK fragments in previous studies was lower, e.g., 68.18% [43], as was the success rate, e.g., 64% [14]. Similarly low results were reported in other studies of Liu [13], Lu [44], and Wei [45]. Generally, in this situation, the number of primers increases, and the procedure is repeated multiple times.
The barcode trnH-psbA has high universality, and the amplification rate and sequencing success rate can be 99.38% ± 1.25% and 94.57% ± 5.06%, respectively, with only one pair of primers, which is second only to the rbcL fragment. This fragment can also successfully distinguish Sonneratia. The success rate of the nuclear gene ITS amplification was 97.18% ± 3.25%; the amplifications of A. aureum, B. gymnorrhiza, C. tagal, and R. stylosa were not successful. The sequencing success rate of the nuclear gene ITS was 83.35% ± 4.05%, and only a few individuals were successfully sequenced in K. candel and Acanthus ilicifolius L. Previous studies, such as that of Tripathi [46], showed that the sequencing success rate of ITS sequences in tropical forest species in India was 62.0%. Kang [47] showed that the success rate of ITS sequencing in Hainan tropical cloud forests was 47.20% ± 5.76%. In conclusion, the rbcL fragment and trnH-psbA fragment are recommended for the amplification and sequencing of mangrove plants.

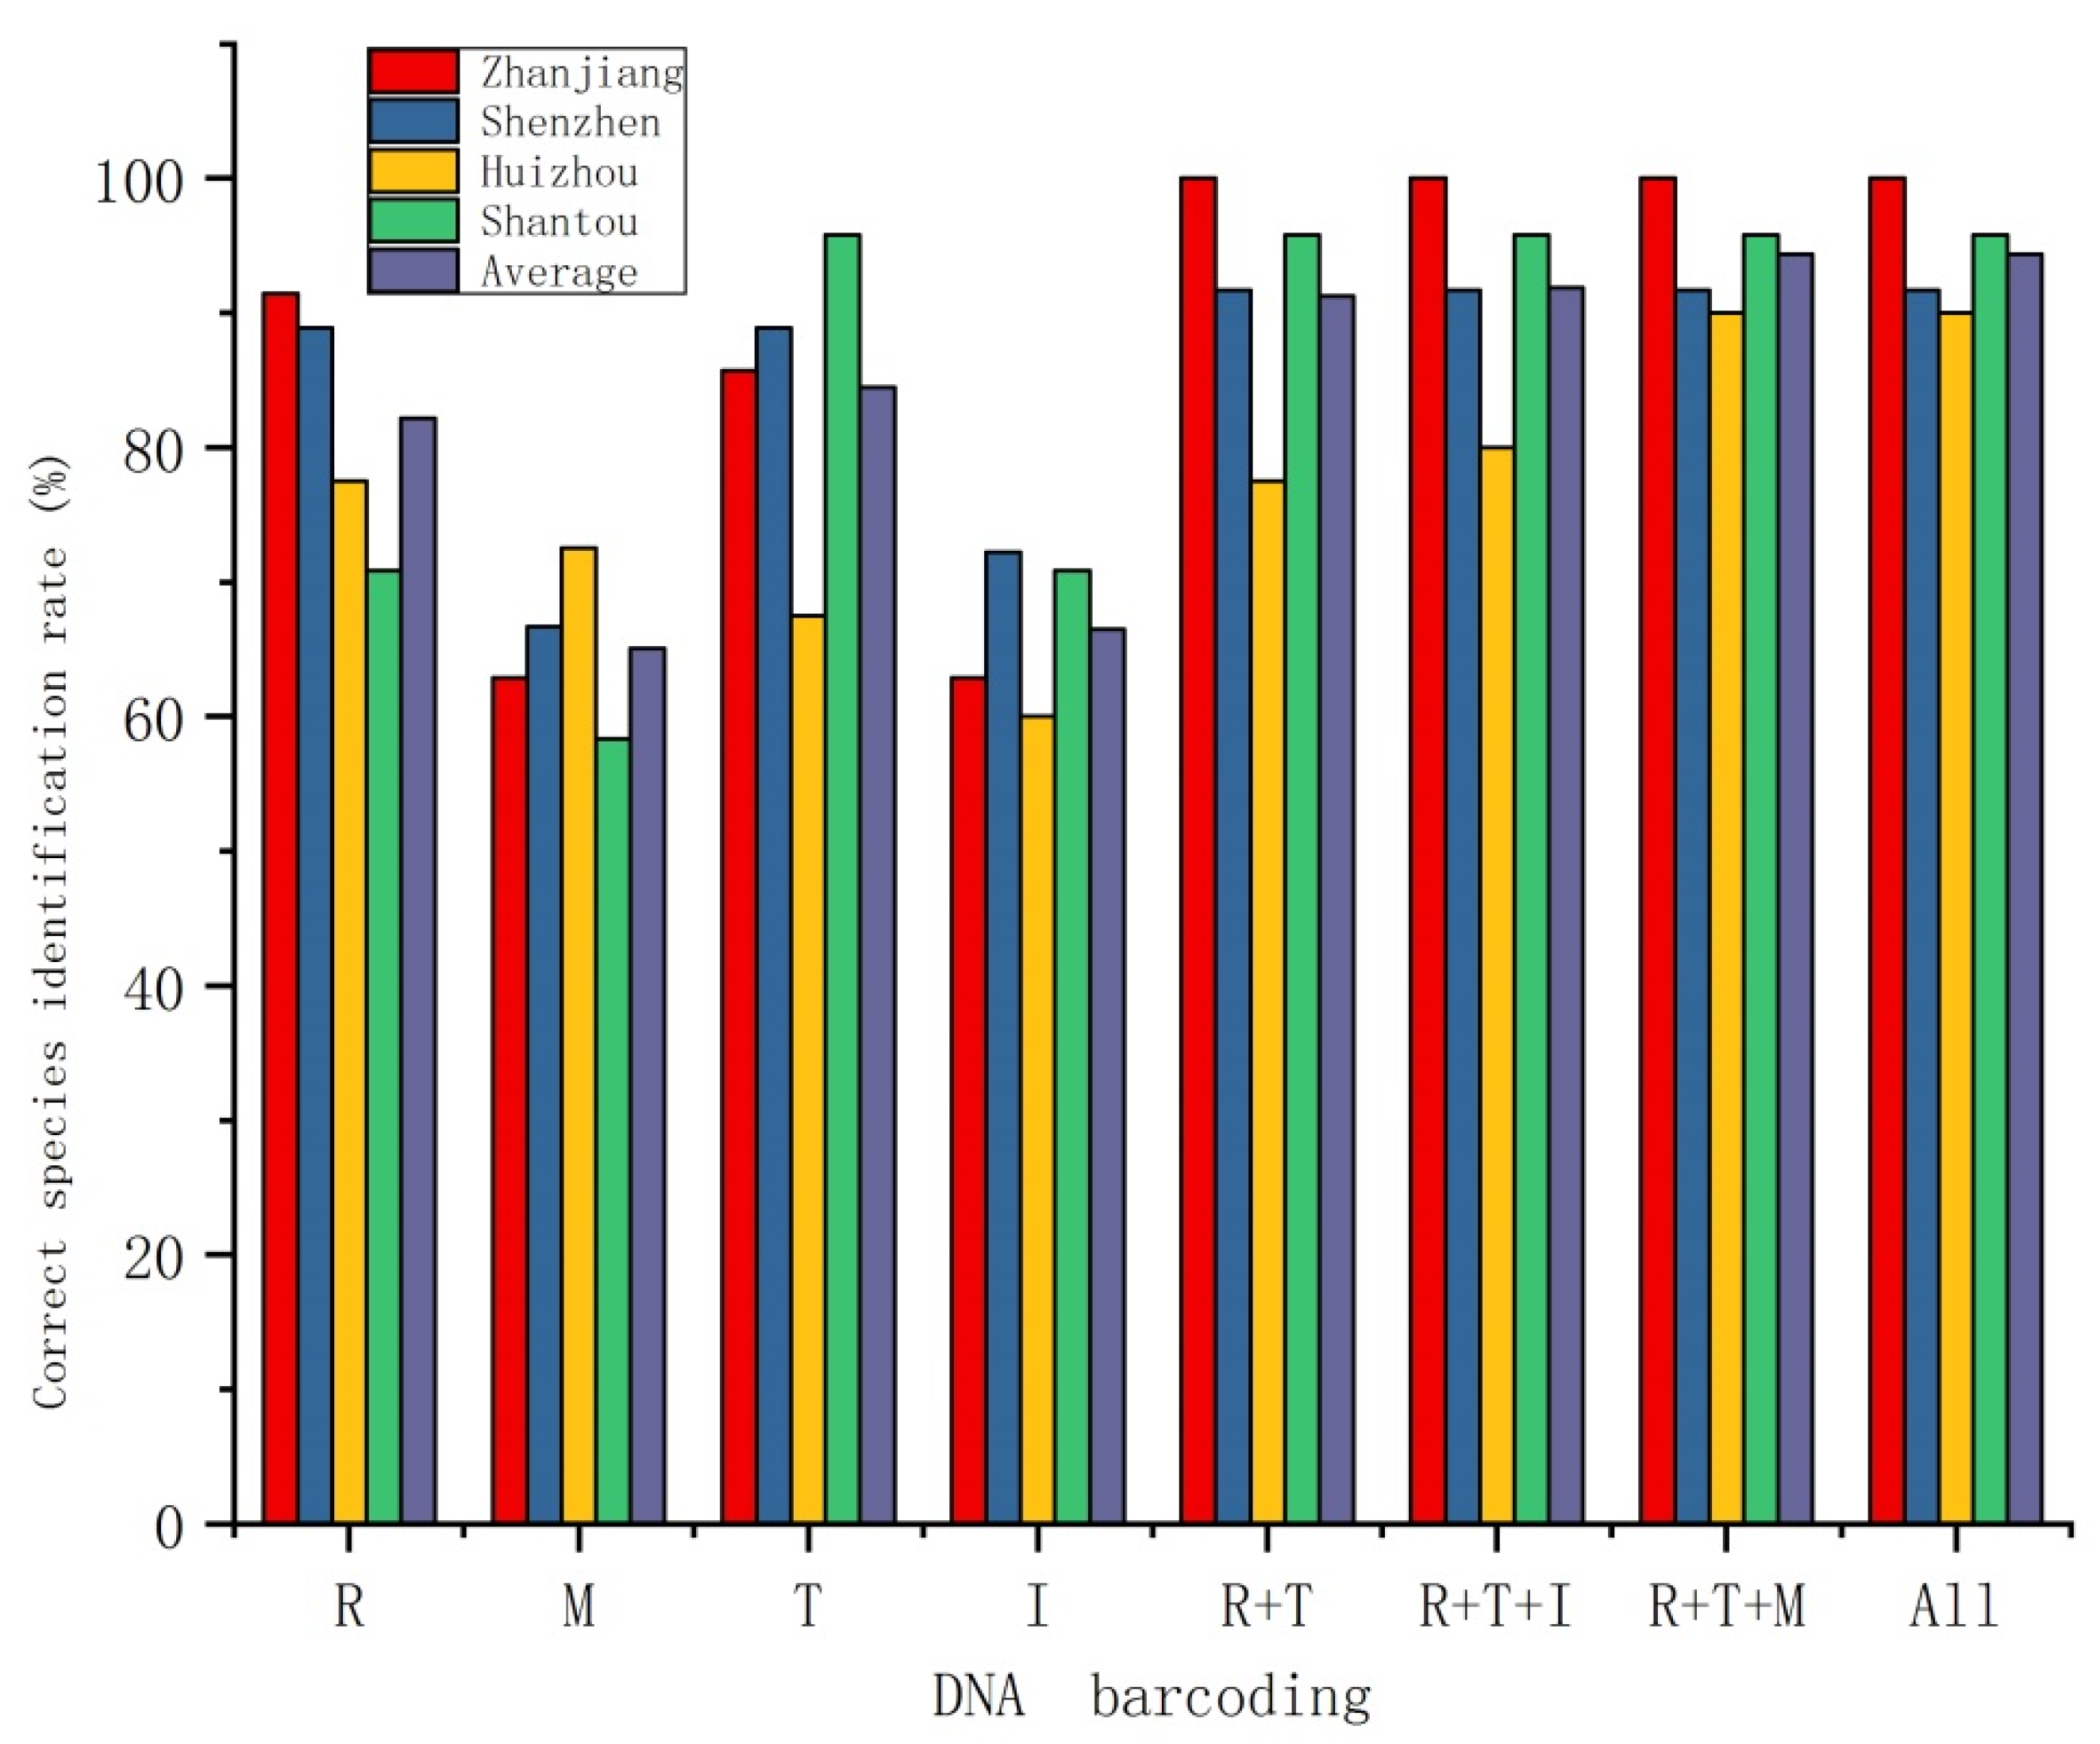
4.2. Species Identification Ability

CBOL Plant Working Group recommend rbcL and matK for the core DNA barcoding for plants. Burgess [41] found that the core barcode can successfully identify 93% of species in the temperate flora of Canada, and de Vere [48] found that rbcL + matK can identify 69.4%–74.1% of flowering plants in Wales, UK. Kress [19] studied 296 woody species in Panama and found that the species identification rate of matK + rbcL was as high as 98%. In this study, the species identification rate of the core barcode rbcL + matK combination fragment can reach 90.56% ± 6.94%. This indicates that the core barcode is effective for species identification and is consistent with previous research results. However, the identification rate of mangroves decreased when only one of them was used. Either rbcL or trnH-psbA had a higher identification rate of mangroves than that of matK. Additionally, the rate for rbcL + trnH-psbA was higher than that for rbcL + matK. Furthermore, the identification rate of mangroves had no significant differences between rbcL + trnH-psbA and other random fragment combinations.
Although the number of bases of trnH-psbA varies greatly among different plant groups, a large number of insertions and deletions make sequencing difficult, as well as the existence of single-nucleotide repeats and other special structures in some groups. In this study, the success rate of trnH-psbA sequencing was second only to rbcL. At the same time, this fragment was able to successfully identify S. caseolares and S. apetala. The species identification rate of trnH-psbA was the highest among the four single fragments, Gonzalez [12] and Tripathi [46] also showed that trnH-psbA is one of the most promising barcodes for species identification. This suggests that trnH-psbA may act as a complementary fragment to rbcL.
Although studies by Kress [19], Sass [49], and Li [7] support the incorporation of ITS into the core barcode of plant DNA, the supplementary ITS fragment was found to be of low universality in the present study, and the species identification rate, when used singly, was 66.48% ± 5.97%. However, the ITS fragment could identify Laguncularia racemosa C.F.Gaertn but not rbcL and trnH-psbA. In addition, the ITS region of the nuclear genome can provide more genetic information from parents than the chloroplast genes. Given the above, rbcL and trnH-psbA were effective fragments for mangrove identification, and ITS fragment could be used for specific mangroves.

4.3. Phylogenetic Trees

rbcL + matK + trnH-psbA fragments had been used to construct phylogenetic trees in different localities, e.g., Barro Colorado Island [19], the Dinghu mountain forest [50], the Ailao mountain forest [44], and tropical cloud forests in Hainan [47]. However, the average node support for phylogenetic trees of mangrove species in these four subtropical regions constructed with rbcL + matK + trnH-psbA + ITS was 5.59% higher than that with rbcL + matK + trnH-psbA, which saw no significant difference. In addition, in Figure 2, Figure 3, Figure 4 and Figure 5, most of the same species were clustered into one branch, also indicating that DNA barcoding can be used to identify species. Due to the different geographical locations of the mangroves, environmental conditions are also different (Table 1), which leads to differences in selective pressure. This could lead to differences in the evolutionary trajectory of mangrove species in the four regions. For example, community composition was observed to be different at different locations, whereby true mangrove species gradually decreased from south to north.

5. Conclusions

The results of the present study suggest that rbcL and trnH-psbA have high success rates for amplification and sequencing, indicating that these two barcodes are common in mangrove species. In terms of species identification, these fragments were relatively successful compared to the other fragments tested. The phylogenetic trees of mangrove plants constructed with a combination of rbcL + matK + trnH-psbA + ITS had the highest node support rate. Due to the low efficiency of matK fragment amplification and identification in mangrove plants. And the identification success rate of rbcL was higher than that of trnH-psbA, except for Shantou region, where the fragment of trnH-psbA can be used to identify specific species which cannot be identified by rbcL. Thus, this study concluded that rbcL and trnH-psbA were the most suitable DNA barcode fragments for species identification in mangrove plants.
Data collection for mangrove DNA barcoding in the Guangdong province is ongoing. A total of 476 sequences were obtained, from 135 individuals of 23 species of mangrove plants, accounting for 55.26% of the mangrove plants in China (21/38). In future research, the sampling range can be further expanded to include the DNA barcoding of other mangrove tree species and mangrove companion plants, to build a complete and high-coverage mangrove plant DNA barcoding database.

Author Contributions

Conceptualization, B.L. and M.L.; methodology, F.W.; software, F.W., Y.X.; formal analysis, F.W., Y.X.; investigation, F.W., B.L., M.L., X.S.; supervision, B.L., M.L.; writing, F.W.

Funding

This research was funded by the Ministry of Science and Technology of China (No. 2017FY100705 and No. 2017FY100700), and the National Natural Science Foundation of China (No. 31570594).

Acknowledgments

The authors would like to thank Jiang, Z.M. and Xu, Y.W. for collecting material, and additional help. Our sincere thanks are extended to Yan, H.F. for providing a scientific research platform.

Conflicts of Interest

The authors declare no conflict of interest.

References

  1. Hebert, P.D.; Cywinska, A.; Ball, S.L.; de Waard, J.R. Biological identifications through DNA barcodes. Proc. Biol. Sci. 2003, 270, 313–321. [Google Scholar] [CrossRef] [PubMed] [Green Version]
  2. Chase, M.W.; Salamin, N.; Wilkinson, M.; Dunwell, J.M.; Kesanakurthi, R.P.; Haider, N.; Savolainen, V. Land plants and DNA barcodes: Short-term and long-term goals. Philos. Trans. R. Soc. Lond. B. Biol. Sci. 2005, 360, 1889–1895. [Google Scholar] [CrossRef] [PubMed]
  3. Kress, W.J.; Wurdack, K.J.; Zimmer, E.A.; Weigt, L.A.; Janzen, D.H. Use of DNA barcodes to identify flowering plants. Proc. Natl. Acad. Sci. USA 2005, 102, 8369–8374. [Google Scholar] [CrossRef] [PubMed] [Green Version]
  4. CBOL Plant Working Group. A DNA barcode for land plants. Proc. Natl. Acad. Sci. USA 2009, 106, 12794–12797. [Google Scholar] [CrossRef] [PubMed] [Green Version]
  5. Kress, W.J.; Erickson, D.L. A two-locus global DNA barcode for land plants: The coding rbcL gene complements the non-coding trnH-psbA spacer region. PLoS ONE 2007, 2, e508. [Google Scholar] [CrossRef] [PubMed]
  6. Chen, S.; Yao, H.; Han, J.; Liu, C.; Song, J.; Shi, L.; Zhu, Y.; Ma, X.; Gao, T.; Pang, X.; et al. Validation of the ITS2 region as a novel DNA barcode for identifying medicinal plant species. PLoS ONE 2010, 5, e8613. [Google Scholar] [CrossRef]
  7. Li, D.Z.; Gao, L.M.; Li, H.T.; Wang, H.; Ge, X.J.; Liu, J.Q.; Chen, Z.D.; Zhou, S.L.; Chen, S.L.; Yang, J.B.; et al. Comparative analysis of a large dataset indicates that internal transcribed spacer (its) should be incorporated into the core barcode for seed plants. Proc. Natl. Acad. Sci. USA 2011, 108, 19641–19646. [Google Scholar]
  8. Kress, W.J.; Erickson, D.L.; Swenson, N.G.; Thompson, J.; Uriarte, M.; Zimmerman, J.K. Advances in the use of DNA barcodes to build a community phylogeny for tropical trees in a Puerto Rican forest dynamics plot. PLoS ONE 2010, 5, e15409. [Google Scholar] [CrossRef]
  9. Hollingsworth, P.M. Refining the DNA barcode for land plants. Proc. Natl. Acad. Sci. USA 2011, 108, 19451–19452. [Google Scholar] [CrossRef] [Green Version]
  10. Li, H.Q.; Chen, J.Y.; Wang, S.; Xiong, S.Z. Evaluation of six candidate DNA barcoding loci in Ficus (Moraceae) of China. Mol. Ecol. Resour. 2012, 12, 783–790. [Google Scholar] [CrossRef]
  11. Braukmann, T.W.; Kuzmina, M.L.; Sills, J.; Zakharov, E.V.; Hebert, P.D. Testing the efficacy of DNA barcodes for identifying the vascular plants of Canada. PLoS ONE 2017, 12, e169515. [Google Scholar] [CrossRef] [PubMed]
  12. Gonzalez, M.A.; Baraloto, C.; Engel, J.; Mori, S.A.; Petronelli, P.; Riera, B.; Roger, A.; Thebaud, C.; Chave, J. Identification of Amazonian trees with DNA barcodes. PLoS ONE 2009, 4, e7483. [Google Scholar] [CrossRef] [PubMed]
  13. Liu, J.; Yan, H.F.; Newmaster, S.G.; Pei, N.; Ragupathy, S.; Ge, X.J.; Lowe, A. The use of DNA barcoding as a tool for the conservation biogeography of subtropical forests in China. Divers. Distrib. 2015, 21, 188–199. [Google Scholar] [CrossRef]
  14. Parmentier, I.; Duminil, J.; Kuzmina, M.; Philippe, M.; Thomas, D.W.; Kenfack, D.; Chuyong, G.B.; Cruaud, C.; Hardy, O.J. How effective are DNA Barcodes in the identification of African rainforest trees. PLoS ONE 2013, 8, e54921. [Google Scholar] [CrossRef] [PubMed]
  15. Kress, W.J.; Erickson, D.L. DNA barcodes: Methods and protocols. Methods Mol. Biol. 2012, 858, 3–8. [Google Scholar] [PubMed]
  16. Li, D.Z.; Zeng, C.X. Prospects for plant DNA barcoding. Biodivers. Sci. 2015, 23, 297–298. [Google Scholar] [CrossRef]
  17. Kress, W.J.; Garcia-Robledo, C.; Uriarte, M.; Erickson, D.L. DNA barcodes for ecology, evolution, and conservation. Trends Ecol. Evol. 2015, 30, 25–35. [Google Scholar] [CrossRef]
  18. Pei, N.C.; Chen, B.F.; Kress, W.J. Advances of community-level plant DNA barcoding in China. Front. Plant Sci. 2017, 8, 225. [Google Scholar] [CrossRef]
  19. Kress, W.J.; Erickson, D.L.; Jones, F.A.; Swenson, N.G.; Perez, R.; Sanjur, O.; Bermingham, E. Plant DNA barcodes and a community phylogeny of a tropical forest dynamics plot in Panama. Proc. Natl. Acad. Sci. USA 2009, 106, 18621–18626. [Google Scholar] [CrossRef] [Green Version]
  20. Pei, N.C.; Zhang, J.L.; Mi, X.C.; Ge, X.J. Plant DNA barcodes promote the development of phylogenetic community ecology. Biodivers. Sci. 2011, 19, 284–294. (In Chinese) [Google Scholar]
  21. Valentini, A.; Pompanon, F.; Taberlet, P. DNA barcoding for ecologists. Trends Ecol. Evol. 2009, 24, 110–117. [Google Scholar] [CrossRef] [PubMed]
  22. Gonzalez, M.A.; Roger, A.; Courtois, E.A.; Jabot, F.; Norden, N.; Paine, C.E.T.; Baraloto, C.; Thébaud, C.; Chave, J.M. Shifts in species and phylogenetic diversity between sapling and tree communities indicate negative density dependence in a lowland rain forest. J. Ecol. 2010, 98, 137–146. [Google Scholar] [CrossRef] [Green Version]
  23. Lin, P. Chinese Mangrove Ecosystem; Science Press: Beijing, China, 1997; pp. 124–156. ISBN 9787030056924. (In Chinese) [Google Scholar]
  24. Dan, X.Q.; Liao, B.W.; Wu, Z.B.; Wu, H.J.; Bao, D.M. resources, conservation status and main threats of mangrove wetlands in China. Ecol. Environ. Sci. 2016, 25, 1237–1243. (In Chinese) [Google Scholar]
  25. Wang, B.J.; Liang, S.C.; Zhang, W.Y.; Zan, Q.J. Mangrove flora of the world. Acta Bot. Sin. 2003, 45, 644–653. (In Chinese) [Google Scholar]
  26. Liao, B.W.; Zhang, Q.M. Area, distribution and species composition of mangroves in China. Wetl. Sci. 2014, 12, 435–440. (In Chinese) [Google Scholar]
  27. Murphy, R.W.; Crawford, A.J.; Bauer, A.M.; Che, J.; Donnellan, S.C.; Fritz, U.; Haddad, C.F.B.; Nagy, Z.T.; Poyarkov, N.A.; Vences, M.; et al. Cold Code: The global initiative to DNA barcode amphibians and nonavian reptiles. Mol. Ecol. Resour. 2013, 13, 161–167. [Google Scholar] [CrossRef]
  28. Shen, Y.Y.; Chen, X.; Murphy, R.W. Assessing DNA barcoding as a tool for species identification and data quality control. PLoS ONE 2013, 8, e57125. [Google Scholar] [CrossRef]
  29. Martoni, F.; Bulman, S.; Pitman, A.; Taylor, G.; Armstrong, K. DNA barcoding highlights cryptic diversity in the New Zealand Psylloidea (Hemiptera: Sternorrhyncha). Diversity 2018, 10, 50. [Google Scholar] [CrossRef]
  30. Pfeiler, E. DNA barcoding and taxonomic challenges in describing new putative species: Examples from sootywing and cloudywing butterflies (Lepidoptera: Hesperiidae). Diversity 2018, 10, 111. [Google Scholar] [CrossRef]
  31. Pei, N.C.; Lian, J.Y.; Erickson, D.L.; Swenson, N.G.; Kress, W.J.; Ye, W.H.; Ge, X.J. Exploring tree-habitat associations in a Chinese subtropical forest plot using a molecular phylogeny generated from DNA barcode Loci. PLoS ONE 2011, 6, e21273. [Google Scholar] [CrossRef]
  32. Pawlowski, J.; Audic, S.; Adl, S.; Bass, D.; Belbahri, L.; Berney, C.; Bowser, S.; Cepicka, I.; Decelle, J.; Dunthorn, M.; et al. CBOL protist working group: Barcoding eukaryotic richness beyond the animal, plant, and fungal kingdoms. PLoS Biol. 2012, 10, e1001419. [Google Scholar] [CrossRef] [PubMed]
  33. Galimberti, A.; de Mattia, F.; Losa, A.; Bruni, I.; Federici, S.; Casiraghi, M.; Martellos, S.; Labra, M. DNA barcoding as a new tool for food traceability. Food Res. Int. 2013, 50, 55–63. [Google Scholar] [CrossRef]
  34. Gao, L.M.; Liu, J.; Cai, J.; Yang, J.B.; Zhang, T. A synopsis of technical notes on the standards for plant DNA barcoding. Plant Divers. Resour. 2012, 34, 592–606. (In Chinese) [Google Scholar] [CrossRef]
  35. Doyle, J.; Doyle, J. A rapid DNA isolation procedure for small quantities of fresh leaf tissue. Phytochem. Bull. 1987, 19, 11–15. [Google Scholar]
  36. Yan, H.F.; Liu, Y.J.; Xie, X.F.; Zhang, C.Y.; Hu, C.M.; Hao, G.; Ge, X.J. DNA barcoding evaluation and its taxonomic implications in the species-rich genus Primula L. in China. PLoS ONE 2015, 10, e122903. [Google Scholar] [CrossRef] [PubMed]
  37. Liu, J. DNA Barcoding Evaluation of the Dinghusahn Woody Species and the Genus Gentiana L. (Gentianaceae). Ph.D. Thesis, South China Botanical Garden, The Chinese Academy of Sciences, Guangzhou, China, 2014; pp. 27–28. (In Chinese). [Google Scholar]
  38. Sang, T.; Crawford, D.; Stuessy, T. Chloroplast DNA phylogeny, reticulate evolution, and biogeography of Paeonia (Paeoniaceae). Am. J. Bot. 1997, 84, 1120. [Google Scholar] [CrossRef] [PubMed]
  39. Tate, J.A.; Simpson, B.B. Paraphyly of Tarasa (Malvaceae) and diverse origins of the polyploid species. Syst. Bot. 2003, 28, 723–737. [Google Scholar]
  40. White, T.J.; Bruns, T.; Lee, S.; Taylor, J. Amplification and direct sequencing of fungal ribosomal RNA genes for phylogenetics. In PCR Protocols: A Guide to Methods and Applications; Academic: San Diego, CA, USA, 1990; pp. 315–322. [Google Scholar]
  41. Burgess, K.S.; Fazekas, A.J.; Kesanakurti, P.R.; Graham, S.W.; Husband, B.C.; Newmaster, S.G.; Percy, D.M.; Hajibabaei, M.; Barrett, S.C.H. Discriminating plant species in a local temperate flora using the rbcL+matK DNA barcode. Methods Appl. Fluores 2011, 2, 333–340. [Google Scholar] [CrossRef]
  42. Pei, N.; Erickson, D.L.; Chen, B.; Ge, X.; Mi, X.; Swenson, N.G.; Zhang, J.; Jones, F.A.; Huang, C.; Ye, W.; et al. Closely-related taxa influence woody species discrimination via DNA barcoding: Evidence from global forest dynamics plots. Sci. Rep. 2015, 5, 15127. [Google Scholar] [CrossRef]
  43. Costion, C.; Ford, A.; Cross, H.; Crayn, D.; Harrington, M.; Lowe, A. Plant DNA barcodes can accurately estimate species richness in poorly known floras. PLoS ONE 2011, 6, e26841. [Google Scholar] [CrossRef]
  44. Lu, M.M.; Ci, X.Q.; Yang, G.P.; Li, J. DNA barcoding of subtropical forest trees—A study from Ailao mountains nature reserve, Yunnan, China. Plant Divers. Resour. 2013, 35, 733–741. (In Chinese) [Google Scholar]
  45. Wei, Y.N.; Wang, X.M.; Yao, P.C.; Chen, X.Y.; Li, H.Q. Comparison of species resolution rates of DNA barcoding for Chinese coastal halo-tolerant plants. Biodivers. Sci. 2017, 25, 1095–1104. (In Chinese) [Google Scholar] [CrossRef] [Green Version]
  46. Tripathi, A.M.; Tyagi, A.; Kumar, A.; Singh, A.; Singh, S.; Chaudhary, L.B.; Roy, S. The internal transcribed spacer (its) region and trnH-psbA [corrected] are suitable candidate loci for DNA barcoding of tropical tree species of India. PLoS ONE 2013, 8, e57934. [Google Scholar] [CrossRef] [PubMed]
  47. Kang, Y.; Deng, Z.; Zang, R.; Long, W. DNA barcoding analysis and phylogenetic relationships of tree species in tropical cloud forests. Sci. Rep. 2017, 7, 12564. [Google Scholar] [CrossRef] [PubMed] [Green Version]
  48. De Vere, N.; Rich, T.C.; Ford, C.R.; Trinder, S.A.; Long, C.; Moore, C.W.; Satterthwaite, D.; Davies, H.; Allainguillaume, J.; Ronca, S.; et al. DNA barcoding the native flowering plants and conifers of Wales. PLoS ONE 2012, 7, e37945. [Google Scholar] [CrossRef] [PubMed]
  49. Sass, C.; Little, D.P.; Stevenson, D.W.; Specht, C.D. DNA barcoding in the cycadales: Testing the potential of proposed barcoding markers for species identification of cycads. PLoS ONE 2007, 2, e1154. [Google Scholar] [CrossRef] [PubMed]
  50. Pei, N.C. Building a subtropical forest community phylogeny based on plant DNA barcodes from Dinghushan plot. Plant Divers. Resour. 2012, 34, 263–270. (In Chinese) [Google Scholar] [CrossRef]
Figure 1. Mangrove species discrimination rate of all single and multi-DNA barcoding fragments. R, rbcL; M, matK; T, trnH–psbA; I, ITS; All, the database consisted of all species.
Forests 10 00056 g001
Figure 2. The phylogenetic tree of mangroves in Zhanjiang using fragment of matK + rbcL + trnH-psbA + ITS.
Forests 10 00056 g002
Figure 3. The phylogenetic tree of mangroves in Shenzhen using fragment of matK + rbcL + trnH-psbA + ITS.
Forests 10 00056 g003
Figure 4. The phylogenetic tree of mangroves in Huizhou using fragment of matK + rbcL + trnH-psbA + ITS.
Forests 10 00056 g004
Figure 5. The phylogenetic tree of mangroves in Shantou using fragment of matK + rbcL + trnH-psbA + ITS.
Forests 10 00056 g005
Table 1. The information of mangrove samples collected in the Guangdong province.
SiteCollection PlacesLongitudeLatitudeNumbers of Tree Species
ZhanjiangBaitoupo109°45′38″21°34′03″16
Fengdi109°46′21″21°32′36″
ShenzhenMangrove reserve114°00′33″22°31′33″12
HuizhouYanzhou island114°56′17″22°43′47″14
Xiezhouwan114°47′00″22°49′40″
Haozhaolou114°52′02″22°45′58″
ShantouSu aiwan116°43′36″23°19′16″9
Waishahe116°48′11″23°23′09″
Yifengxi116°53′11″23°32′45″
Table 2. The primers used to amplify DNA barcodes and the amplification protocol.
DNA FragmentPrimersSequences (5′–3′)ReferencesAmplification Protocol
rbcLrbcLa_FATGTCACCACAAACAGAGACTAAAGCKress [19]94 °C 3 min; 94 °C 30 s, 55 °C 1 min,
72 °C 1 min, 35 cycles; 72 °C 7 min
rbcLa_RGTAAAATCAAGTCCACCRCG
matKKim_3FCGTACAGTACTTTTGTGTTTACGAGKim, unpublished94 °C 3 min; 94 °C 45 s, 51 °C 45 s,
72 °C 1 min, 35 cycles; 72 °C 7 min
Kim_1RACCCAGTCCATCTGGAAATCTTGGTTC
trnH-psbApsbA3GTTATGCATGAACGTAATGCTCSang [38]94 °C 3 min; 94 °C 30 s, 55 °C 1 min,
72 °C 1 min,35 cycles; 72 °C 7 min
trnH05CGCGCATGGTGGATTCACAATCCTate [39]
ITSITS-leu1GTCCACTGAACCTTATCATTTAGUrbatsh94 °C 3 min; 94 °C 30 s, 55 °C 1 min,
72 °C 1 min, 35 cycles; 72 °C 7 min
ITS4TCCTCCGCTTATTGATATGCWhite [40]
ITS: The internal transcribed spacer of nuclear ribosomal DNA.
Table 3. The success rates of PCR amplification and sequencing of the four barcoding fragments in the four mangrove forests.
PlotDNA FragmentPCR Amplification Success Rate (%)Sequencing
Success Rate (%)
Individuals Resolution Rate
ZhanjiangrbcL10010035
matK71.4365.7123
trnH-psbA10088.5731
ITS94.2982.8629
ShenzhenrbcL10010036
matK80.5677.7828
trnH-psbA10097.2235
ITS94.4488.8932
HuizhourbcL10010040
matK77.577.531
trnH-psbA97.592.537
ITS10082.533
ShantourbcL10010024
matK91.6779.1719
trnH-psbA10010024
ITS10079.1719
Total 476

