Article

Effects of Stand Age on Biomass Allocation and Allometry of Quercus Acutissima in the Central Loess Plateau of China

1
Key Comprehensive Laboratory of Forestry in Shaanxi Province, Northwest A&F University, Yangling 712100, China
2
State Key Laboratory of Soil Erosion and Dryland Farming on the Loess Plateau, Northwest A&F University, Yangling 712100, China
*
Author to whom correspondence should be addressed.
Forests 2019, 10(1), 41; https://doi.org/10.3390/f10010041
Submission received: 24 November 2018 / Revised: 22 December 2018 / Accepted: 30 December 2018 / Published: 9 January 2019
(This article belongs to the Special Issue Oak Forests under Global Change)

Abstract

:
We studied the effects of stand age on allocation and equation fitting of aboveground and below-ground biomass in four Quercus acutissima stands (14, 31, 46, and 63 years old) in the Central Loess Plateau of China. The stem wood, stem bark, branch, foliage, and belowground biomass of each of the 20 destructive harvesting trees were quantified. The mean total biomass of each tree was 28.8, 106.8, 380.6, and 603.4 kg/tree in the 14-, 31-, 46-, and 63-year-old stands, respectively. Aboveground biomass accounted for 72.25%, 73.05%, 76.14%, and 80.37% of the total tree biomass in the 14-, 31-, 46-, and 63-year-old stands, respectively, and stem wood was the major component of tree biomass. The proportion of stem (with bark) biomass to total tree biomass increased with stand age while the proportions of branch, foliage, and belowground biomass to total tree biomass decreased with stand age. The ratio of belowground biomass to aboveground biomass decreased from 0.39 in the 14-year-old stand to 0.37, 0.31, and 0.24 in the 31-, 46-, and 63-year-old stands, respectively. Age-specific biomass equations in each stand were developed for stem wood, stem bark, aboveground, and total tree. The inclusion of tree height as a second variable improved the total tree biomass equation fitting for middle-aged (31-year-old and 46-year-old) stands but not young (14 years old) and mature (63 years old) stands. Moreover, biomass conversion and expansion factors (BCEFs) varied with stand age, showing a decreasing trend with increasing stand age. These results indicate that stand age alters the biomass allocation of Q. acutissima and results in age-specific allometric biomass equations and BCEFs. Therefore, to obtain accurate estimates of Q. acutissima forest biomass and carbon stocks, age-specific changes need to be considered.

1. Introduction

Oak forests play an important role in storing atmospheric CO2 in terrestrial ecosystems, both through accumulation of biomass and production of organic compounds with long C residence times, and, thus, help mitigate global climate change [1,2]. In China, areas covered with the oak forest at different stages have rapidly increased, especially after the implementation of the Grain to Green Program (GTGP) that was established to reduce greenhouse gas emissions [3]. Thus, understanding the development of tree biomass throughout the entire life cycle is required to accurately estimate the carbon stock at regional and national scales [4,5]. In 2003, in an effort to estimate forest biomass and carbon storage of the National Forest Inventory (NFI) system in participating countries, the Intergovernmental Panel on Climate Change (IPCC) proposed the use of the biomass conversion and expansion factors (BCEFS) and root-shoot ratio (RSR) for forests in different geographical regions [6]. However, as there can be high uncertainty in these parameters [7], it is crucial to develop indigenous models and parameters of tree biomass. To date, many papers on modeling individual tree biomass in China have been published [8,9,10,11,12,13,14].
Because of the costly and time-consuming process of directly measuring tree biomass, methods of accurately estimating tree biomass are urgently needed for forest researchers and managers [15]. A number of tree biomass models were reported with most studies focused on model construction. For instance, studies have addressed the types of variables that should be included in the equation (diameter at breast height (DBH), tree height, crown radius, or some combination), investigated whether the equation is consistent with the additivity principle [16], and compared models with different regression methods [17,18]. These aspects are important for the development of accurate biomass equations but neglect the influences of stand characteristics, such as stand age, on equation fitting. Wang et al. [19] and Lie and Li [20] reported significant differences in tree biomass among different age groups. Does the allocation of tree biomass affect the equation? Are the variables selected consistent across different stand ages? Does the selection of different variables affect the accuracy of biomass equation fitting? Only a few studies to date have performed correlation analyses for conifer species [21].
Konôpka et al. [22] reported that, as trees grow, age-related changes in tree shape and form alter the distribution of biomass among tree components. Stands of different ages require different allometric biomass equations [23]. Therefore, it is necessary to develop age-specific allometric biomass equations and BCEFs to allow the rapid and reliable estimation of tree component biomass at different stages of development [24,25]. Typically, accurate biomass measurements of individual trees are obtained by destructive sampling, and regional and national biomass estimates have primarily been obtained using allometric equations and BCEFs [26,27,28,29]. Power-law models have played an important role in the development of allometric equations [30] because they are supported by the notion of growth as a multi-plicative process and enable predictions over a wide range of scales and many levels of organization [31,32,33,34]. BCEFs commonly convert readily available merchantable stem wood volumes to total biomass carbon values, and then to estimate C stocks. However, there was much uncertainty associated with the use of constant BCEFs for biomass estimation because of variation in the allometry of trees reflecting the stage of stand development [21]. Moreover, Winjum et al. [35] warned that these changes of conversion factors could cause a change of more than 7% in the total emission estimate for a country. To reduce the uncertainty, non-constant BEFs have been presented by Fang et al. (2001) [36], Lehtonen et al. (2004) [21], and Tobin and Nieuwenhuis [37]. Although many allometric biomass equations and BCEFs have been developed for different tree species, little information is available on age-specific allometric biomass equations and BCEFs for Q. acutissima.
As a deciduous tree of the genus Quercus, commonly known as oak, Q. acutissima has a wide range of distribution in China (latitude 18–41° N and longitude 91–123° E) [38]. This species is the main component tree species of forest vegetation in warm temperate zones and subtropical regions, with high ecological, economic, and landscape value [3,39]. It is the most dominant tree in the deciduous and mixed forests in the Central Loess Plateau of China and an important source of wood and forest byproducts, including acorns and mushrooms [40]. Thus, it is artificially planted in the region. It is also widely used for the revegetation of degraded land in montane areas of North China [41]. Under global climate change and multifunctional forest management, this species has attracted more attention from scientists [42]. A great deal of research involving this tree had been conducted on cultivation technology, development and utilization, physiological and ecological characteristics, and genetic diversity [43,44,45,46]. However, there is limited information about biomass allocation in this species and few associated prediction equations. Although Noh et al. [40] performed relevant research, their regression equation of biomass considered only DBH variables and not tree height nor did they consider the influence of stand age. Accordingly, the purposes of this study were (1) to understand how the allocation of Q. acutissima aboveground and belowground biomass changes with stand age and (2) to investigate how stand age affects the allometric biomass equations and BCEFs for different tree components of Q. acutissima.

2. Materials and Methods

2.1. Study Area

We conducted this study in the Shuanglong forest region (35.6118° N, 109.2048° E, Figure 1), which is located in the central Loess Plateau, Huangling County, Shaanxi Province, China. The region has a temperate and monsoonal climate with a mean annual temperature of 9.4 °C, and the average annual precipitation is 588.1 mm [47]. According to long-term forest management data from the Shuanglong forest farm, the mean annual frost-free period is approximately 195 days, and the mean length of the growing season is approximately 204 days. The soil of the region is classified as calcareous cinnamon soil or forest Haplic Greyzem soil.
Q. acutissima is a dominant tree species in our study region and occupies approximately 80% to 83% of the total forest area. The most common companion species include Pinus tabuliformis, Quercus wutaishanica, Acer ginnala, Betula platyphylla, Populus davidiana, and Crataegus pinnatifida. Based on forestland information provided by the local forestry department, the region includes a chronosequence of 14-, 31-, 46- and 63-year-old Q. acutissima even-aged stands that were artificially established after clear cutting. All four stands are located within 10 km of each other and experience similar environmental conditions. Five 20 × 30-m sample plots were established randomly within each stand, and the diameter at breast height (DBH) and height were measured and recorded for trees with DBH greater than 5 cm. The mean tree density was 1629 (±174), 1334 (±195), 1011 (±217), and 762 (±135) trees ha−1. The number of trees in each plot was 95–110, 75–85, 53–67, and 44–51. The mean tree height was 5.7, 8.0, 12.9, and 17.7 m and the mean DBH was 7.28, 11.55, 20.78, and 26.70 cm for the 14-, 31-, 46-, and 63-year-old stands, respectively. Field measurement followed the protocol of “Observation Methodology for Long-term Forest Ecosystem Research” of the National Standards of the People’s Republic of China [48]. According to the measurement data from the sample plots, a representative range of trees in each stand was selected for destructive sampling.

2.2. Destructive Tree Sampling

During July 2016, five dominant trees (distributed throughout the range of DBH in each stand) were harvested per stand. We selected only healthy, undamaged trees. In total, 20 trees with DBH ranging from 5.0 to 34.3 cm were sampled. Before felling, DBH was measured, and the crown radius was measured in four directions. The selected trees were cut down above the root collar (average stump height, 15 cm). After felling, tree height, crown length, and height of the lowest living branch of each tree were recorded. Then, the major components of the crown were divided into large branches (≥2 cm), small branches (<2 cm), and leaves. All of the fresh biomass was determined in the field using a hanging scale (±10 g). Subsamples of each component were selected and measured with an electronic scale (±0.1 g) in the field. Then, the subsamples were oven-dried at 65 °C until constant weight.
After all branches were removed, the stems were divided into 1-m-long sections and weighed using a hanging scale. From each section, a stem disc (approximately 5-cm thick) was collected and the bark of each stem disc was removed. The diameter of each stem disc, with and without bark, was measured with a diameter measurement tape. The wood and bark parts of the stem discs were oven-dried at 65 °C to a constant weight. To account for sawdust lost during stem cutting, a regression between the stem disc diameter and sawdust biomass was determined based on 11 cuts at different diameters, and we developed an equation (R2 = 0.9986) to calculate the amount of sawdust produced by each stem disc cut.
M s = 2.8203 D 2 ,
where Ms is the dry mass of sawdust (g) and D is the diameter at the location of the cut (cm).
After taking the above steps, the root systems of all sampled trees were manually excavated, exercising care to retain lateral roots. Roots of shrubs and herbs were easily distinguished from the roots of Q. acutissima because of their smaller diameter and lighter color [49]. The soil attached to the roots was removed, and the root systems were cleaned with high-pressure water. Lateral roots were cut from the taproot. All roots were sorted into taproot, large roots (≥2 cm), coarse roots (0.5–2 cm), small roots (0.2–0.5 cm), and fine roots (<0.2 cm). The aboveground stumps that remained after tree felling were included in the taproot measurement. The weight of lateral roots that broke off during the excavation process was estimated from the unbroken lateral roots. This estimation was performed by measuring the root diameter at the break point, cutting an unbroken lateral root from the same tree at a point of equal diameter and then adding the weight of the cut section to the corresponding root weight [50]. The fresh biomass of each root diameter class was determined in the field. The subsamples of each class were taken to the laboratory and oven-dried at 65 °C to a constant weight for the calculation of fresh and oven-dried biomass ratios.

2.3. Data Analysis

Statistical and regression analyses were performed using the Statistical Package for the Social Sciences (SPSS 19.0, SPSS Inc., Chicago, IL, USA). Nonlinear regression and ordinary least squares (OLS) were employed to fit the equation parameters. The additivity and compatibility of the biomass equation were not considered because our focus was on analyzing allometric relationships between tree component biomass and DBH across stand age. Heteroscedasticity was not observed likely due to the small sample size [28].
Allometric biomass equations: Allometric relationships between biomass and each of DBH, tree height (H), and tree age (A) are often expressed using the following power-law equations.
y i = c ( x 1 ) a ,
y i = c ( x 1 ) a ( x 2 ) b ,
where yi is the dry biomass (kg) of the tree component i (e.g., stem wood, stem bark, branches, foliage, and roots), c is a scale parameter, a and b are equation parameters, x1 is DBH (cm), and x2 is the tree height (m) or the tree age (years).
Stem wood volume: The stem wood volume was calculated using the following formula.
V = l i = 1 n g i + 1 3 g l ,
where gi is the central area (m2) of section i, l is the length (m) of the section, n is the number of sections, g’ is the area (m2) at the bottom of the tip section, and l’ is the length (m) of the tip section.
BCEFs: The BCEFs were determined by dividing the biomass of each tree component by the stem wood volume as follows.
B C E F   s c = W c V ,
where c represents each tree component, Wc is the dry biomass (tons) of a tree component (e.g., stem (with bark), branch, foliage, aboveground, belowground, and total tree), and V is the stem volume (m3) [21]. Furthermore, BCEFs models in power form were fitted by the regressions of BCEFs of 20 trees as the dependent variables, and tree age as the independent variable.
To validate the regression models in our study, the mean prediction error (MPE) and the total relative error (TRE) are used to assess the performance of all models [51].
M P E = t a · ( ( y i y i ^ ) 2 / ( n p )   / y ¯ ) / n × 100 ,
T R E = ( y i y i ^ ) / y i ^ × 100 ,
where yi are the observed values, ŷi are the predicted values obtained by two-fold cross validation, ӯ is the mean value of samples, for the t-th observation, n is the number of samples, p is the number of parameters, and ta is the t-value at confidence level a with n-p degrees of freedom.

3. Results

3.1. Biomass Allocation

The biomass weights of all tree components in the four studied stands are presented in Table 1. The biomass of each tree component increased steadily with stand age. The mean total tree biomass was 28.76, 106.81, 380.63, and 603.38 kg/tree in the 14-, 31-, 46-, and 63-year-old stands, respectively. Stem wood biomass was 9.33, 37.42, 152.71, and 275.86 kg/tree in the 14-, 31-, 46-, and 63-year-old stands, respectively, and contributed the most among the component biomass to the aboveground biomass pool. Tree component biomass followed the order stem wood > branches > belowground biomass > stem bark > foliage in the 14-year-old stand and stem wood > belowground biomass > branches > stem bark > foliage in the other three, older, stands.
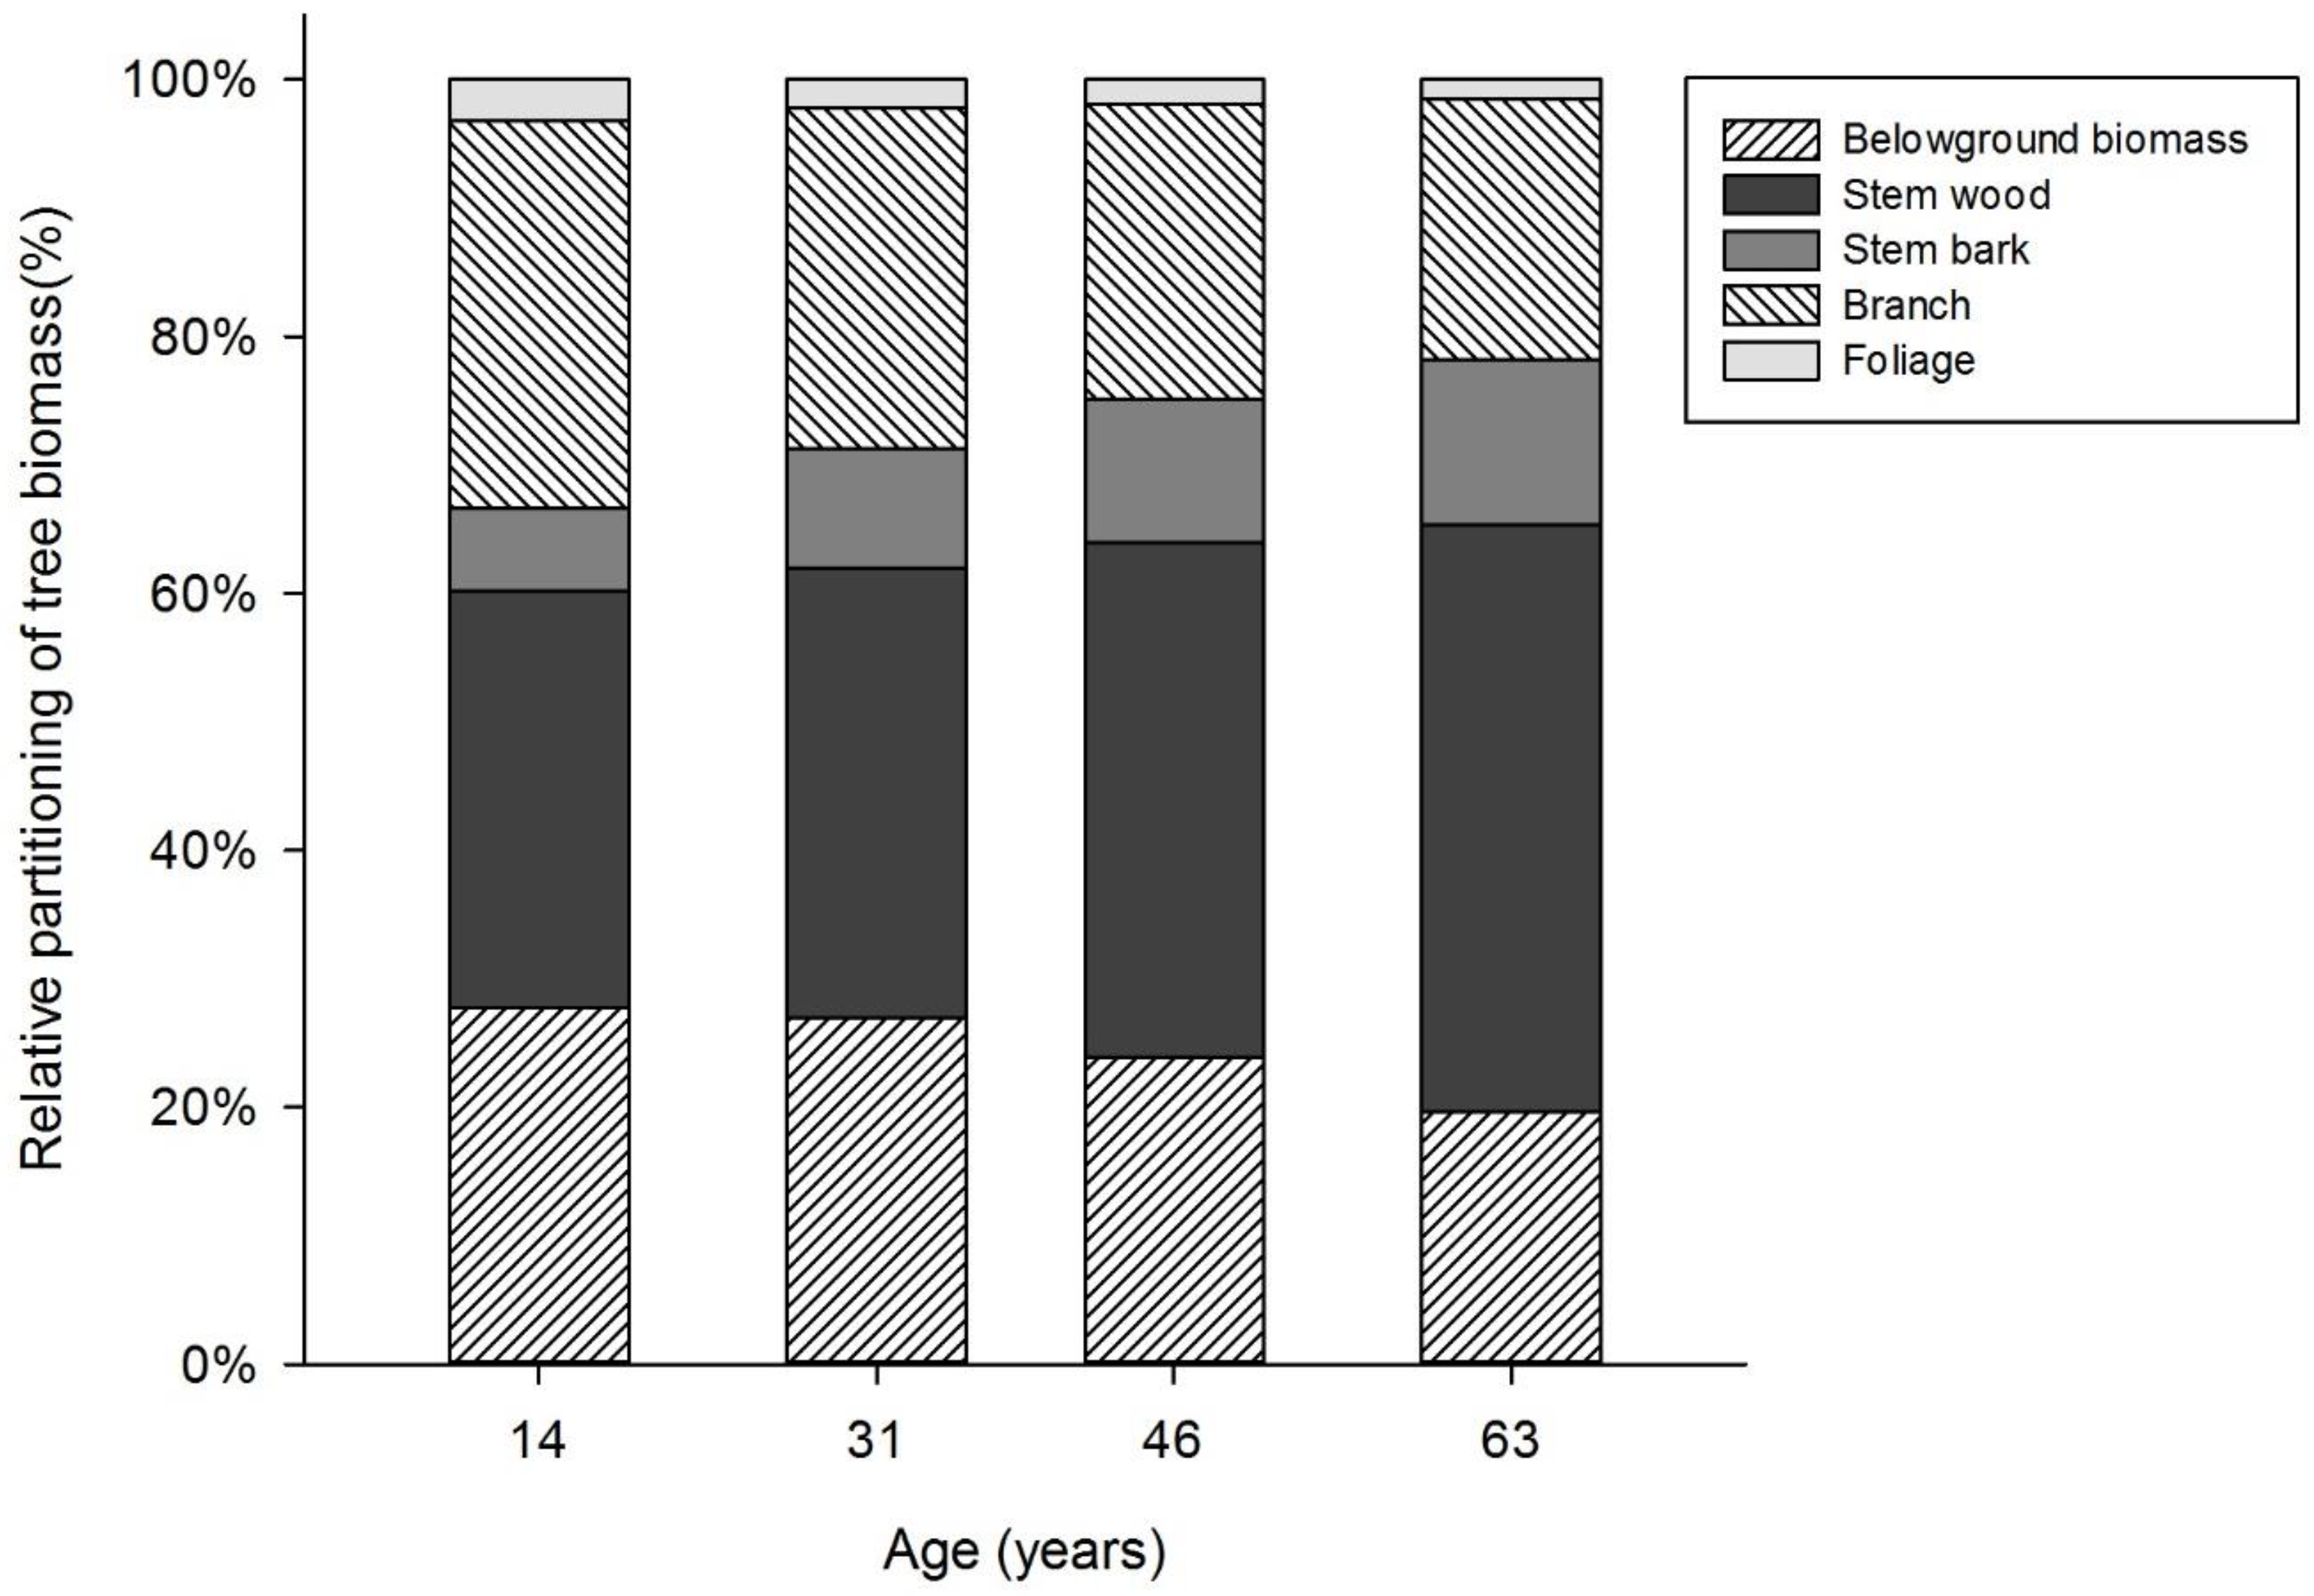
The partitioning of tree component biomass in each of the four stands is shown in Figure 2. The aboveground biomass represented 72.25%, 73.05%, 76.14%, and 80.37% of total tree biomass in the 14-, 31-, 46-, and 63-year-old stands, respectively. Among the different components, stem wood contributed 332.44%, 35.03%, 40.12%, and 45.72%, to total tree biomass in the 14-, 31-, 46-, and 63-year-old stands, respectively. The partitioning of branch biomass was approximately equivalent to that of belowground biomass, which comprised a large proportion that should not be neglected. Biomass allocation demonstrated different changes with stand age. The proportions of stem wood and stem bark increased with stand age while the proportions of branches, foliage, and belowground biomass (including taproot, large roots, coarse roots, small roots, and fine roots) decreased with stand age.
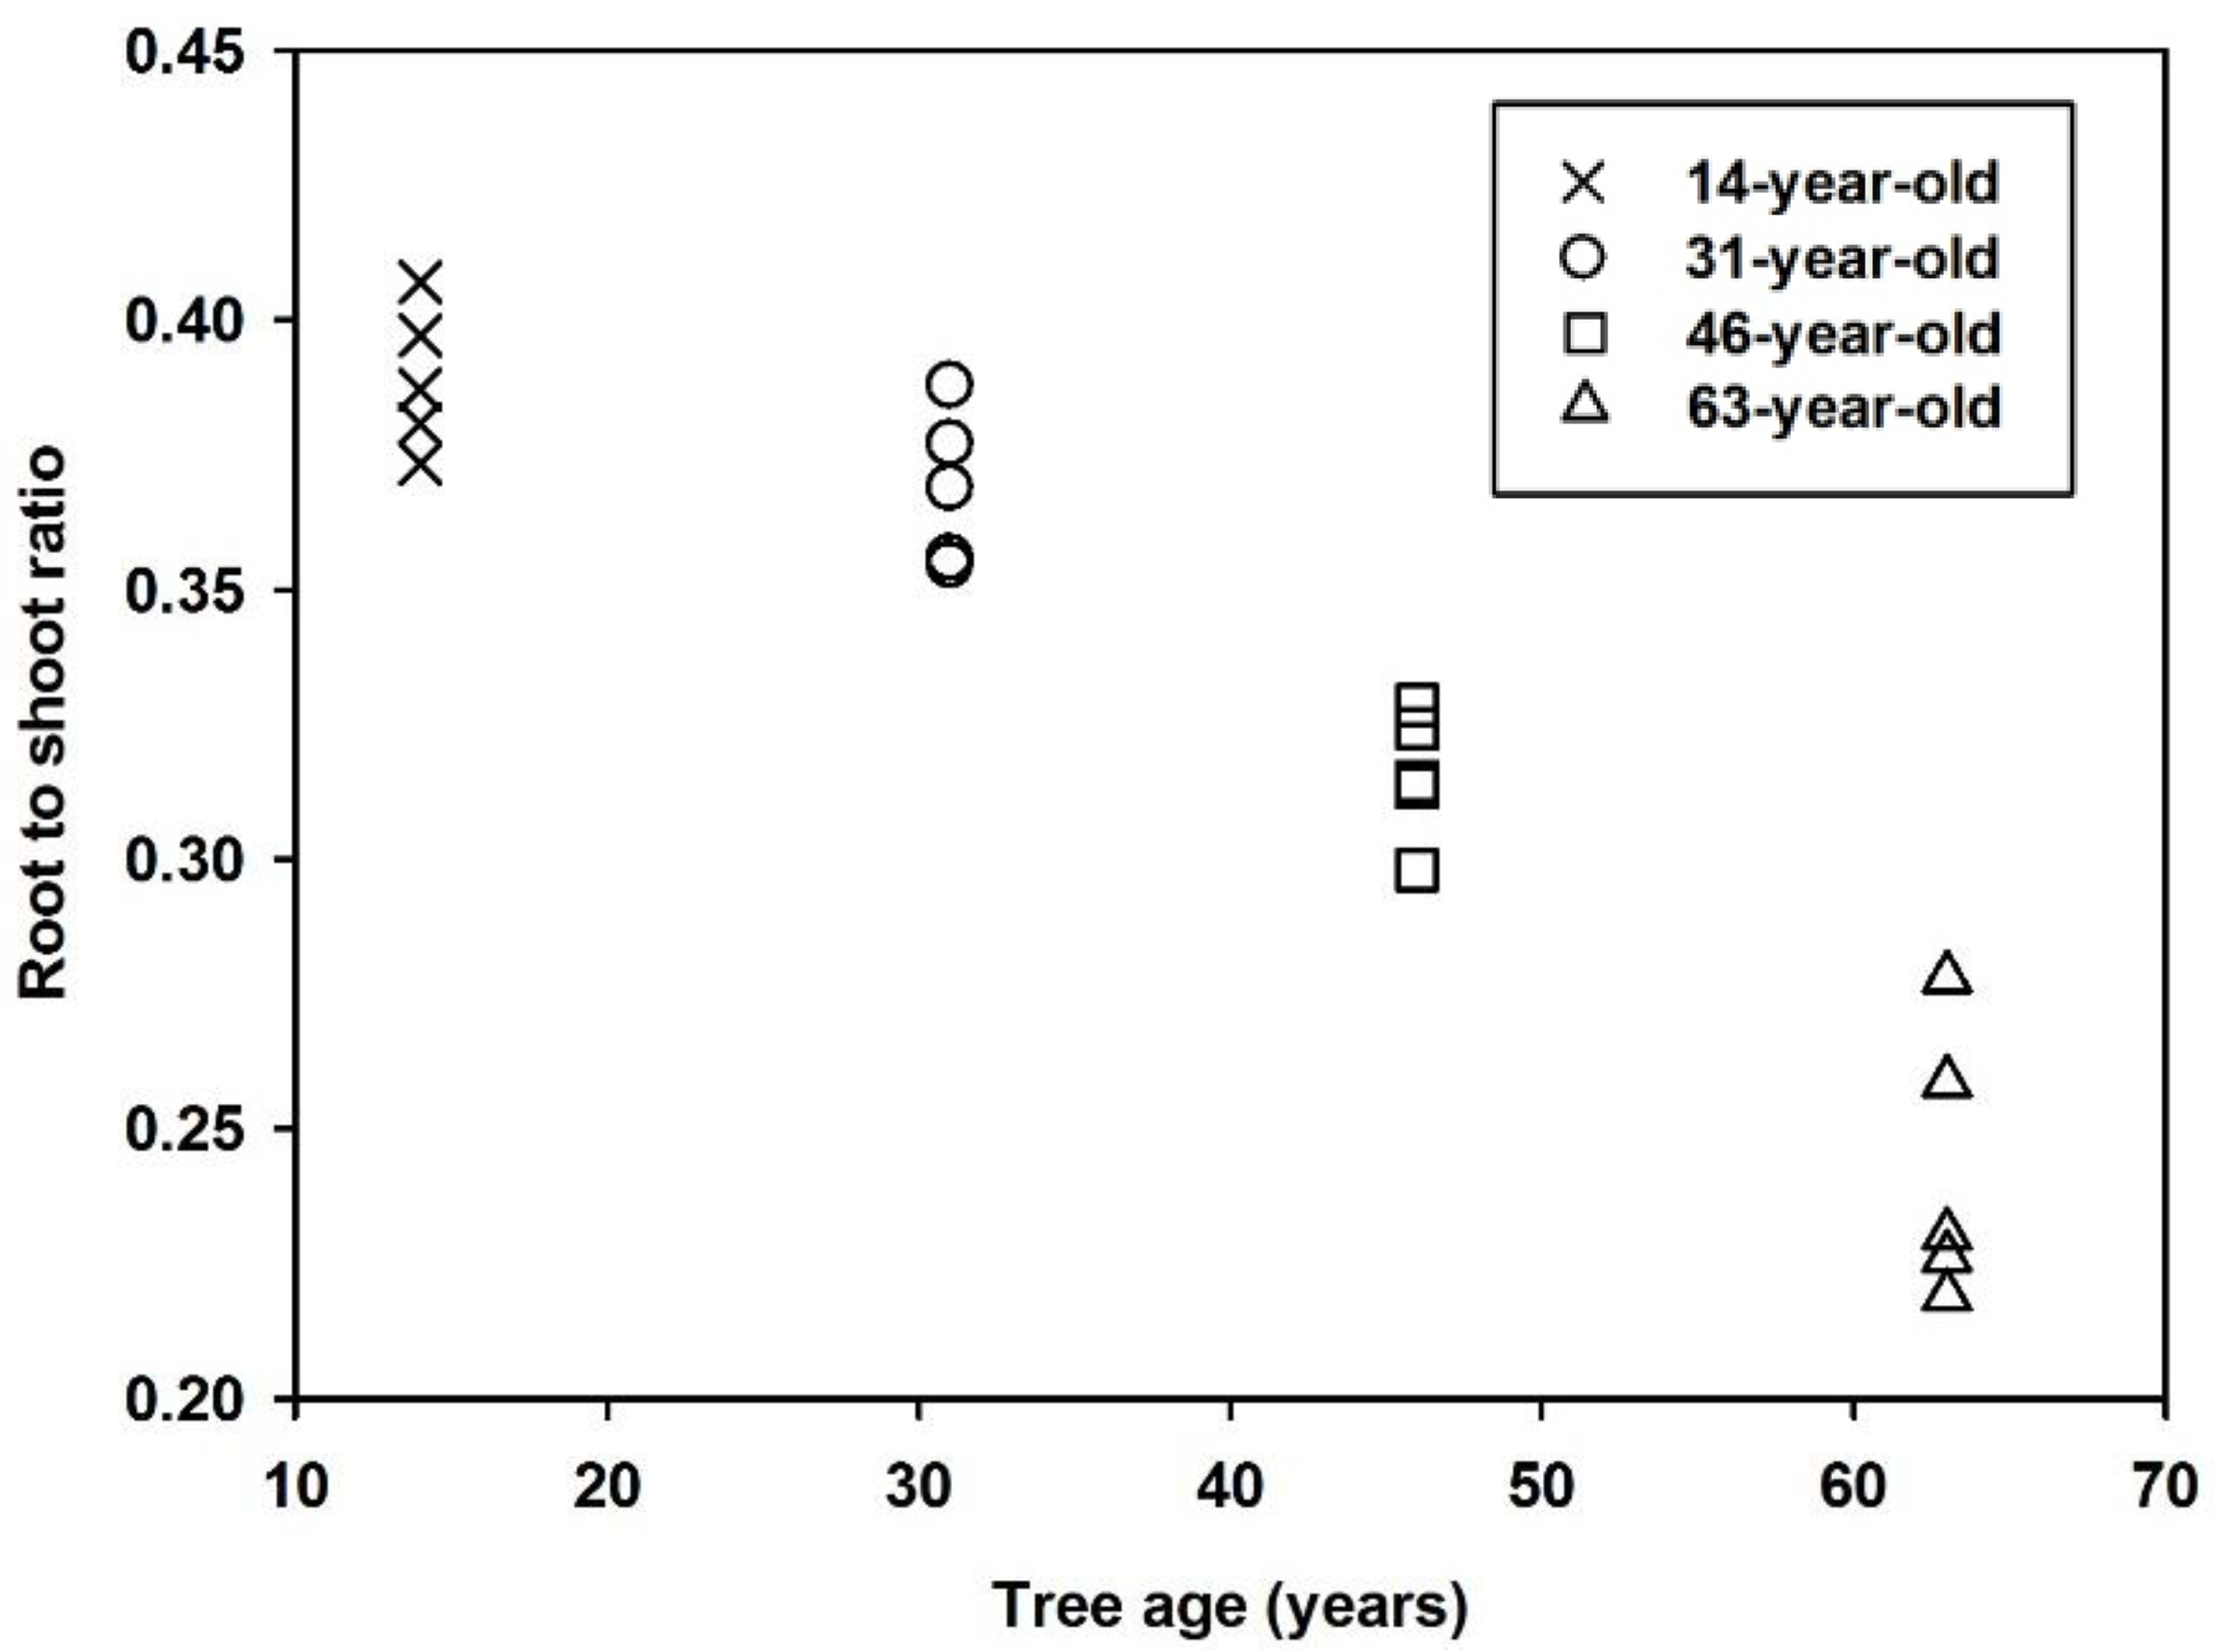
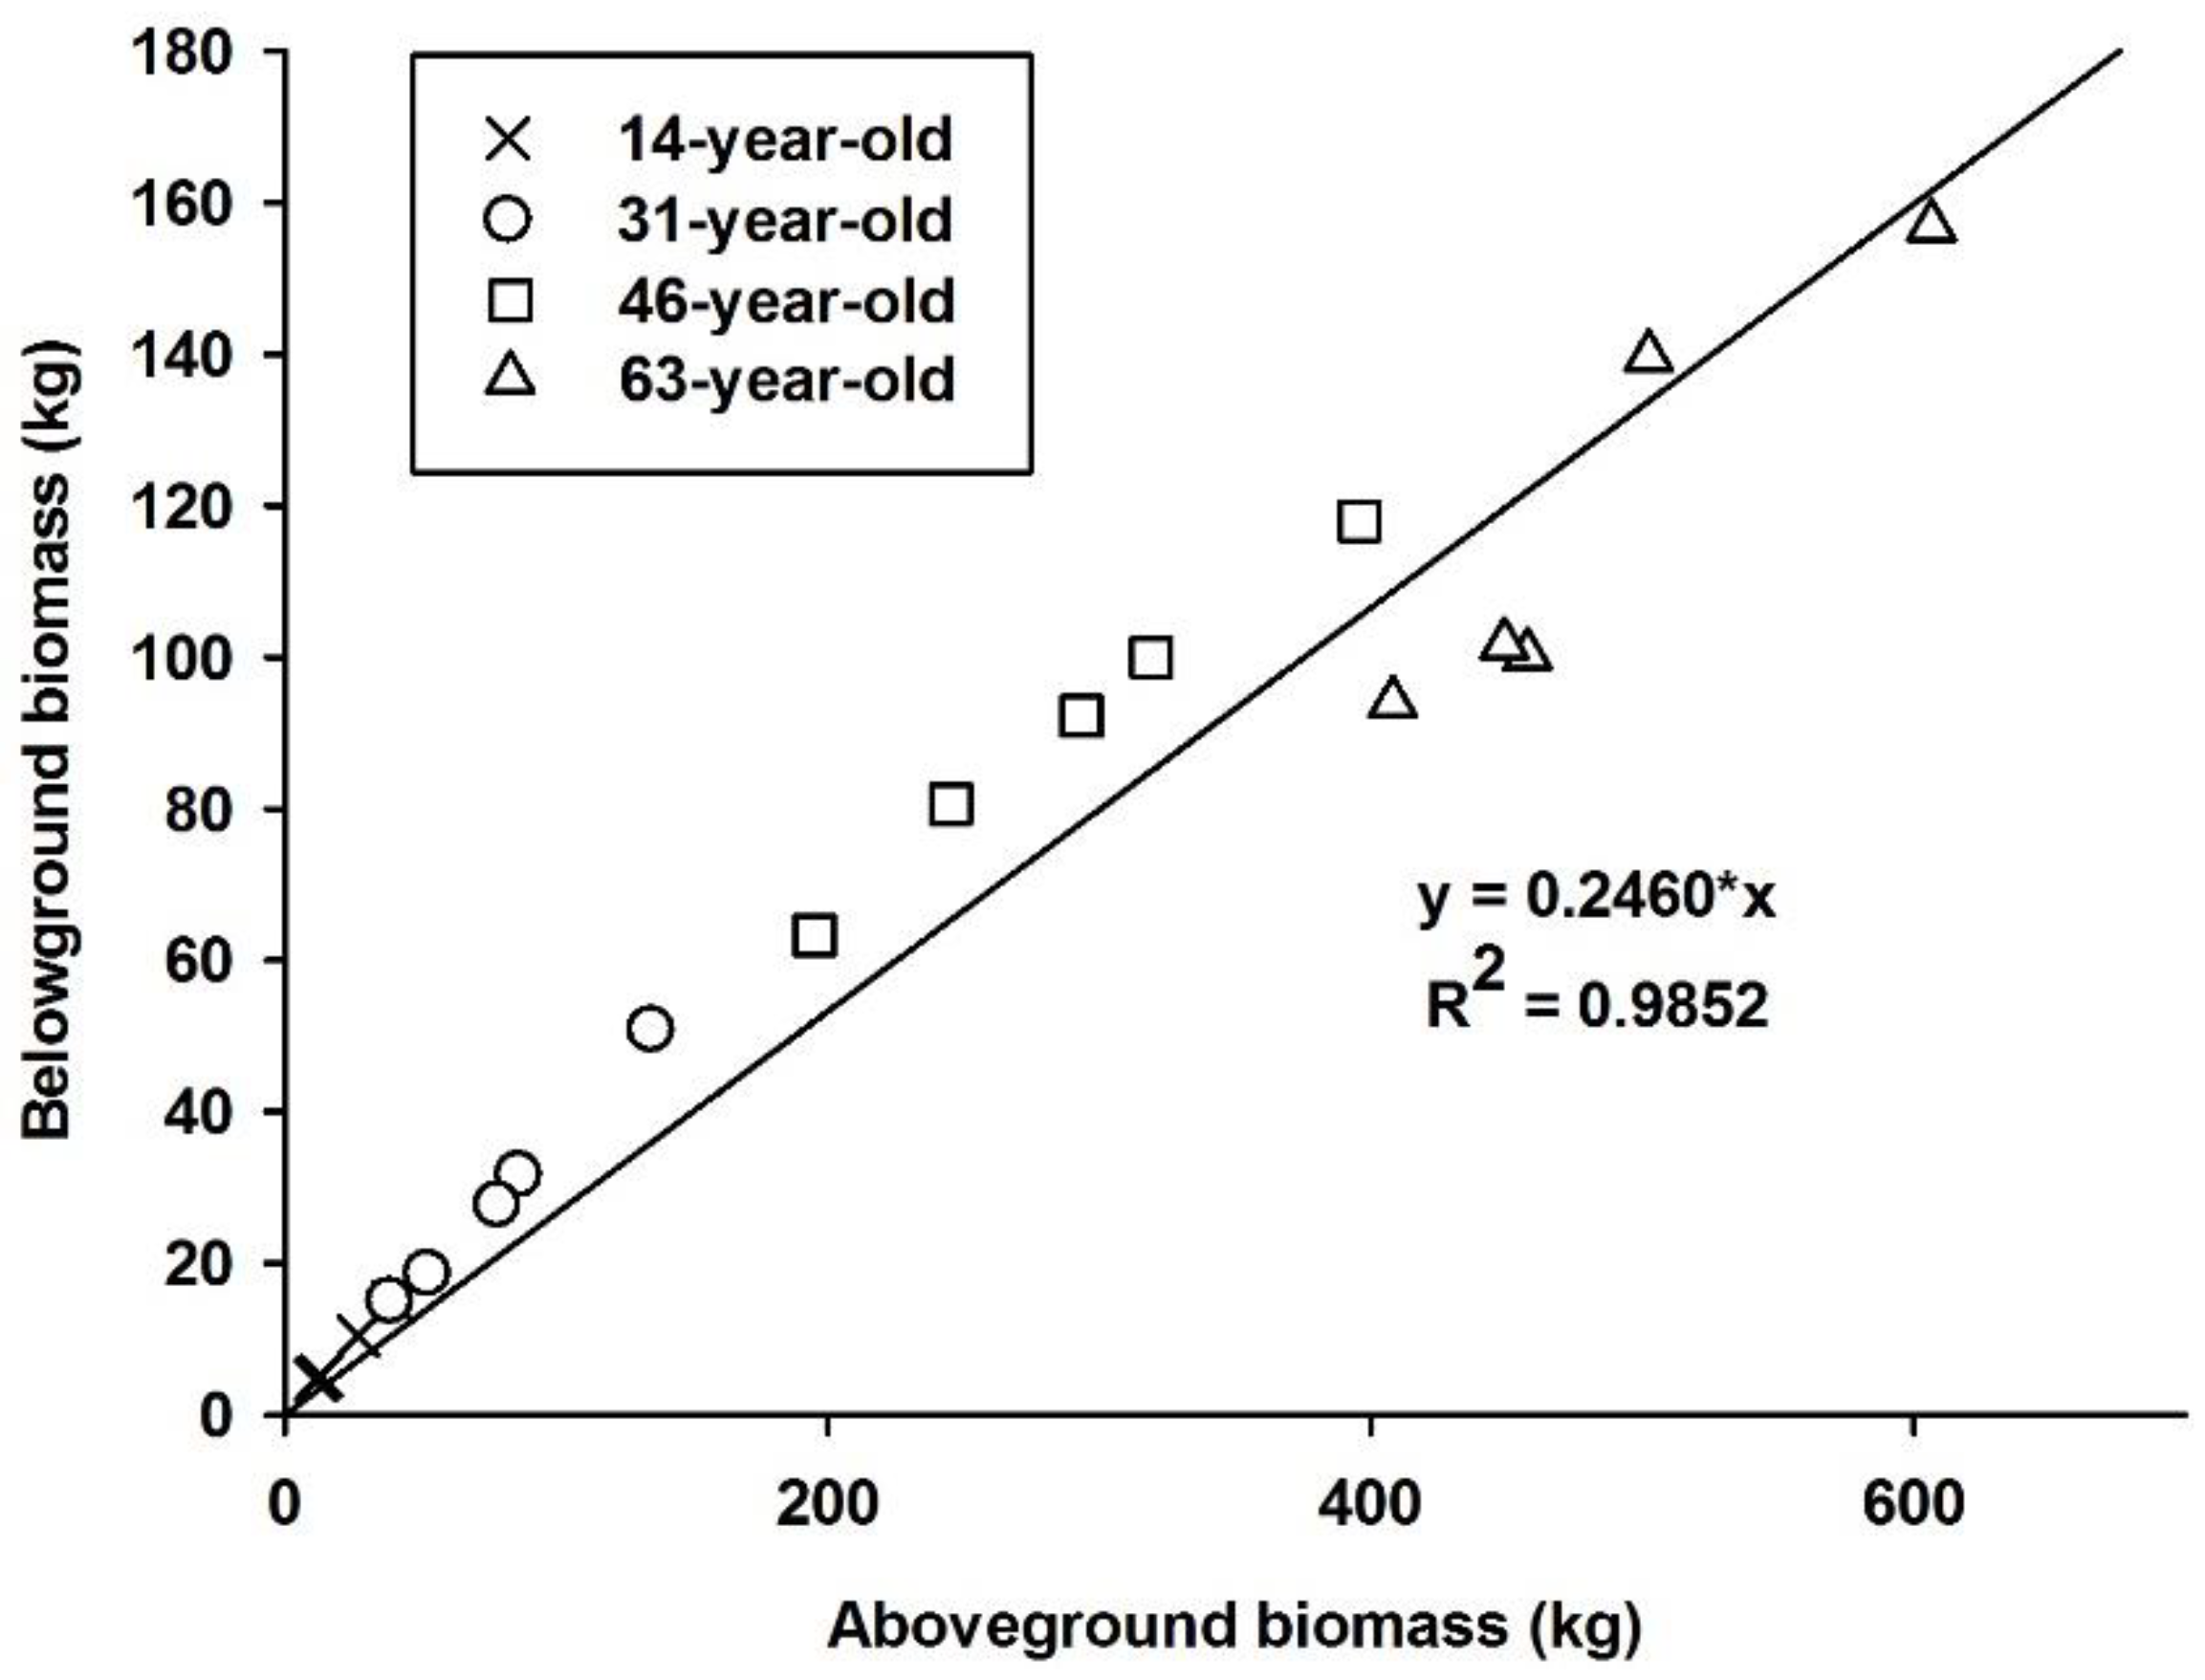
As stand age increased, the root-to-shoot biomass ratio of Q. acutissima decreased gradually (as shown in Figure 3). It decreased from 0.39 in the 14-year-old stand to 0.37, 0.31, and 0.24 in the 31-, 46-, and 63-year-old stands, respectively. Accordingly, there was a decline in relative root biomass with stand age. A rather constant relationship was also revealed by regressing the belowground and aboveground biomass data from 20 harvested trees from all four stands (Figure 4). There was a linear relationship between aboveground and belowground biomass with a slope of 0.25.

3.2. Effects of Stand Age on Biomass Equations

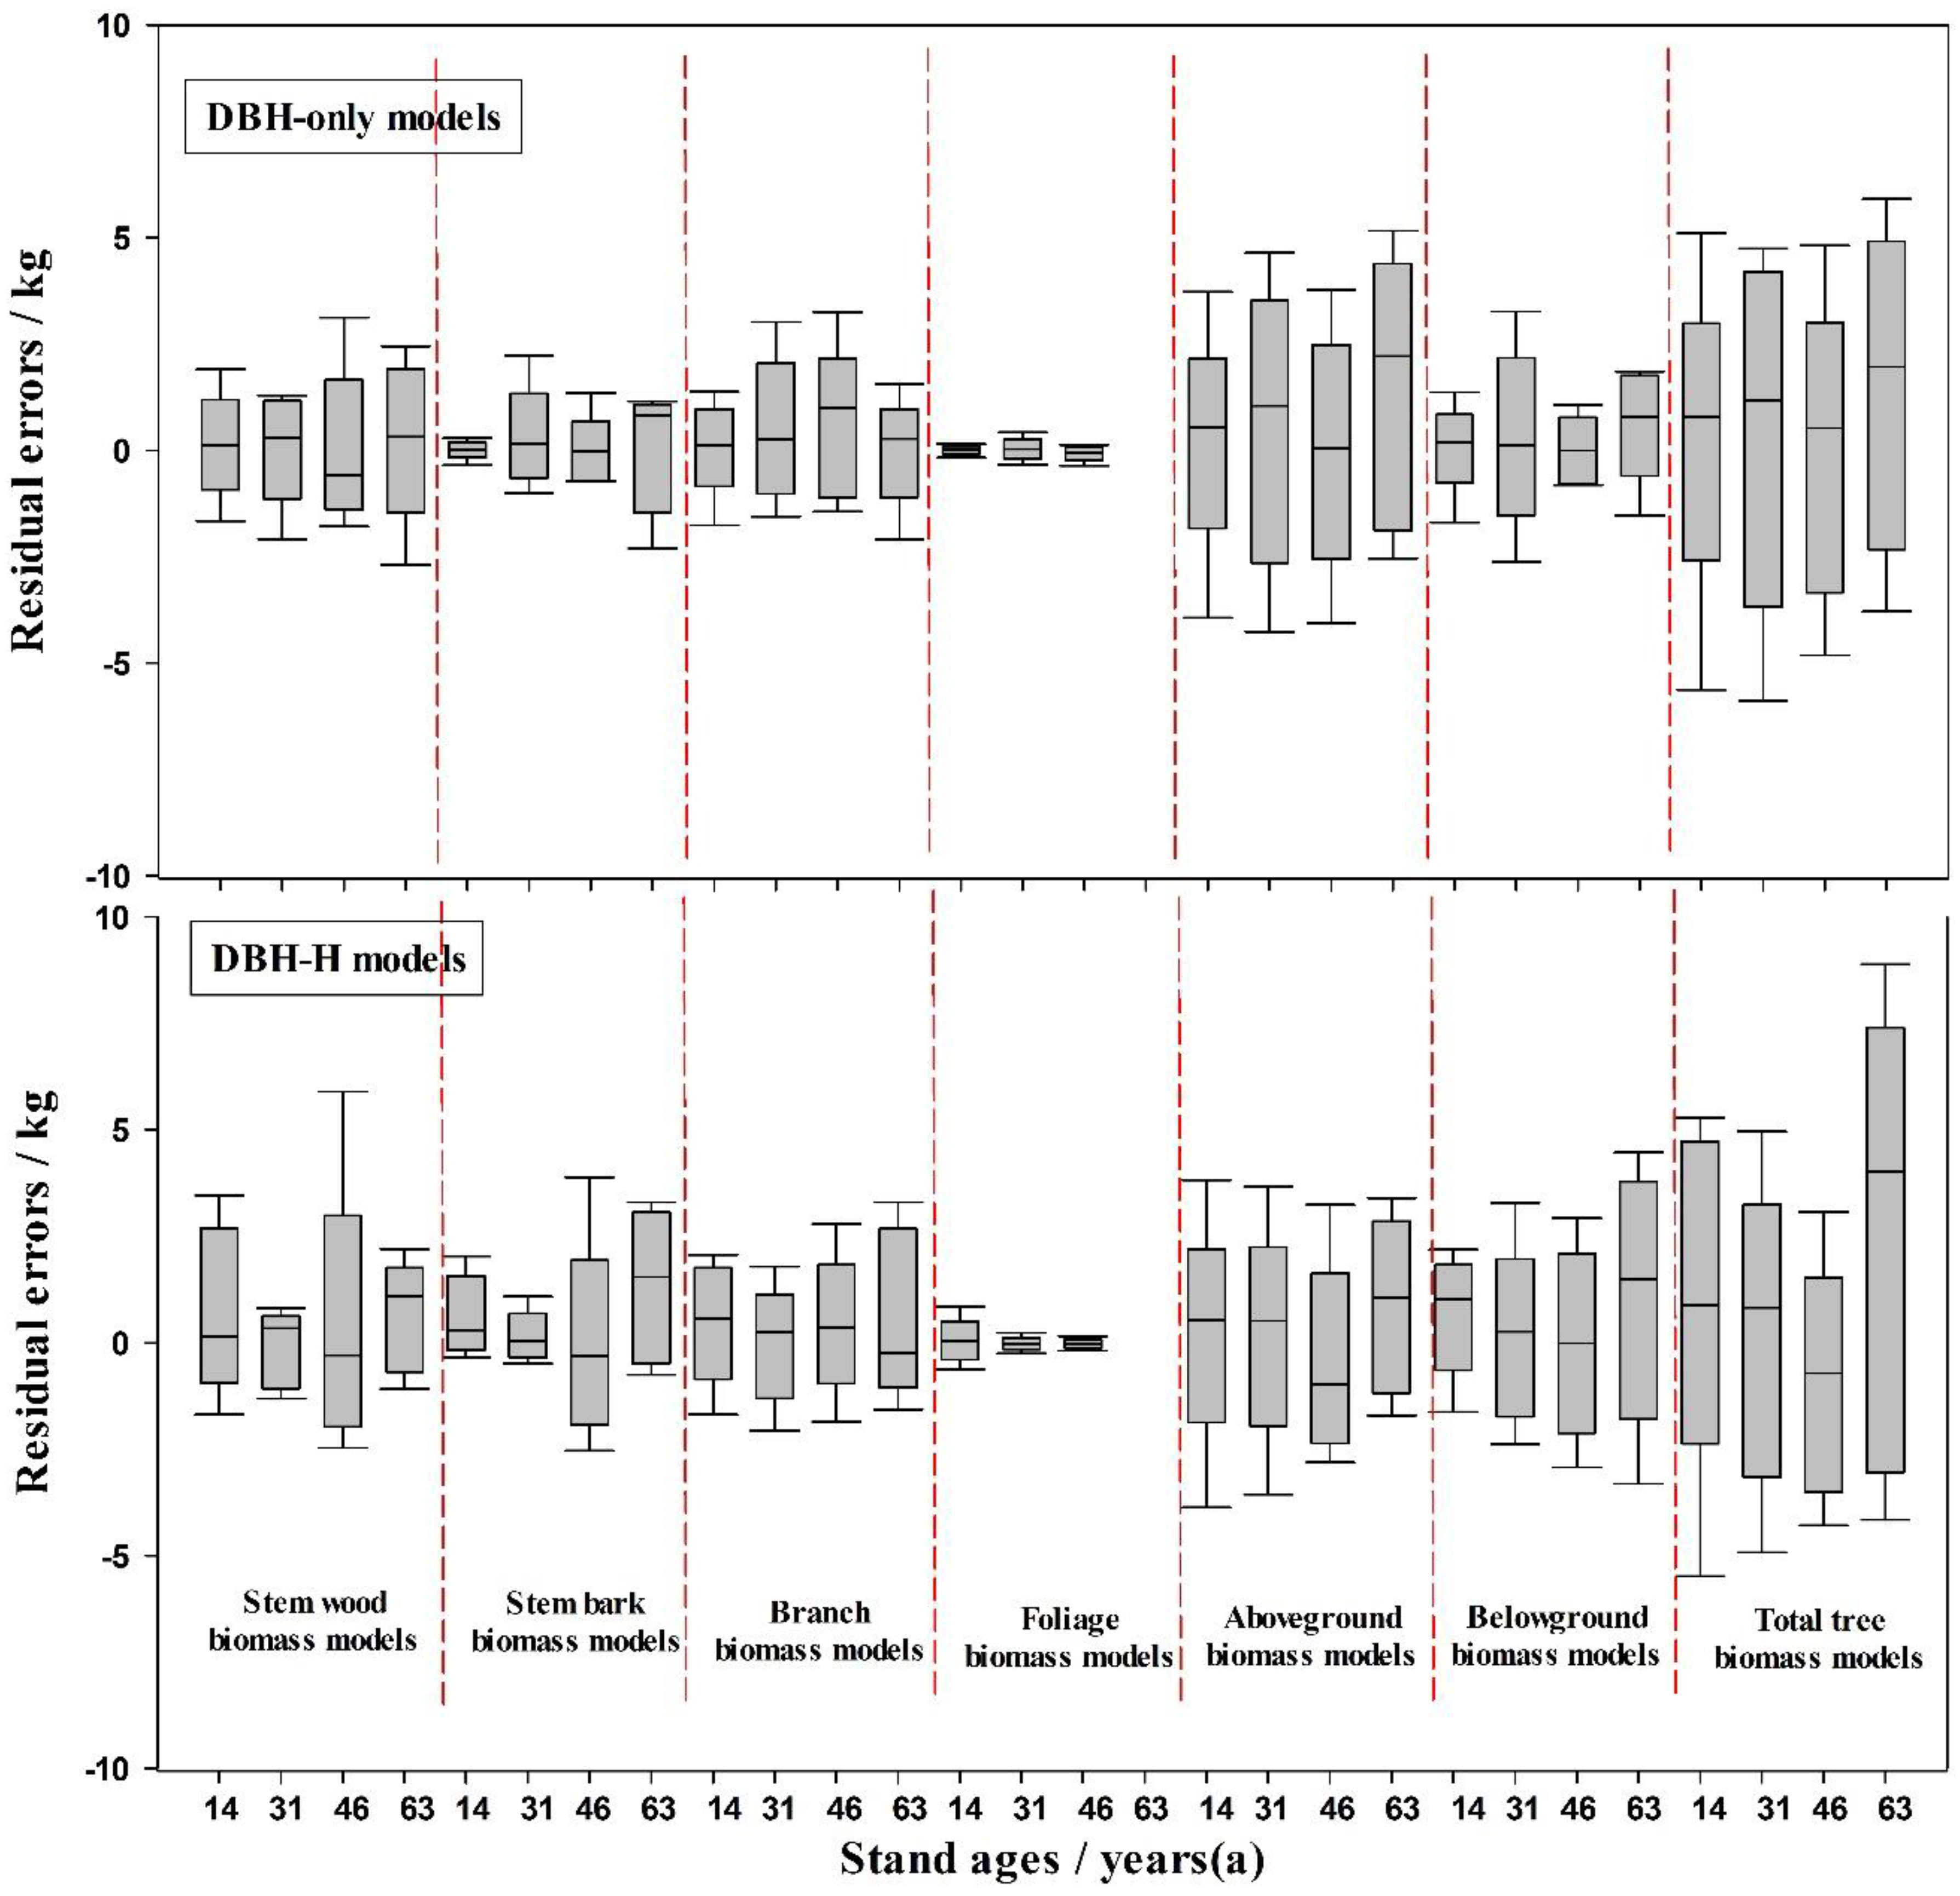
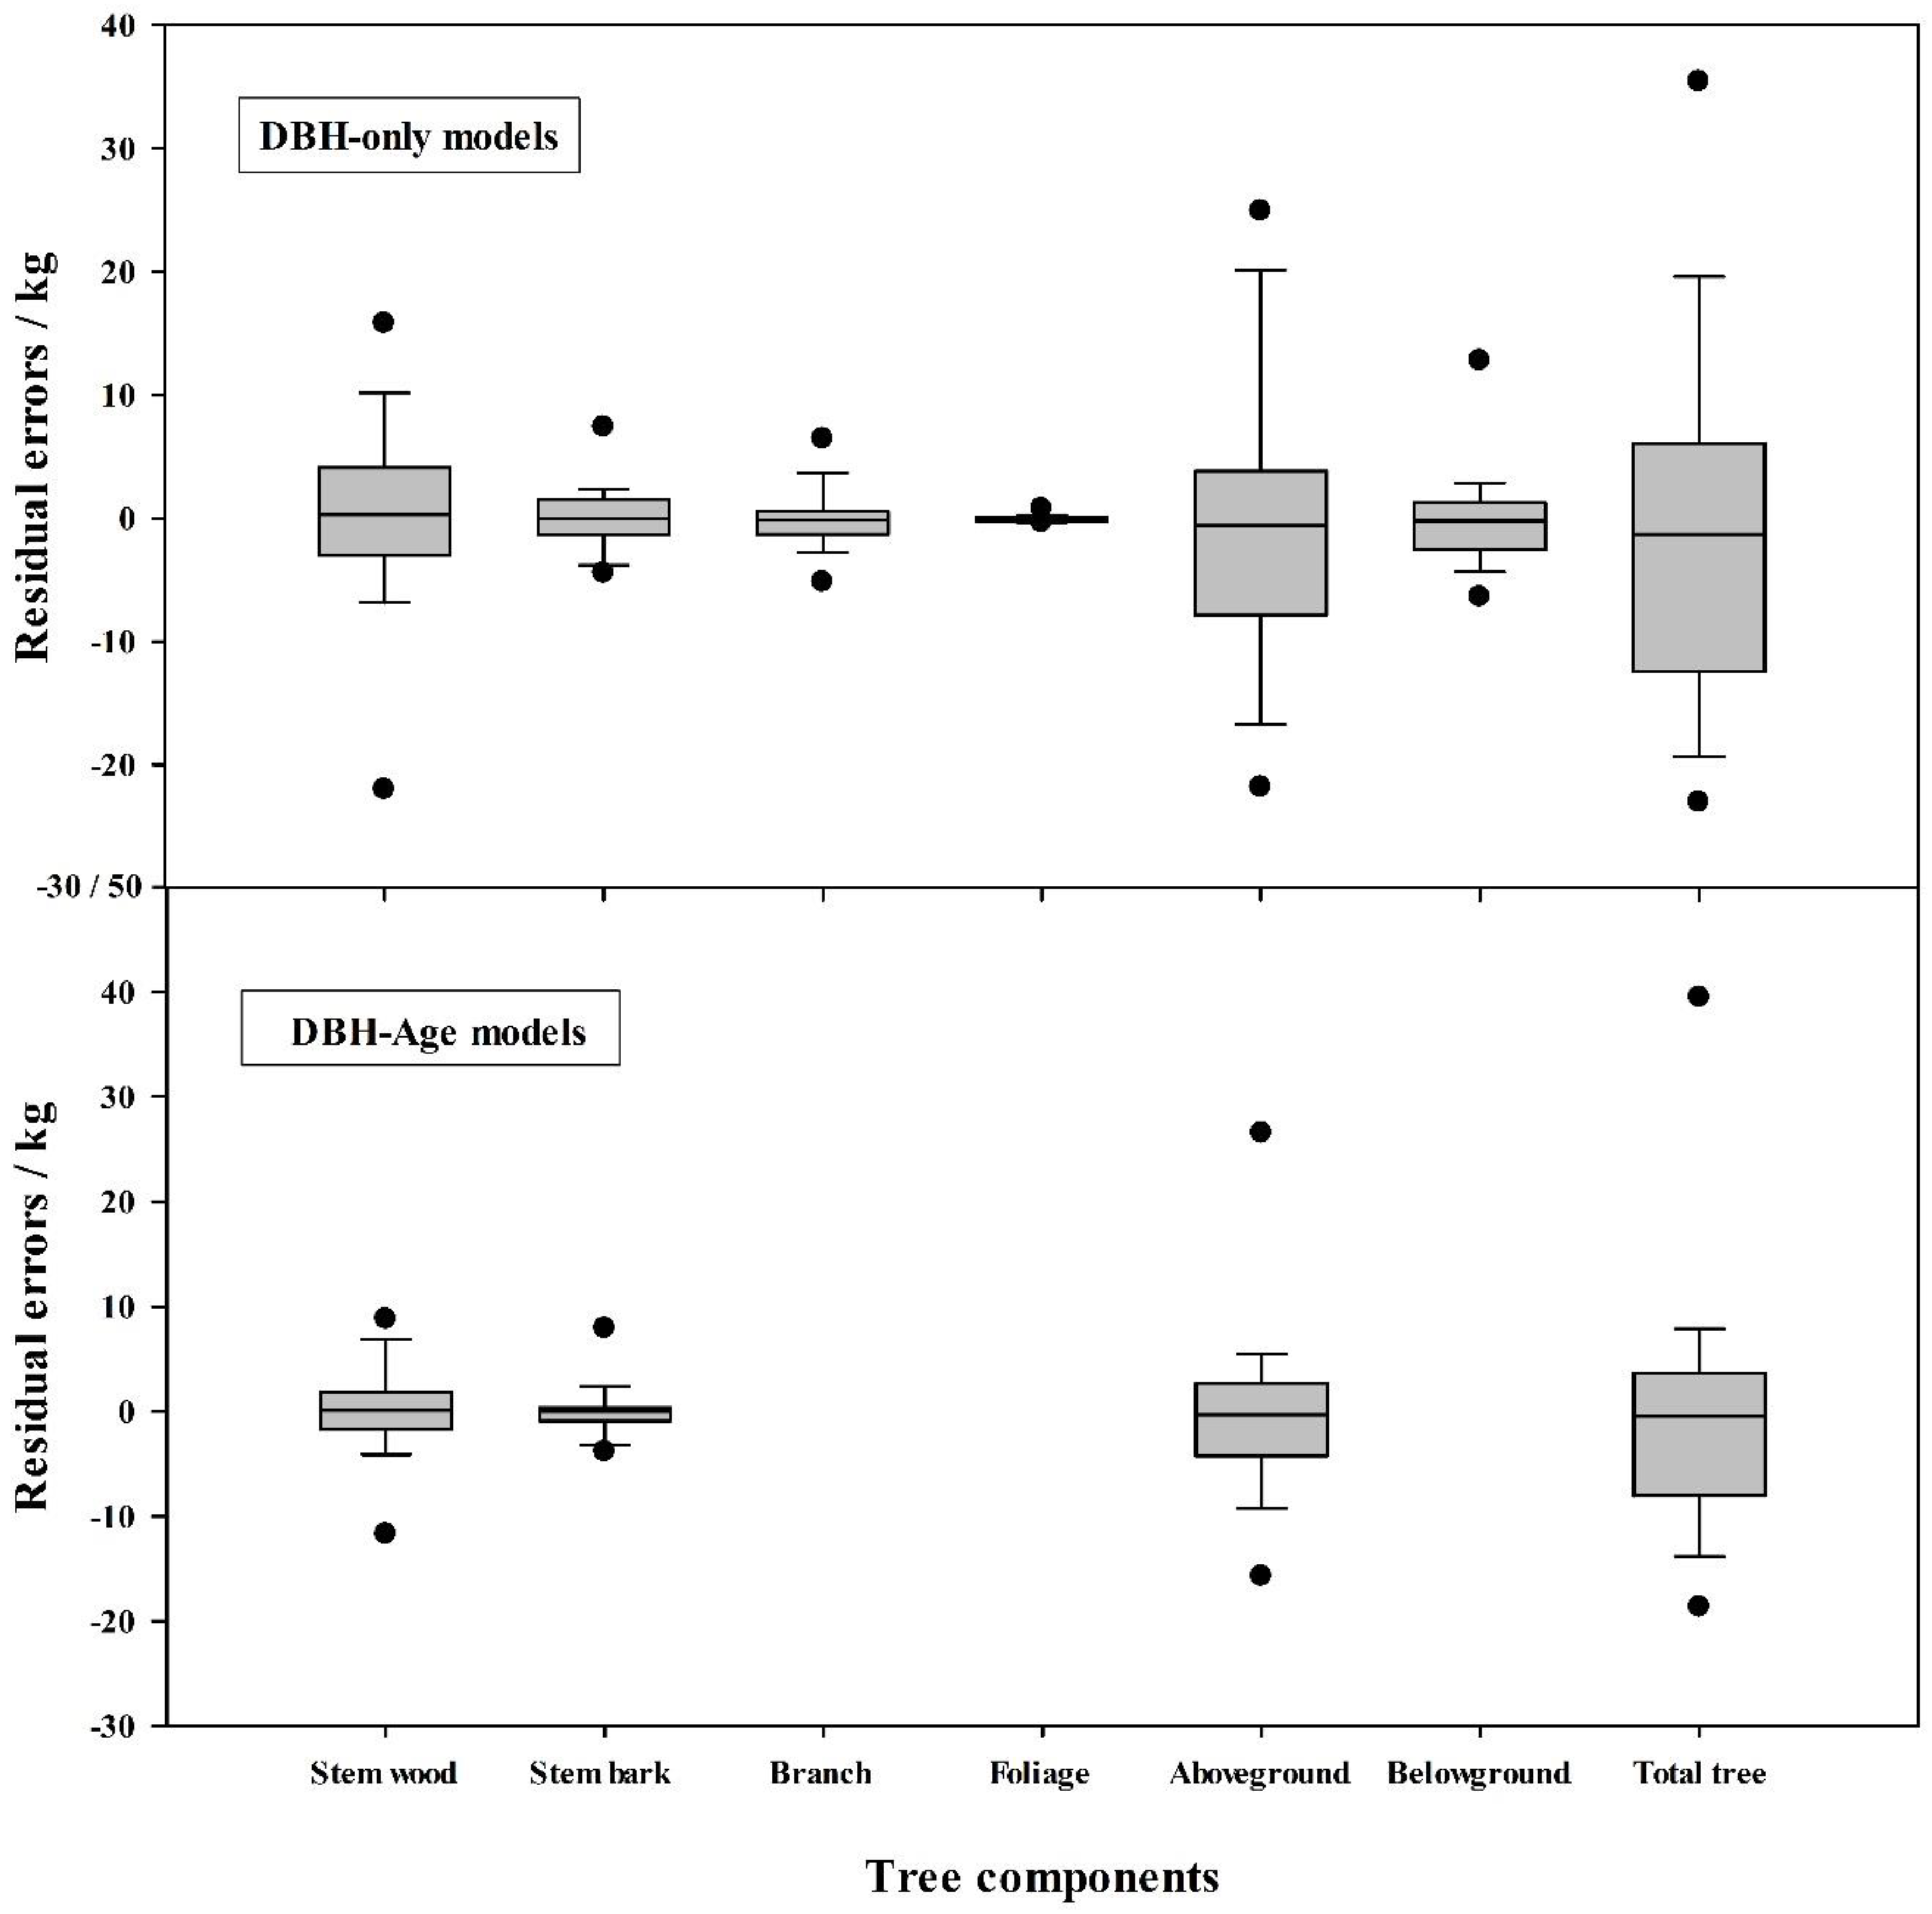
Allometric equations with DBH and tree height as independent variables and tree components’ biomass as dependent variables were developed in each of the four stands. As shown in Table 2, the tree component biomass values from the four stands were highly correlated with DBH and the mean prediction error (MPE) and absolute values of total relative error (TRE) are less than 5% except for foliage biomass in the 63-year-old stand. The residual errors of biomass equations were very small, appeared as a homogenous variance (Figure 5), and the residuals followed normal distributions. These results show that the biomass equations demonstrate good performance. When tree height was introduced into the allometric equation as the second explanatory variable, it was not consistently a contributing variable, with its contribution varying with stand age. In young (14 years old) and mature (63 years old) stands, the addition of tree height did not improve the equation fit for total tree biomass while, in mid-aged (31 and 46 years old) stands, the equation fit was improved by the inclusion of tree height. The equation parameters for individual tree components differed among the stands, possibly because of the differences in biomass allocation described above. The parameters suggest site-specific (age) allometry. We then pooled the data from all the trees from the four stands and analyzed tree component biomass as a function of DBH and tree age as a second variable (Table 3). For these pooled equations, the addition of tree age improved the equation fit for stem wood, stem bark, aboveground, and total tree biomass. Moreover, compared with age-specific equations, pooled equations (DBH-only models) presented a wider range of residuals, although they are still within a reasonable range (Figure 6).
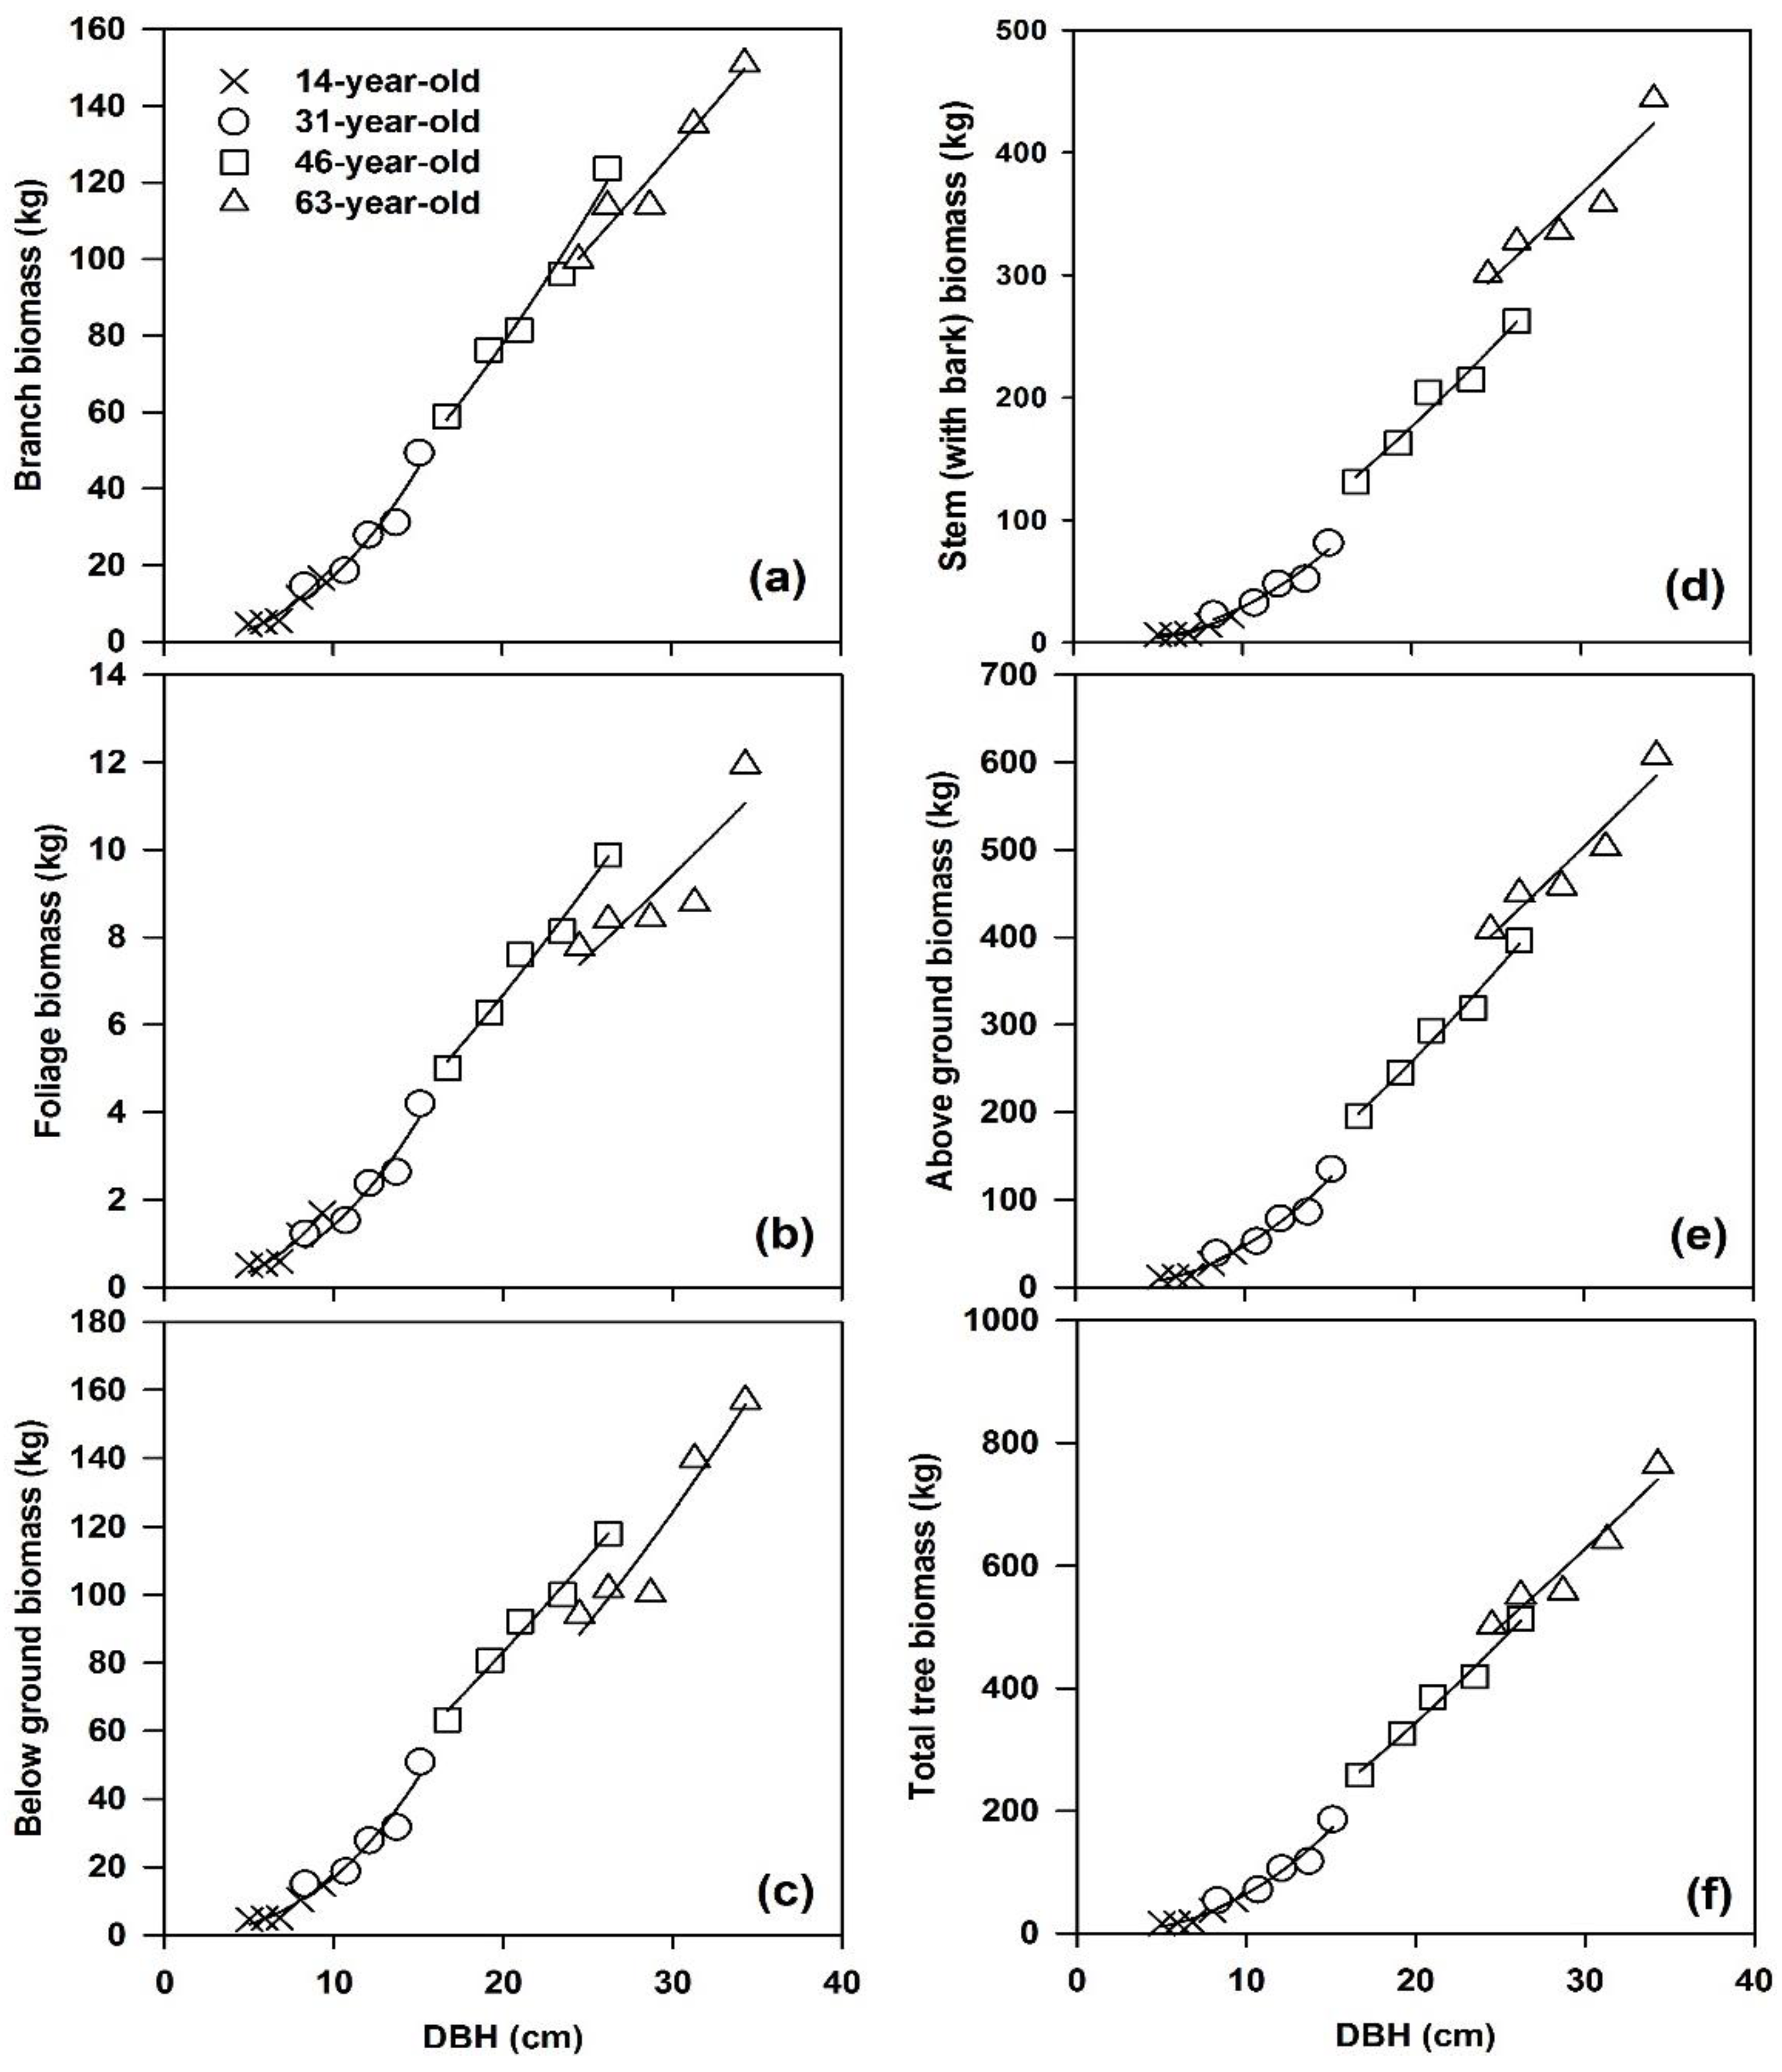
The age-specific relationship between the tree component biomass and DBH is further illustrated in Figure 7. The figure shows that the branch, foliage, and belowground biomass do not increase in a consistent manner with stand age (Figure 7a–c), whereas the stem (with bark), aboveground, and total tree biomass are dependent on stand age (Figure 7d–f). These results explain why the inclusion of age as a second variable did not result in improvement of the equations for branch, foliage, and belowground biomass (Table 3).

3.3. Effects of Stand Age on Biomass Conversion and Expansion Factors (BCEFs)

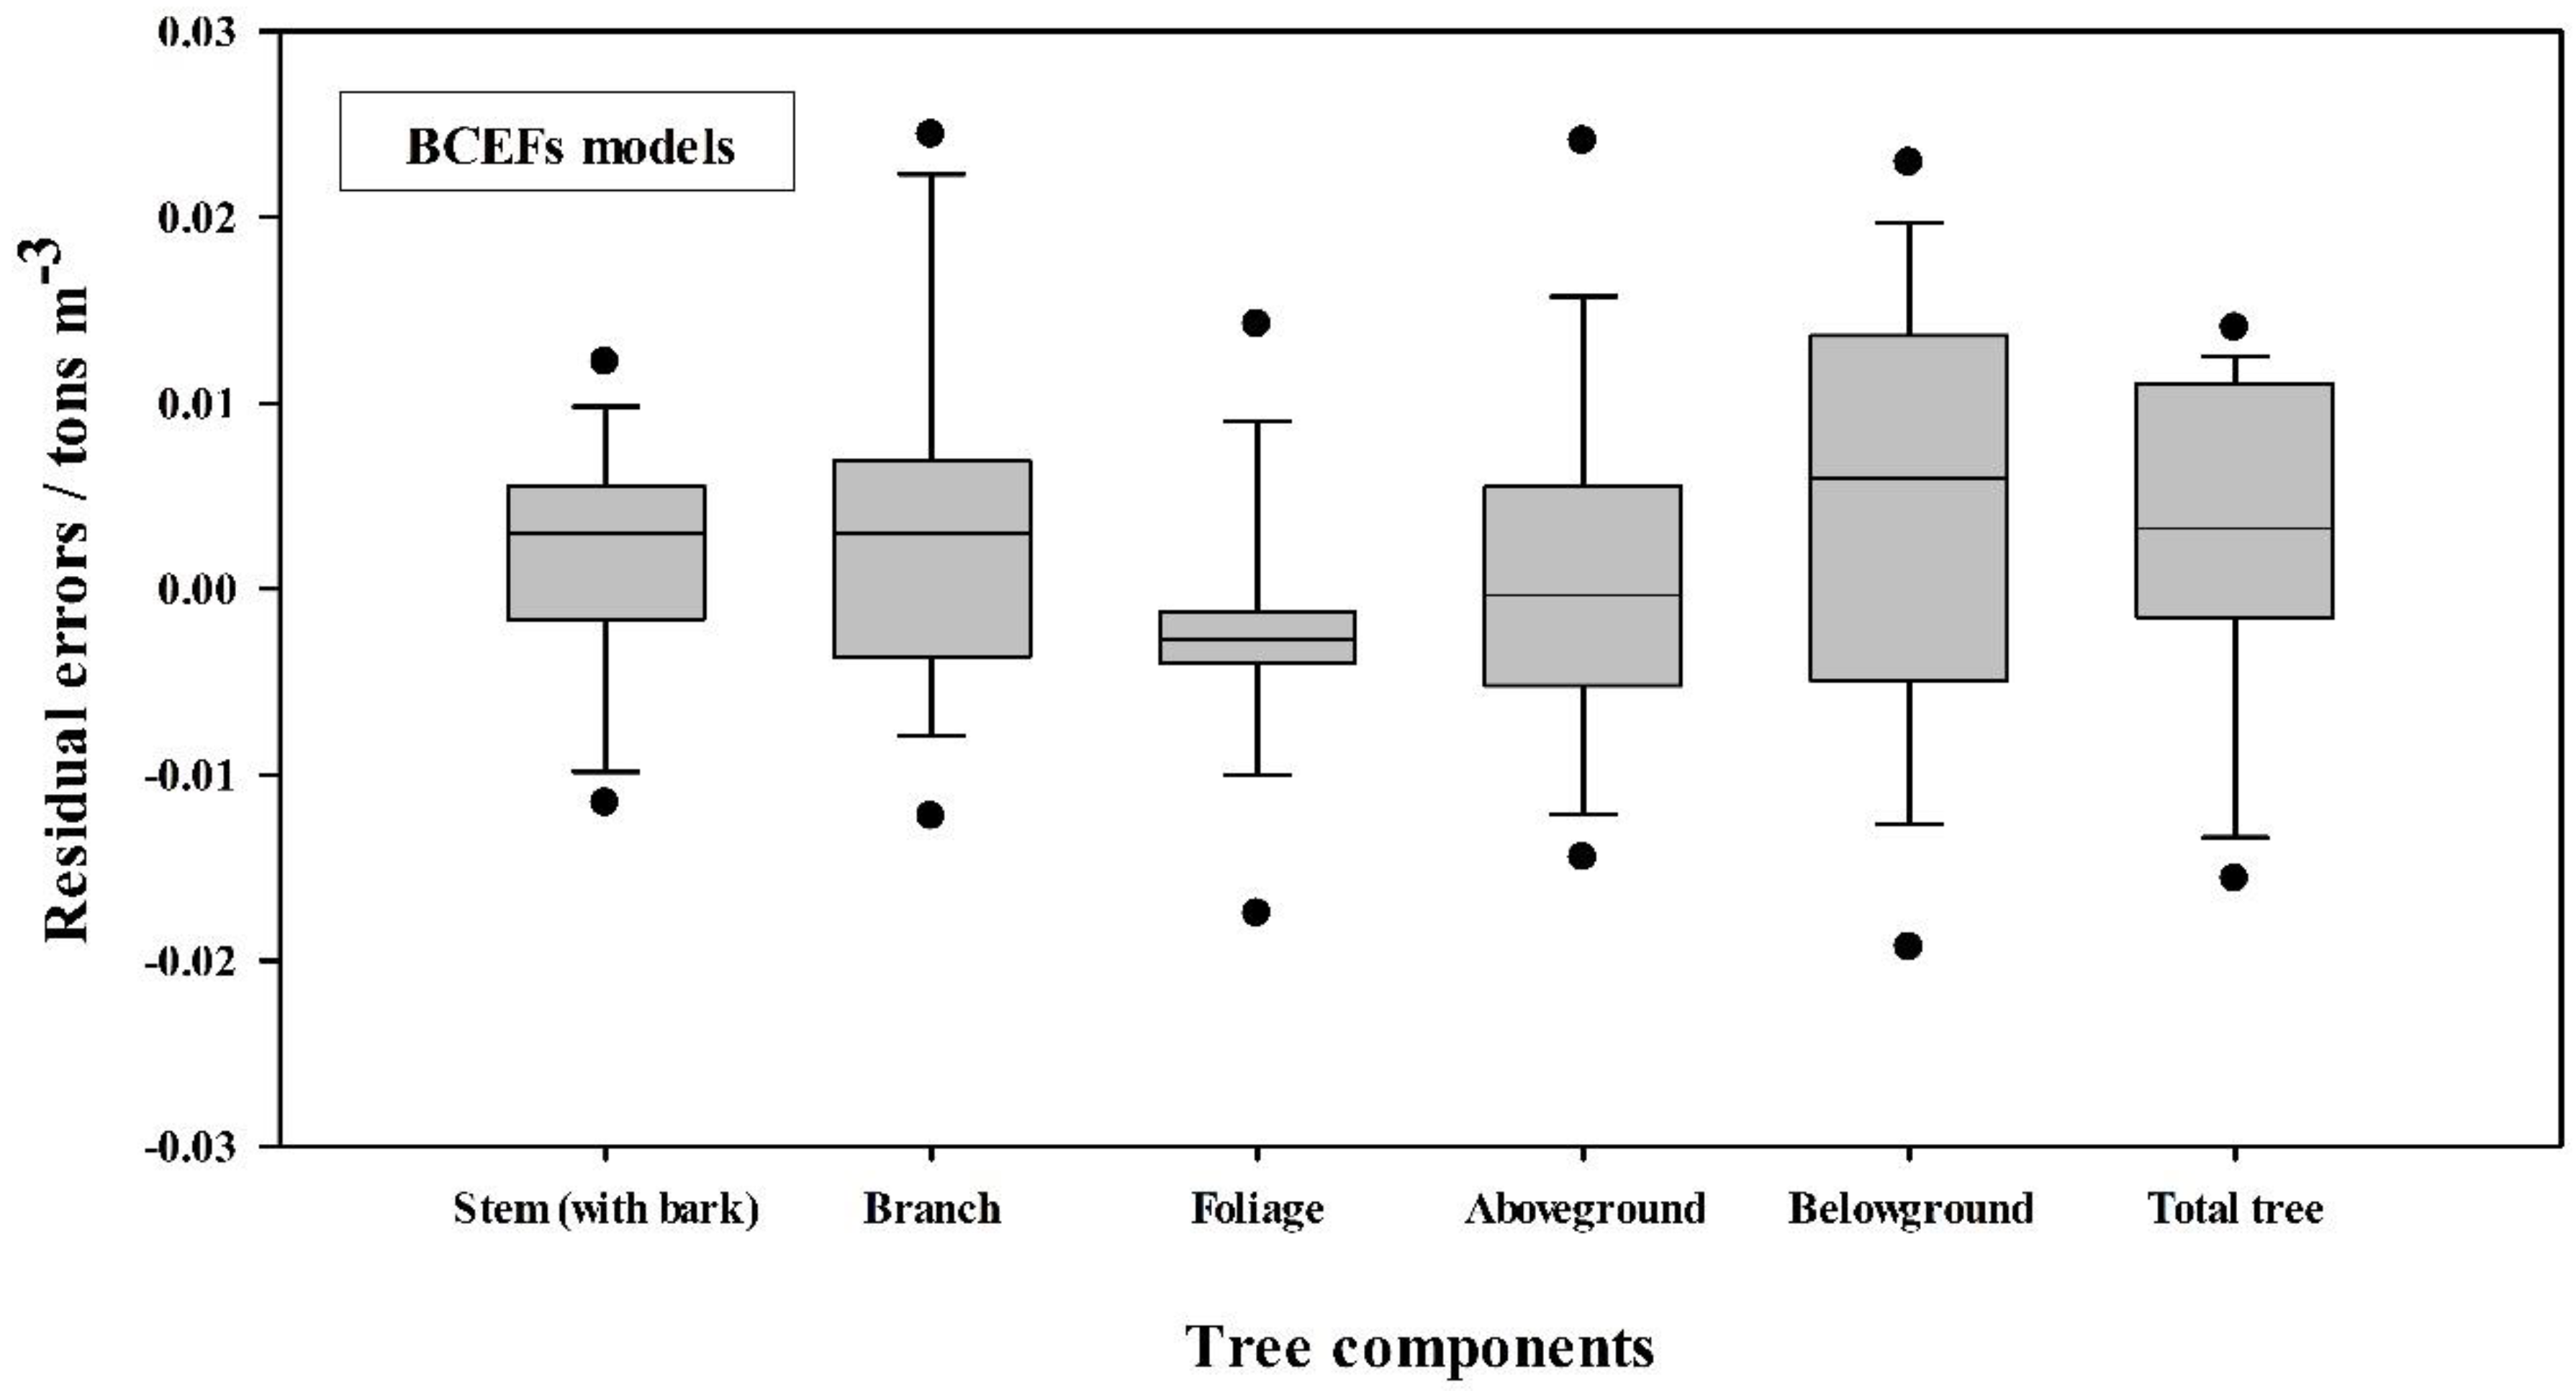
BCEFs are defined as the ratio of dry biomass to stem volume and are commonly used to convert timber volume from forest inventory to biomass. Table 4 shows that BCEFs were not constants but varied with stand age. BCEFs of the stem (with bark), branch, foliage, aboveground, belowground, and total tree biomass decreased as stand age increased, and this pattern may be a direct result of biomass redistribution with increasing age. Thus, we developed age-sensitive BCEFs equations to predict BCEFs for each biomass component based on stand age (Table 5). The BCEFs model had small and evenly distributed residuals (Figure 8), and has less than 5% MPE and TRE, which verified the predicting accuracy of equations for BCEFs.

4. Discussion

Our results from this age-specific study of Q. acutissima indicate that stand age affected biomass distribution of tree components. Some studies report that stand density also influences the biomass allocation of young oak trees [52]. However, applying a structural equation model of stand factors and net primary productivity (NPP) of Chinese fir forest, Huang et al. [53] found a significant correlation between stand density and stand age. Furthermore, these authors demonstrated that the stand age affects forest biomass not only directly but also indirectly by affecting forest density. The path analysis showed that the direct and indirect path coefficients of stand age were −0.70 (p < 0.01) and −0.38 (p < 0.05), respectively. Therefore, the variation in the relative biomass allocation of tree components in our study may have been mainly due the influence of stand age.
In the present study, we observed an increase in the proportion of stem (with bark) and a decrease in the proportion of the crown (branch and foliage) as stand age increased. This is consistent with other research results of tree component biomass [3,54]. The variation in biomass allocation with age may be explained by the strategies that trees use to survive during stand development. In early periods of growth, the proportions of leaves and roots are critical for the survival of young seedlings and the likelihood that they survive to the next developmental period. Additionally, the proportion of stem biomass becomes increasingly important for stabilizing the tree itself. Accordingly, these changes in biomass distribution during stand development need to be considered to obtain precise biomass equations.
The proportion of belowground biomass to aboveground biomass decreased from 38.45% to 24.43% from the young to old stands of Q. acutissima. These values are greater than those in many other areas, where it has been demonstrated that following a continuous decline, the root biomass of trees stabilizes at approximately 20.0% of the aboveground biomass [4,37]. This was partly caused by soil moisture and nutrient limitations in our stands on the Loess Plateau, which led to additional root biomass allocation to promote moisture and nutrient absorption. This interpretation is supported by the optimal partitioning theory that plants should allocate more biomass to those parts that acquire the most limited resource [55,56]. Nonetheless, due to the slow growth of Q. acutissima and the limited age classes in this study (14 to 63 years), the proportion of root biomass to aboveground biomass has not yet stabilized in the oldest stand. Thus, the downward trend in this proportion may last for a long time, and its impact should be accounted for when estimating Q. acutissima biomass.
Due to the difficulty of assessing the entire root system with the excavation method, belowground biomass is the most difficult tree component to measure accurately [57,58]. Inevitably, a small amount of fine roots was lost during our field excavation. However, Le Goff and Ottorini [59] proved that the missing portion of the fine fraction represents an extremely small part of the root system and has no significant influence on the estimation of tree belowground biomass. Therefore, in our study, we fit the belowground biomass well using a power-law function (R2 = 0.9600). Given the belowground component’s status as the second largest tree component, allometric equations of root biomass have been gaining importance and are very helpful for estimating the belowground biomass of local Q. acutissima forests. The linear relationship between aboveground and belowground biomass indicated in this study that the biomass allocation of Q. acutissima was consistent with the isometric biomass allocation theory [60]. However, it remains unknown whether linear relationships between aboveground and belowground biomass are applicable to trees less than 14 years old [22]. Additional allometric data from Q. acutissima stands less than 14 years old are required to evaluate this possibility.
Allometric relationships are often applied in tree biomass model fitting and are often described by power-law equations. In the present study, power functions provided strong fit (R2 values in the range of 0.81–0.98) for biomass estimation of Q. acutissima. Moreover, the relationships between DBH and stem wood, stem bark, aboveground, and total tree biomass were specific to each stand age. Thus, allometric equations that ignore stand age may lead to inaccurate estimates of tree biomass. Consistent with this finding, Peichl and Arain [4] found a relationship between allometric equations of aboveground biomass and stand age in other species. The inclusion of tree height as a second variable in allometric biomass equations has been discussed by many researchers [7,8,9,61,62,63]. In previous studies, tree height has been either a relevant or an irrelevant variable. However, in our study, the contribution of the tree height variable was closely related to stand age. Thus, we recommend the DBH-H equation for estimating total tree biomass in mid-aged Q. acutissima stands and the DBH-only equation for young and mature stands. Overall, single biomass equations that ignore stand age may be less accurate than age-specific equations. Regardless, because of the limited number of samples in our study, additional data must be obtained in future work to verify whether these equations are appropriate for large-scale biomass estimation.
In general, forest biomass and carbon stock estimations are based on National Forest Inventory (NFI) data and usually rely on the estimation of stem volume. BCEFs are used to convert timber volumes to dry weight and then to whole-tree biomass [36], and they vary depending on growth conditions and the stand development phase [21]. In the present study, the BCEFs of each tree component decreased with stand age. Consistent with our results, Kauppi et al. [64] reported a decreasing trend in BCEFs for Norway spruce with increasing forest age. Therefore, the use of fixed BCEFs without considering stand age may lead to considerable overestimation or underestimation of tree biomass. According to the GTGP, more than 34 million tons of carbon are fixed in forests of different stages of development each year in China [65]. Thus, it is very important to consider the influence of stand age on tree biomass to improve the estimation of biomass and carbon on regional and national scales.

5. Conclusions

We obtained comprehensive age-specific allometric results of biomass for Q. acutissima, which is an important tree species in the central Loess Plateau of China. Allometrics appears to be a useful tool for obtaining precise descriptions of biomass allocation patterns. Our study revealed the age dependence of not only biomass allocation but also of the parameters of allometric equations. Accordingly, we believe that forest biomass of different age stands should be estimated using different biomass equations and BCEFs including equations with different variables (DBH-only or DBH-H). The results of this study indicate that age-specific biomass partitioning and allometry need be considered to obtain precise biomass and C stock estimates of forests. In addition, considering the difficulty of extracting root samples, especially from large trees, the belowground biomass results obtained in this study may be employed for rough estimation of root biomass of Q. acutissima.

Author Contributions

W.Z. was the project director who designed the experiments, performed measurements, and contributed to the writing of the paper. B.Y., W.X., S.Y., and J.Z. conducted data collection. B.Y. contributed to data analysis and wrote the paper.

Funding

The Basic Research Project of National Forest Management from The State Forestry Bureau in China (1692016-03) financially supported this study.

Acknowledgments

Additionally, the Qiaoshan Forestry Bureau of China provided support. This work was also supported by CFERN & BEIJING TECHNO SOLUTIONS Award Funds on excellent academic achievements. We are particularly grateful to the following lab members for their help and assistance with field work: Xiaozhou Yang, Gang Li, Caizhi Huang, Zhongli Xing. and Quanping Ye.

Conflicts of Interest

The authors declare no conflict of interest.

References

  1. Justine, M.F.; Yang, W.Q.; Wu, F.Z.; Tan, B.; Khan, M.N.; Zhao, Y.Y. Biomass stock and carbon sequestration in a chronosequence of Pinus massoniana plantations in the upper reaches of the Yangtze River. Forests 2015, 6, 3665–3682. [Google Scholar] [CrossRef]
  2. Yan, Y. Integrate carbon dynamic models in analyzing carbon sequestration impact of forest biomass harvest. Sci. Total Environ. 2018, 615, 581–587. [Google Scholar] [CrossRef] [PubMed]
  3. Zhang, H.; Song, T.Q.; Wang, K.L.; Du, H.; Yue, Y.M.; Wang, G.X.; Zeng, F.P. Biomass and carbon storage in an age-sequence of Cyclobalanopsis glauca plantations in southwest China. Ecol. Eng. 2014, 73, 184–191. [Google Scholar] [CrossRef]
  4. Peichl, M.; Arain, M.A. Allometry and partitioning of above- and belowground tree biomass in an age-sequence of white pine forests. For. Ecol. Manag. 2007, 253, 68–80. [Google Scholar] [CrossRef]
  5. Zhou, X.H.; Fu, Y.L.; Zhou, L.Y.; Li, B.; Luo, Y.Q. An imperative need for global change research in tropical forests. Tree Physiol. 2013, 33, 903–912. [Google Scholar] [CrossRef] [Green Version]
  6. Penman, J.; Gytarsky, M.; Hiraishi, T.; Krug, T.; Kruger, D.; Pipatti, R.; Buendia, L.; Miwa, K.; Ngara, T.; Tanabe, K. Good Practice Guidance for Land Use, Land-Use Change and Forestry; IPCC: Vienna, Austria, 2003; Volume 35, pp. 103–105. [Google Scholar]
  7. He, H.J.; Zhang, C.Y.; Zhao, X.H.; Fousseni, F.; Wang, J.S.; Dai, H.J.; Yang, S.; Zuo, Q. Allometric biomass equations for 12 tree species in coniferous and broadleaved mixed forests, Northeastern China. PLoS ONE 2018, 13, e0186226. [Google Scholar] [CrossRef]
  8. Dang, Y.; Wang, X.; Zeng, W. Using Segmented Modeling Approach to construct tree volume and biomass equations for larch in Northeastern China. For. Res. 2012, 25, 558–563. [Google Scholar]
  9. Zeng, M.; Nie, X.; Zeng, W. Compatible tree volume and aboveground biomass equations of Chinese Fir in China. Scientia Silvae Sinicae 2013, 49, 74–79. (In Chinese) [Google Scholar]
  10. Dong, L.H.; Zhang, L.J.; Li, F.R. Developing additive systems of biomass equations for nine hardwood species in Northeast China. Trees 2015, 29, 1149–1163. [Google Scholar] [CrossRef]
  11. Zou, W.T.; Zeng, W.S.; Zhang, L.J.; Zeng, M. Modeling crown biomass for four pine species in China. Forests 2015, 6, 433–449. [Google Scholar] [CrossRef]
  12. Zeng, W.S. Integrated individual tree biomass simultaneous equations for two larch species in northeastern and northern China. Scand. J. For. Res. 2015, 30, 594–604. [Google Scholar] [CrossRef]
  13. Zeng, W.S.; Fu, L.Y.; Xu, M.; Wang, X.J.; Chen, Z.X.; Yao, S.B. Developing individual tree-based models for estimating aboveground biomass of five key coniferous species in China. J. For. Res. 2018, 29, 1251–1261. [Google Scholar] [CrossRef]
  14. Meng, S.W.; Liu, Q.J.; Zhou, G.; Jia, Q.Q.; Zhuang, H.X.; Zhou, H. Aboveground tree additive biomass equations for two dominant deciduous tree species in Daxing’anling, northernmost China. J. For. Res. 2017, 22, 233–240. [Google Scholar] [CrossRef]
  15. Xue, Y.; Yang, Z.Y.; Wang, X.Y.; Lin, Z.P.; Li, D.X.; Su, S.F. Tree Biomass allocation and its model additivity for Casuarina equisetifolia in a tropical forest of Hainan Island, China. PLoS ONE 2016, 11, e0151858. [Google Scholar] [CrossRef] [PubMed]
  16. Dong, L.H.; Zhang, L.J.; Li, F.R. A three-step proportional weighting system of nonlinear biomass equations. For. Sci. 2015, 61, 35–45. [Google Scholar] [CrossRef]
  17. Tanhuanpaa, T.; Kankare, V.; Setlala, H.; Yli-Pelkonen, V.; Vastaranta, M.; Niemi, M.T.; Raisio, J.; Holopainen, M. Assessing above-ground biomass of open-grown urban trees: A comparison between existing models and a volume-based approach. Urban For. Urban Green. 2017, 21, 239–246. [Google Scholar] [CrossRef]
  18. Zeng, W.S. Using nonlinear mixed model and dummy variable model approaches to develop origin-based individual tree biomass equations. Trees 2015, 29, 275–283. [Google Scholar] [CrossRef]
  19. Wang, F.M.; Xu, X.; Zou, B.; Guo, Z.H.; Li, Z.A.; Zhu, W.X. Biomass accumulation and carbon sequestration in four different aged Casuarina equisetifolia coastal shelterbelt plantations in South China. PLoS ONE 2013, 8, e77449. [Google Scholar] [CrossRef]
  20. Lie, G.W.; Xue, L. Biomass allocation patterns in forests growing different climatic zones of China. Trees 2016, 30, 639–646. [Google Scholar] [CrossRef]
  21. Lehtonen, A.; Makipaa, R.; Heikkinen, J.; Sievanen, R.; Liski, J. Biomass expansion factors (BEFs) for Scots pine, Norway spruce and birch according to stand age for boreal forests. For. Ecol. Manag. 2004, 188, 211–224. [Google Scholar] [CrossRef] [Green Version]
  22. Konopka, B.; Patik, J.; Moravcik, M.; Lukac, M. Biomass partitioning and growth efficiency in four naturally regenerated forest tree species. Basic Appl. Ecol. 2010, 11, 234–243. [Google Scholar] [CrossRef]
  23. Mensah, S.; Veldtman, R.; du Toit, B.; Kakai, R.G.; Seifert, T. Aboveground biomass and carbon in a South African mistbelt forest and the relationships with tree species diversity and forest structures. Forests 2016, 7, 79. [Google Scholar] [CrossRef]
  24. Diedhiou, I.; Diallo, D.; Mbengue, A.A.; Hernandez, R.R.; Bayala, R.; Dieme, R.; Diedhiou, P.M.; Sene, A. Allometric equations and carbon stocks in tree biomass of Jatropha curcas L. in Senegal’s Peanut Basin. Glob. Ecol. Conserv. 2017, 9, 61–69. [Google Scholar] [CrossRef]
  25. Moore, J.R. Allometric equations to predict the total above-ground biomass of radiata pine trees. Ann. For. Sci. 2010, 67, 806. [Google Scholar] [CrossRef]
  26. Keller, M.; Palace, M.; Hurtt, G. Biomass estimation in the Tapajos National Forest, Brazil—Examination of sampling and allometric uncertainties. For. Ecol. Manag. 2001, 154, 371–382. [Google Scholar] [CrossRef]
  27. Xiang, W.H.; Liu, S.H.; Deng, X.W.; Shen, A.H.; Lei, X.D.; Tian, D.L.; Zhao, M.F.; Peng, C.H. General allometric equations and biomass allocation of Pinus massoniana trees on a regional scale in southern China. Ecol. Res. 2011, 26, 697–711. [Google Scholar] [CrossRef]
  28. Zianis, D.; Mencuccini, M. On simplifying allometric analyses of forest biomass. For. Ecol. Manag. 2004, 187, 311–332. [Google Scholar] [CrossRef] [Green Version]
  29. Morote, F.A.G.; Serrano, F.R.L.; Andres, M.; Rubio, E.; Jimenez, J.L.G.; de las Heras, J. Allometries, biomass stocks and biomass allocation in the thermophilic Spanish juniper woodlands of Southern Spain. For. Ecol. Manag. 2012, 270, 85–93. [Google Scholar] [CrossRef]
  30. Picard, N.; Rutishauser, E.; Ploton, P.; Ngomanda, A.; Henry, M. Should tree biomass allometry be restricted to power models? For. Ecol. Manag. 2015, 353, 156–163. [Google Scholar] [CrossRef]
  31. Gayon, J. History of the concept of allometry. Am. Zool. 2000, 40, 748–758. [Google Scholar] [CrossRef]
  32. Marquet, P.A.; Quinones, R.A.; Abades, S.; Labra, F.; Tognelli, M.; Arim, M.; Rivadeneira, M. Scaling and power-laws in ecological systems. J. Exp. Biol. 2005, 208, 1749–1769. [Google Scholar] [CrossRef] [PubMed] [Green Version]
  33. Sileshi, G.W. A critical review of forest biomass estimation models, common mistakes and corrective measures. For. Ecol. Manag. 2014, 329, 237–254. [Google Scholar] [CrossRef]
  34. Jara, M.C.; Henry, M.; Rejou-Mechain, M.; Wayson, C.; Zapata-Cuartas, M.; Piotto, D.; Guier, F.A.; Lombis, H.C.; Lopez, E.C.; Lara, R.C.; et al. Guidelines for documenting and reporting tree allometric equations. Ann. For. Sci. 2015, 72, 763–768. [Google Scholar] [CrossRef]
  35. Winjum, J.K.; Brown, S.; Schlamadinger, B. Forest harvests and wood products: Sources and sinks of atmospheric carbon dioxide. For. Sci. 1998, 44, 272–284. [Google Scholar]
  36. Fang, J.Y.; Wang, Z.M. Forest biomass estimation at regional and global levels, with special reference to China’s forest biomass. Ecol. Res. 2001, 16, 587–592. [Google Scholar] [CrossRef]
  37. Tobin, B.; Nieuwenhuis, M. Biomass expansion factors for Sitka spruce (Picea sitchensis (Bong.) Carr.) in Ireland. Eur. J. For. Res. 2007, 126, 189–196. [Google Scholar] [CrossRef]
  38. Zhang, X.; Yao, L.I.; Fang, Y. Geographical distribution and prediction of potential ranges of Quercus acutissima in China. Acta Botanica Boreali-Occidentalia Sinica 2014, 34, 1685–1692. (In Chinese) [Google Scholar]
  39. Son, Y.; Park, I.H.; Yi, M.J.; Jin, H.O.; Kim, D.Y.; Kim, R.H.; Hwang, J.O. Biomass, production and nutrient distribution of a natural oak forest in central Korea. Ecol. Res. 2004, 19, 21–28. [Google Scholar] [CrossRef]
  40. Noh, N.J.; Son, Y.; Kim, R.H.; Seo, K.W.; Koo, J.W.; Park, I.H.; Lee, Y.J.; Lee, K.H.; Son, Y.M. Biomass accumulations and the distribution of nitrogen and phosphorus within three Quercus acutissima stands in Central Korea. J. Plant Biol. 2007, 50, 461–466. [Google Scholar] [CrossRef]
  41. Yuan, Y.F.; Guo, W.H.; Ding, W.J.; Du, N.; Luo, Y.J.; Liu, J.; Xu, F.; Wang, R.Q. Competitive interaction between the exotic plant Rhus typhina L. and the native tree Quercus acutissima Carr. in Northern China under different soil N:P ratios. Plant Soil 2013, 372, 389–400. [Google Scholar] [CrossRef]
  42. Chung, M.Y.; Nason, J.; Chung, M.G.; Kim, K.J.; Park, C.W.; Sun, B.Y.; Pak, J.H. Landscape-level spatial genetic structure in Quercus acutissima (Fagaceae). Am. J. Bot. 2002, 89, 1229–1236. [Google Scholar] [CrossRef] [PubMed]
  43. Zhang, Y.Y.Y.; Fang, Y.M.M.; Yu, M.K.K.; Li, X.X.X.; Xia, T. Molecular characterization and genetic structure of Quercus acutissima germplasm in China using microsatellites. Mol. Biol. Rep. 2013, 40, 4083–4090. [Google Scholar] [CrossRef] [PubMed]
  44. Fang, S.Z.; Liu, Z.L.; Cao, Y.D.; Liu, D.; Yu, M.K.; Tang, L.Z. Sprout development, biomass accumulation and fuelwood characteristics from coppiced plantations of Quercus acutissima. Biomass Bioenergy 2011, 35, 3104–3114. [Google Scholar] [CrossRef]
  45. Wang, B.; Mu-Kui, Y.U.; Sun, H.J.; Cheng, X.R.; Shan, Q.H.; Fang, Y.M. Photosynthetic characters of Quercus acutissima from different provenances under effects of salt stress. Ying Yong Sheng Tai Xue Bao 2009, 20, 1817–1824. (In Chinese) [Google Scholar] [PubMed]
  46. Liao, J.; Fang, Y.M.; Mu-Kui, Y.U. Somatic embryogenesis and plant regeneration from mature embryo explants in Quercus acutissima Carr. Acta Botanica Boreali-Occidentalia Sinica 2012, 32, 398–402. (In Chinese) [Google Scholar]
  47. Cheng, Y.X.; Huo, A.D.; Zhang, J.; Lu, Y.D. Early warning of meteorological geohazard in the Loess Plateau: A study in Huangling County of Shaanxi Province in China. Environ. Earth Sci. 2015, 73, 1057–1065. [Google Scholar] [CrossRef]
  48. Chinese Standard GB/T 33027-2016. In Methodology for Field Long-Term Observation of Forest Ecosystem; Standards Press of China: Beijing, China, 2016.
  49. Ma, C.; Zhang, W.H.; Wu, M.; Xue, Y.Q.; Ma, L.W.; Zhou, J.Y. Effect of aboveground intervention on fine root mass, production, and turnover rate in a Chinese cork oak (Quercus variabilis Blume) forest. Plant Soil 2013, 368, 201–214. [Google Scholar] [CrossRef]
  50. Brassard, B.W.; Chen, H.Y.H.; Bergeron, Y.; Pare, D. Coarse root biomass allometric equations for Abies balsamea, Picea mariana, Pinus banksiana, and Populus tremuloides in the boreal forest of Ontario, Canada. Biomass Bioenergy 2011, 35, 4189–4196. [Google Scholar] [CrossRef]
  51. Zeng, W.; Tang, S. Goodness Evaluation and Precision Analysis of Tree Biomass Equations. Scientia Silvae Sinicae 2011, 47, 106–113. [Google Scholar]
  52. Dahlhausen, J.; Uhl, E.; Heym, M.; Biber, P.; Ventura, M.; Panzacchi, P.; Tonon, G.; Horvath, T.; Pretzsch, H. Stand density sensitive biomass functions for young oak trees at four different European sites. Trees 2017, 31, 1811–1826. [Google Scholar] [CrossRef]
  53. Huang, X.; Chonghua, X.U.; Jun, X.U.; Tao, X.; Xiaoniu, X.U. Structural equation model analysis of the relationship between environmental and stand factors and net primary productivity in Cunninghamia lanceolata forests. Acta Ecol. Sin. 2017, 37. (In Chinese) [Google Scholar]
  54. Helmisaari, H.S.; Makkonen, K.; Kellomaki, S.; Valtonen, E.; Malkonen, E. Below- and above-ground biomass, production and nitrogen use in Scots pine stands in eastern Finland. For. Ecol. Manag. 2002, 165, 317–326. [Google Scholar] [CrossRef]
  55. Mokany, K.; Raison, R.J.; Prokushkin, A.S. Critical analysis of root: Shoot ratios in terrestrial biomes. Glob. Chang. Biol. 2006, 12, 84–96. [Google Scholar] [CrossRef]
  56. Zhang, X.W.; Li, Y.; Liu, C.Y.; Xia, T.; Zhang, Q.; Fang, Y.M. Phylogeography of the temperate tree species Quercus acutissima in China: Inferences from chloroplast DNA variations. Biochem. Syst. Ecol. 2015, 63, 190–197. [Google Scholar] [CrossRef]
  57. Hu, T.; Sorensen, P.; Wahlstrom, E.M.; Chirinda, N.; Sharif, B.; Li, X.X.; Olesen, J.E. Root biomass in cereals, catch crops and weeds can be reliably estimated without considering aboveground biomass. Agric. Ecosyst. Environ. 2018, 251, 141–148. [Google Scholar] [CrossRef] [Green Version]
  58. Kalita, R.M.; Das, A.K.; Nath, A.J. Allometric equations for estimating above- and belowground biomass in Tea (Camellia sinensis (L.) O. Kuntze) agroforestry system of Barak Valley, Assam, northeast India. Biomass Bioenergy 2015, 83, 42–49. [Google Scholar] [CrossRef]
  59. Le Goff, N.; Ottorini, J.M. Root biomass and biomass increment in a beech (Fagus sylvatica L.) stand in North-East France. Ann. For. Sci. 2001, 58, 1–13. [Google Scholar] [CrossRef]
  60. Niklas, K.J.; Enquist, B.J. Canonical rules for plant organ biomass partitioning and annual allocation. Am. J. Bot. 2002, 89, 812–819. [Google Scholar] [CrossRef] [Green Version]
  61. Suchomel, C.; Pyttel, P.; Becker, G.; Bauhus, J. Biomass equations for sessile oak (Quercus petraea (Matt.) Liebl.) and hornbeam (Carpinus betulus L.) in aged coppiced forests in southwest Germany. Biomass Bioenergy 2012, 46, 722–730. [Google Scholar] [CrossRef]
  62. Jenkins, J.C.; Chojnacky, D.C.; Heath, L.S.; Birdsey, R.A. National-scale biomass estimators for United States tree species. For. Sci. 2003, 49, 12–35. [Google Scholar]
  63. Cienciala, E.; Cerny, M.; Tatarinov, F.; Apltauer, J.; Exnerova, Z. Biomass functions applicable to Scots pine. Trees 2006, 20, 483–495. [Google Scholar] [CrossRef]
  64. Kauppi, P.E.; Tomppo, E.; Ferm, A. C and N storage in living trees within Finland since 1950s. Plant Soil 1995, 168, 633–638. [Google Scholar] [CrossRef] [Green Version]
  65. Wang, B.; Gao, P.; Niu, X.; Sun, J.N. Policy-driven China’s Grain to Green Program: Implications for ecosystem services. Ecosyst. Serv. 2017, 27, 38–47. [Google Scholar] [CrossRef]
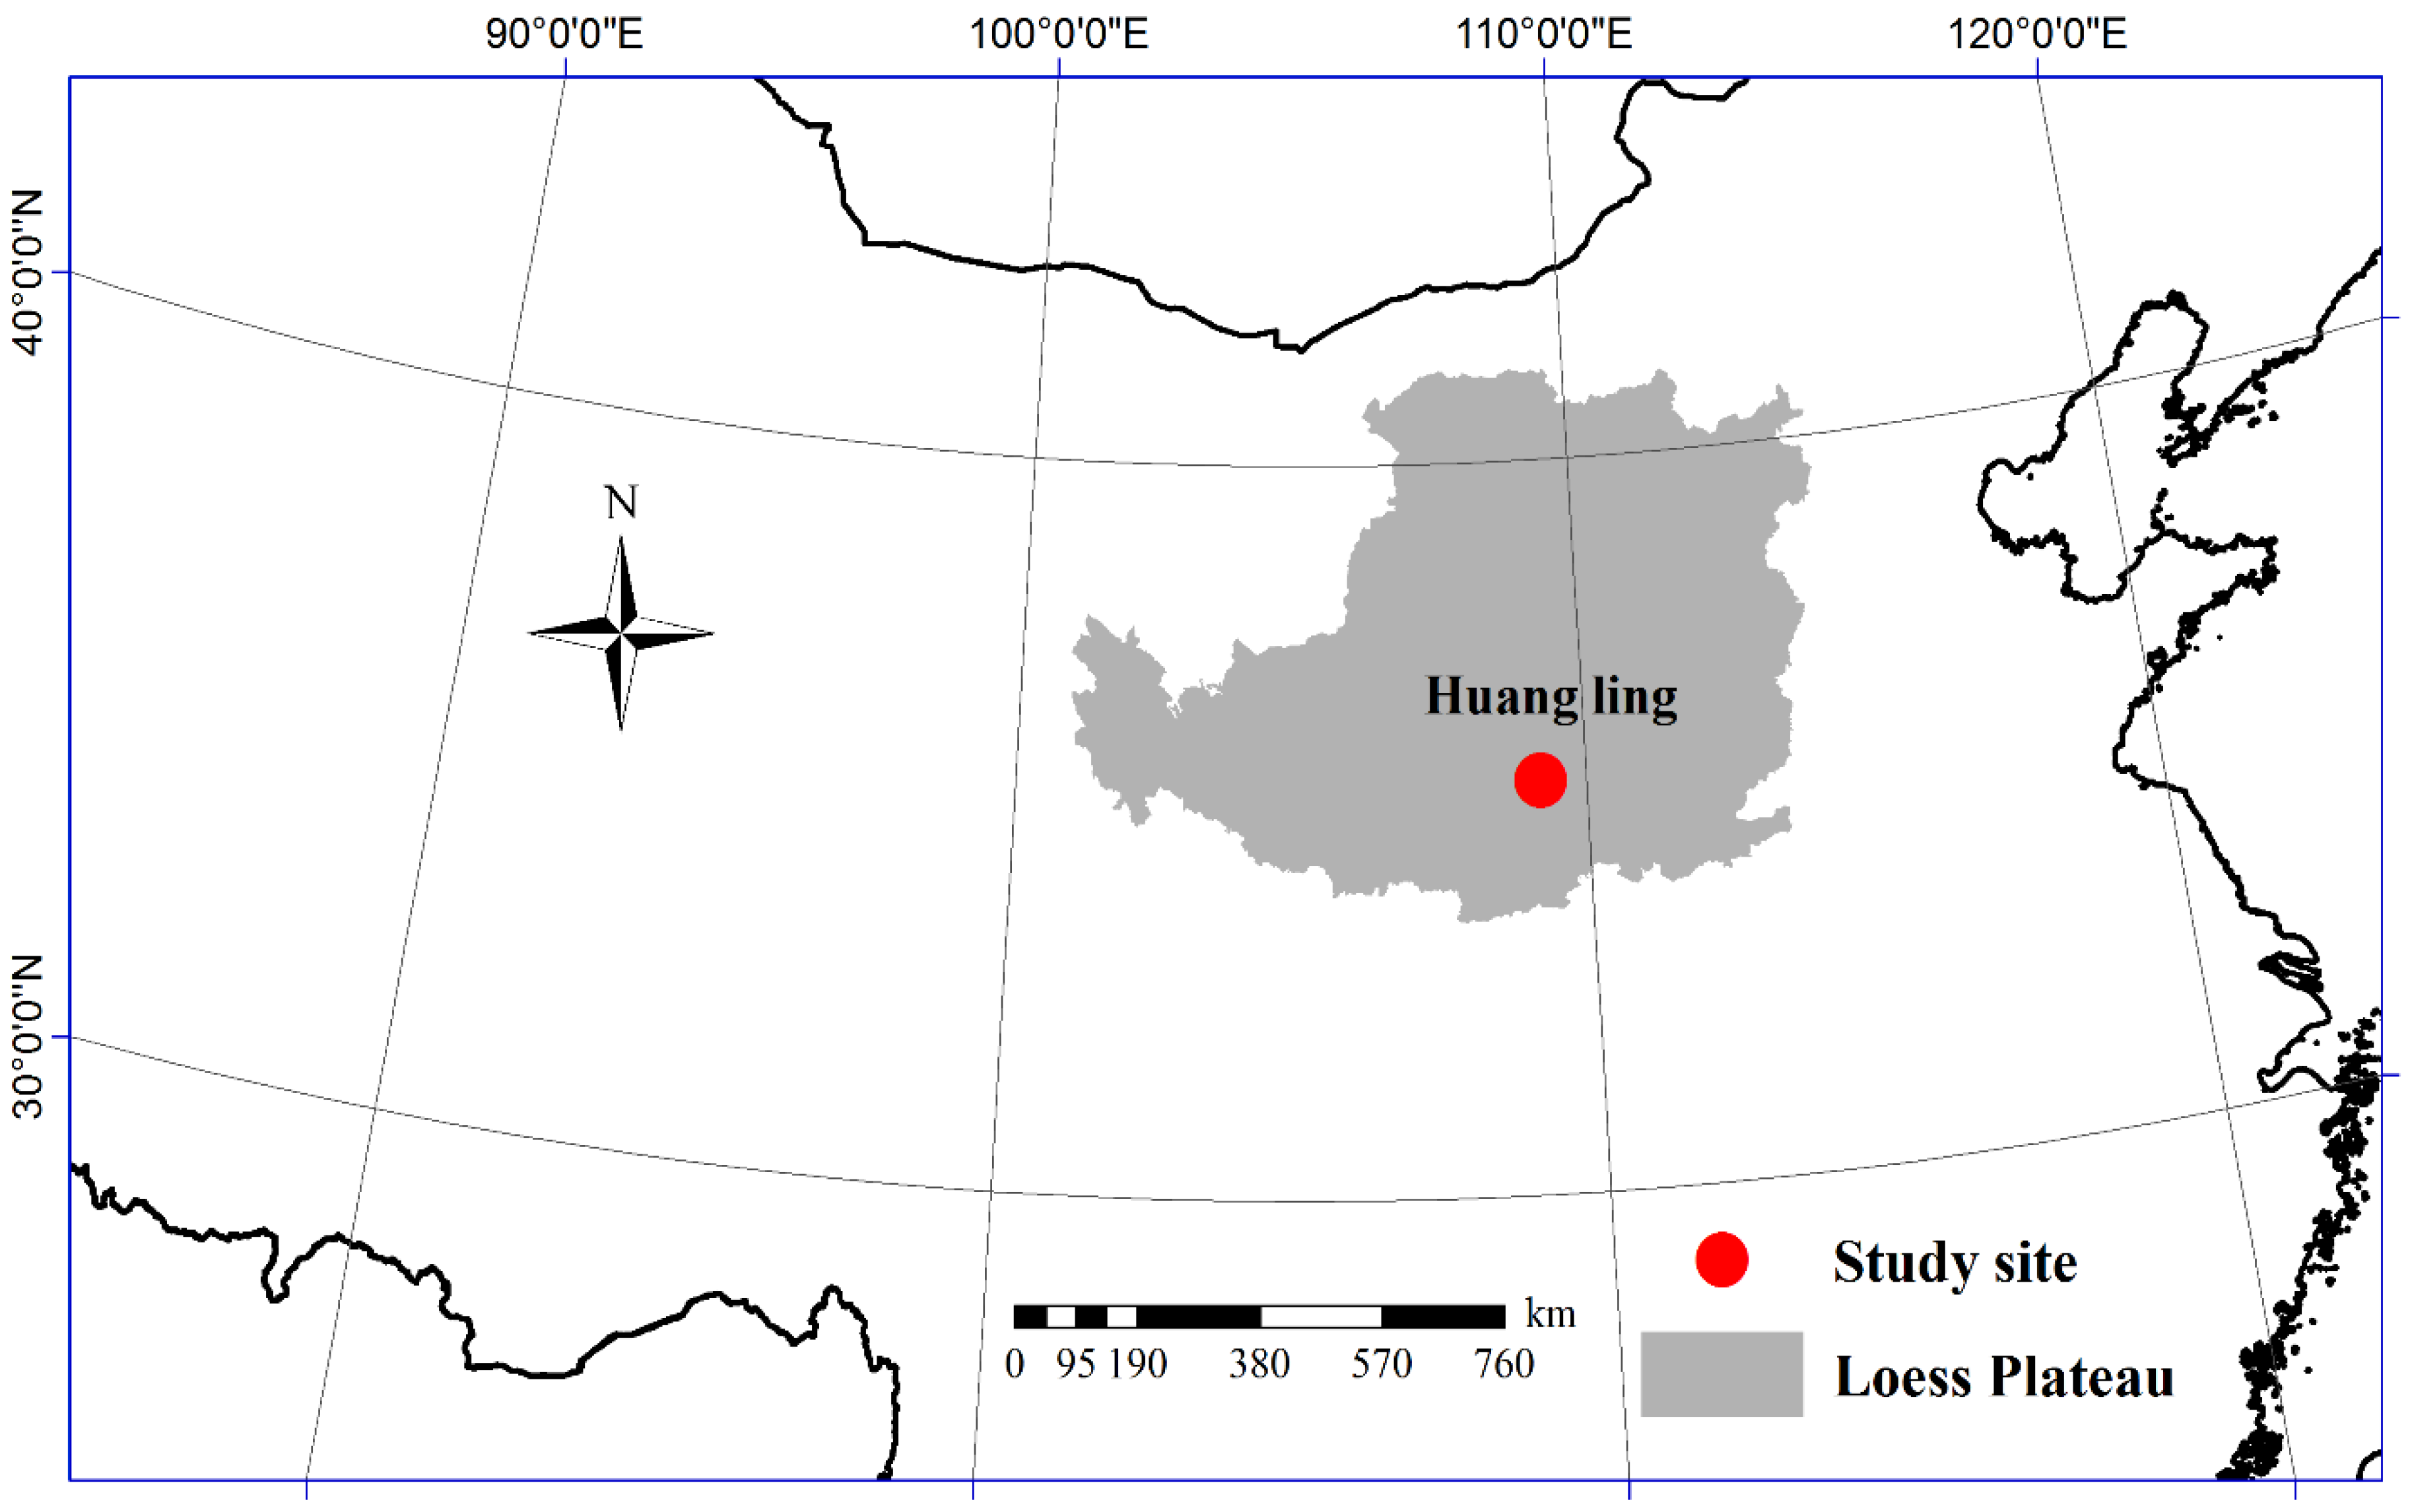
Figure 1. Diagrammatic representation of the study site.
Forests 10 00041 g001
Figure 2. Biomass partitioning of different components in the 14-, 31-, 46-, and 63-year-old Q. acutissima stands.
Forests 10 00041 g002
Figure 3. Root-to-shoot biomass ratios of harvested trees in the 14-, 31-, 46-, and 63-year-old Q. acutissima stands.
Forests 10 00041 g003
Figure 4. Relationship between aboveground and belowground biomass of Q. acutissima.
Forests 10 00041 g004
Figure 5. Distribution of residual errors of biomass model in the 14-, 31-, 46-, and 63-year-old Q. acutissima stands. The box plots display the whiskers, percentiles, and mean of the predicted biomass errors for each tree component.
Forests 10 00041 g005
Figure 6. Distribution of residual errors of the biomass model across the four Q. acutissima stands. The box plots display the whiskers, percentiles, and mean of the predicted biomass errors for each of the tree components, as well as outliers.
Forests 10 00041 g006
Figure 7. Relationships between DBH and branch (a), foliage (b), belowground (c), stem (with bark), (d), aboveground (e), and total tree (f) biomass in the 14-, 31-, 46-, and 63-year-old Q. acutissima stands.
Forests 10 00041 g007
Figure 8. Distribution of residual errors of BCEFs model of Q. acutissima. The box plots display the whiskers, percentiles, and the mean of the predicted BCEFs errors for each tree component as well as outliers.
Forests 10 00041 g008
Table 1. Partitioning of aboveground and belowground biomass among tree components in the 14-, 31-, 46-, and 63-year-old Q. acutissima stands (mean ± S.D., n = 5 per stand).
Tree ComponentBiomass (kg/tree)
14 Years Old31 Years Old46 Years Old63 Years Old
Stem wood9.33 ± 5.5537.42 ± 17.96152.71 ± 38.06275.86 ± 41.85
Stem bark1.85 ± 1.099.92 ± 4.4842.48 ± 12.3577.32 ± 13.32
Branches8.70 ± 5.3228.30 ± 13.5487.23 ± 24.31122.68 ± 20.25
Foliage0.90 ± 0.522.39 ± 1.167.38 ± 1.859.06 ± 1.65
Aboveground20.78 ± 12.4878.02 ± 37.05289.80 ± 76.02484.91 ± 75.85
Taproot2.49 ± 1.4111.00 ± 5.7941.49 ± 11.2662.24 ± 17.40
Large roots (≥2 cm)1.79 ± 1.046.06 ± 2.8717.39 ± 3.8221.59 ± 5.60
Coarse roots (0.5–2 cm)2.34 ± 1.337.63 ± 3.4721.43 ± 3.9422.83 ± 2.92
Small roots (0.2–0.5 cm)0.82 ± 0.472.52 ± 1.146.09 ± 1.007.02 ± 1.44
Fine roots (<0.2 cm)0.55 ± 0.321.58 ± 0.764.43 ± 0.684.77 ± 0.88
Belowground7.99 ± 4.5728.79 ± 14.0490.83 ± 20.54118.46 ± 28.00
Total tree28.76 ± 17.05106.81 ± 51.07380.63 ± 96.50603.38 ± 102.68
Table 2. Biomass equations with DBH as a single explanatory variable or with tree height (H) as a second explanatory variable for each component of the sampled trees in the 14-, 31-, 46-, and 63-year-old Q. acutissima stands.
Tree ComponentVariable (s)Adj. R2S.E.EcaS.E. (a)bS.E. (b)Significance (p)MPE (%)TRE (%)
14 years
Stem woodDBH0.92771.49310.05042.62590.4148 0.00553.152.46
DBH + H0.89151.82860.04942.56453.75630.08225.03620.00423.542.63
Stem barkDBH0.94040.26680.01132.56820.3698 0.00412.972.73
DBH + H0.91060.32680.01142.59563.3196−0.03674.44450.04473.483.78
BranchDBH0.93721.33330.04452.65550.3970 0.00444.451.91
DBH + H0.90641.62750.05143.07793.5687−0.56584.75430.04684.802.89
FoliageDBH0.93500.13380.00602.52660.3782 0.00462.521.66
DBH + H0.90250.16380.00592.47253.38180.07264.53230.04873.962.47
AbovegroundDBH0.93553.16840.11192.62890.3944 0.00463.543.16
DBH + H0.90343.87880.11792.78283.5590−0.20604.75800.04834.804.15
BelowgroundDBH0.92111.28420.05892.47590.4065 0.00621.202.9
DBH + H0.88251.56710.06852.92553.5716−0.60144.75300.00872.042.98
Total treeDBH0.93194.45000.16912.58620.3976 0.00501.943.1
DBH + H0.89805.44440.18342.82553.5615−0.32044.75500.00514.883.12
31 years
Stem woodDBH0.91675.18170.09152.39400.4229 0.00681.883.64
DBH + H0.98552.16530.06751.04050.40391.76230.47760.00731.522.23
Stem barkDBH0.88421.52300.04752.13150.4483 0.01124.382.25
DBH + H0.92831.19820.03370.92090.82971.60901.00150.03583.12−2.12
BranchDBH0.89994.28220.06862.39670.4631 0.00892.833.82
DBH + H0.96212.63600.05081.02870.65171.77770.77080.01902.402.43
FoliageDBH0.89730.37320.00502.45390.4832 0.00932.803.79
DBH + H0.95800.23880.00381.05480.70231.80830.82710.02102.48−3.78
AbovegroundDBH0.910711.07310.20762.36070.4312 0.00751.804.68
DBH + H0.97675.65910.15231.01900.50571.75070.59960.01171.644.28
BelowgroundDBH0.89364.57960.05812.46800.4930 0.00983.662.95
DBH + H0.95413.00810.04381.05600.73491.82230.86470.02302.642.5
Total treeDBH0.906715.60040.26442.38870.4461 0.00802.583.77
DBH + H0.97168.59940.19521.02810.56261.77030.66570.01422.083.38
46 years
Stem woodDBH0.96337.28821.96301.42080.1438 0.00201.44−1.11
DBH + H0.96217.40661.85121.19970.27720.28840.30670.01891.88−2.34
Stem barkDBH0.93173.22610.29091.62520.2314 0.00502.32−3.79
DBH + H0.92363.41210.27261.30570.46360.40920.50410.03822.88−3.95
BranchDBH0.96944.25220.60561.62030.1487 0.00151.522.35
DBH + H0.98013.42540.56631.31490.22670.39300.24660.00991.04−1.39
FoliageDBH0.97110.31450.09161.43210.1284 0.00141.283.79
DBH + H0.97400.29850.08641.20850.23120.29140.25560.01301.04−2.84
AbovegroundDBH0.978711.10102.82701.51030.1160 0.00091.20−3.53
DBH + H0.98957.77342.65331.24910.15400.33840.16910.00520.72−2.35
BelowgroundDBH0.97723.10311.74441.29040.1022 0.00101.04−2.34
DBH + H0.97593.19061.66561.13680.19940.20250.22310.01211.88−3.7
Total treeDBH0.979413.84164.37241.45730.1098 0.00081.12−3.4
DBH + H0.988010.58714.11531.22150.15920.30680.17560.00600.722.15
63 years
Stem woodDBH0.829017.30427.71151.06210.2330 0.02031.924.23
DBH + H0.937710.44836.56650.88650.15850.27190.11180.03120.963.93
Stem barkDBH0.81695.69841.33251.20530.2744 0.02262.242.66
DBH + H0.73816.81571.27391.15570.36680.07680.24850.03092.242.75
BranchDBH0.93605.12412.18271.19600.1555 0.00451.282.47
DBH + H0.90766.15522.23381.22120.2076−0.03910.13880.04621.282.49
FoliageDBH Not significant
DBH + H Not significant
AbovegroundDBH0.889825.176611.08501.12170.1930 0.01031.603.66
DBH + H0.901723.784610.07291.01690.20430.16230.14130.04921.282.14
BelowgroundDBH0.870010.09460.40631.68270.3208 0.01332.642.9
DBH + H0.841211.15740.43371.80140.3974−0.16850.24630.07942.943.21
Total treeDBH0.911930.47019.51131.23180.1881 0.00741.522.66
DBH + H0.887634.42139.02471.16980.23780.09450.1610.00621.843.22
Equation form is B i = c · x 1 a or B i = c · x 1 a · x 2 b . Bi represents tree component biomass. x1 represents DBH. x2 represents H. c is a scale parameter. a and b are equation parameters. S.E. is a standard error. S.E.E. is the standard error of estimation and n = 5 trees per stand. MPE is the mean prediction error and TRE is the total relative error.
Table 3. Biomass equations with stand age (A) as a second explanatory variable for the different tree components across the four stands.
Tree ComponentVariable (s)Adj. R2S.E.E.caS.E. (a)bS.E. (b)Significance (p)MPE (%)TRE (%)
Stem woodDBH0.969919.34450.48871.86720.1182 <0.00013.151.86
DBH + A0.986512.93810.11181.27950.13970.84640.1766<0.00012.9−0.62
Stem barkDBH0.97205.31960.10811.93900.1195 <0.00014.11−2.8
DBH + A0.98384.04300.02971.42520.15750.74050.1984<0.00012.52−1.24
BranchDBH0.97497.82680.74521.52080.0830 <0.00012.6−2.44
FoliageDBH0.94240.88790.09651.36370.1115 <0.00012.55−2.41
AbovegroundDBH0.978128.96401.22821.76690.0937 <0.00013.652.34
DBH + A0.985623.49590.49081.37140.13990.55110.1717<0.00011.95−1.86
BelowgroundDBH0.96009.82740.77731.50590.1041 <0.00012.451.24
Total treeDBH0.980933.73101.88271.70940.0838 <0.00013.05−2.48
DBH + A0.984130.74971.03491.43610.14400.37220.1734<0.00012.1−1.24
Equation form is B i = c · x 1 a or B i = c · x 1 a · x 2 b . Bi represents tree component biomass. x1 represents DBH. x2 represents A. c is a scale parameter. a and b are the equation parameters. S.E. is the standard error. S.E.E. is the standard error of estimation and n = 20 per component.
Table 4. BCEFs of various tree components in the 14-, 31-, 46-, and 63-year-old Q. acutissima stands (mean ± S.D., n = 5 per stand).
Tree ComponentBCEFs (tons m−3)
14 Years Old31 Years Old46 Years Old63 Years Old
Stem (with bark)0.5182 ± 0.01510.4371 ± 0.02900.4048 ± 0.01580.4000 ± 0.0193
Branch0.3988 ± 0.01900.2624 ± 0.02690.1807 ± 0.01390.1386 ± 0.0038
Foliage0.0418 ± 0.00140.0220 ± 0.00240.0153 ± 0.00060.0102 ± 0.0007
Aboveground0.9589 ± 0.02730.7216 ± 0.05760.6008 ± 0.02670.5488 ± 0.0212
Belowground0.3733 ± 0.02230.2667 ± 0.03050.1896 ± 0.00770.1326 ± 0.0092
Total tree1.3322 ± 0.04890.9882 ± 0.08770.7904 ± 0.03180.6815 ± 0.0159
Table 5. Age-sensitive BCEFs equations for tree components across four Q. acutissima stands.
Tree ComponentEquation FormcS.E. (c)aS.E. (a)Adj. R2S.E.E.Significance (p)MPE (%)TRE (%)
Stem (with bark)Power0.83770.0523−0.18490.01810.83750.0210<0.010.32−0.12
BranchPower2.26270.2386−0.65250.03380.95480.0219<0.010.280.33
FoliagePower0.41190.0348−0.86490.02820.98350.0016<0.010.430.25
AbovegroundPower2.60060.1591−0.37740.01850.95480.0352<0.010.18−0.11
BelowgroundPower1.82660.2460−0.59310.04260.91570.0274<0.010.110.15
Total treePower4.23010.2993−0.43460.02160.95430.0553<0.010.15−0.35
Equation form is B C E F   s i = c · x a , i represents the biomass component, x represents the stand age (years), a and c are the equation parameters, S.E. is the standard error, S.E.E. is the standard error of estimation, and n = 20 per component.