2.3. Algorithms for Orthorectification
In this section, several algorithms that are present in the software most commonly used for image orthorectification are described.
According to Toutin [
2], whatever the mathematical functions used, the geometric correction method and processing steps are: acquisition of image; acquisition of the GCPs and check points (CPs) with image coordinates and map coordinates X, Y,
Z; computation of the unknown parameters of the mathematical functions used for the geometric correction model; and image rectification with or without digital elevation model (DEM).
The two-dimensional (2D) polynomial model has been adopted for image rectification since the 1970s [
35]. It relates images coordinates (X’, Y’) to cartographic coordinates (X, Y) by the following equations:
If n is the order of the equation, the following relations are valid:
The 2D polynomial function model of the first order (6 parameters) corrects the image by a rotation, a translation in x and y, scaling along both axes and an obliquitous transformation. The 2D first-order polynomial function is also called affine transformation. The 2D polynomial function model of second order (12 parameters) adds to the previous transformation’s correction of the torsion and convexity along both axes. A cubic polynomial function (20 parameters) further increases the correction flexibility, in a way that does not necessarily correspond to any physical reality of the image acquisition system [
36].
By substituting the coordinate values of GCPs in Equation (1), polynomial coefficients (
alij and
blij) can be calculated. Consequently, the new location of each pixel in the cartographic plane can be defined. The minimum number of GCPs needed is established by the order
n of the polynomial functions according to the formula [
37]:
To increase the positional accuracy of the resulting image, a greater number of GCPs is chosen, which are distributed regularly. Thus differences between map coordinates and corrected image coordinates for the same features tend to be reduced. To evaluate the quality of the results, errors not only for GCPs but also for other points, named check points (CPs), are considered [
2,
38].
Using polynomial functions is a very uncomplicated method to orthorectify VHRSI: often considered outdated, they correct for basic planimetric distortion at the GCPs; because they do not take ground elevation into consideration, they are limited to small and flat areas [
39].
3D rational polynomial functions (RPFs) may be more useful. They define a relationship between the image coordinates (x’, y’) and the 3D object coordinates (X, Y, Z) [
23,
40].
Specifically:
where
are usually cubic polynomials. Each of these includes 20 coefficients and can be expressed as:
where:
Equations in (4) are known in the literature as
Upward RFM, as they enable the image coordinates to be obtained starting from the 3D coordinates of a ground point [
41].
Substituting
P in (4) with the polynomials in (5) and eliminating the first coefficient in the denominator, there are 39 RPF coefficients in each equation: 20 coefficients in the numerator and 19 (and the constant 1) in the denominator [
42]. In order to solve the 78 coefficients, at least 39 GCPs are required [
43].
The 78 coefficients are calculated by the data provider considering the position of the satellite at the time of image acquisition. They are then included in the RPC (rational polynomial coefficient) file.
However, they can also be calculated using GCPs [
43], as in the case above for polynomial functions (PFs). At least 39 of them are needed. In fact, if the camera model is not available, the ground control points need to be selected in a conventional way; that is, through collimation of the homologous points on the cartography or DEM (digital elevation model) or through specific GPS (Global Positioning System) survey campaigns [
44]. Usually the Equations in (4) are resolved using a least squares iterative process, on the basis of the measurement of a large number of GCPs.
The accuracy of the results depends on the number and the distribution of GCPs. Several GCPs (more than 39) with a regular planimetric and altimetric distribution contribute to the high quality of the results [
17,
45,
46]. A DEM of the whole area is also required for RPFs.
By applying PFs as well as RPFs to the primary image, a matrix of “empty” cells is computed. To calculate the radiometric value to be assigned to each pixel, a resampling method, such as nearest neighbor, bilinear interpolation, or cubic convolution, is used [
47,
48]. The nearest-neighbor algorithm is used for this application because it preserves the original radiometric values, which is fundamental for further image processes (calculation of vegetation indexes, classifications, etc.).
Several algorithms are described in the literature for VHRSI orthorectification using rigorous physical models. Based on the collinearity equations, they reconstruct the geometry of the scene during the image acquisition through the knowledge of parameters concerning both the platform and the sensor.
The traditional photogrammetric method of transforming from object space to image space using collinearity equations is highly suited to frame cameras, but not to pushbroom sensor products [
23]. In fact, unlike the traditional frame-based aerial photos, each line of the linear array image is collected in a pushbroom fashion at a different instant of time; therefore, the perspective geometry is only valid for each line whereas it is close to a parallel projection in along-track direction; in addition, for each line, there is a different set of (time-dependent) values for the exterior orientation elements [
49]. For 1-meter GSD pushbroom sensors such as IKONOS, fully parametrized camera models are extremely complex and difficult to implement; this is highlighted in the IKONOS System Geometric and Mathematical Model document that consists of 183 pages [
50].
OrthoEngine—PCI geomatics software (PCI, 2016) supplies Toutin’s rigorous model [
51,
52]. Originally developed for SPOT, the model was also later extended for Landsat and satellites with synchronous imaging acquisition i.e., IKONOS II, QuickBird [
53], WV-2, Komposat-2, and OrbView [
54].
Other examples of rigorous models are mentioned in the literature, i.e., the model implemented in SISAR, which is a software for high-resolution satellite images at the Area di Geodesia e Geomatica—Sapienza Università di Roma. The approximate values of the physical parameters can be computed thanks to the information contained in the metadata file provided with each image and corrected by a least squares estimation process based on an appropriate number of GCPs [
55].
In this work orthorectification processes were carried out on the WV-2 panchromatic image using PCI Geomatica OrthoEngine Version 2015. The following algorithms were applied:
2D PFs;
3D RPFs with original RPCs;
3D RPFs without original RPCs;
Toutin’s rigorous model;
A combination of 3D RPFs and 2D PFs.
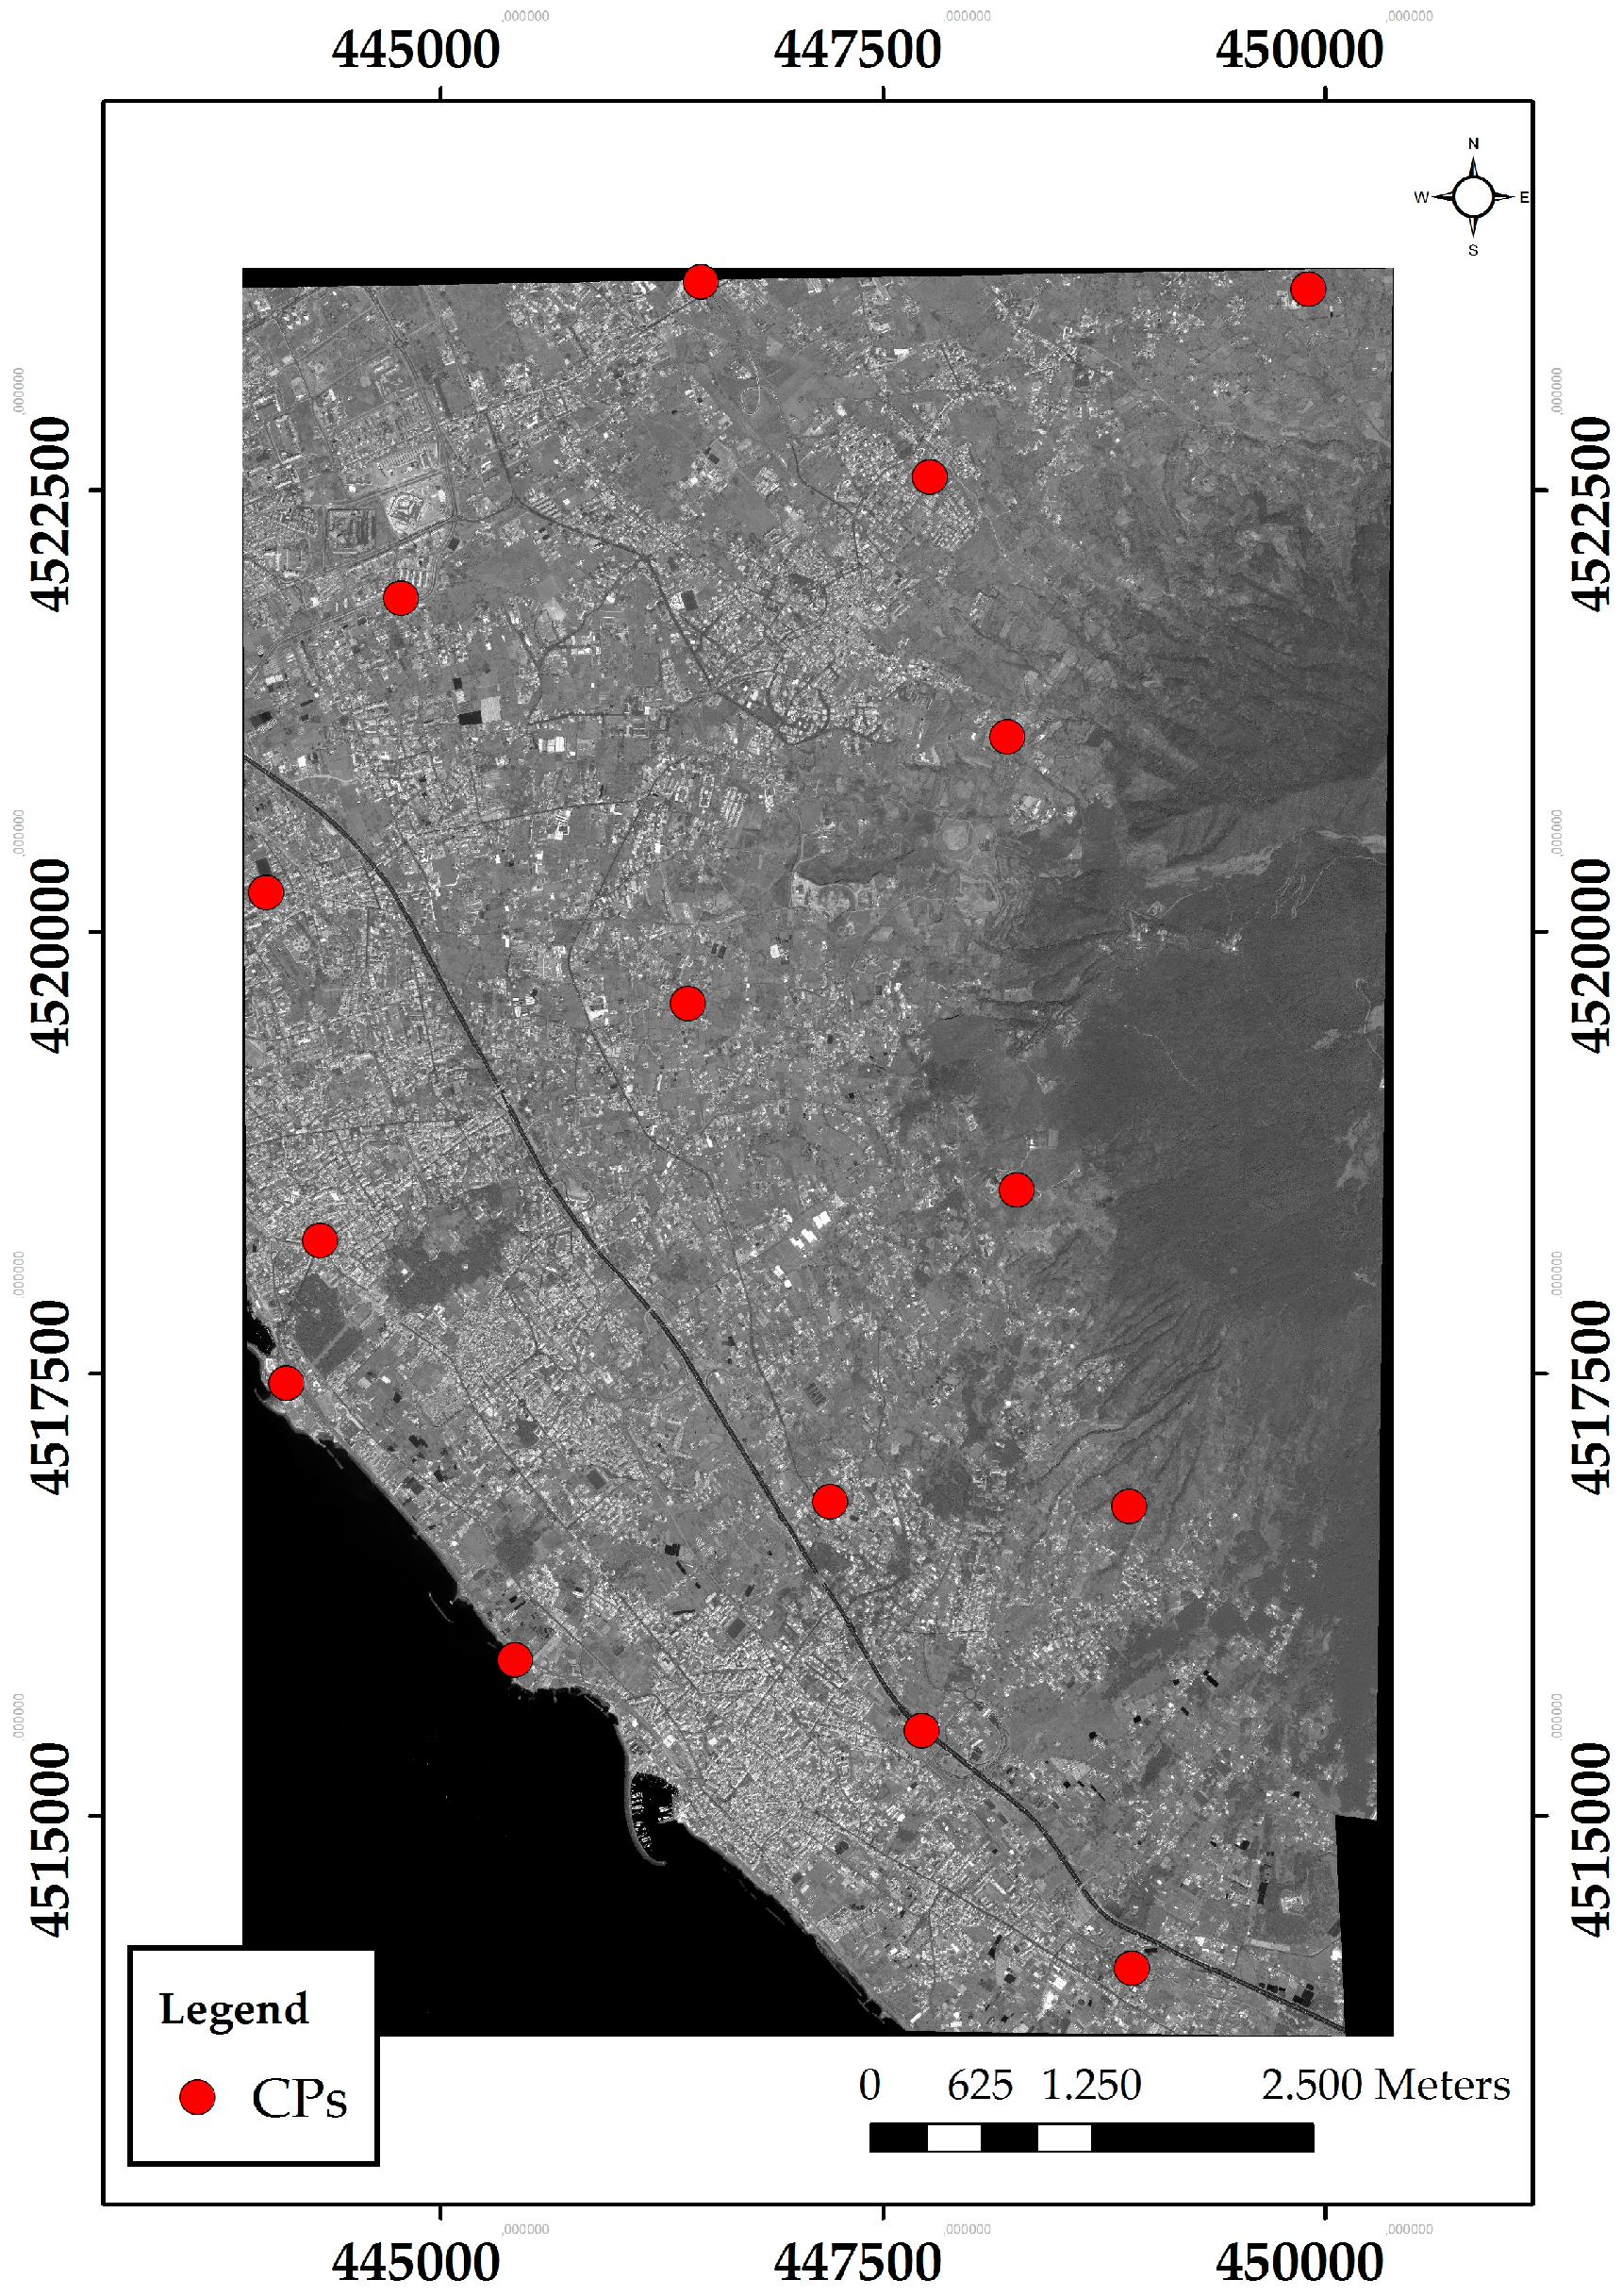
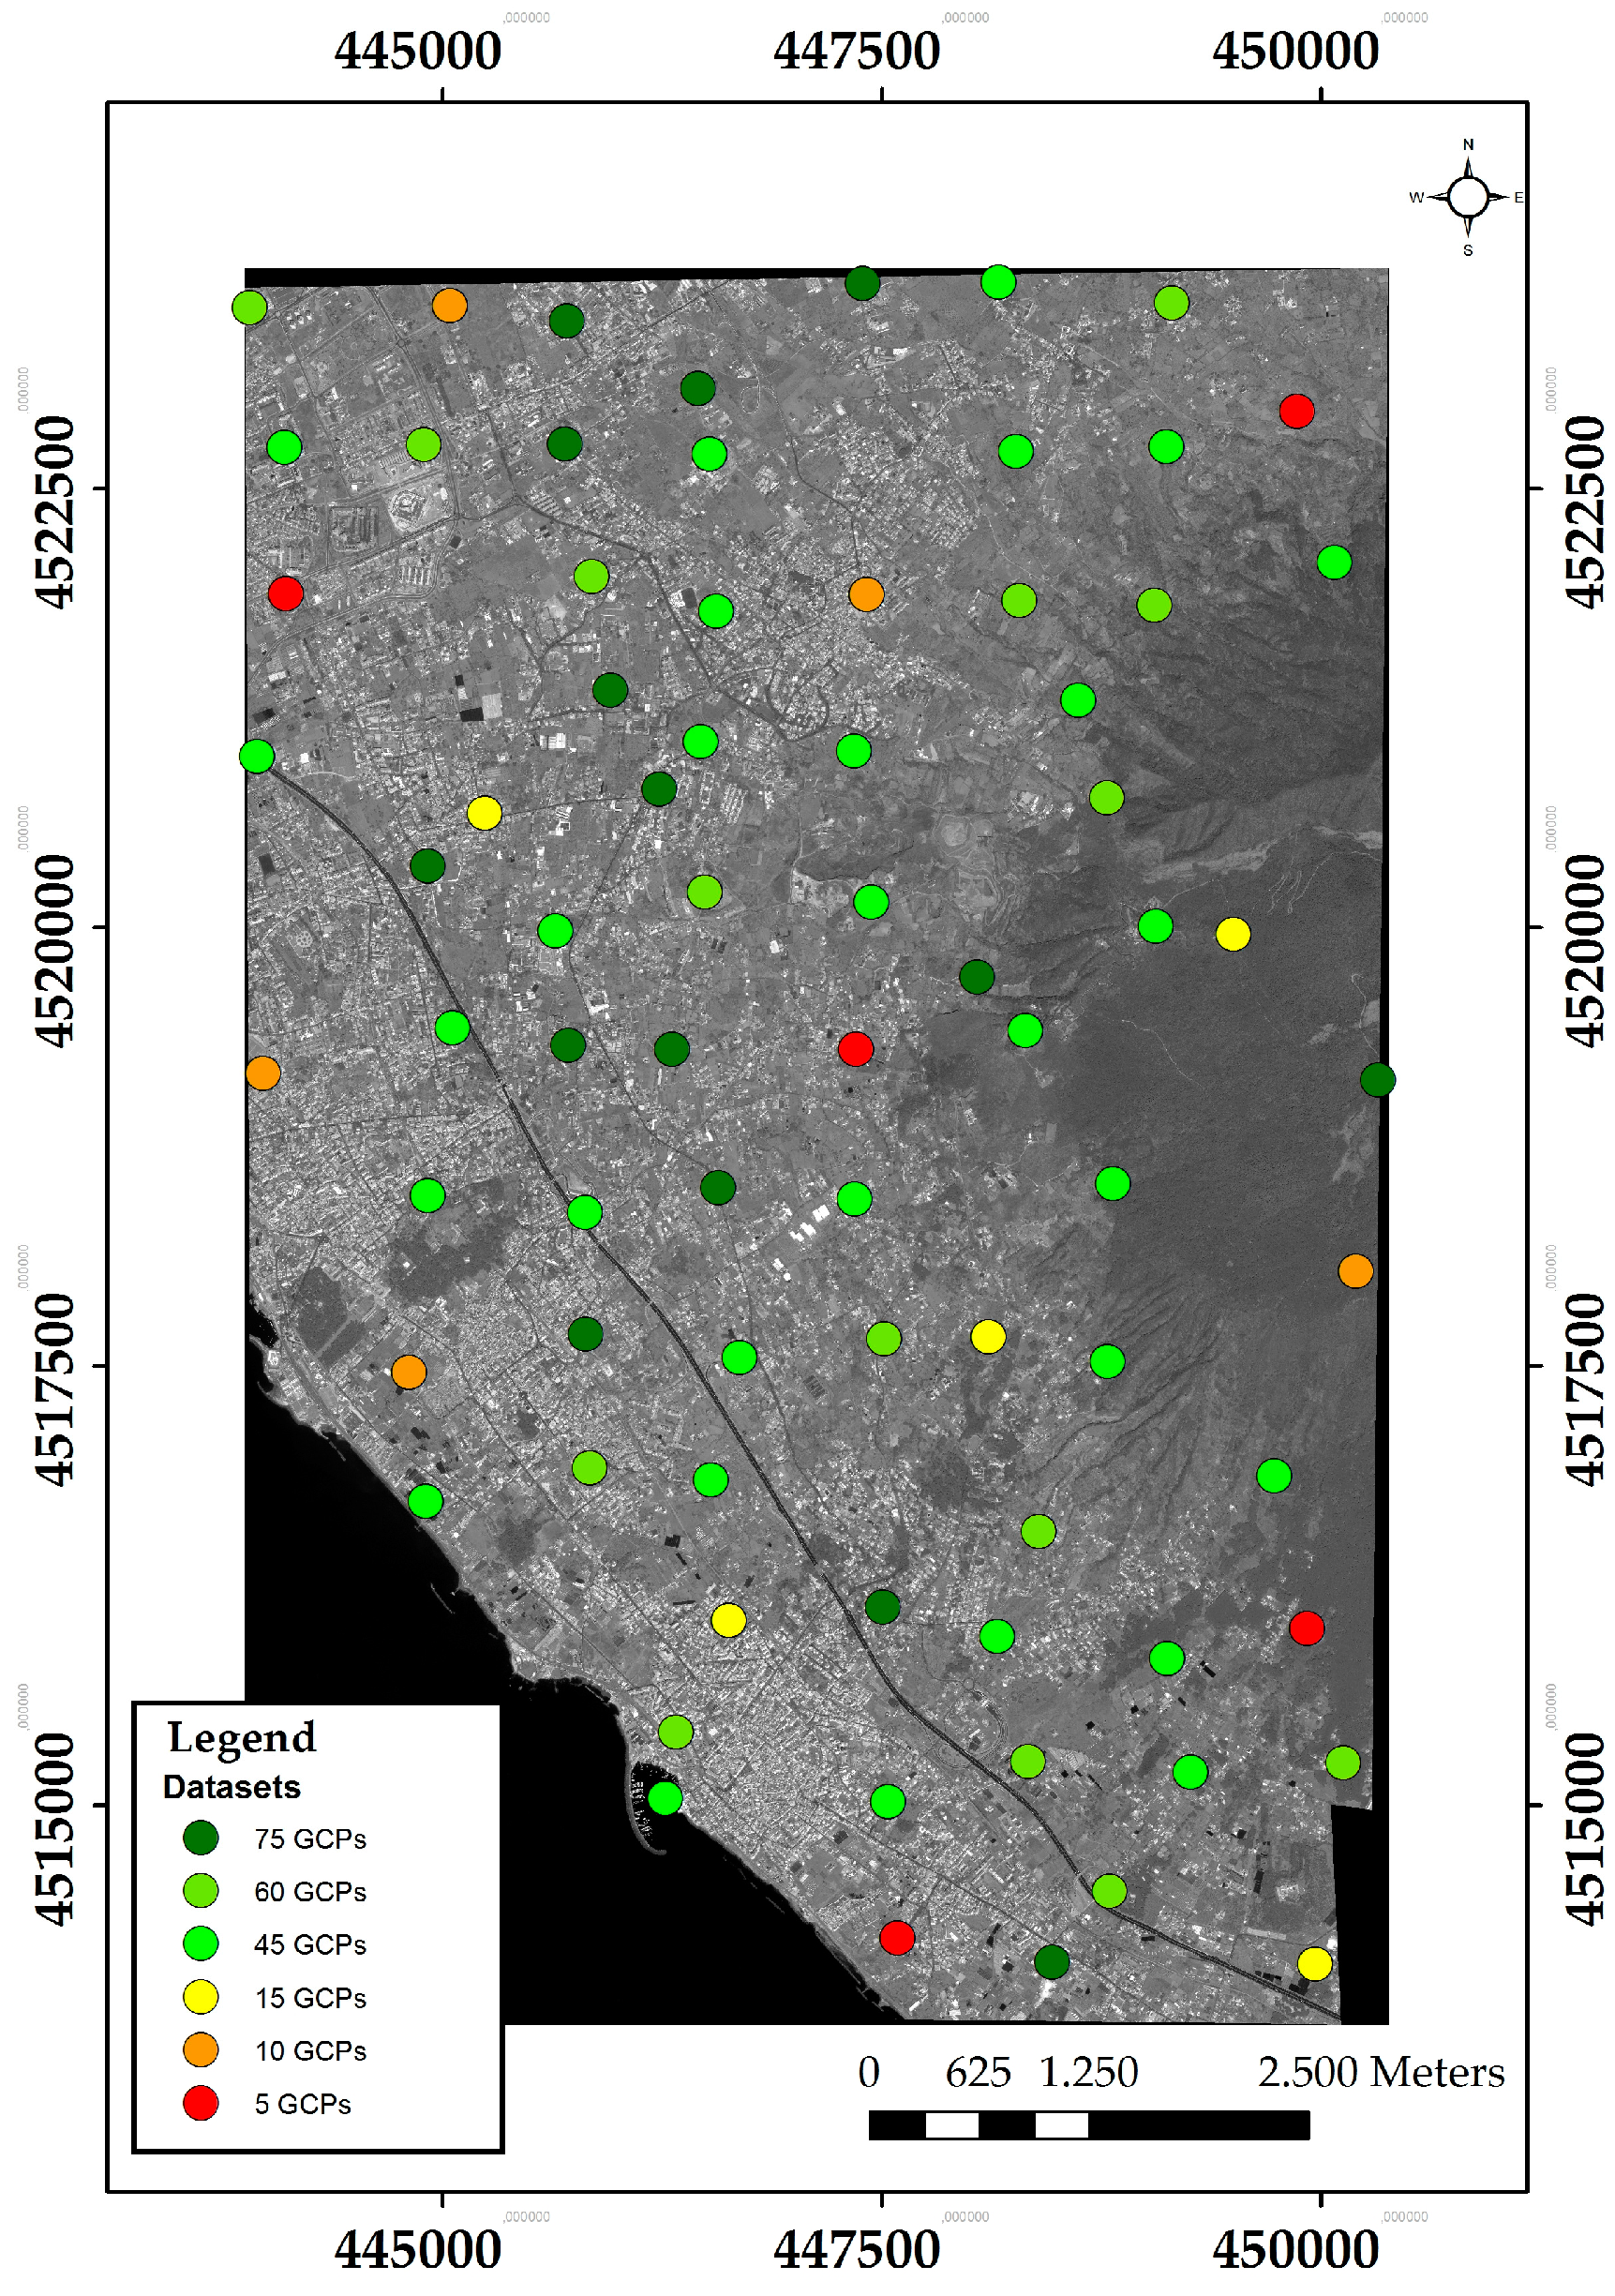
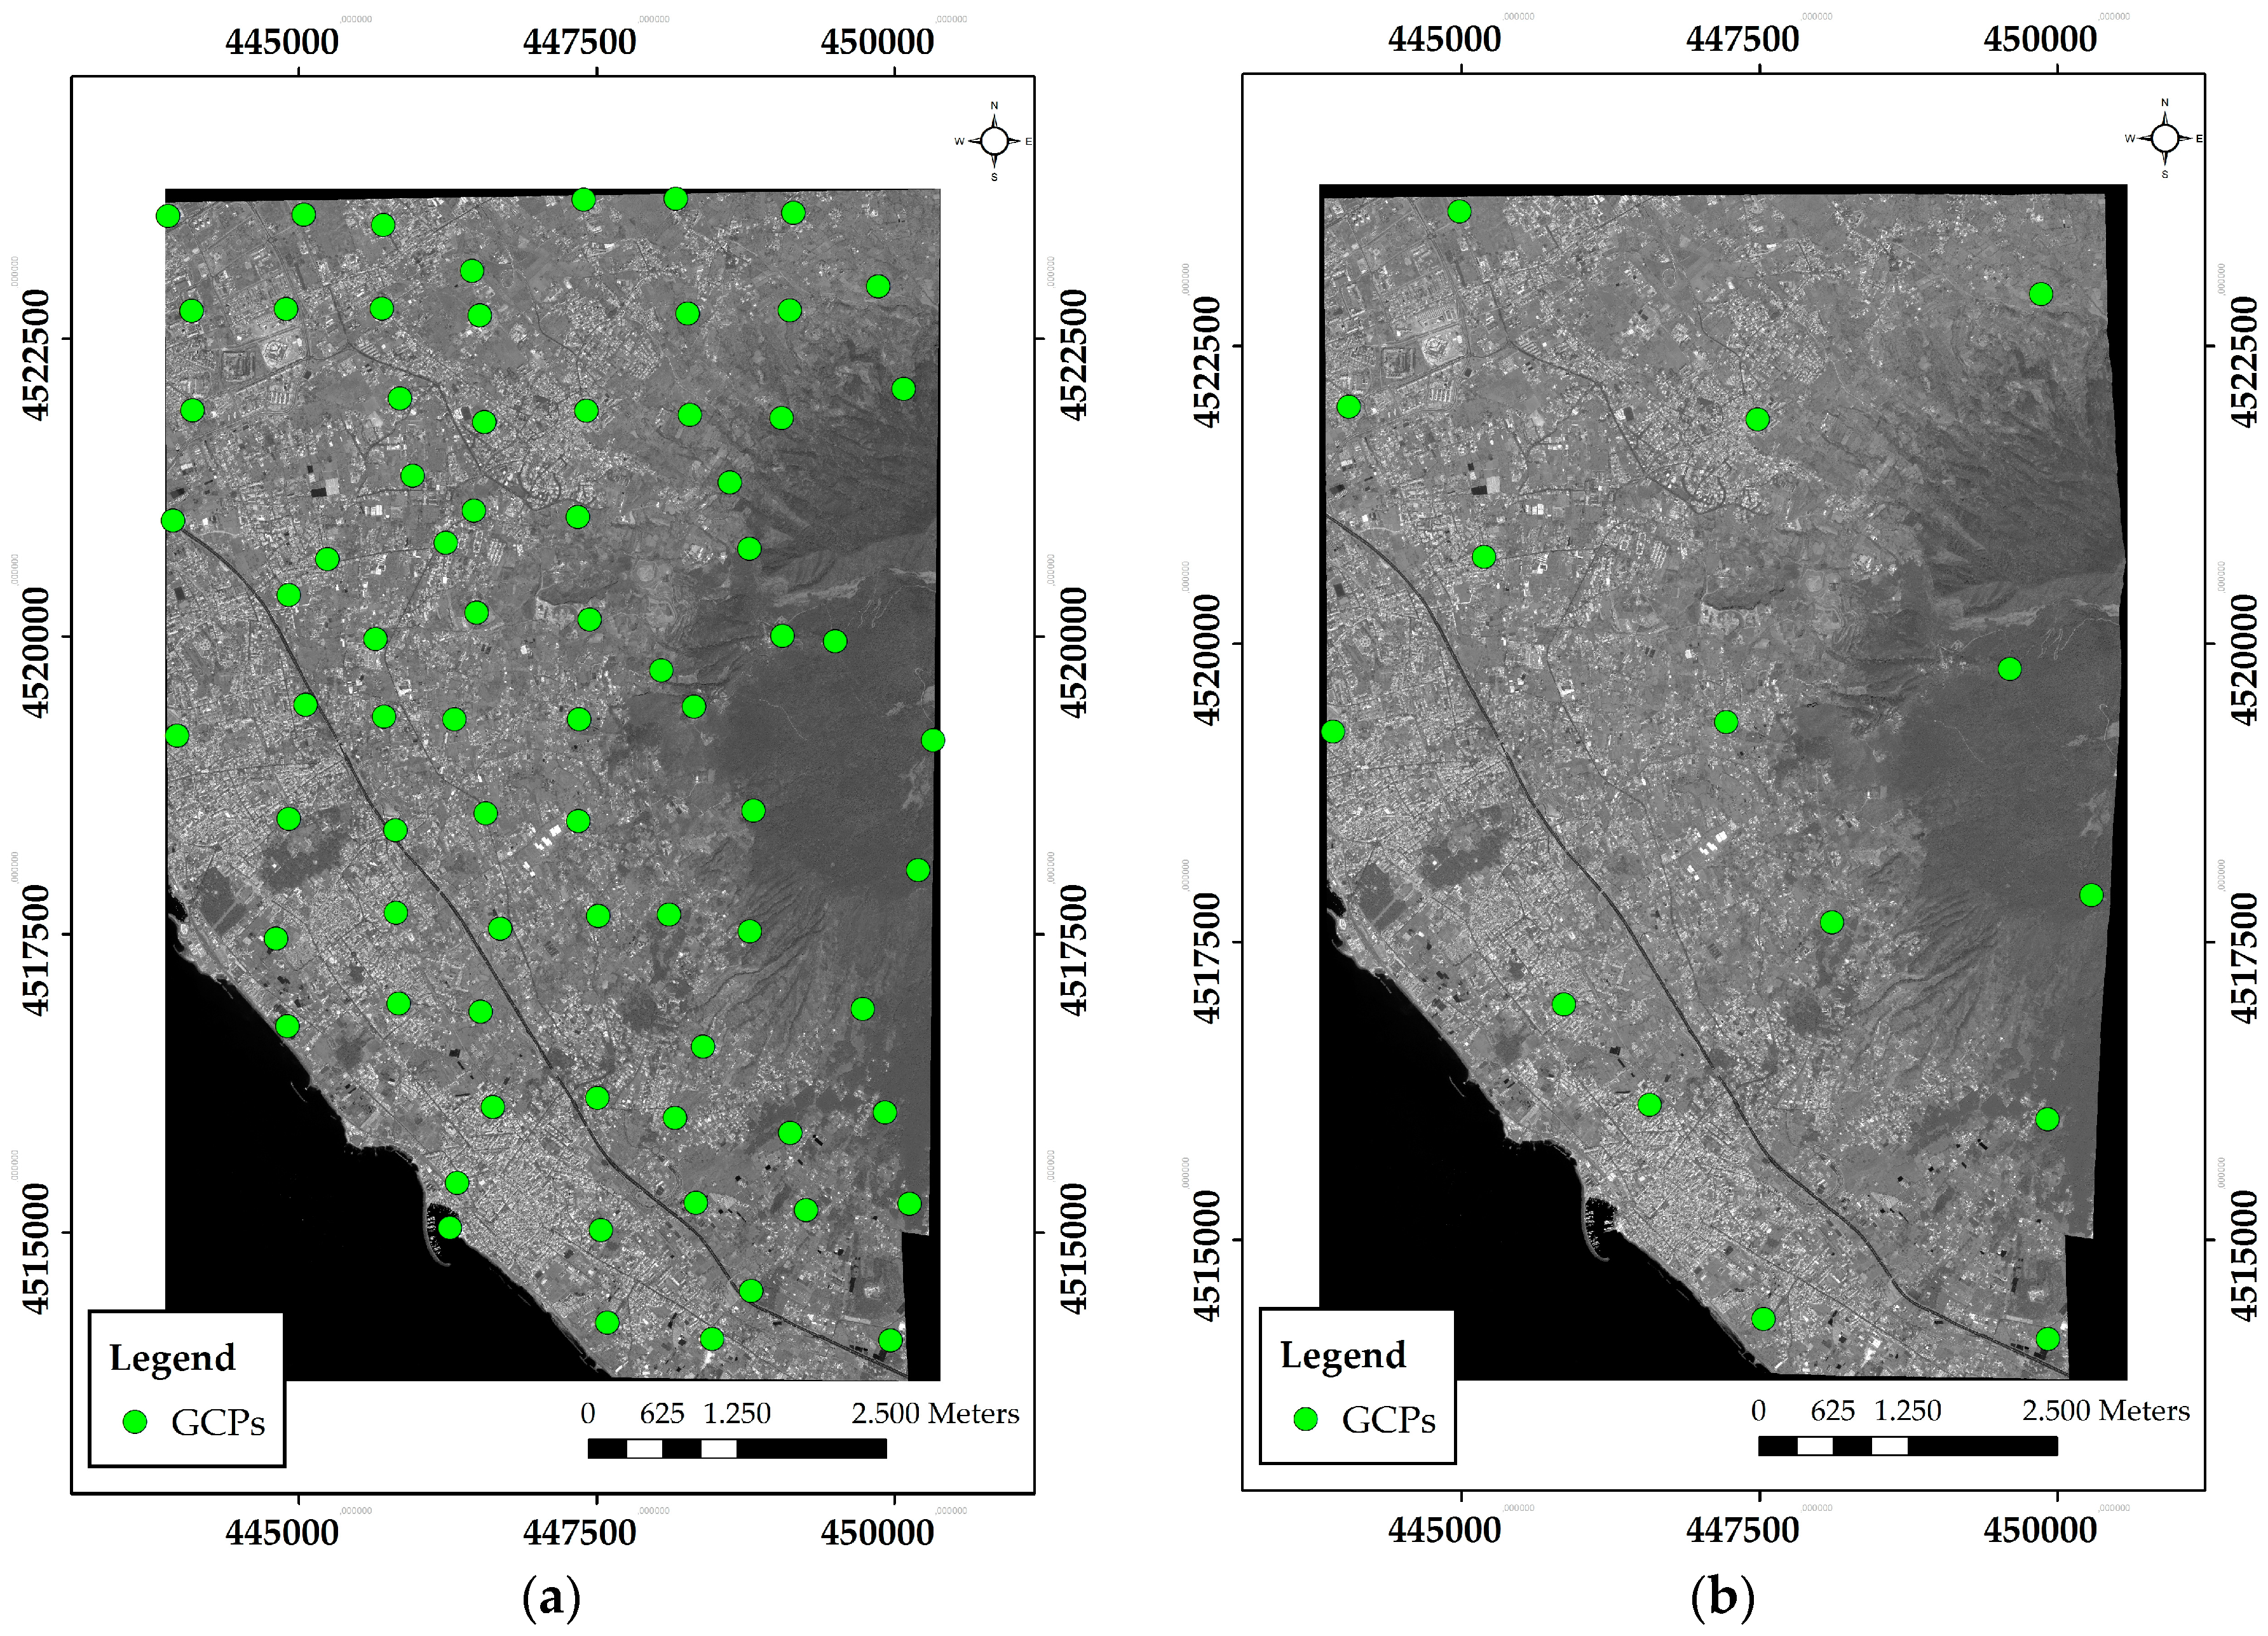
Both GCPs and CPs were homogeneously distributed over the study area and located on well-defined features. Clearly, the source, accuracy, distribution and number of GCPs and CPs are very important for a correct orthorectification [
2]. To obtain a reliable measurement of GCPs and CPs with adequate planimetric accuracy, their (x, y) coordinates in UTM-WGS84 were derived from orthophotos of Campania with 0.20 m resolution (nominal scale: 1:5000). It should be noted that errors may occur when manually selecting corresponding points. Thus, specific GCPs and CPs were detected in well-defined locations such as road junctions and corners of buildings or swimming pools. For any ambiguous points, Canny edge detection algorithm [
56] was used to support the identification of the corresponding points. In accordance with the literature [
25], this helps in ensuring that the accuracy of the GCP and CP identification on the imagery was definitely below one pixel.
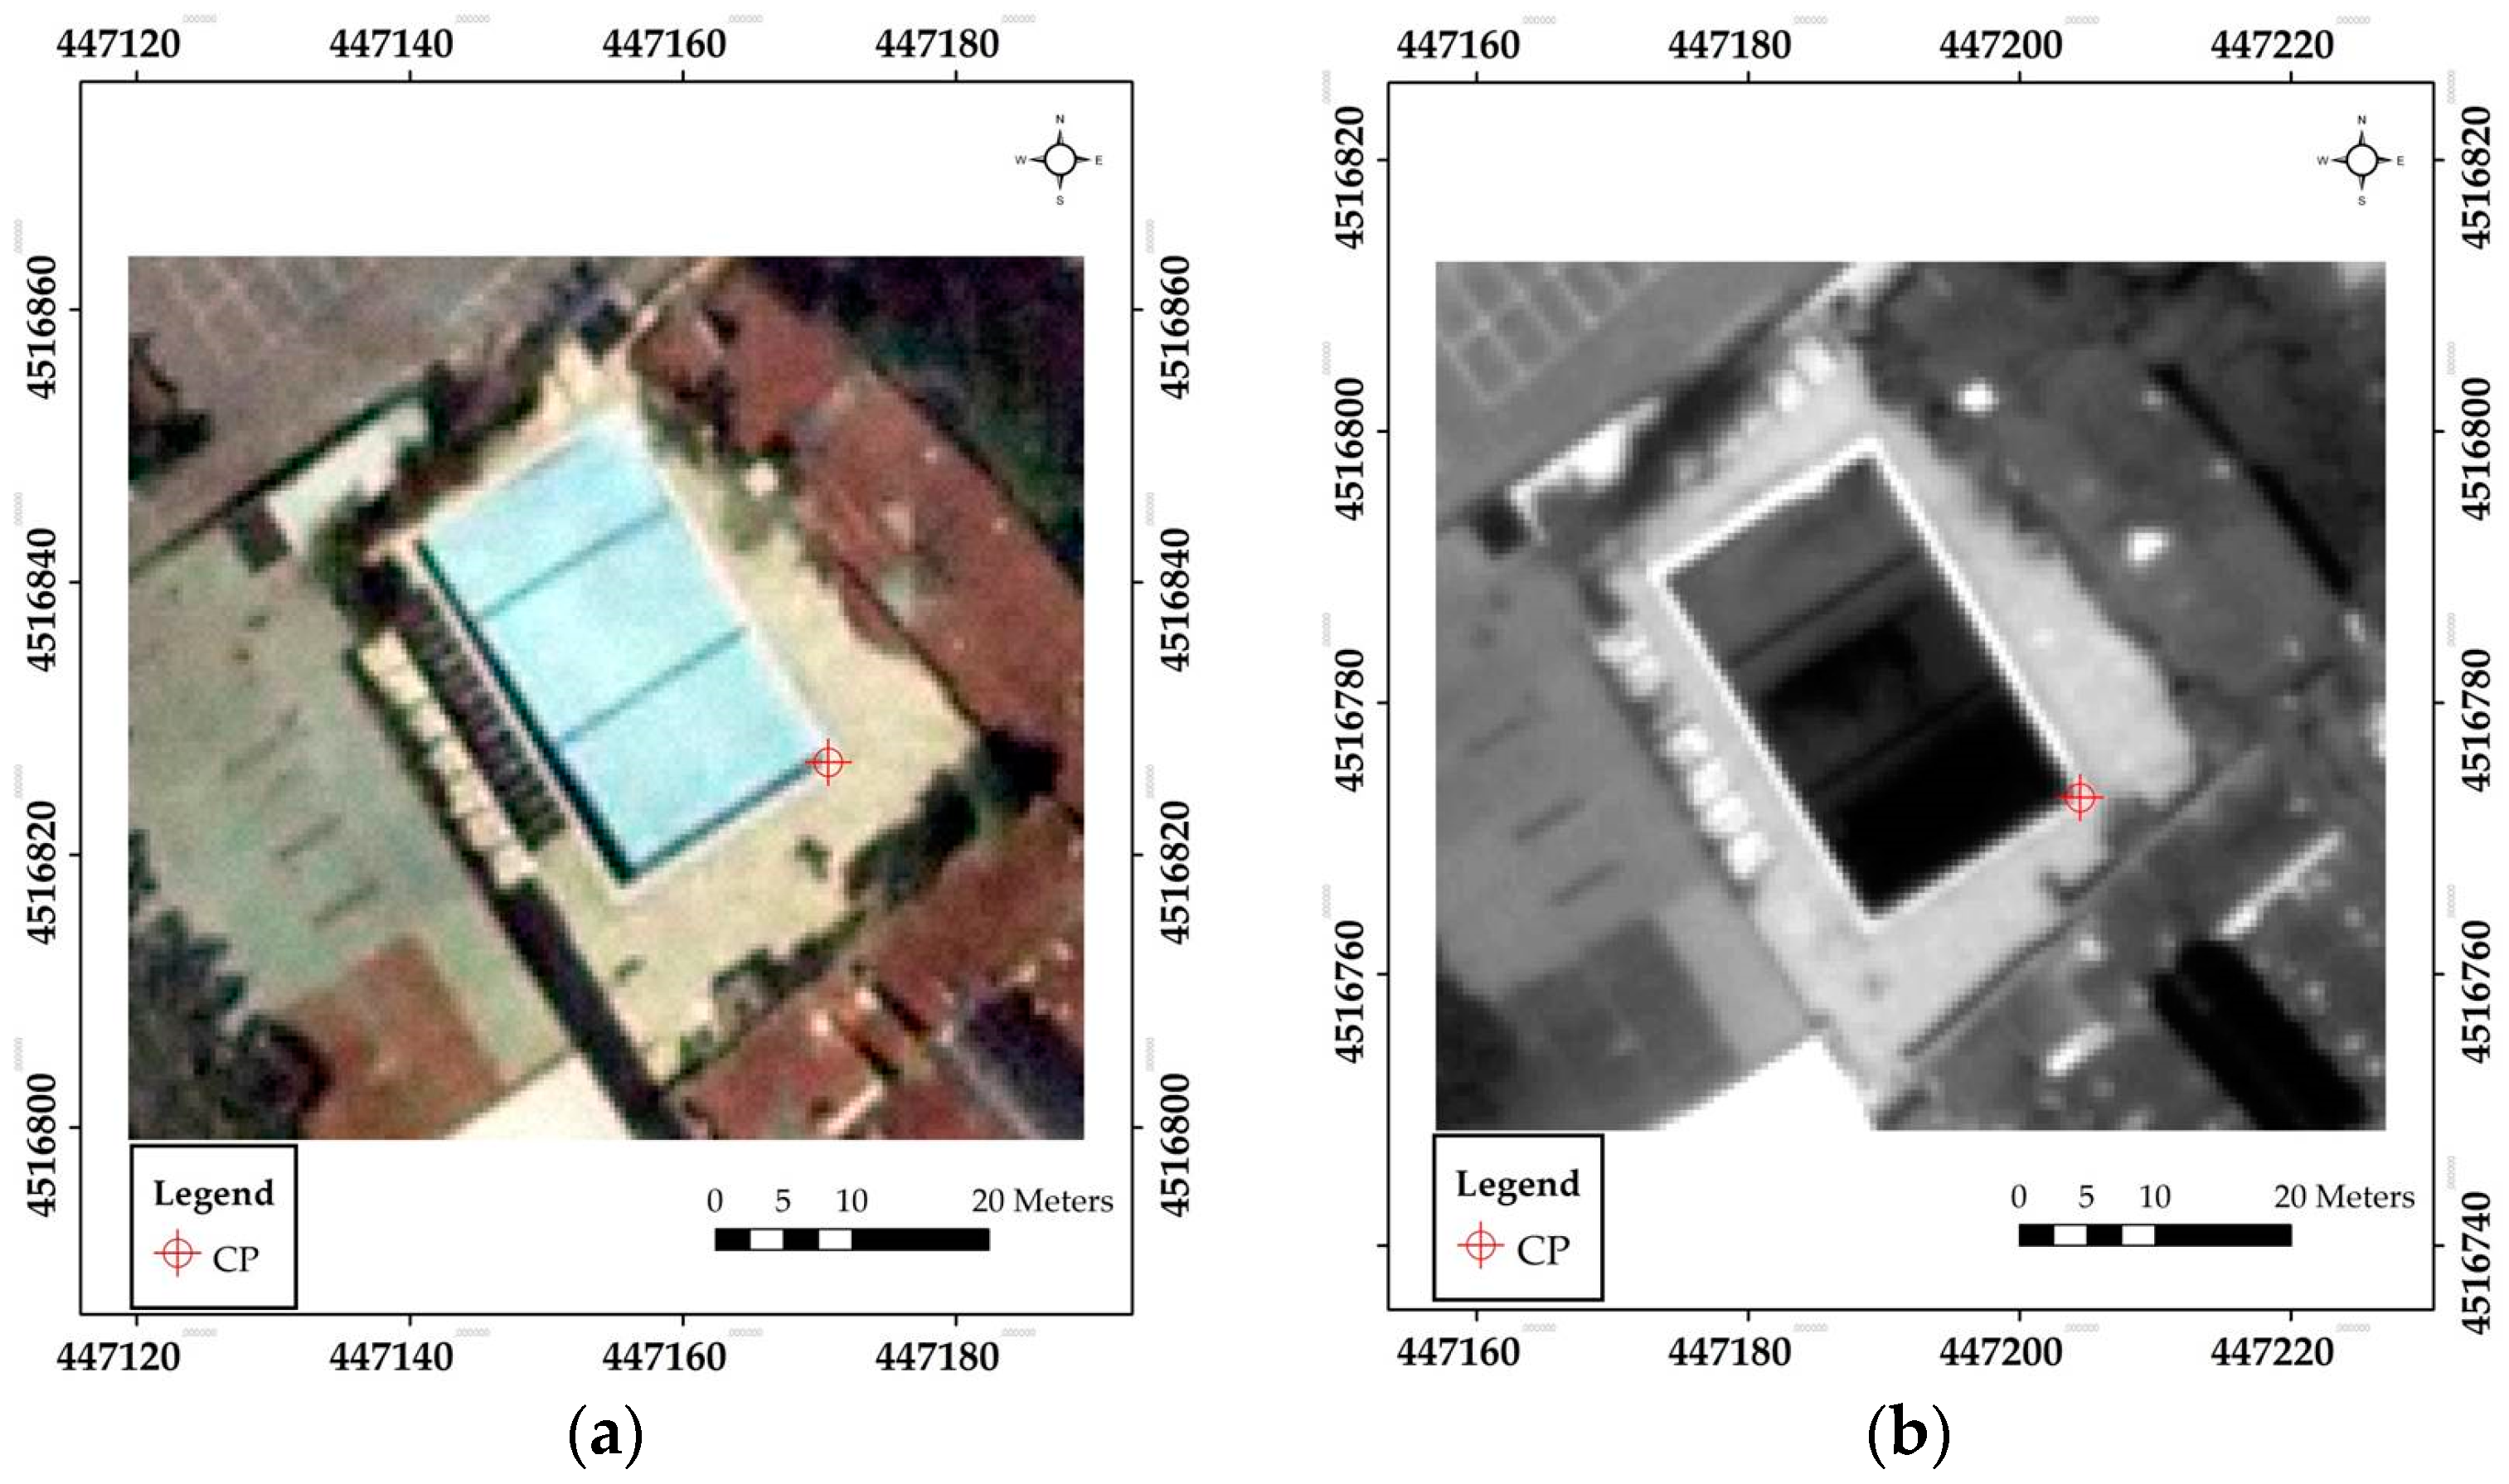
Figure 2 reports an example of CP identification.
GCP and CP elevations were obtained by DEMs of the study area with a different horizontal resolution (cell size: 1 m, 20 m, 75 m). The DEM with a cell size of 1 m derived from laser-scanning data was supplied by the local administration (Provincia di Napoli) which indicates residuals of 0.16 m between the heights from the grid and those of the 3D points acquired with the RTK (real-time kinematic) survey. The DEM with a cell size of 20 m was provided by IGM (Istituto Geografico Militare), which indicates residuals of 7–10 m between the heights from the grid and those of the 3D points in plane and hilly zones. The DEM with a cell size of 75 m was provided by ISPRA (Istituto Superiore per la Protezione e la Ricerca Ambientale) and presents a vertical accuracy of 16–22 m in the considered area.
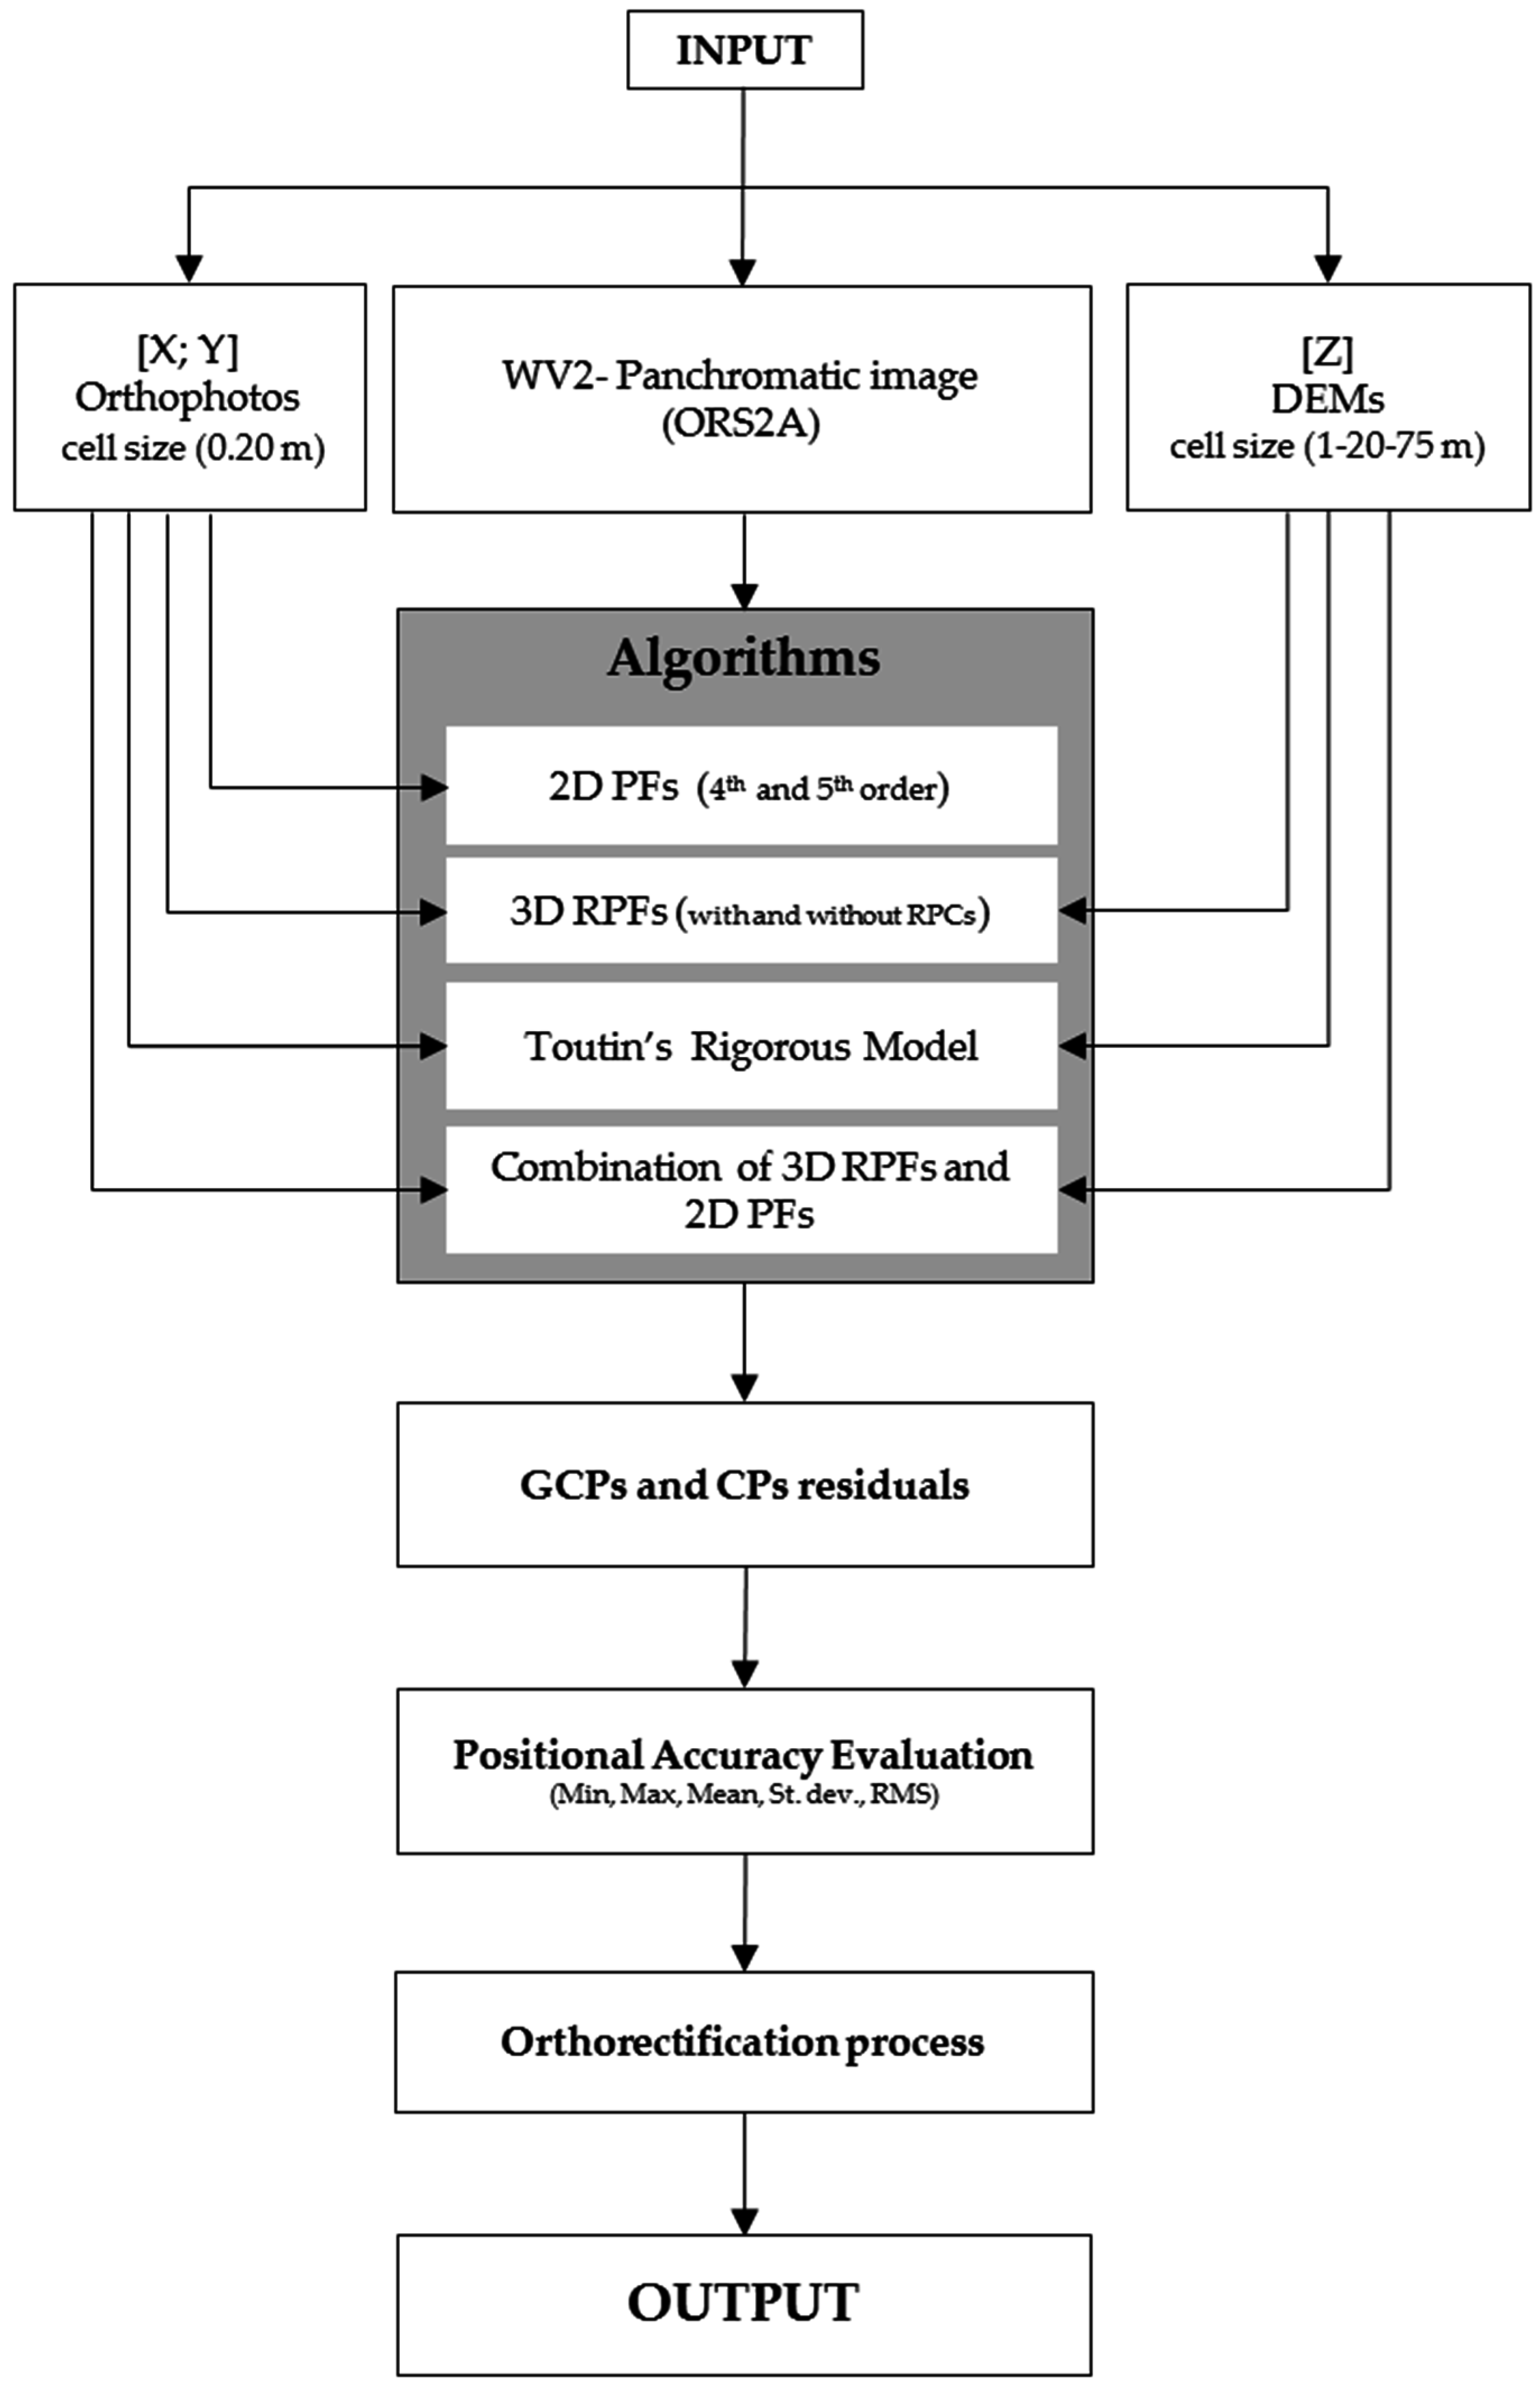
The flowchart in
Figure 3 shows the inputs (orthophotos, WV-2 panchromatic image, DEMs), the algorithms used (2D PFs—fourth- and fifth-order; 3D RPFs with and without RPCs; Toutin’s rigorous model; and a combination of 3D RPFs and 2D PFs), and the most important steps (GCP and CP residuals calculation, positional accuracy evaluation based on minimum, maximum, mean, standard deviation, RMS calculation, orthorectification process, and output).
The orthorectification in two steps was introduced to increase the geopositional accuracy of the final WV-2 panchromatic image. In the first step, the best resulting 3D RPFs model (75 GCPs–15 CPs, DEM = 1 m) was applied. For the second step, first-order PFs using 15 GCPs was performed on the orthoimage resulting from the first step.

