Article

Computer Aided Diagnosis System for Early Lung Cancer Detection

Department of Electrical and Computer Engineering, Khalifa University, Abu Dhabi, AD 127788, U.A.E
*
Author to whom correspondence should be addressed.
Algorithms 2015, 8(4), 1088-1110; https://doi.org/10.3390/a8041088
Submission received: 2 June 2015 / Accepted: 10 November 2015 / Published: 20 November 2015

Abstract

:
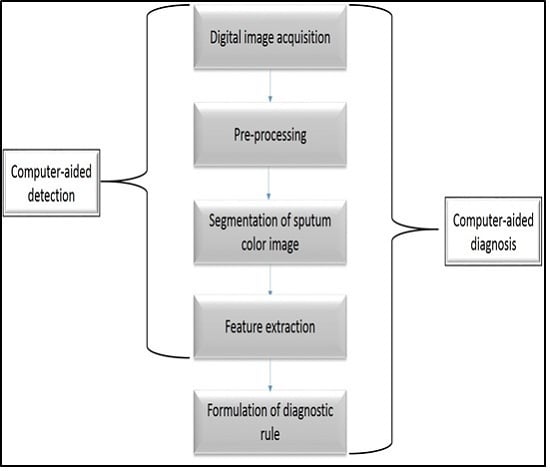
Lung cancer continues to rank as the leading cause of cancer deaths worldwide. One of the most promising techniques for early detection of cancerous cells relies on sputum cell analysis. This was the motivation behind the design and the development of a new computer aided diagnosis (CAD) system for early detection of lung cancer based on the analysis of sputum color images. The proposed CAD system encompasses four main processing steps. First is the preprocessing step which utilizes a Bayesian classification method using histogram analysis. Then, in the second step, mean shift segmentation is applied to segment the nuclei from the cytoplasm. The third step is the feature analysis. In this step, geometric and chromatic features are extracted from the nucleus region. These features are used in the diagnostic process of the sputum images. Finally, the diagnosis is completed using an artificial neural network and support vector machine (SVM) for classifying the cells into benign or malignant. The performance of the system was analyzed based on different criteria such as sensitivity, specificity and accuracy. The evaluation was carried out using Receiver Operating Characteristic (ROC) curve. The experimental results demonstrate the efficiency of the SVM classifier over other classifiers, with 97% sensitivity and accuracy as well as a significant reduction in the number of false positive and false negative rates.

Graphical Abstract

1. Introduction

Lung cancer ranks as one of the most common causes of death amongst all diseases. While there have been a lot of approaches to minimize the fatalities caused by this disease, early detection is considered the best step towards effective treatment. The overall five-year survival rate for lung cancer is 14%. Nonetheless, patients at the early stage of the disease who undergo curative resection have a five-year survival rate of 40% to 70%. The most recent estimate statistics, according to the American Cancer Society, indicate that in 2014, there were 224,210 new cases, accounting for about 13% of all cancer diagnoses. Lung cancer accounts for more deaths than any other cancer in both men and women. An estimated 221,200 new cases of lung cancer are expected in 2015. Furthermore, an estimated 158,040 deaths are expected to occur in 2015, accounting for about 27% of all cancer deaths [1].
The detection of lung cancer can be achieved in several ways, such as computed tomography (CT), magnetic resonance imaging (MRI), and X-ray. All these methods consume a lot of resources in terms of both time and money, in addition to their invasiveness. Recently, scientists have proven that the non-invasive technique of sputum cell analysis can assist in the successful diagnosis of lung cancer. A computer-aided-diagnosis (CAD) system using this modality would be of great support for pathologists when dealing with large amounts of data, in addition to relieving doctors from tedious and routine tasks. The design and development of sputum color image segmentation is an extremely challenging task. A part from the work reported in [2], where the authors used Hopfield Neural Network (HNN) to classify the sputum cells into cancer or non-cancer cell, little or nothing has been done in developing a CAD system based on sputum cytology.
In this paper a state-of-the-art CAD system is implemented based on sputum color image analysis. The CAD system can play a significant role in early lung cancer detection. It serves as a useful second opinion when physicians examine patients during lung cancer screening [3]. A CAD system involves a combination of image processing and artificial intelligent techniques that can be used to detect abnormalities in medical images as well as enhancing medical interpretation for a better performance in the diagnosis process. In addition, a CAD system could direct the pathologist’s attention to the regions where the probability of presence of the disease is greater [4]. On the other hand, the major role of the CAD system is to improve the sensitivity of the diagnosis process and not to make decisions about the patient’s health status [5]. The proposed CAD system was tested on 100 sputum color images for early lung cancer detection, the experimental results were substantially improved, with high values of sensitivity, specificity and accuracy, in addition to an accurate detection of the cancerous cells when compared with the pathologist’s diagnosis results. Therefore, the new CAD system could increase the efficiency of the mass screening process by detecting the lung cancer candidates successfully and improve the performance of pathology in the diagnosis process. The novelty of this work is defined as follows: a state-of-the-art complete CAD system is implemented based on the sputum color image analysis, and optimal deployment and combination of existing image processing and analysis techniques for building the computer aided diagnosis (CAD) system is used. The contributions can be summarized as follows: (1) Detection of sputum cell using a Bayesian classification framework; (2) Best color space after analysis of the images with histogram analysis; (3) Mean shift technique for the sputum cell segmentation; (4) Feature extraction, where a set of features are extracted from the nucleus region to be used in the diagnosis process. Based on medical knowledge, the following features were used in our proposed CAD system: Nucleus to Cytoplasm (NC) ratio, perimeter, density, curvature, circularity and eigen ratio; (5) Classification of sputum cells into benign or malignant cells is done by using different classification techniques: artificial neural network (ANN) and support vector machine (SVM).
The rest of the paper is organized as follows. Section 2 provides the background to the existing methods of lung cancer diagnosis. Section 3 describes sputum cells extraction and segmentation. Section 4 presents the feature extraction. Section 5 provides a detail description about the different classification methods. Section 6 compares the proposed CAD system with other systems. Finally, the conclusion and future works are discussed in Section 7.

2. Background

Lung cancer remains the leading cause of mortality. There is significant evidence indicating that the early detection of lung cancer will decrease the mortality rate, by using asymptomatic screening methods, followed by effective treatment. Most recent research relies on quantitative information, such as size, shape, and the ratio of the affected cells. Computer vision methods are employed to elicit information from medical images, such as the detection of cancerous cells. Many diagnostic ambiguities are removed when transforming these images from their continuous to their digital form. Today, very large amounts of data are produced from medical imaging modalities, such as sputum cytology, computed tomography (CT) and magnetic resonance imaging (MRI) [6]. In the literature, there exists many modalities that have been used for detecting lung cancer, some of them can detect the cancer in early stages, and others can detect the cancer in advanced stages. Some of lung cancer modalities are: computed tomography (CT) scans, positron emission tomography (PET) data, X-ray images and sputum color image analysis.
The authors in [7] used CT scans to detect histological images of the lungs and diagnose into cancerous or non-cancerous nodules. The segmentation process is done by using a fuzzy system based on the area and the gray level of the nodule region. These methods attain an accuracy of 90% with high values for sensitivity and specificity that can meet the clinical diagnosis requirement. Other authors [8] used high resolution (HRCT) images to detect small lung nodules by applying a series of 3D cylindrical and spherical filters. The drawback was in the limitation of this method in detecting all cancerous nodules. Using CT scans in detecting lung cancer has a number of limitations with high false-positive rate, because it detects a lot of non-cancerous nodules and it misses many small cancer nodules.
The PET scan which is used in conjunction with X-rays or CT scans, is considered the most recent nuclear medicine imaging of the functional processes within the human body. The biggest advantage of a PET scan, compared to other modalities, is that it can reveal how a part of the patient’s body is functioning, rather than just how it looks. The author in [9] proposed an automated process of tumor delineation and volume detection from each frame of PET lung images. The spatial and frequency domain features have been used to represent the data. K-nearest neighbor and support vector machines (SVM) classifiers have been used to measure the performance of the features. Wavelet features with a SVM classifier gave a consistent accuracy of 97% with an average sensitivity and specificity of 81% and 99%, respectively. The calculated volume from the detected tumor by the proposed method matched the manually segmented volume by physicians. Their methods succeeded in eliminating the need for manual tumor segmentation, thus reducing physician fatigue to a great extent, however the limitation of the PET scan is that it can be time consuming. It can take from several hours to days for the radiotracer to accumulate in the body part of interest. In addition, the resolution of body structures with nuclear medicine may not be as high as with other imaging techniques, such as CT.
The X-ray image, or chest radiography, is one of the most commonly used diagnostic modalities in lung cancer detection and is regarded as one of the cheapest diagnostic tools. The authors in [10] proposed a nodule detection algorithm in chest radiographs. The algorithm consisting of four steps: image acquisition, image preprocessing, nodule candidate segmentation and feature extraction. Active shape model technique for lung image segmentation was used, while gray level co-occurrence matrix technique was adopted for texture features. The limitation can be in its invasive nature (patients’ radiation exposure), plus high false positive and negative rates.
The latest modality is sputum cytology, which has developed to become an important modality that can be used to detect early lung cancer. A number of medical researchers now utilize analysis of sputum cells for this early detection. The detection of lung cancer by using sputum color images was introduced in [2] where, for the diagnosis, the authors presented unsupervised classification technique based on HNN to segment the sputum cells into cancerous and normal cells. They used energy function with cost term to increase the accuracy in the segmented regions. Their technique resulted in correct segmentation of sputum color image cells into nuclei, cytoplasm and clear background classes. However, the methods have limitations due to the problem of early local minima of the HNN. The HNN can make a crisp classification of the cells after removing all debris cells. The authors in [11] overcame this problem by using a mask algorithm as a pre-processing step for removing all debris cells and classifying the overlapping cells as separate cells. They concluded that the HNN gives better classification results than other methods such as fuzzy clustering technique and can be used in the diagnosis process.
The author in [12] used all the previous results to come up with an automatic computer aided diagnosis system for early detection of lung cancer based on the analysis of pathological sputum color images. Two segmentation processes were used, the first one was Fuzzy C-Means Clustering algorithm (FCM), and the second was the improved version of HNN for the classification of the sputum images into background, nuclei and cytoplasm. The two regions were used as a main feature to diagnose each extracted cell. It was found that the HNN segmentation results are more accurate and reliable than FCM clustering in all cases. The HNN succeeded in extracting the nuclei and cytoplasm regions. However, FCM failed in detecting the nuclei, instead detecting only part of it. In addition, the FCM is not sensitive to intensity variations as segmentation error at convergence is larger with FCM compared to that with HNN.
In the previous cases [2,11,12], the detection of lung cancer was done through the analysis of sputum color images by applying data mining techniques such as clustering and classification followed by shape detection. However, the techniques which were used to analyze these images have a number of limitations namely: the high number of false negatives representing the missed cancer cells, and the high number of false positives representing cells classified as cancerous, resulting in putting a patient through unnecessary radiation and surgical operations. In addition, most techniques fail to consider the outer pixels which may sometimes represent a class in themselves. Moreover, the preprocessing techniques need further enhancement to discard the debris cells in the background of the images, and to remove all noise from the images, in addition to the overlapping between the sputum cells which have not been considered by the previous techniques.
The current segmentation results are not accurate enough to be used in the diagnosis part. In the HNN-based method, the cluster number has to be provided in advance. This affects the feature extraction part, especially in the presence of outliers. These problems have to be tackled, and more features have to be computed to develop a successful CAD system. Hence this leaves scope for further investigation of a method that detects the lung cancer in the early stage.

3. Sputum Cells Extraction and Segmentation

A database of 100 sputum color images collected from the Tokyo Center for lung cancer was utilized in this study. These images were stained into red and blue dye images by using the Papanicolaou standard methods [13]. Some of the nuclei of the sputum cells overlapped with the cytoplasm due to the dispersion of the cytoplasm in the staining process. Moreover, there was an intensity variation in the cytoplasm and background regions in the sputum image.

3.1. Cell Detection and Extraction

A Bayesian classification was used to extract the sputum cells from the background. Thus, the sputum image extraction into a sputum cell region and a background can be viewed as a classification problem, in which each pixel has to be assigned to one of the two classes (sputum cell or background). The Bayesian classification approach allows a systematic and methodologist estimation of the threshold parameters rather than using heuristics with trial and error testing.
In a Bayesian classifier a pixel x is considered part of the sputum region if:
p ( b g | x ) < p ( s p | x )
where sp and bg refer to the sputum and the background respectively. This equation reflects that: given the pixel x, the conditional probability of belonging to the sputum cell area is larger than the conditional probability of belonging to the background. Using the Bayesian theorem and the concept of classification Equation (1) can be brought to:
μ s p μ b g p ( b g ) p ( s p ) < p ( x | s p ) p ( x | b g )
where μ s p   is the loss weight incurred if the sputum class has been selected instead of the background, and μ b g   is the loss weight incurred if the background class has been selected instead of the sputum cell. p(bg) and p(sp) are the prior probabilities of the background and the sputum classes respectively. These parameters are estimated from the total number of sputum and background pixels in the training set of the images.
The setting of the ratio λ = μ s p μ b g   is based on the following reasoning: In the context of cancer cell detection, false positives usually prevail over false negatives. Bearing in mind that cancerous cells are characterized by an oversized nucleus relative to the cytoplasm, mistakenly selecting a background pixel as a sputum pixel does rather increase the detected cytoplasm region thus disproportioning the nucleus, and therefore increases the likelihood of assessing a cancerous cell. From this perspective, the loss incurred in a false sputum cell classification should be assigned a larger weight than its counterpart in the opposite case, (e.g., loss incurred if the background class has been selected instead of the sputum). Therefore, the ratio λ should be set larger than 1.
The class conditional pdfs p(x|sp) and p(x|bg) were estimated using the histogram technique [14], due to the ability of the histogram to design the Bayesian classifier very rapidly even with the large training set. We applied a Bayesian classifier to detect and extract the ROI (sputum cells) from the background in the sputum color images. Figure 1 shows some examples of sputum cell detection obtained by using the Bayesian classifier technique with two different values of the ratio λ. Figure 1a depicts raw images, Figure 1b depicts the ground-truth images obtained manually, Figure 1c depicts the resulted images from the Bayesian classification with λ = 2, and Figure 1d depicts the results with λ = 7. As can be noticed from the figure, the size of the detected cell for λ = 7 is less than the size for λ = 2, thus confirming the previously adopted cost condition on the ratio λ.
Figure 1. Samples of sputum cell extraction results. From left to right: (a) raw images; (b) ground truth data; (c) cell detection by using the Bayesian classifier with λ = 2; and (d) with λ = 7.
Algorithms 08 01088 g001

3.2. Segmentation

We target the cell segmentation by using the mean shift algorithm to segment the sputum cells into nuclei and cytoplasm regions. These regions exhibit reddish colors with different levels of intensity (dark for nucleus and clear in the cytoplasm). Therefore, the edge-based and parametric segmentation methods are not suitable because of the noisy aspect of the cytoplasm and the nucleus in the sputum cells, and the closeness of their chromatic values. In addition to that, the mean shift algorithm is the most popular density-based segmentation method. It is a non-parametric iterative technique that operates on a particular density function defined in the feature space.
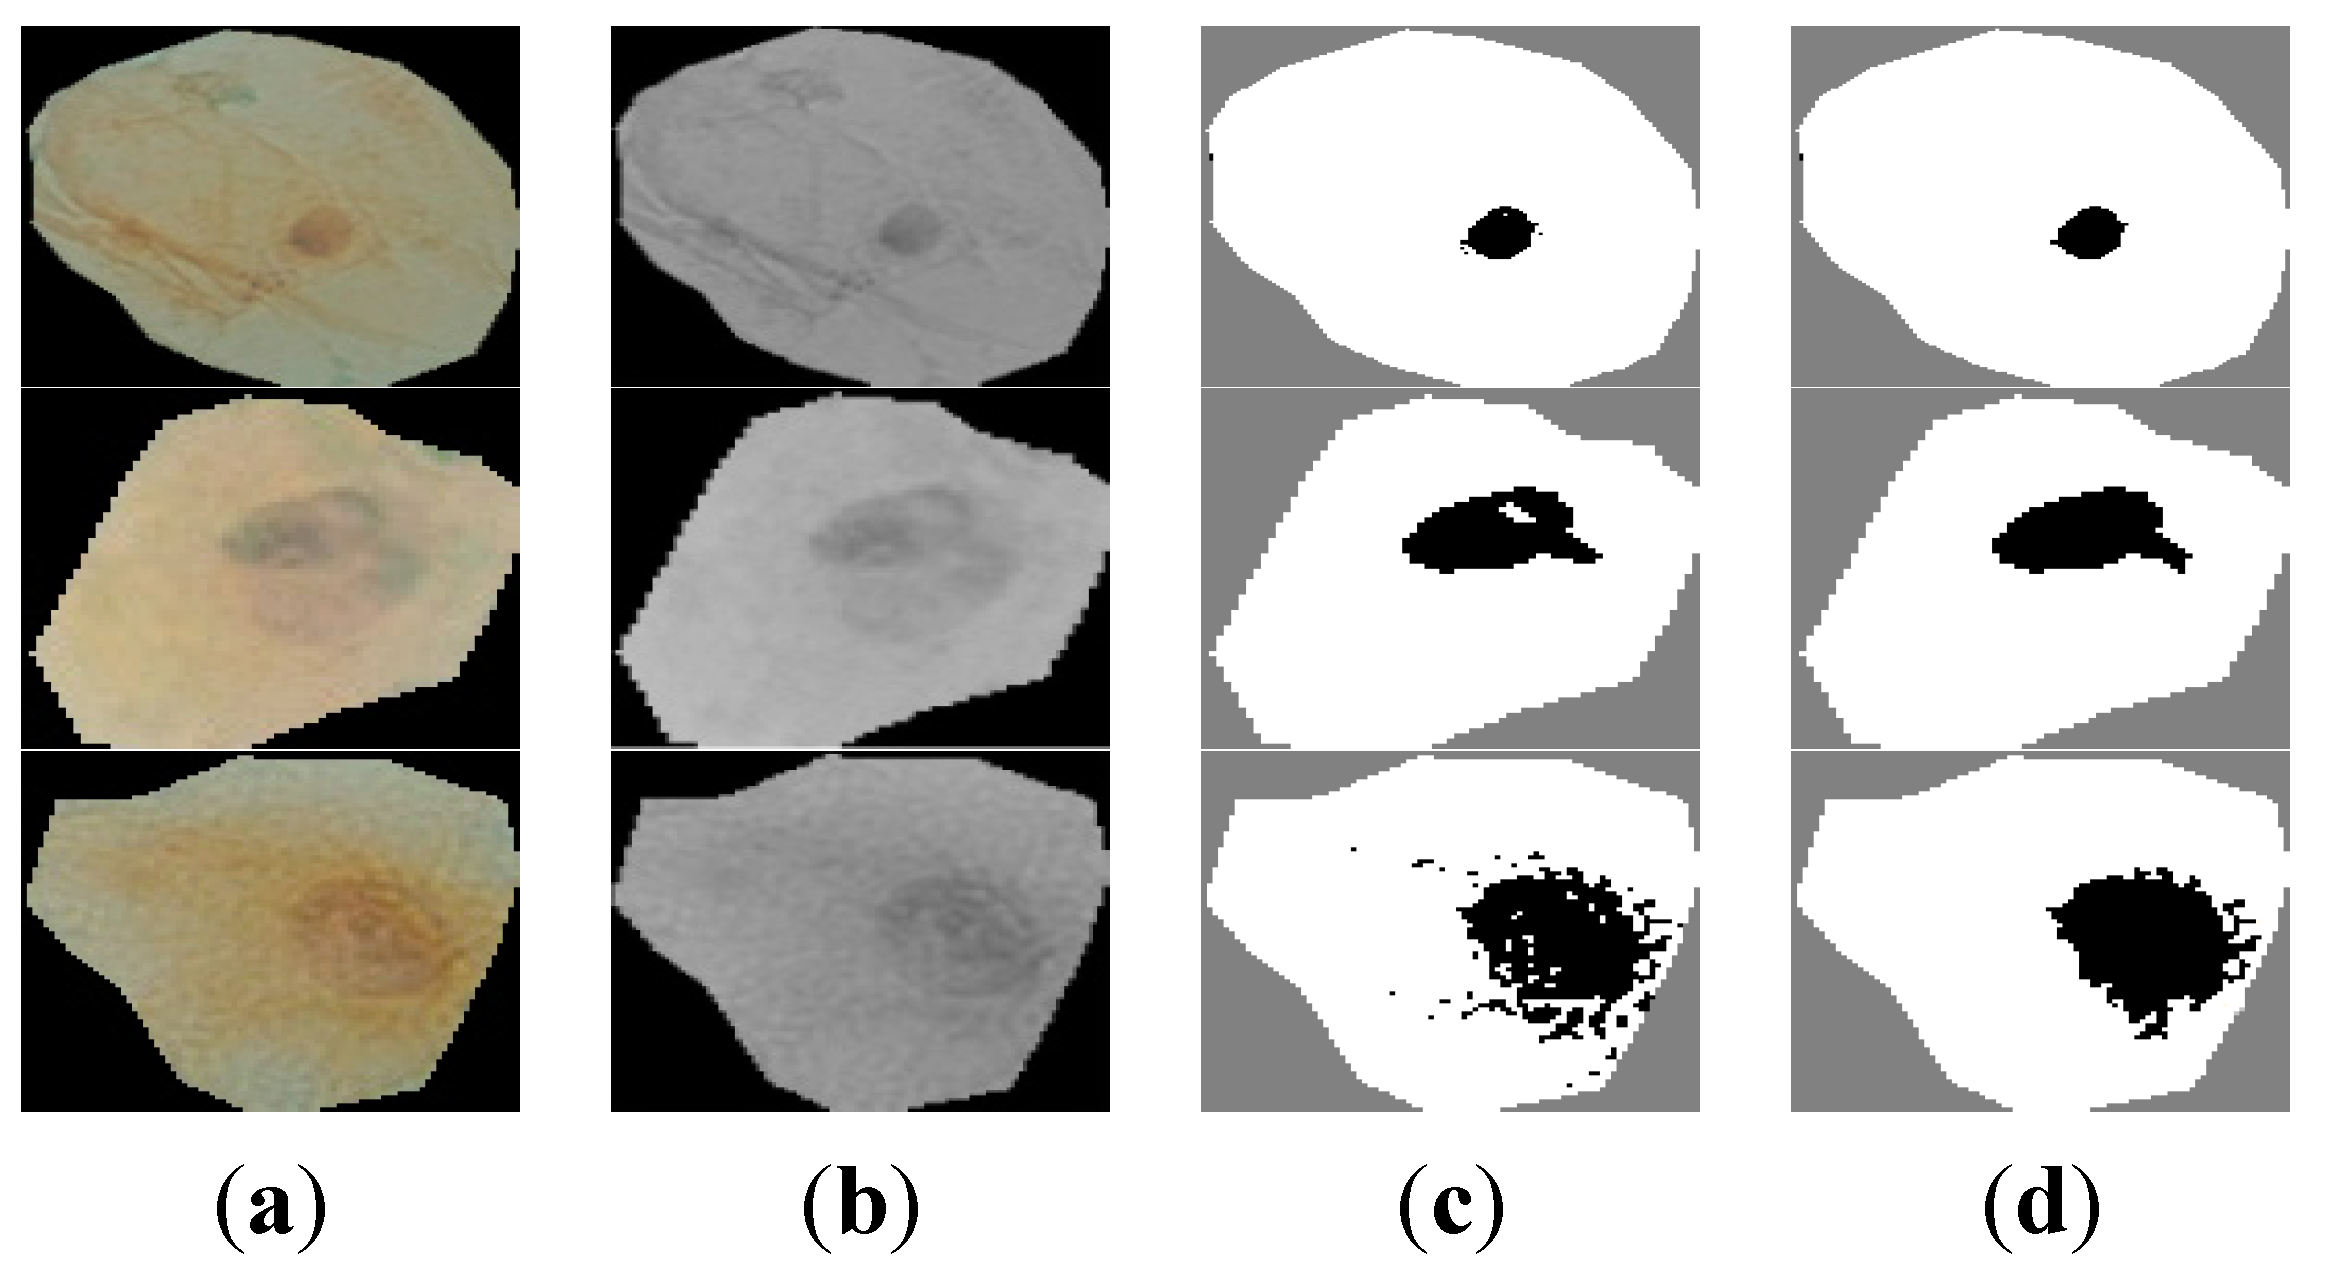
Basically, the mean shift iteratively shifts candidate solutions in the feature space towards points of maximum density. In our application, the feature space is defined by the pixel’s gray level and the pixel spatial coordinates. The detailed algorithm can be found in [14]. Figure 2, depicts an example of sputum cells through the different mean shift segmentation stages. Figure 2a shows the sputum cells extraction (nucleus and cytoplasm). We converted the sputum cell pixels to gray level and applied histogram equalization to enhance the contrast of the images as shown in Figure 2b.
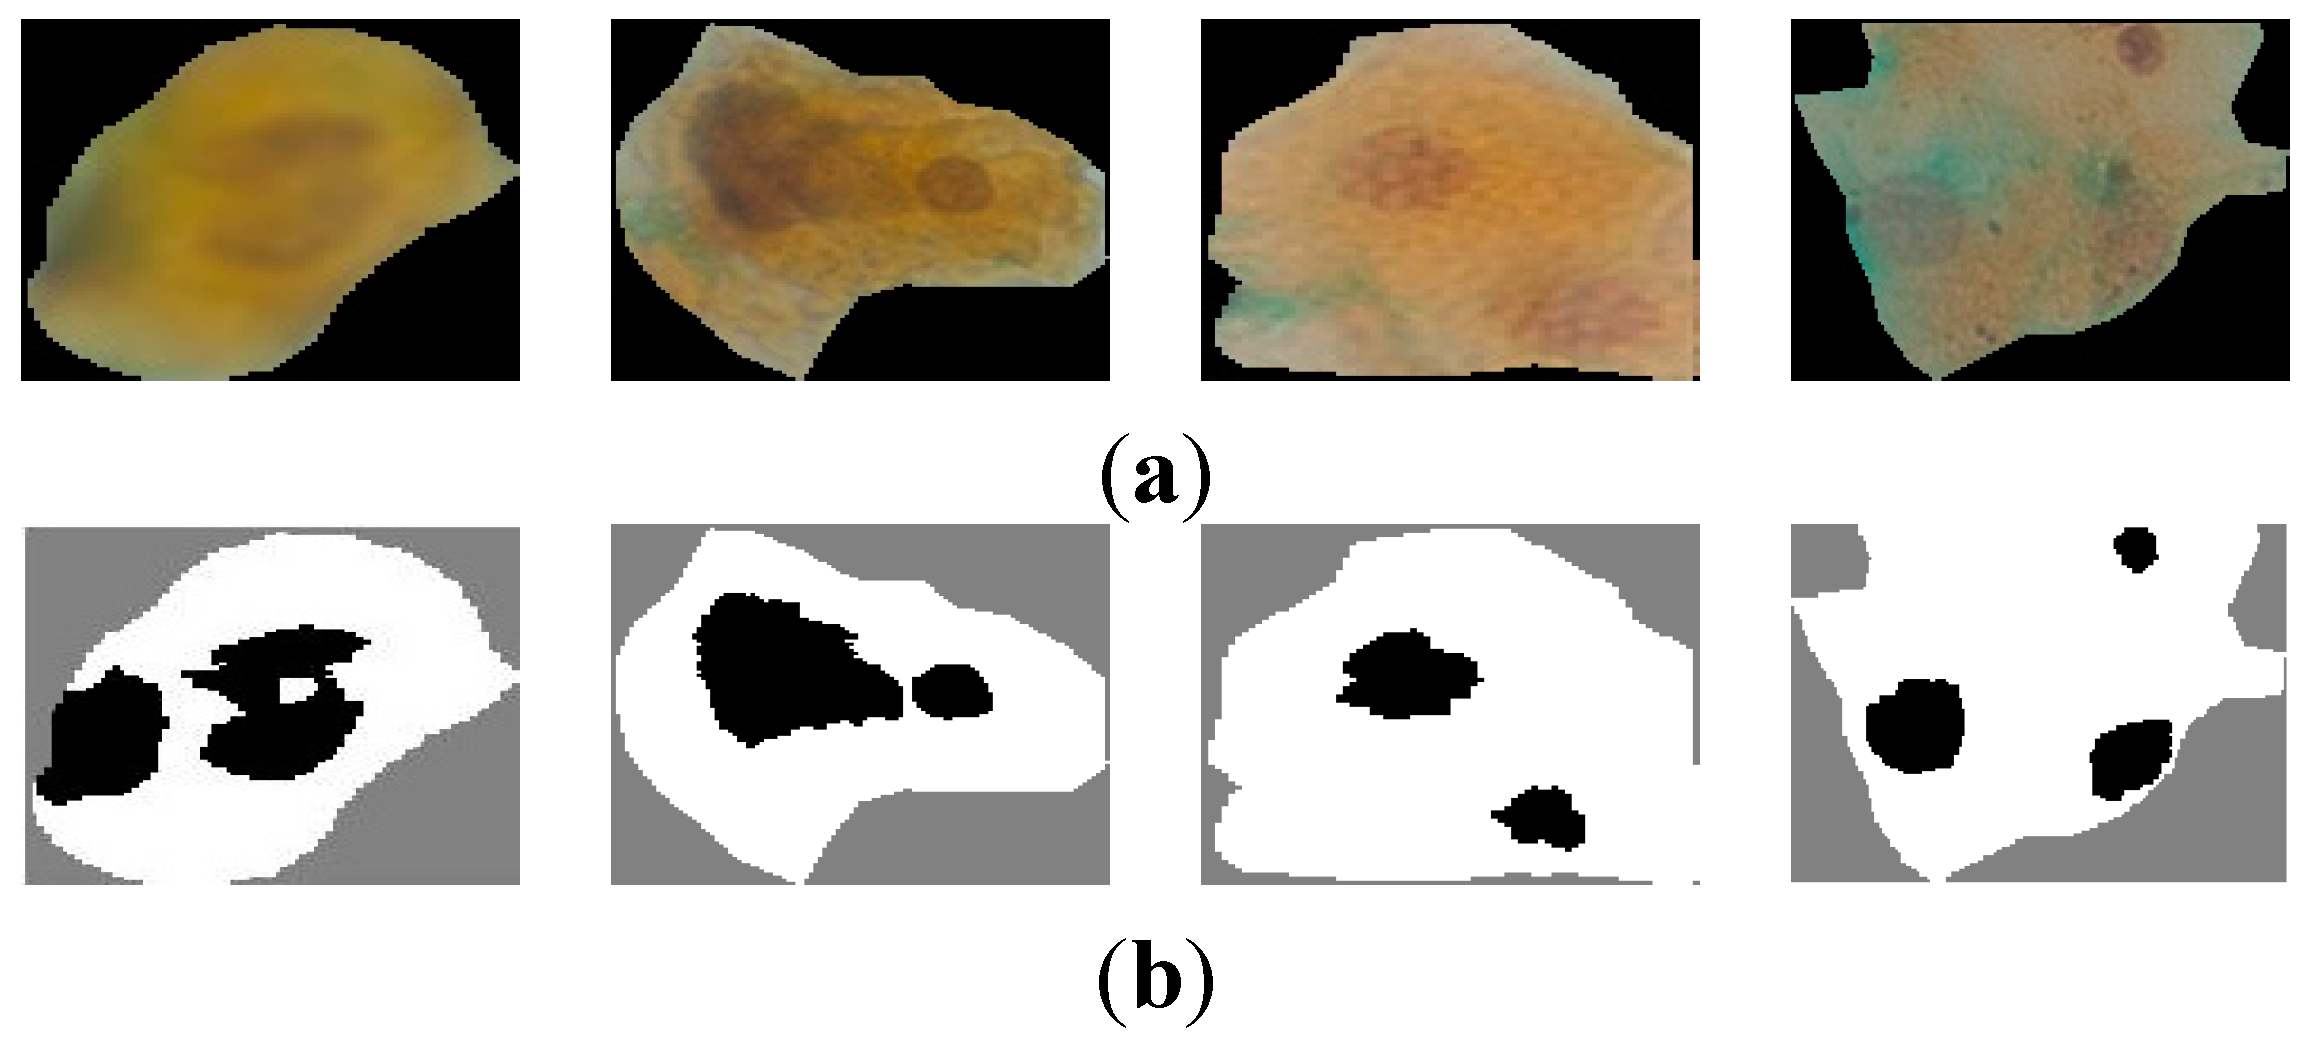
The results of the mean shift segmentation are illustrated in Figure 2c. We observed that the segmentation produces several non-compact regions that do not fit the desired target (e.g., the nucleus and cytoplasm). Statistically, we found that the number of regions varies between 3 and 6. Thus, we performed region merging. First, from each region represented as a binary image, we extracted the largest connected patches (excluding the isolated and tiny ones). Afterwards, we performed region merging by computing the mean distance of the modes to the center of the image. Then, the mode with the minimal distance was assumed to be the nucleus. If this mode has more than one area, we repeated the same procedure for the different areas. Since we want to have a connected nucleus, therefore we perform a rule-based region merging (as shown in Figure 2d), followed by a basic hole-filling morphological operation [15] to get the fully compact regions corresponding to the nucleus and cytoplasm. On one hand, the final number of regions should not exceed 2. On the other hand, when the number of regions is above 2, meaning that the nuclei contains separated regions, and in this case the cell is considered as abnormal, since such configuration reflects nucleus duplication known as the mitosis (cell division) process [16]. Figure 3, illustrates an example of such a case.
Figure 2. Samples of sputum cells through different mean shift segmentation stages. (a) sputum cells; (b) conversion to gray level and apply histogram equalization; (c) mean shift segmentation; (d) mode merging and region refinement.
Algorithms 08 01088 g002
Figure 3. Mitosis (cell division). (a) raw cells and (b) two or more nuclei in each cytoplasm.
Algorithms 08 01088 g003

3.3. Experiments

We conducted a comprehensive set of experiments to analyze the effect of the detection and segmentation process on the sputum cell extraction. Quantitatively, the performance was assessed in terms of sensitivity, specificity and accuracy in term of true positives (TP), false positives (FP), true negatives (TN), and false negatives (FN) as follows:
Sensitivity = TP TP + FN  Specificity = TN TN + FP , Accuracy = TP + TN TP + TN + FP + FN
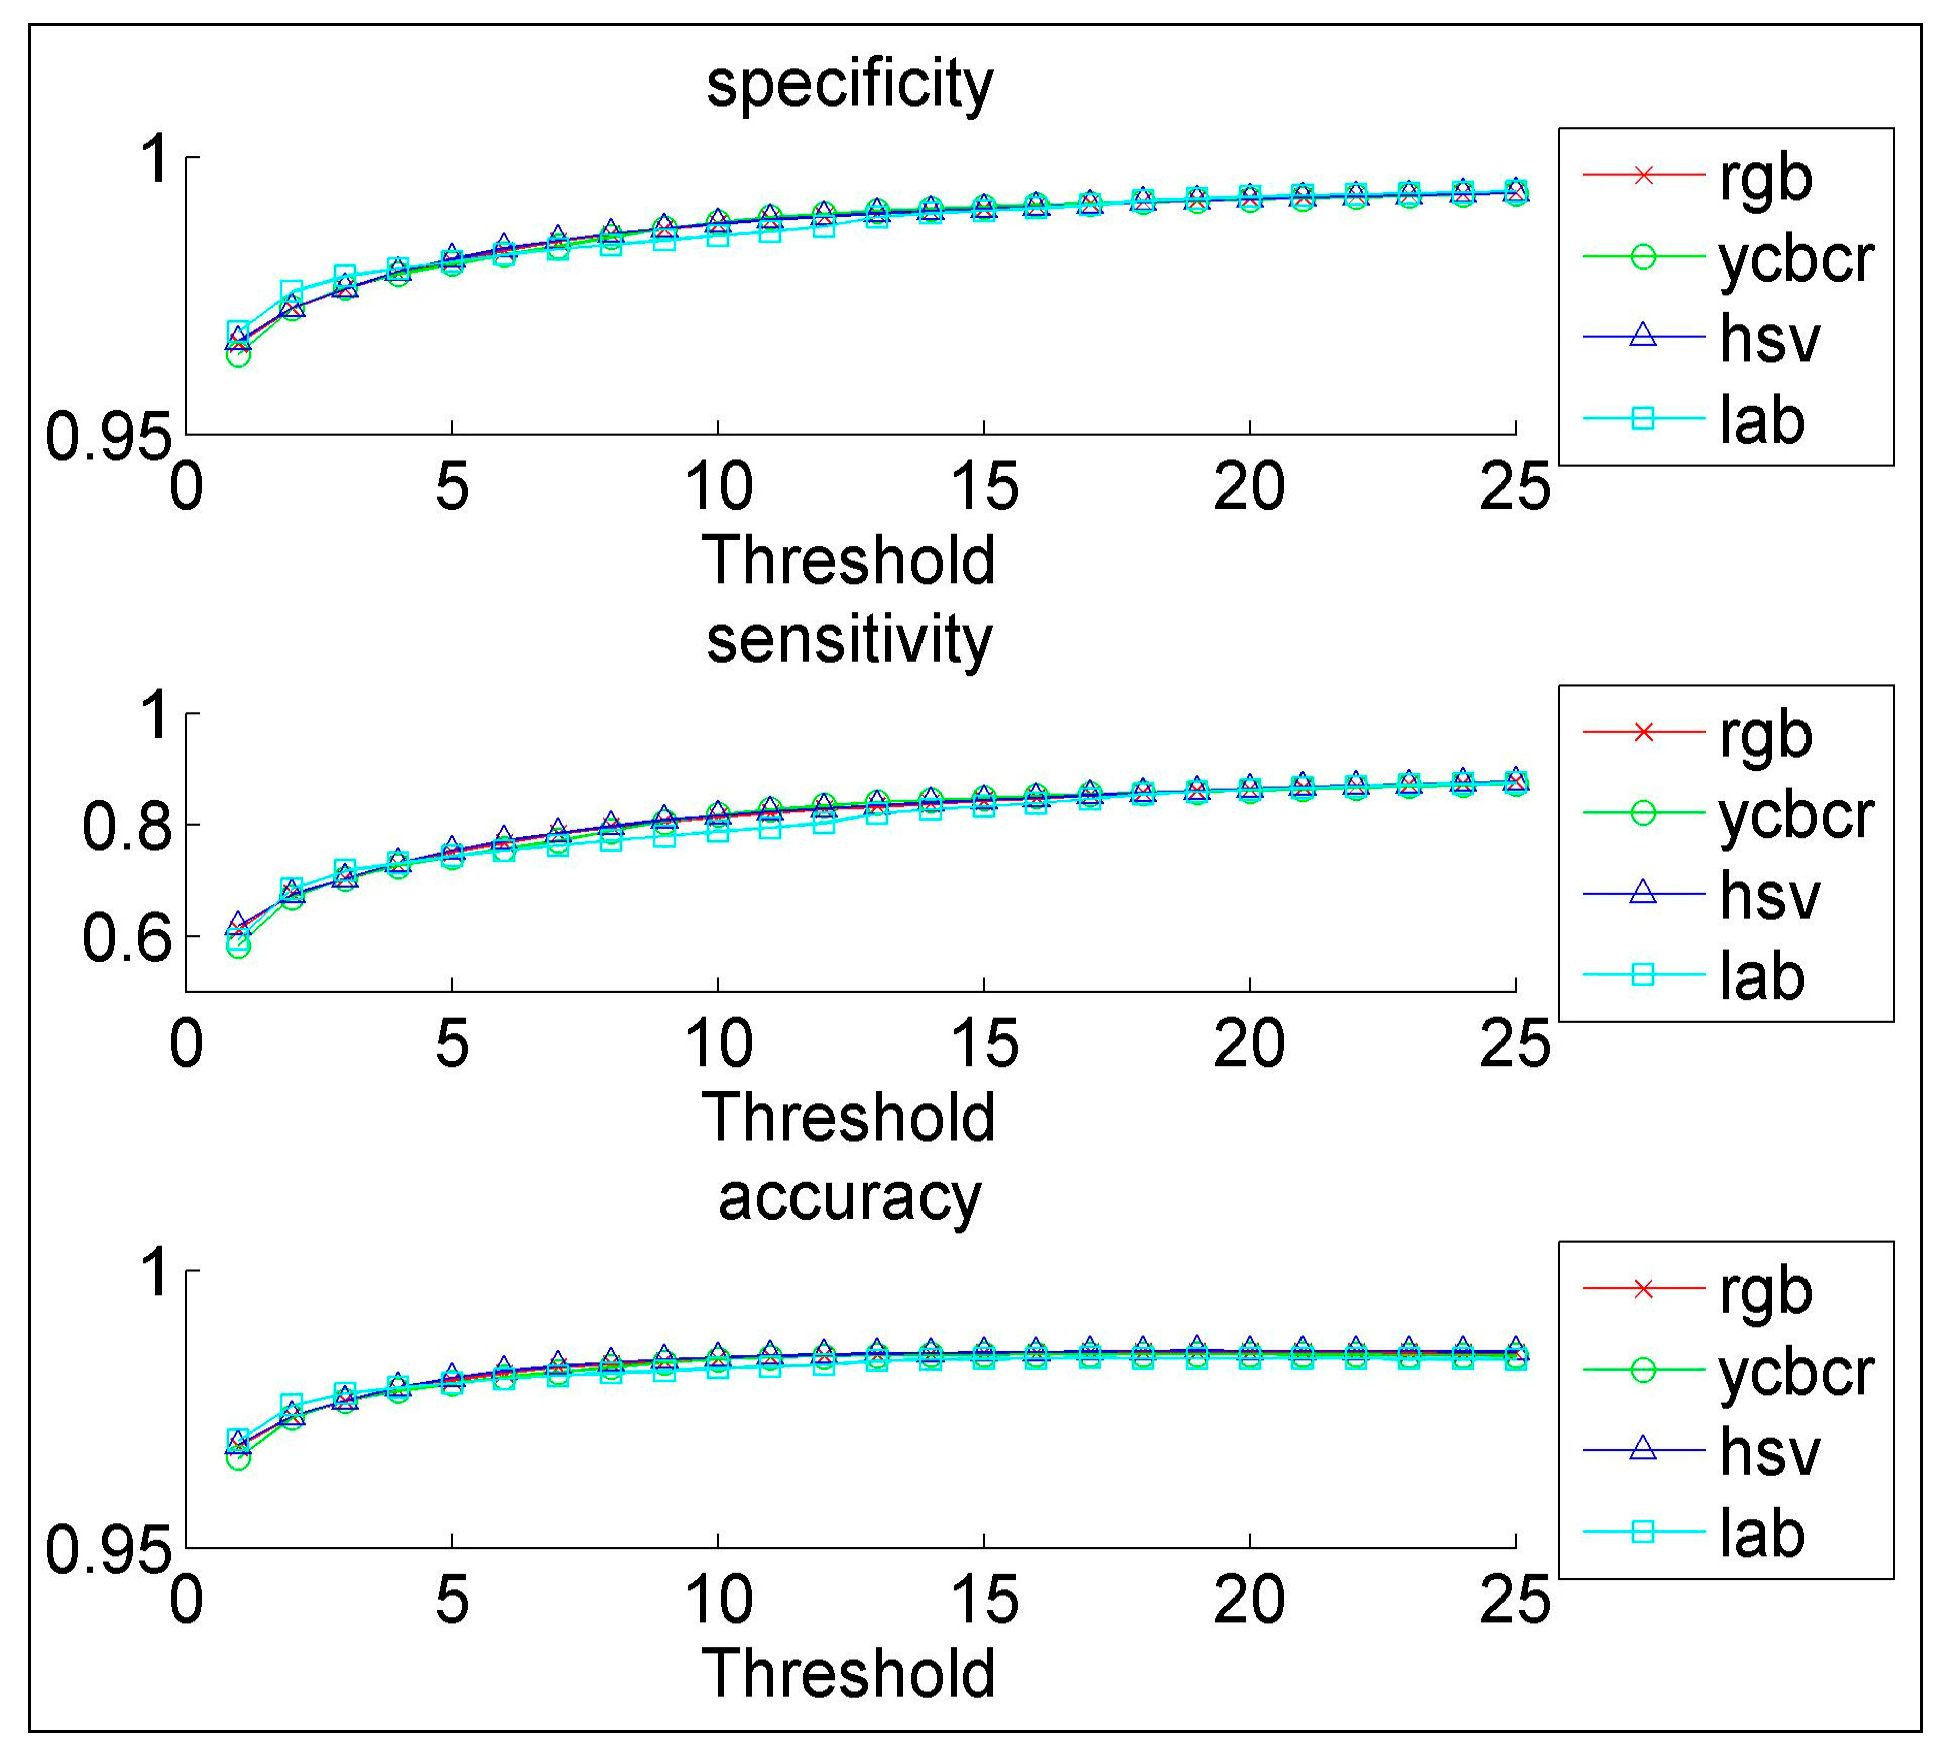
Ground-truth data was obtained for the training, and the Receiver Operating Characteristic (ROC) curves are computed to analysis the effect of color representation and color quantization. In the detection process, we computed the ROC curves for the four color representations (RGB, HSV, YCbCr, and L*a*b*) for five histogram resolutions (16, 32, 64, 128 and 256), then the Bayesian classifier was applied to the test images. We noted that the HSV and the RGB maintain a strong performance across all the resolutions. Furthermore, the HSV and RGB with histogram resolution greater than or equal to 64 and a higher threshold, seem slightly more suitable for our purposes as shown in Figure 4 and Table 1. Figure 4 shows that the larger the threshold becomes, the better the performance [17], and Table 1 compiled the best accuracy scored by the four color spaces for the different histogram resolutions.
Figure 4. The performance measurement in the four color spaces for histogram resolutions of 64 bins.
Algorithms 08 01088 g004
Table 1. Best accuracy for each color space/quantization combination.
Bins/Colors SpacesRGBYCbCrHSVL*a*b*
160.98430.98260.98480.9823
320.98500.98380.98520.9820
640.98530.98490.98550.9842
1280.98570.98530.98590.9851
2560.98610.98580.98610.9856
In the sputum cell segmentation, we have analyzed the results of the mean shift in gray level feature space and compared them to the results obtained from the Hopfield Neural Network (HNN) proposed in [11]. Table 2 represents a comparison between the HNN, gray mean shift, and gray-space mean shift methods, respectively. We can see that the gray-space mean shift achieves the best performance, especially for accuracy. In addition, we noticed that the HNN performance is significantly below the other methods. This result suggests that the gray level density estimation is an appropriate technique for segmenting the nucleus.
Table 2. Performance of the nucleus segmentation algorithms.
Performance/AlgorithmHNNGray Mean ShiftGray-Space Mean Shift
Sensitivity73.77%92.7%93.40%
Accuracy65.01%85.43%87.11%
The only drawback of the mean shift algorithm is the computation cost. The complexity of the mean shift algorithm is O ( n 3 ), where n is the size of the data set. It is certainly possible to reduce this time complexity to O (nlogn), by using better storage of the data, when only neighboring points are used in the computation of the mean.

4. Feature Extraction

After detecting the nucleus and cytoplasm area in the cell, we extracted different features, which will be used in the diagnostic process for detecting the cancer cells. The main problem that faces any CAD systems for early diagnosis of lung cancer is associated with the ability of the CAD system to discriminate between normal and abnormal cells (cancer cells). Thus, using the appropriate features we can reduce or eliminate the number of misclassifications. In the literature, different features have been proposed depending on the adopted decision method. In our proposed CAD system, we used the following features: Nucleus to Cytoplasm (NC) ratio, perimeter, density, curvature, circularity and eigen ratio.
The first feature is the NC ratio, which is computed by dividing the nucleus area (total number of the pixels in the nucleus region) over the cytoplasm area (total number of pixels in the cytoplasmic region), as follows:
NC ratio = Area  ( Nucleus ) Area ( Cytoplasm ) × 100
Therefore, based on medical information, the morphology, the size, and the growing correlation of the nuclei and their corresponding cytoplasm regions, reflect the diagnostic situation of the cell life cycle, bearing in mind that cancerous cells are characterized by oversized nucleus-relatively to the cytoplasm.
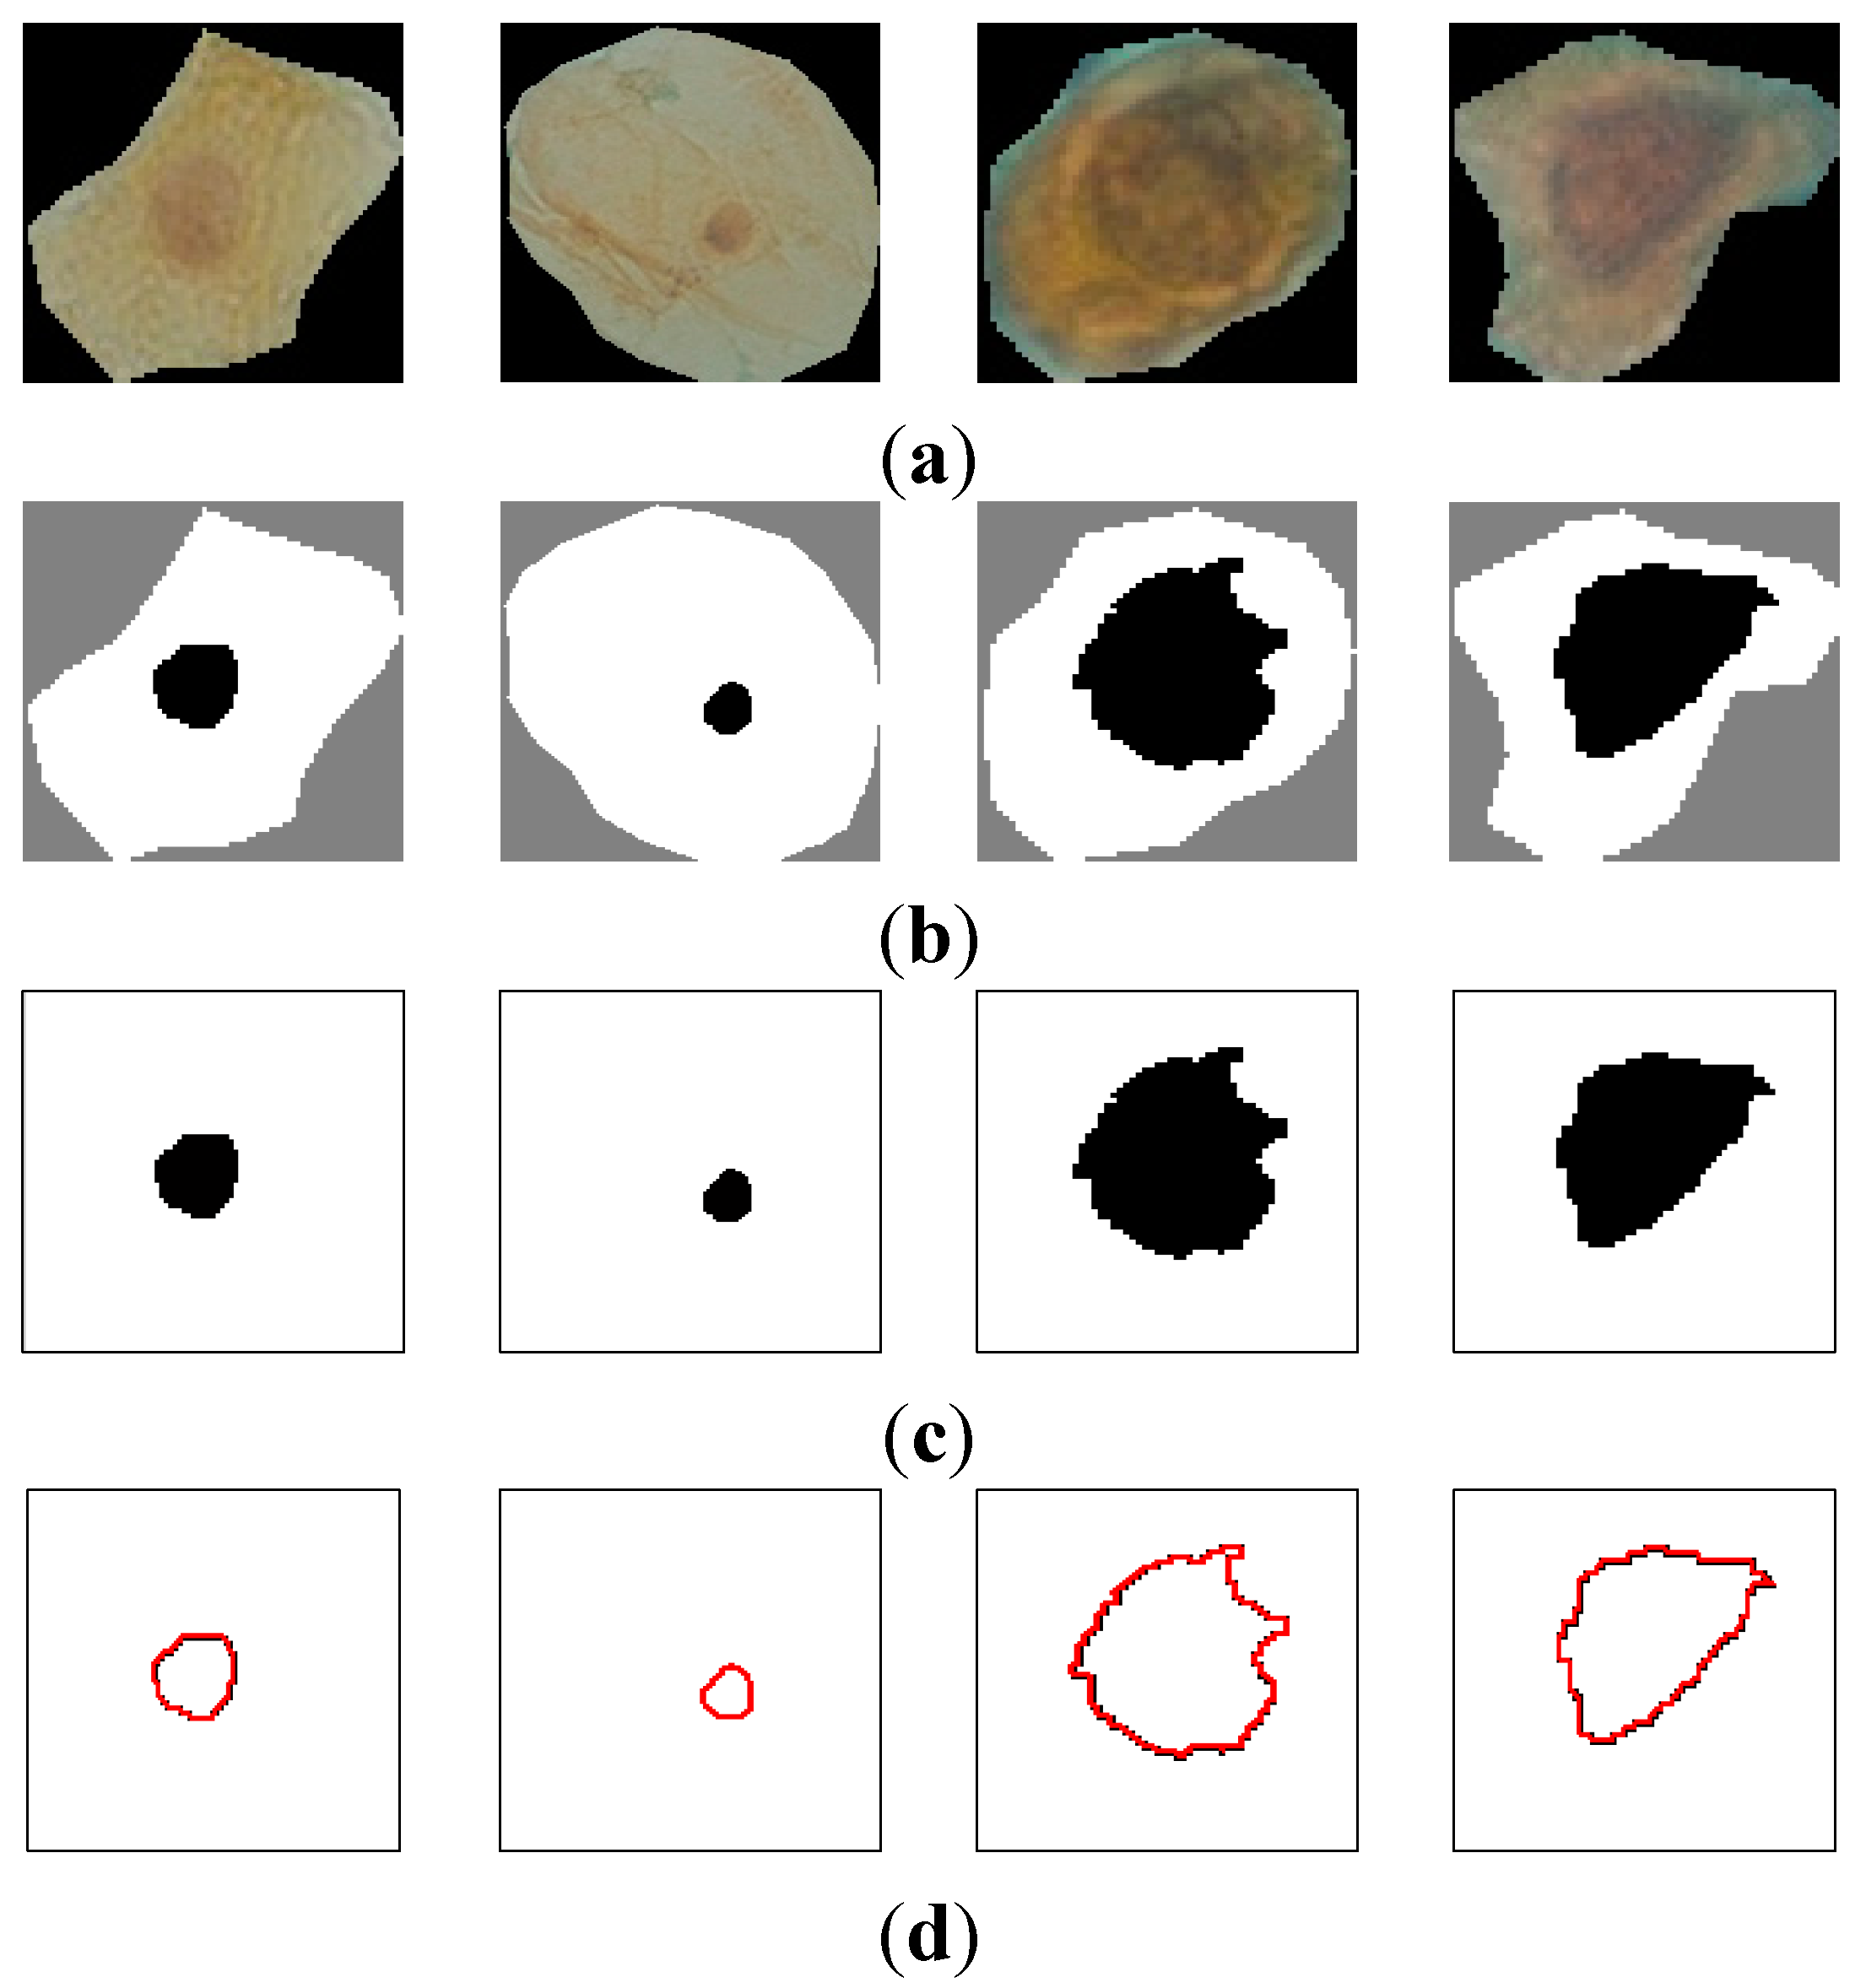
Figure 5a shows samples of extracted nuclei and cytoplasm. Figure 5b depicts the nucleus and cytoplasm extraction where the black and white areas represent the nucleus and the cytoplasm respectively. Figure 5c shows the nucleus area.
The second feature is the nucleus perimeter defined by:
P ( Nucleus ) = t x 2 ( t ) + y 2 ( t ) d t
where x(t) and y(t) are the parameterized contour point coordinates. In the discrete case, x(t) and y(t) are defined by a set of pixels in the image. Thus, Equation (4) is approximated by:
P ( Nucleus ) = i ( x i x i 1 ) 2 + ( y i y i 1 ) 2
Figure 5d depicts the perimeter area in color red for the nuclei cell in Figure 5c.
Figure 5. (a) raw sputum cells; (b) nucleus and cytoplasm segmentation; (c) nucleus region; (d) the perimeter of the nucleus area.
Algorithms 08 01088 g005
The third feature representing the density is based on the darkness of the nucleus area after staining with a certain dye, thus it is based on the mean value of the nucleus region. The mean value represents the average intensity value of all pixels that belong to the same region, and in our case, each mean value is represented as a vector of RGB components, and is calculated as follows for a given nucleus:
Mean ( Nucleus ) = i = 1 N Intensity ( i ) Area ( Nucleus )
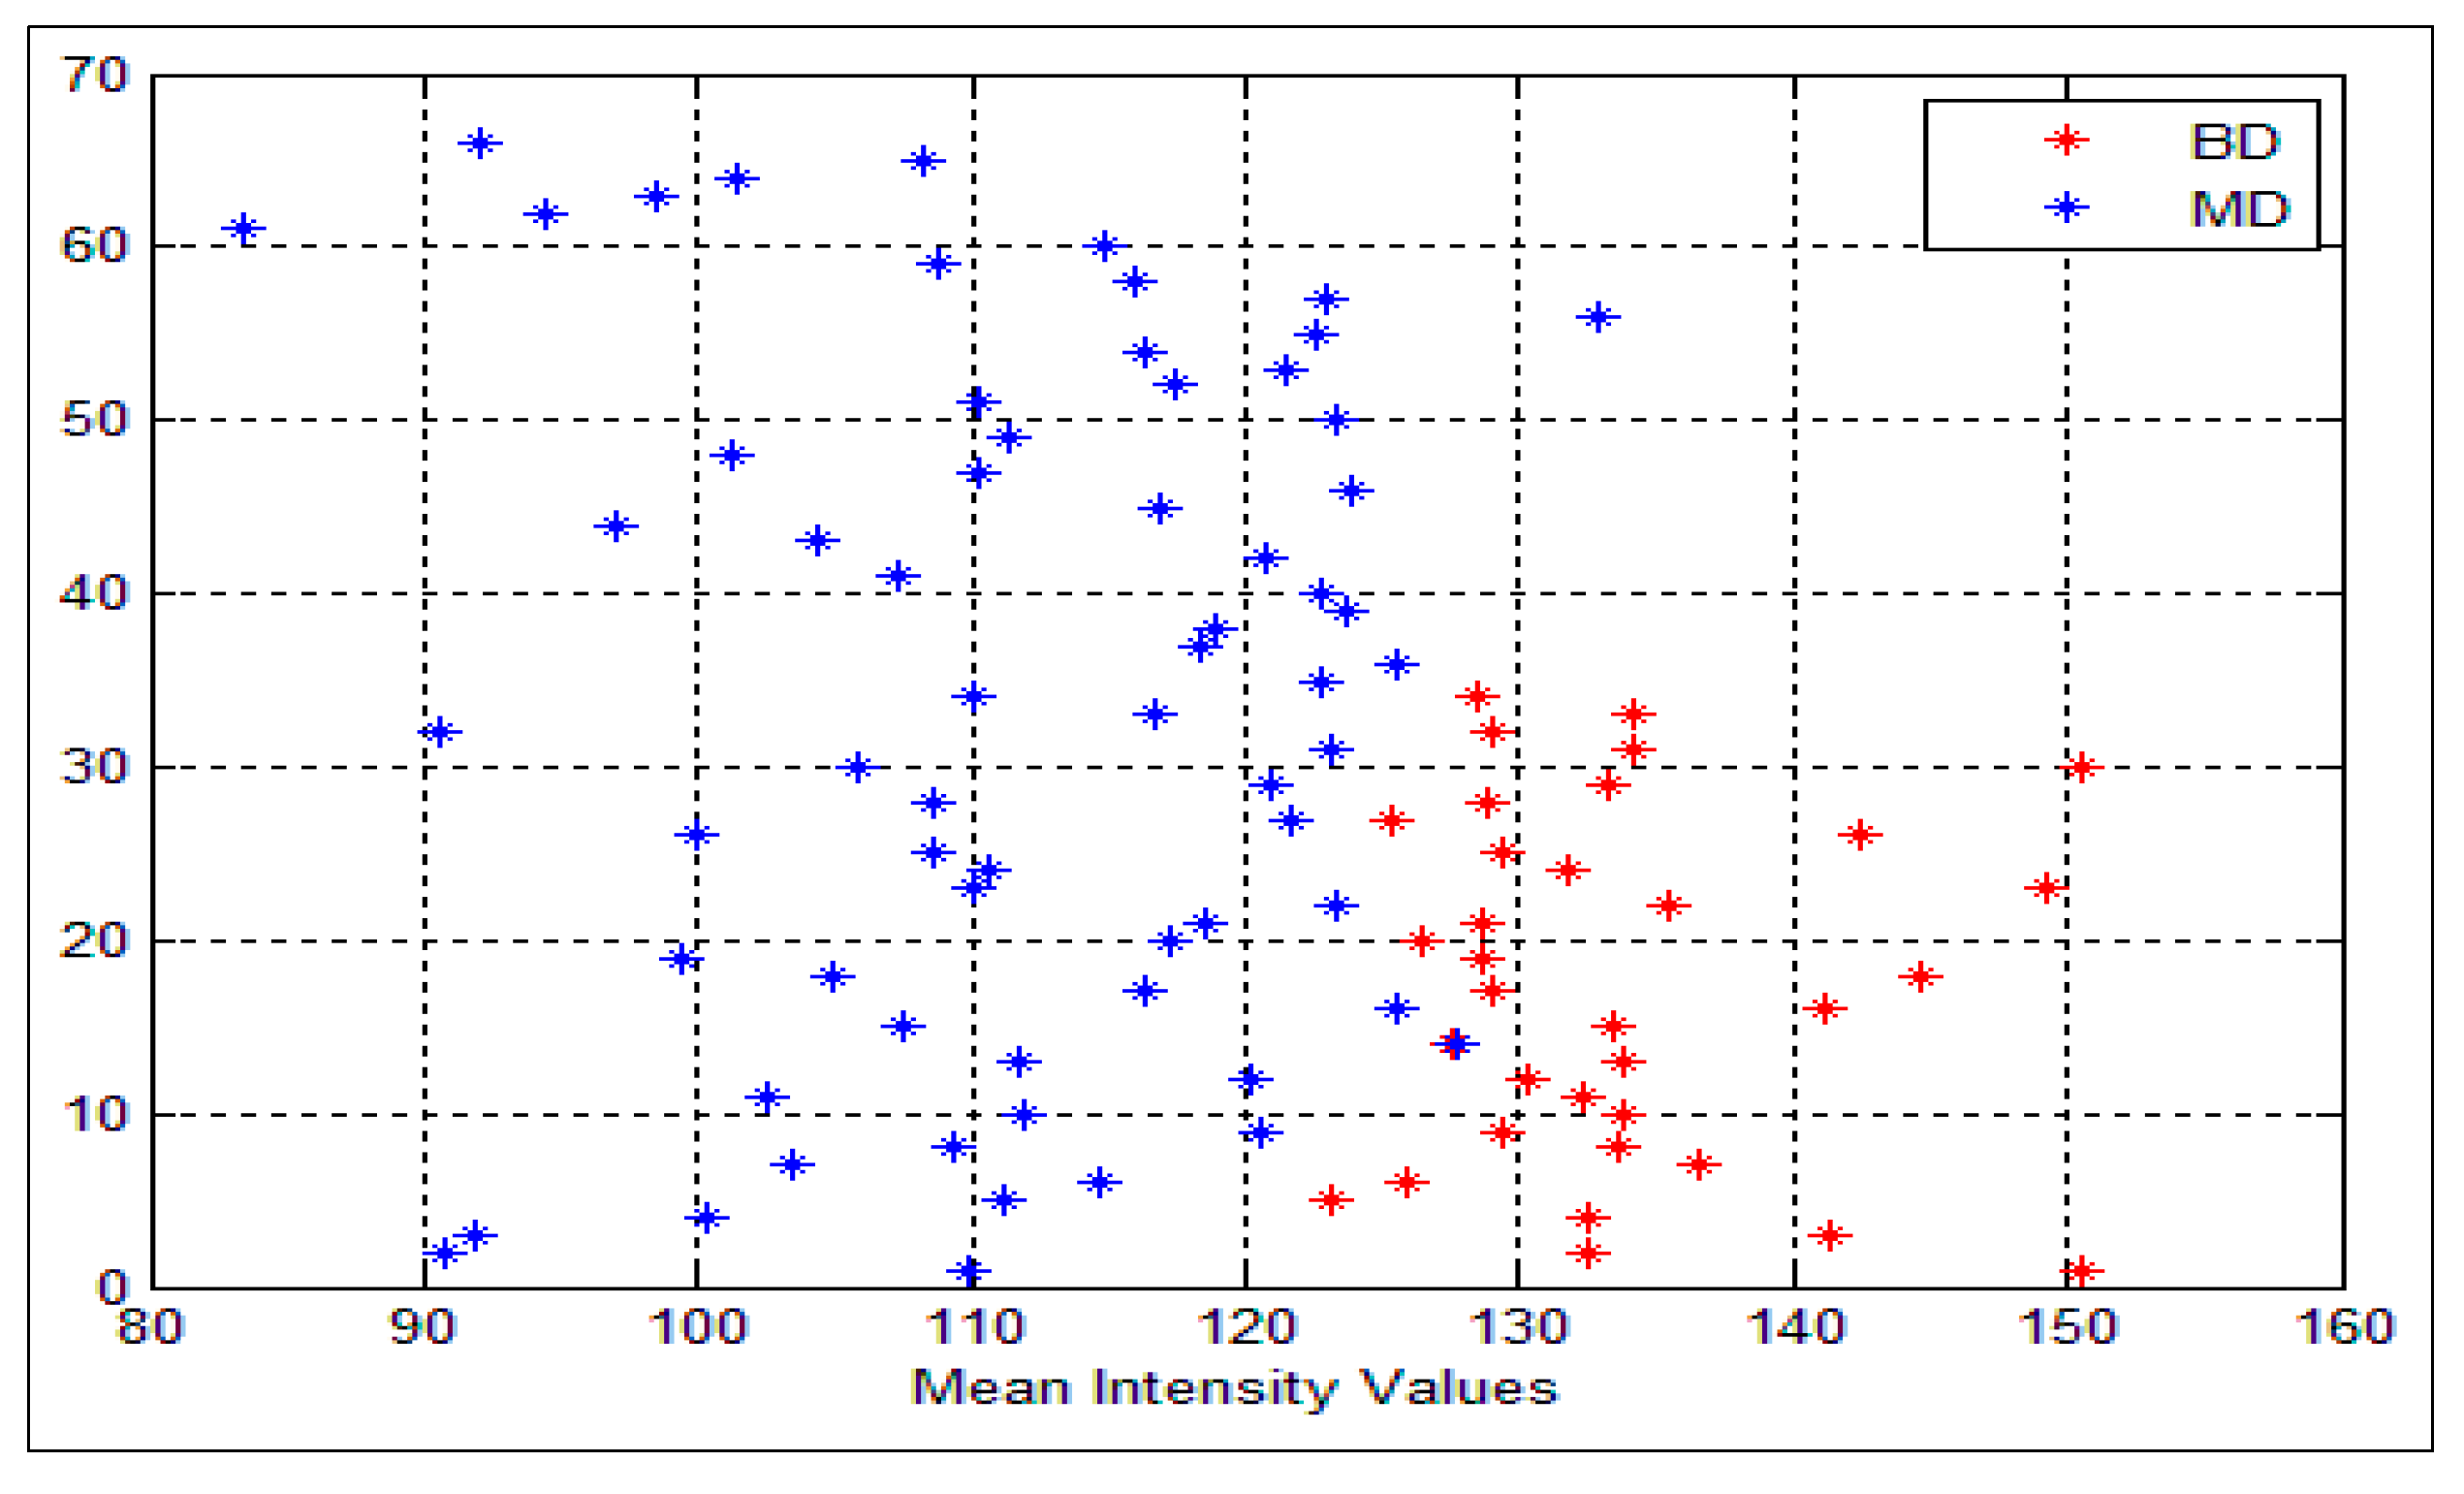
where i is the intensity color value and N is the total number of the pixels in the nucleus area. Figure 6 shows the mean intensity values for both benign and malignant cells. As can be seen, all the values that are greater than or equal to the threshold value θ are classified as benign cells (color red) and, the other values which are less than θ are classified as malignant (color blue), BD and MD refer to the benign and malignant density respectively. In our system θ = 128. Nevertheless, some overlapping does exist, where very few malignant cells are classified as benign cells (FN) and vice versa. In this situation, we cannot consider the intensity feature alone.
The fourth feature is the curvature, which is delineated by the rate of change in the edge direction. This rate of change characterizes the points in a curve which are known as corners where the edge direction changes rapidly [18]. A lot of significant information can be extracted from these points. The curvature at a single point in the boundary can be defined by its adjacent tangent line segments. The difference between slopes of two adjacent straight line segments is a good measure of the curvature at that point of intersection [19]. The slope is defined by:
φ ( t ) = tan 1 ( y ˙ ( t ) x ˙ ( t ) )
where x ˙ ( t )   and y ˙ ( t ) denote the derivative of x(t) and y(t). We computed the difference between adjacent slopes (δθ) for each point in the nucleus contour.
Figure 6. Intensity variances for the nuclei cells, the blue represents the malignant cells (MD) and the red represents the benign cells (BD).
Algorithms 08 01088 g006
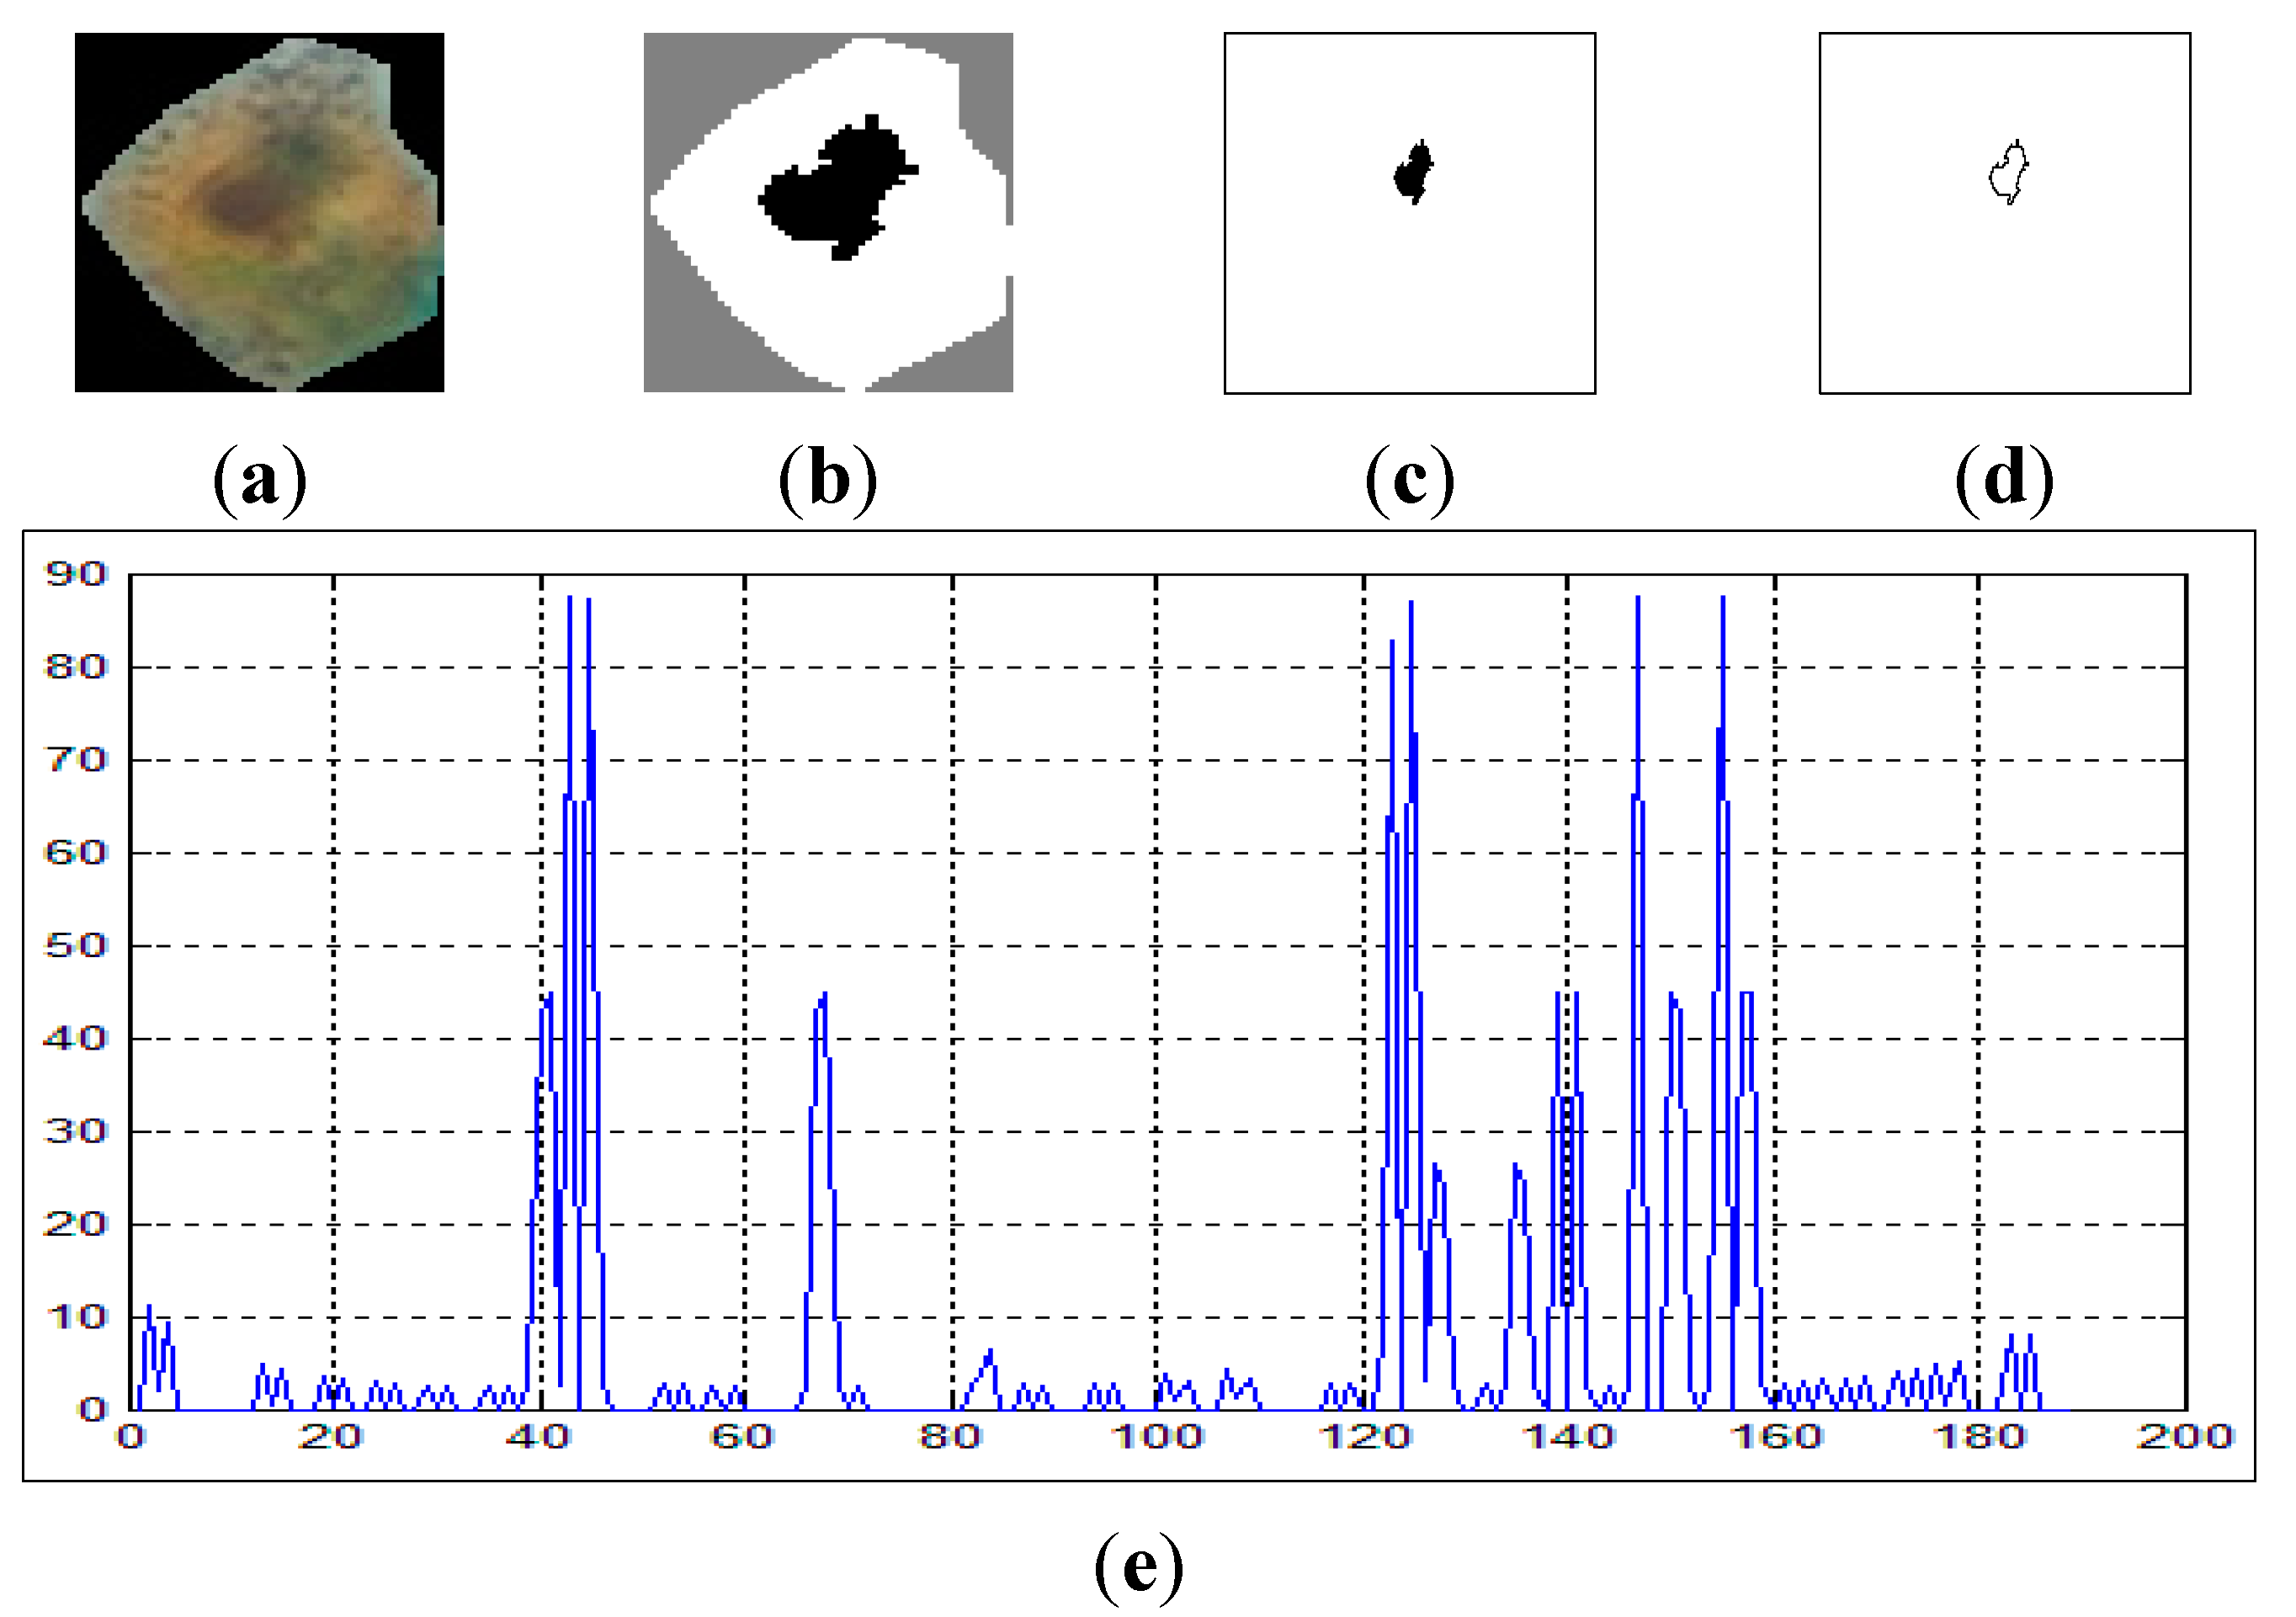
In our data, we found that in the case of malignant cells, δθ goes above a threshold estimated to 50. Figure 7 shows the curvature extraction (δθ) of the benign cell. Figure 7a shows the benign sputum cell and Figure 7d shows the boundary, which is used to compute the curvature. Figure 7e depicts the curvature where the x-axis represents the slope between the points in the image boundaries and the y-axis represents the curvature. As can be seen from this figure, all the lines are between 0° and 45°, and no line exceeds our δθ = 50.
Figure 7. The curvature extraction of a benign cell. (a) Sputum cell; (b) Nucleus and cytoplasm segmentation; (c) Nucleus extraction; (d) Nucleus boundary and (e) reflects the curvature plot for the image boundary in (d).
Algorithms 08 01088 g007
On the other hand, Figure 8 shows the curvature extraction of a malignant cell. As can be seen from Figure 8e, there are some lines in the curvature (y-axis) which exceed δθ = 50, and this is a clear reflection of the irregularities in the boundary of the cell.
Figure 8. The curvature extraction of a malignant cell. (a) sputum cell; (b) nucleus and cytoplasm segmentation; (c) nucleus extraction; (d) nucleus boundary and (e) reflects the curvature plot for the image in (d).
Algorithms 08 01088 g008
The fifth feature is the circularity, which is a feature that describes the roundness of the nucleus, and is defined as
Circularity = 4 π Area ( Nucleus ) Perimeter ( Nucleus ) 2
Cells in cleavage are normally round, so their roundness value will be higher. On the other hand, normal growing cells are irregular so their roundness value will be lower. For the circularity, it should be less than or equal to 1 within the threshold ratio, to distinguish between normal and abnormal cells, where 1 means a perfect circle [20].
The last feature is the Eigen ratio [21]. In our system, irregular cells are long, thus expected to have a higher Eigen ratio than that of round floating cells. Thus, using a proper threshold value we can distinguish between benign and malignant cells with this feature. The Eigen ratio is computed as follows:
Eigen _ ratio = a b + b a 2
where (a, b) are the eigenvalues of the covariance matrix C, defined by:
C = 1 N i = 1 N p i p i T
where p i is a point in the nucleus area. The eigenvalues (a, b) are used to show the direction of the cell distribution in the nucleus region in the horizontal direction by using value of (a) and in the vertical direction by using value of (b).
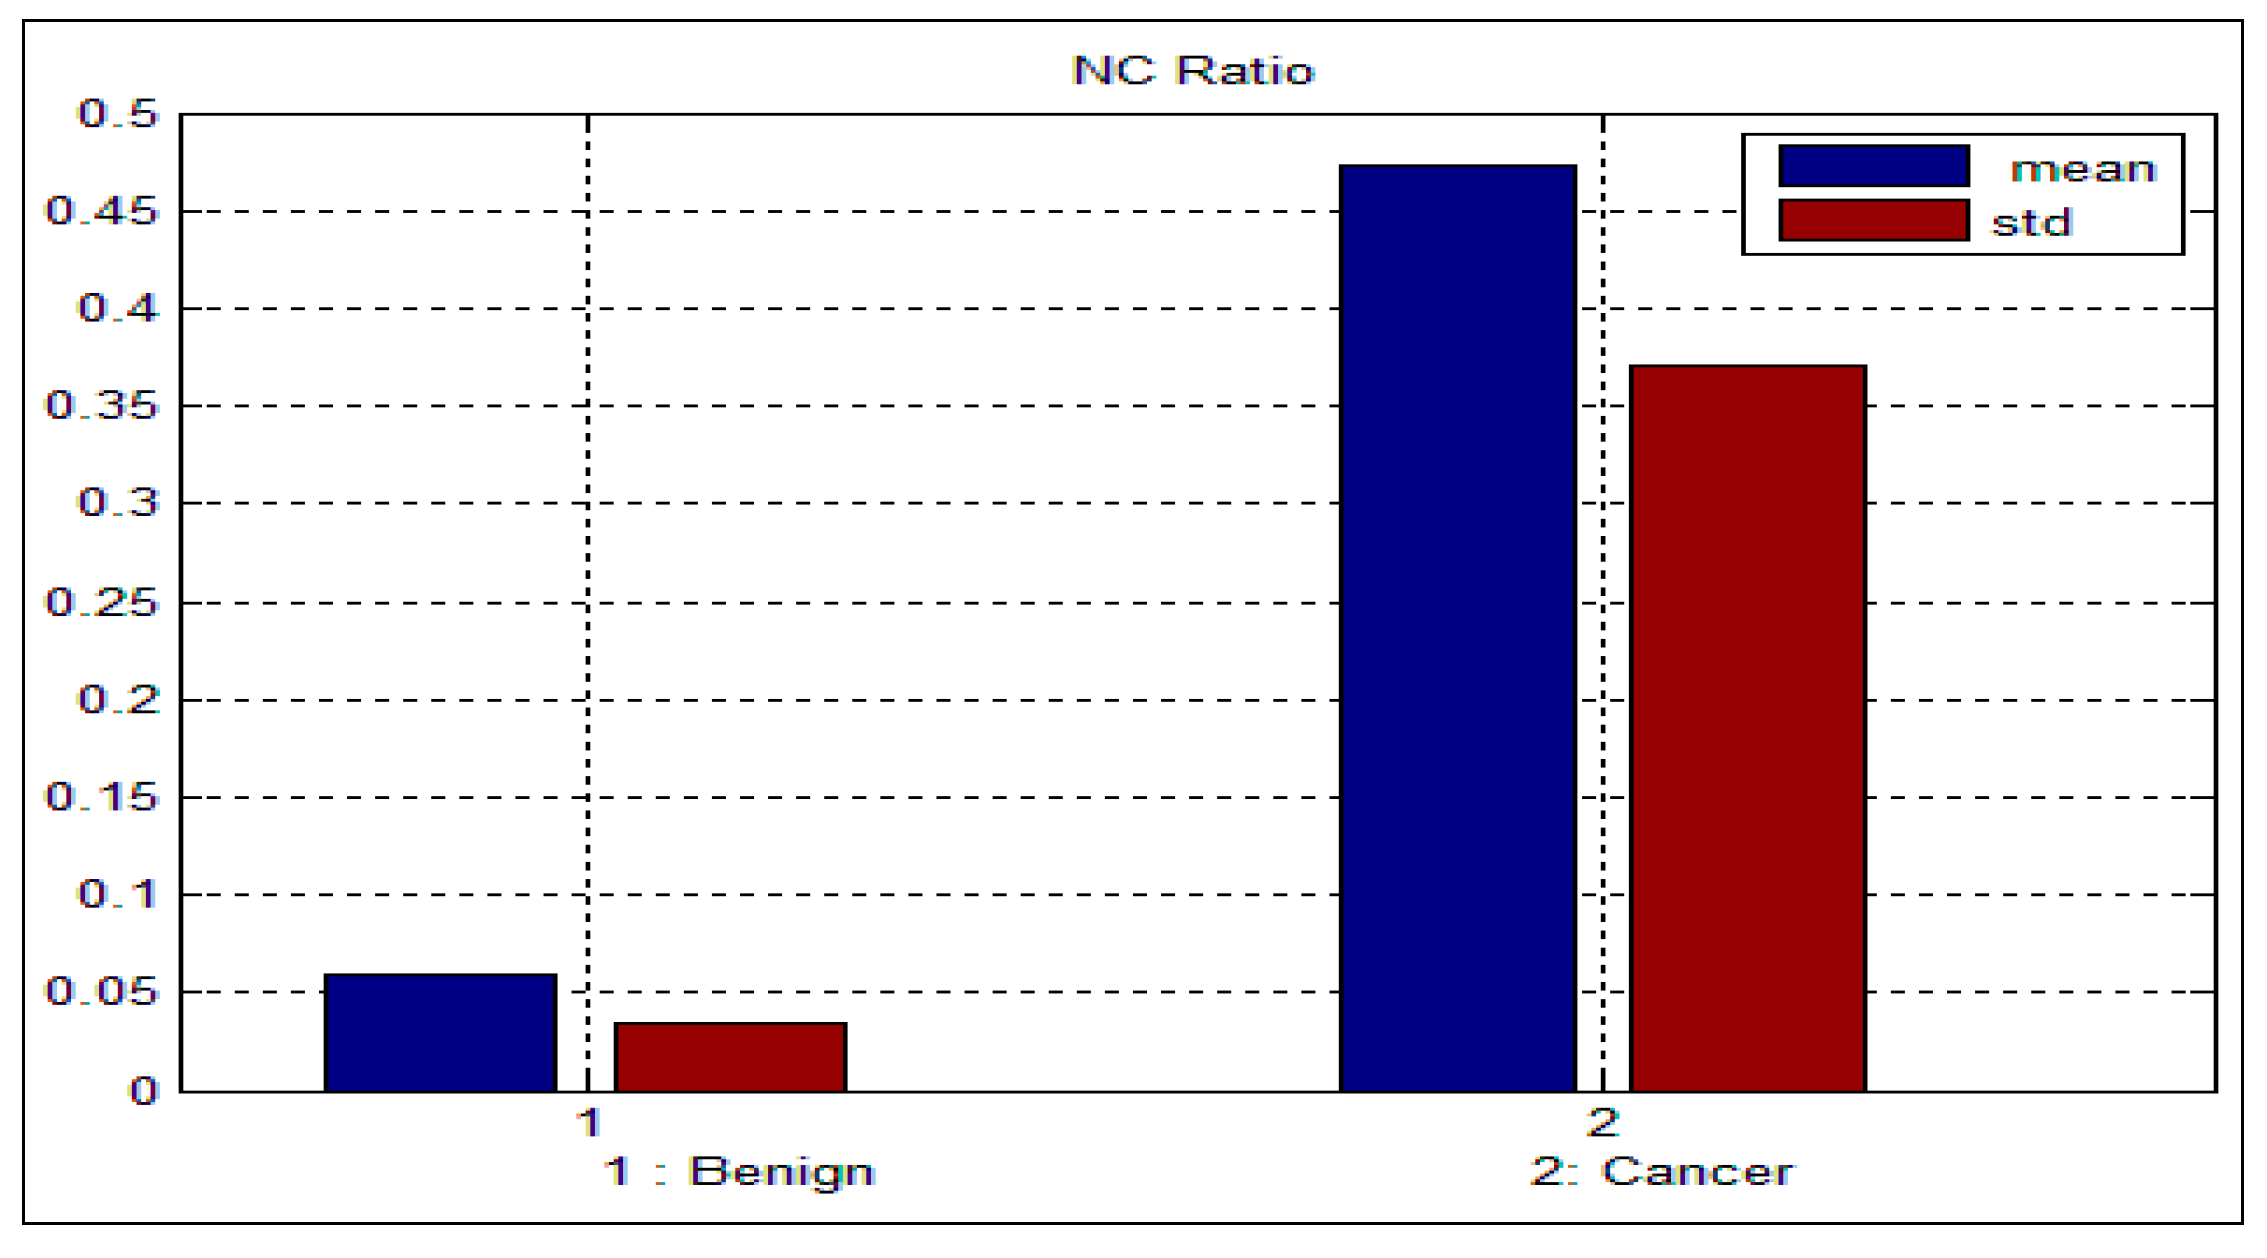
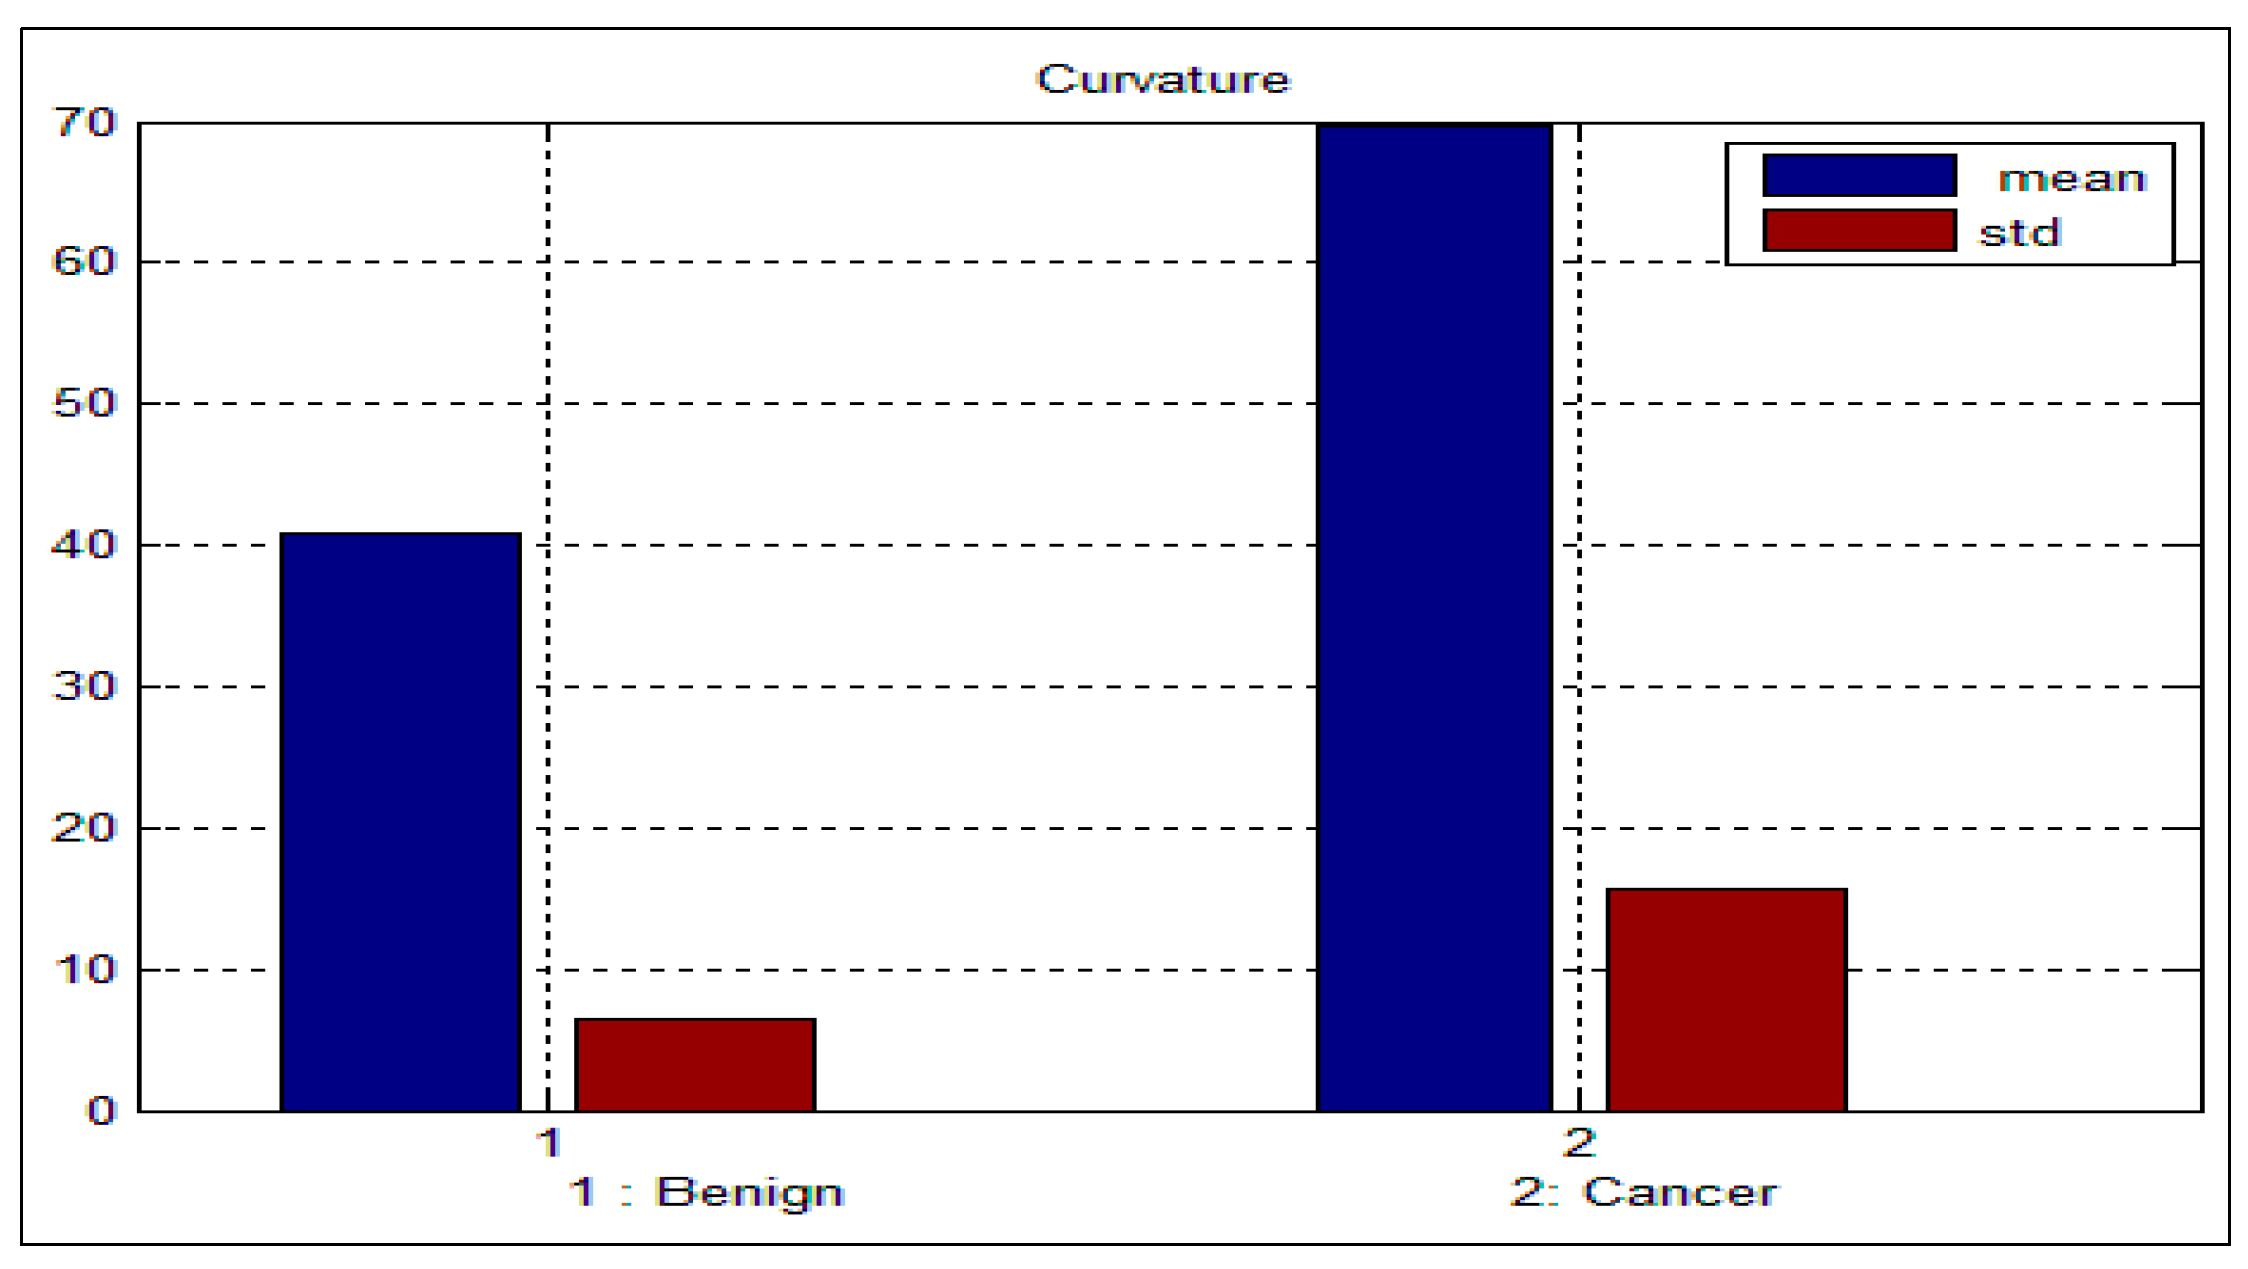
Table 3 and Table 4 depict the mean and standard deviation (std) for the benign and malignant cells, respectively. As can be seen from these two tables, there is a big difference between the mean and std for benign and malignant cells, thus indicating the potential of the proposed features for discriminating between benign and malignant cells. In addition to this, the NC ratio and the curvature show the possibility of linear separation between the benign and malignant cells. Figure 9 and Figure 10 show the bar chart of the mean and standard deviation for the malignant and benign cells for the NC ratio and curvature.
Table 3. Mean and standard deviation for the benign sputum cell.
FeaturesNCratioPerimeterDensityCurvatureCircularityEigen Rati
Mean0.0687.8128.340.880.441.21
Std0.0327.99.56.460.120.22
Table 4. Mean and standard deviation for the malignant sputum cell.
FturesNCratioPerimeterDensityCurvatureCircularityEigen Rati
Mean0.47124.3113.469.590.551.42
Std0.3741.112.115.570.160.22
Figure 9. Mean and standard deviation for the NC ratio.
Algorithms 08 01088 g009
Figure 10. Mean and standard deviation for the curvature.
Algorithms 08 01088 g010

5. Classification

Classification technique plays a significant role in medical imaging, especially in the detection and classification of tumors [22]. Thus, lung cancer classification is a critical task for a CAD system because it is the final step in a system where best outcomes are achieved based on the available features. The main objective of the proposed CAD system is to obtain a high level of true positive rates even for small cells and a low number of false positives. In this work we implemented and compared two different classification methods, namely: artificial neural network (ANN), and support vector machine (SVM).

5.1. Artificial Neural Network

Artificial neural network (ANN) is one of the major approaches in the field of medical image classification, because of its inherent function approximation and decision-making capability. In this work we applied neural network-supervised learning with its specification (multilayer perceptron, MLP) at three layers (input, hidden and output layers) [23] to the sets of input data which were obtained from features extracted from the sputum color images. This architecture is widely used in the field of cytology. The input data of the ANN has been normalized in the range of 0 to 1, as the ANN works better in this range as proven by [24].
For a given data set { x i , y i } i = 1 N , the unknown function, y = f ( x ) is estimated.
In this work, we used a feedforward neural network, which takes a row vectors of M hidden layer sizes, and a backpropagation training function, and returns a feedforward neural network. The relationship between the input neurons (xi, i = 1, 2, ….., n1), and the output neurons (Yk, k = 1, 2, …., N) which are connected by the hidden neurons (hj, j = 1, 2, …, m1), is determined with the equation:
Y k = g [ j = 1 m 1 w k j g ( i = 1 n 1 w j i x i + θ i n 1 ) + θ h i d ]
where g(z) = 1/(1 + ez), wkj is the weight from jth hidden neuron to the kth output neuron, wji is the weight from the ith input neuron to the jth hidden neuron, θin1 is a bias neuron in the input layer, and θhid is another bias neuron in the hidden layer. Furthermore, for each of the processing neurons in the ANN, an activation function is used which is a nonlinear sigmoid function defined as follows [25]:
  O p j = 1 1 + exp ( i w j i O p i + θ j )
where Opj is the jth element of the output pattern produced by the input pattern Opi. After that, the backpropagation function is used to adjust the weights between pairs of neurons iteratively in a way that minimizes the difference between the actual output values and the desired output values. Initially, the weights are randomly assigned, and the adjusted weights are calculated as:
Δ w j i ( k 1 + 1 ) = n l δ p j O p i + α Δ w j i ( k 1 )
where nl is the learning rate which equal to 0.3, α is the momentum term used to determine the effect of past weight changes on the current changes and its value is 0.9, k1 is the number of iterations, and δpj is the error between the desired and actual ANN output values.
The final weights in ANN can be determined when either error δpj becomes smaller than a threshold value (e.g., 0.001), or training iteration number k1 has reached another threshold value (e.g., 3000). Another important decision when using ANN is the number of hidden layers. Usually the network requires enough hidden neurons to make a good separation between different classes (e.g., true positive and false positive abnormalities in medical images). The number of hidden nodes is varied based on the constant value of epochs selected (from 5 to 10).
Finally, the best trained network is used for classification processing of sputum color images into benign and malignant. The evaluation for the ANN is done by using a test data set on the trained network to validate that the acquired mapping is of satisfactory quality.

5.2. Support Vector Machine

The support vector machine (SVM) is one of the most effective classification methods that has recently received considerable attention since its introduction by Vapnik [26]. It is based on the definition of an optimal separating hyperplane (OSH) that separates the training data. It employs a supervised learning approach by labeling the training data with the output class. These are also known as maximum margin classifiers as they simultaneously minimize the empirical risk. The aim of SVM is to determine the optimal hyperplane by maximizing the margin between the separator hyperplane:
{ h | w , h + w 0 = 0 }
and the mapped data Φ ( s i ) , where ˂w, h˃ denotes the inner product in space , and w are the hyperplane parameter. Such optimal hyperplane is often considered as the solution of the following Quadratic Programming problem:
min w , w 0 , ξ i , , ξ N ( 1 2 | | w 2 | | + C i = 1 N ξ i )
Subject to
y i ( w , Φ ( s i ) + w 0 ) 1 + ξ i 0  i = 1 , , N ξ i 0   i = 1 , , N
where N is the number of training samples, ξ i are slack variables, which are introduced to take account of the eventual non-separability of Φ ( s i ) and C is a positive constant, which controls the trade-off between the slack variable and the size of the margin. The problem in the Equation (15) is solved by using the dual representation and the kernel trick, as:
max α l i , , α l N ( i = 1 N α l i 1 2 i , j = 1 N α l i α l j y i y j K ( s i , s j ) )
subject to
0 α l i C   i = 1 , , N
i = 1 N α l i y i = 0
where K ( s i , s j ) = Φ ( s i ) , Φ ( s j ) is the kernel function, which is introduced to avoid direct manipulation of the samples in , and α l i are Lagrange multipliers, which can be determined as the solution of a Quadratic Programming problem. In addition to this, SVM kernel is used to map training data implicitly into a higher dimensional feature space. Data vectors which are nearest to the OSH in the higher feature space are called support vectors and contain all information that is required for the classification.
Figure 11 depicts the SVM learning approach where a decision boundary separating the two classes is determined with the support vectors that define the margin. In addition, support vectors are considered the key players that define the decision boundary in any SVM. Furthermore, the objective of the SVM is to select the boundary that maximizes the margin, in other words, the boundary with the largest separation between the classes, so that the risk of over-fitting between the classes will be reduced to a minimum.
Figure 11. Diagram for SVM learning approach. The red line represents the first class, black line represents the margin, and the blue line represents the second class.
Algorithms 08 01088 g011
In this work, SVM classification with Gaussian kernel was used. Given that the number of training points is moderate, an SVM classifier with Gaussian kernel is considered as the state of the art choice for a given problem. The Gaussian kernel is defined as:
K ( x i , x ) = e x i x 2 / 2 σ 2
where xi belongs to the training data, x is the support vector and σ is the kernel width, and hyper-parameter of the method, by applying SVM Equation (20) with its specification to the input data (features extraction), the kernel seeks to map the input data to a higher dimensional feature space where the separation between the classes is possible with the output being two classes, e.g., benign and malignant cells. The major strengths of SVMs are the existence of one global minimum, they scale very well to high dimensional data, the trade-off between classifier complexity and error can be controlled explicitly, and the regularized empirical risk minimization overcomes over-fitting and weak generalization performance. On the other hand, the complexity of SVMs increases with the size of the training dataset.

5.3. Experiments

We conducted a comprehensive set of experiments to assess the classification techniques (ANN and SVM classifiers). These different classifiers were applied to the sets of the input data composed of the extracted features (NC ratio, perimeter, density, curvature, circularity and Eigen ratio) from the sputum cells. Different performance criteria: sensitivity, specificity and accuracy have been computed for these classifiers.
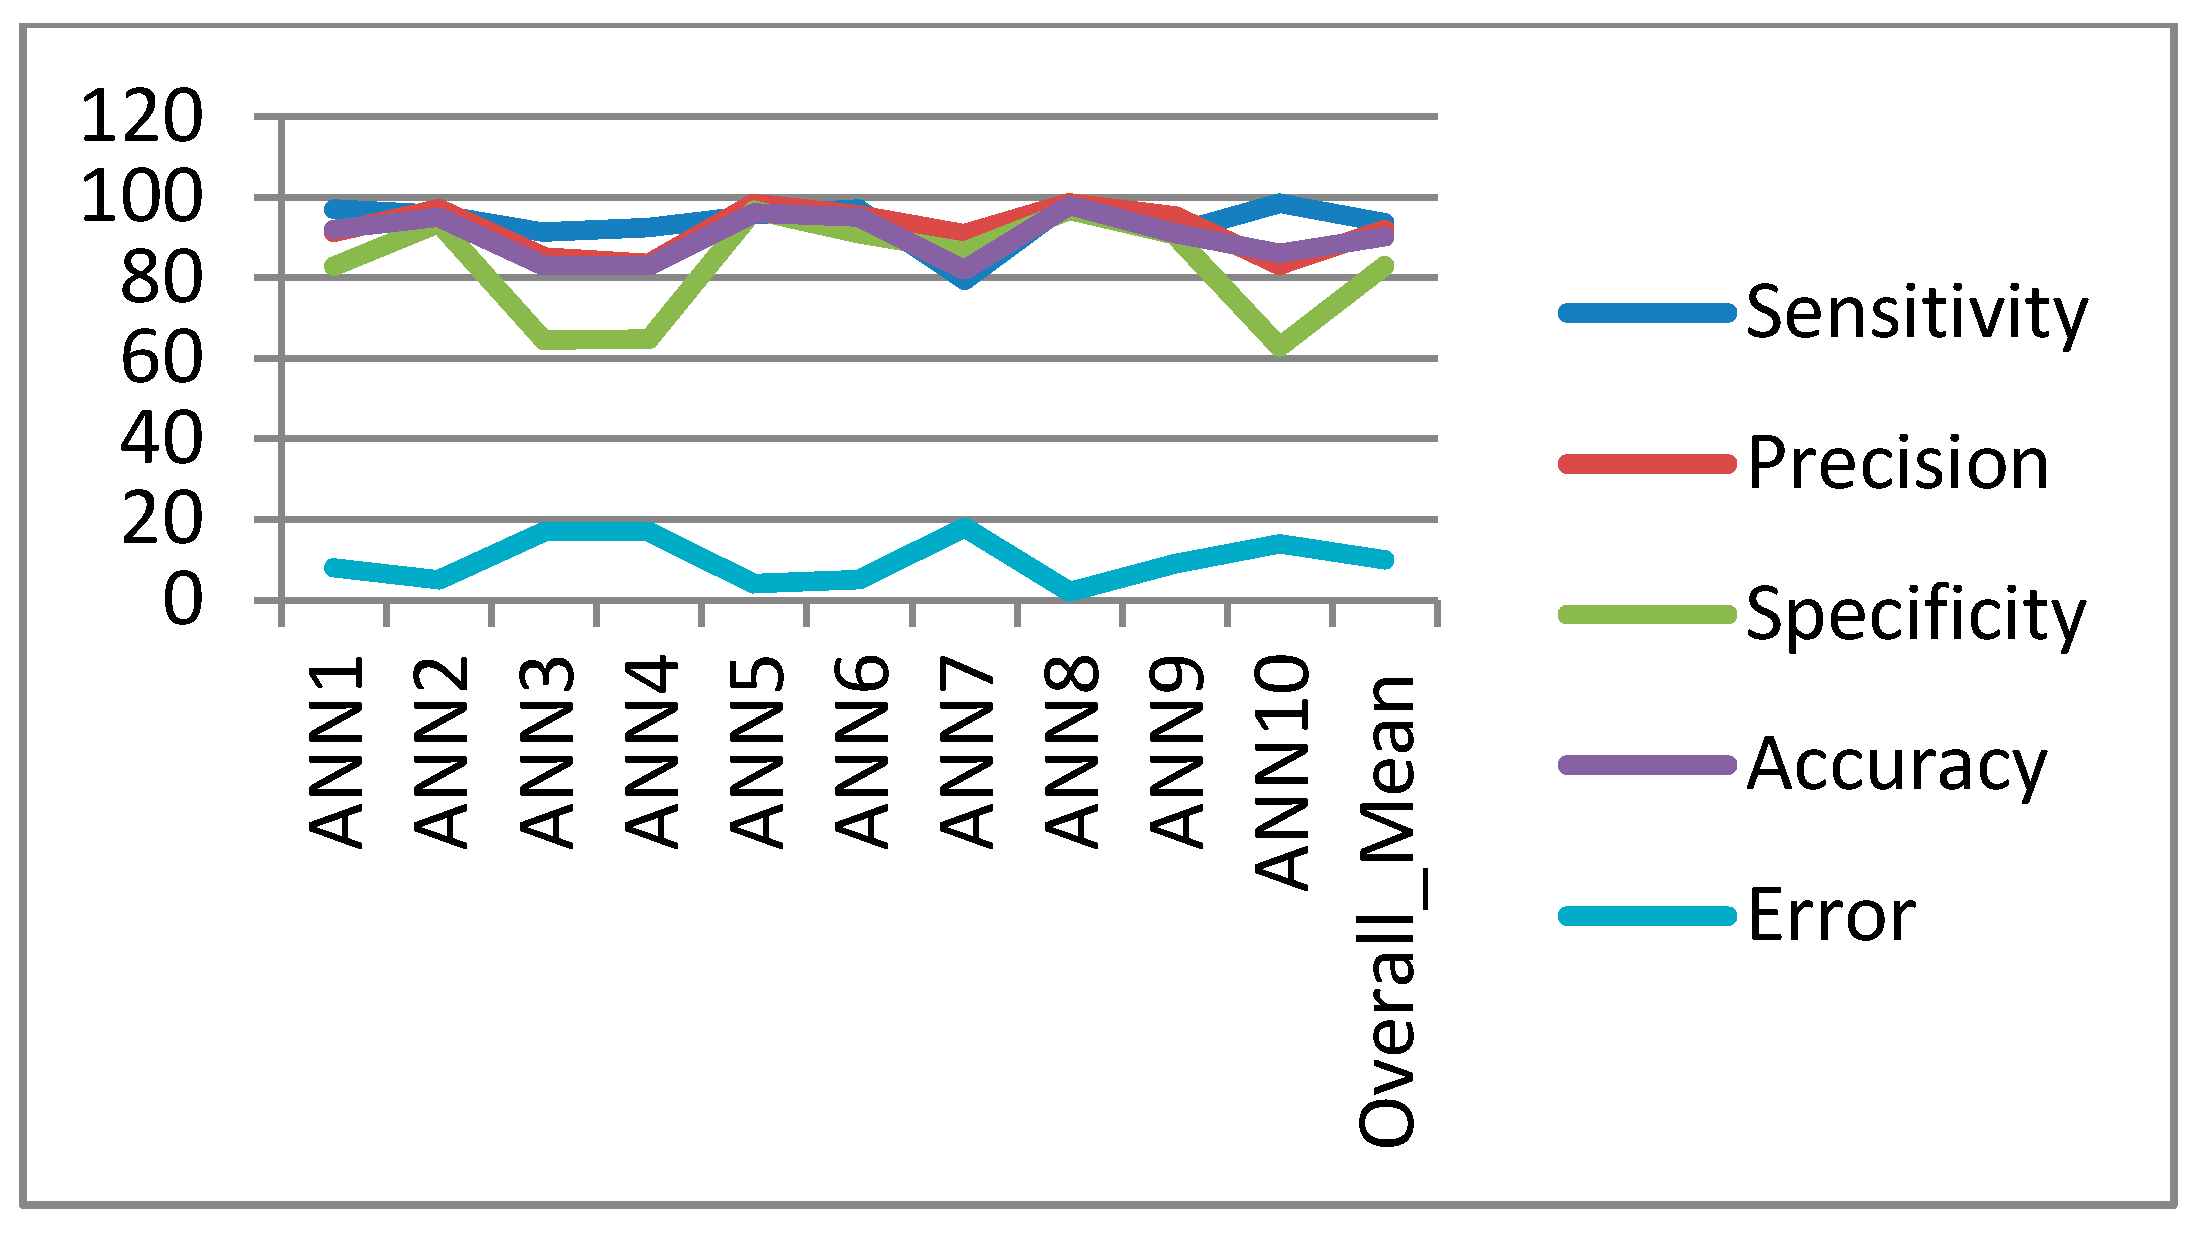
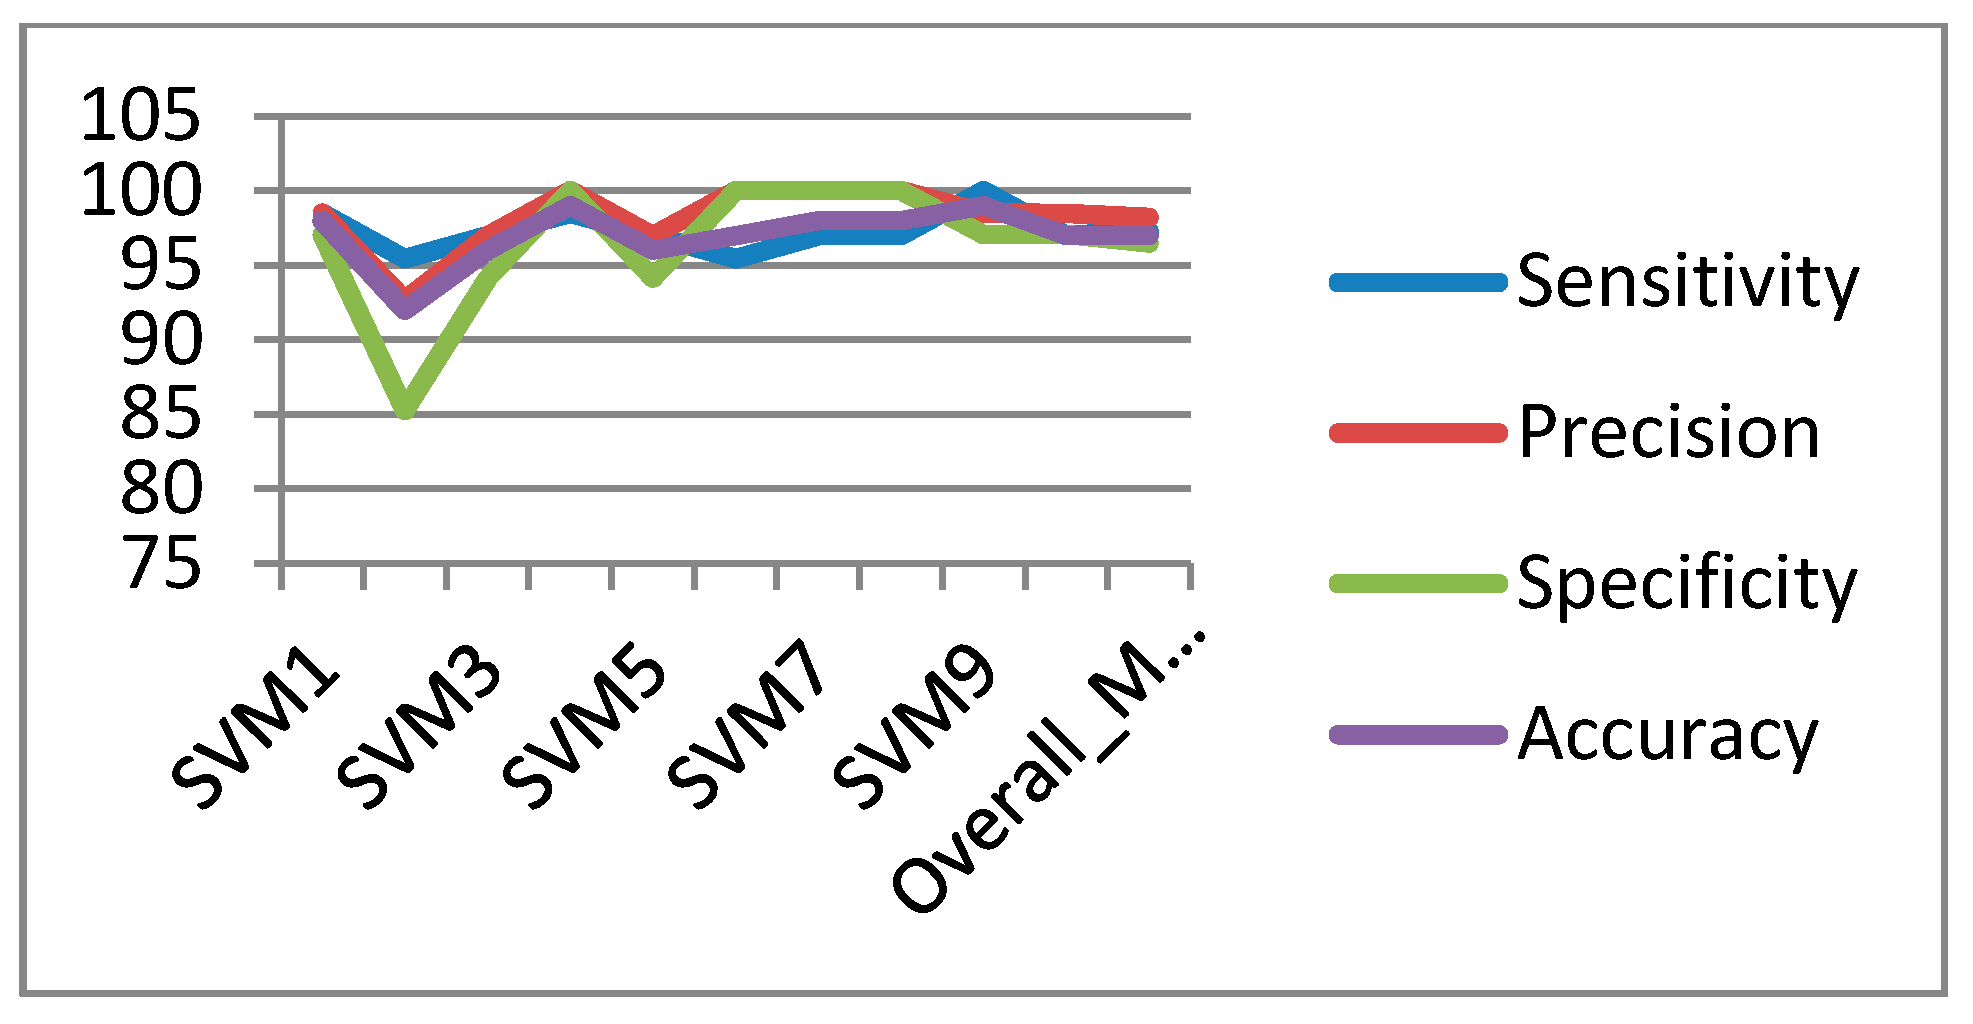
The first series was dedicated to the ANN classifier. Therefore, to validate the output results 10-fold, cross validation was used [27]. Tenfold cross validation is a resampling technique implemented by randomly choosing the training and testing data to evaluate the robustness of the ANN classifier. It will prevent the over-fitting that may occur if we divide the data into two sets only (training and testing sets). In 10-fold cross validation, the dataset (extracted features) was randomly divided into 10 blocks. For every hold out block, the system was trained on the remaining blocks and tested on the hold out block; results averaged over all test blocks, which reflects predictive performance. Initially, the best optimized ANN is obtained by varying various parameters of ANN, such as hidden nodes, number of epochs. Figure 12 shows the performance criteria of ANN obtained by applying 10-fold cross in the input data, where the x-axis represents the training and testing results and the y-axis represents the performance criteria which are: sensitivity, specificity and accuracy, in addition to displaying the misclassification error obtained in each training and testing fold in 10-fold cross validation. As can be seen from this figure, the overall accuracy reaches 90%.
Figure 12. Performance criteria of ANN with 10-fold cross validation.
Algorithms 08 01088 g012
The next experiment, dedicated to the SVM classifier. The training and testing were done by using 10-fold cross validation. Figure 13 depicts the performance results for SVM.
We tried many values for the kernel width (σ) (Equation (20)) and we found that σ = 0.6 gives the best performance in terms of the small number of support vectors and misclassification errors as illustrated in Table 5. We tried all combinations of two and three features to find the best feature subset that can separate the classes (benign and malignant) with better performance and less error, as well as less support vectors. Experimentally, we found that the geometric features (NC ratio, curvature and circularity) give us the best performance. Including additional features did not improve performance.
Figure 13. Performance criteria of SVM using 10-fold cross validation.
Algorithms 08 01088 g013
Table 5. Misclassification errors obtained during support vector machine (SVM) classifier with different values of σ.
Width (σ)Error
19
0.98
0.86
0.75
0.63
0.54
0.45
As can be seen from Figure 13, the value of FN and FP was reduced to its minimal, and the resulting values for the sensitivity and accuracy are large. Furthermore, we found that the SVM produced small misclassification errors in the training and testing phases.
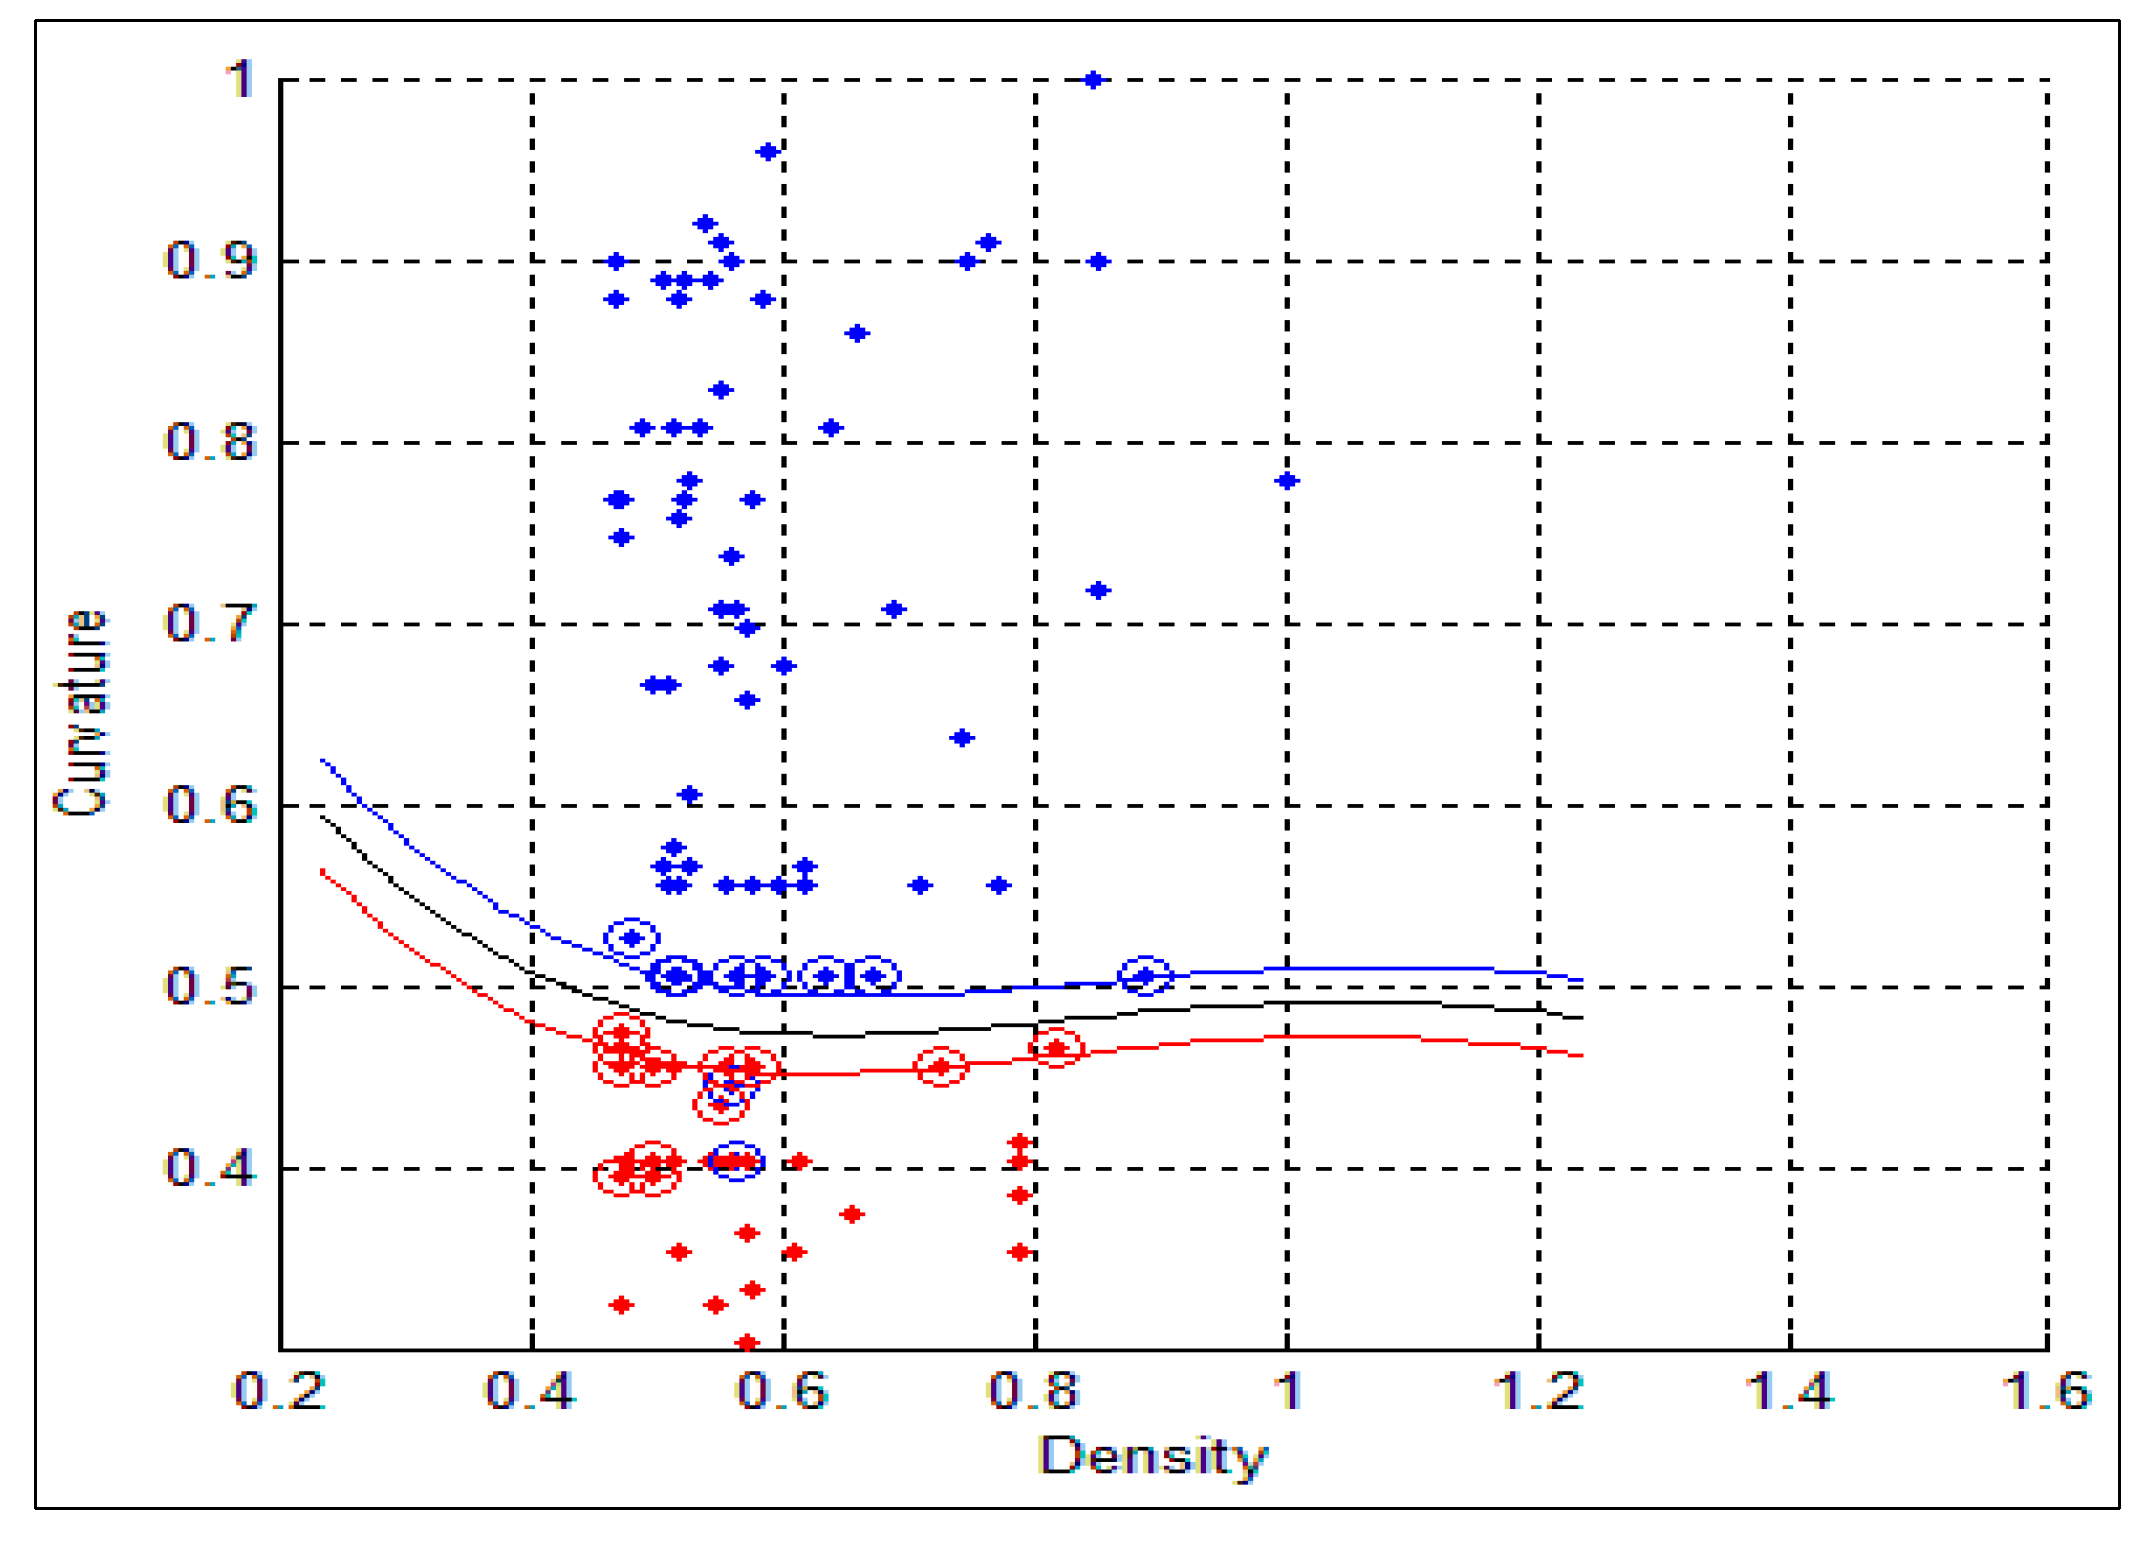
For qualitative purposes, Figure 14 illustrates the SVM result, by using NC ratio and curvature features respectively. As can be seen, there is a clear separation between the two classes (red points for benign and blue points for malignant) as represented by the black curve (margin) and the support vectors. Figure 15 illustrates a bad classification scenario, where the feature subset, which corresponds to the density (chromatic feature) and curvature (geometric feature), yields strong overlapping between classes; the classification task gives poor performance.
Figure 14. SVM separation for benign and malignant classes by using NC ratio and curvature features (perfectly separable). Red points corresponding to benign cells and blue points corresponding to malignant cells. The black line represent the margin.
Algorithms 08 01088 g014
We found that the SVM outperforms the ANN classifiers. Indeed, the SVM classifier allows a clear separation and classification of the cells into benign and malignant classes.
Figure 15. SVM separation for benign and malignant classes by using density and curvature features (strong class overlap). Red points corresponding to benign cells and blue points corresponding to malignant cells. The black line represent the margin.
Algorithms 08 01088 g015
Therefore, it is more stable and reliable for the proposed CAD system. Table 6 summarizes the performances of the ANN and SVM classifiers, respectively. We found that the SVM classifier achieved the best scores. It obtains a high number of TP and TN, and reduced number of FP and FN which leads to successful classification where all the performance criteria measurements (sensitivity, specificity and accuracy) are increased and the classification error is highly reduced.
Table 6. Performance of the classification methods.
PerformanceANNSVM
Sensitivity94%97%
Specificity83%96%
Accuracy90%97%
Error103
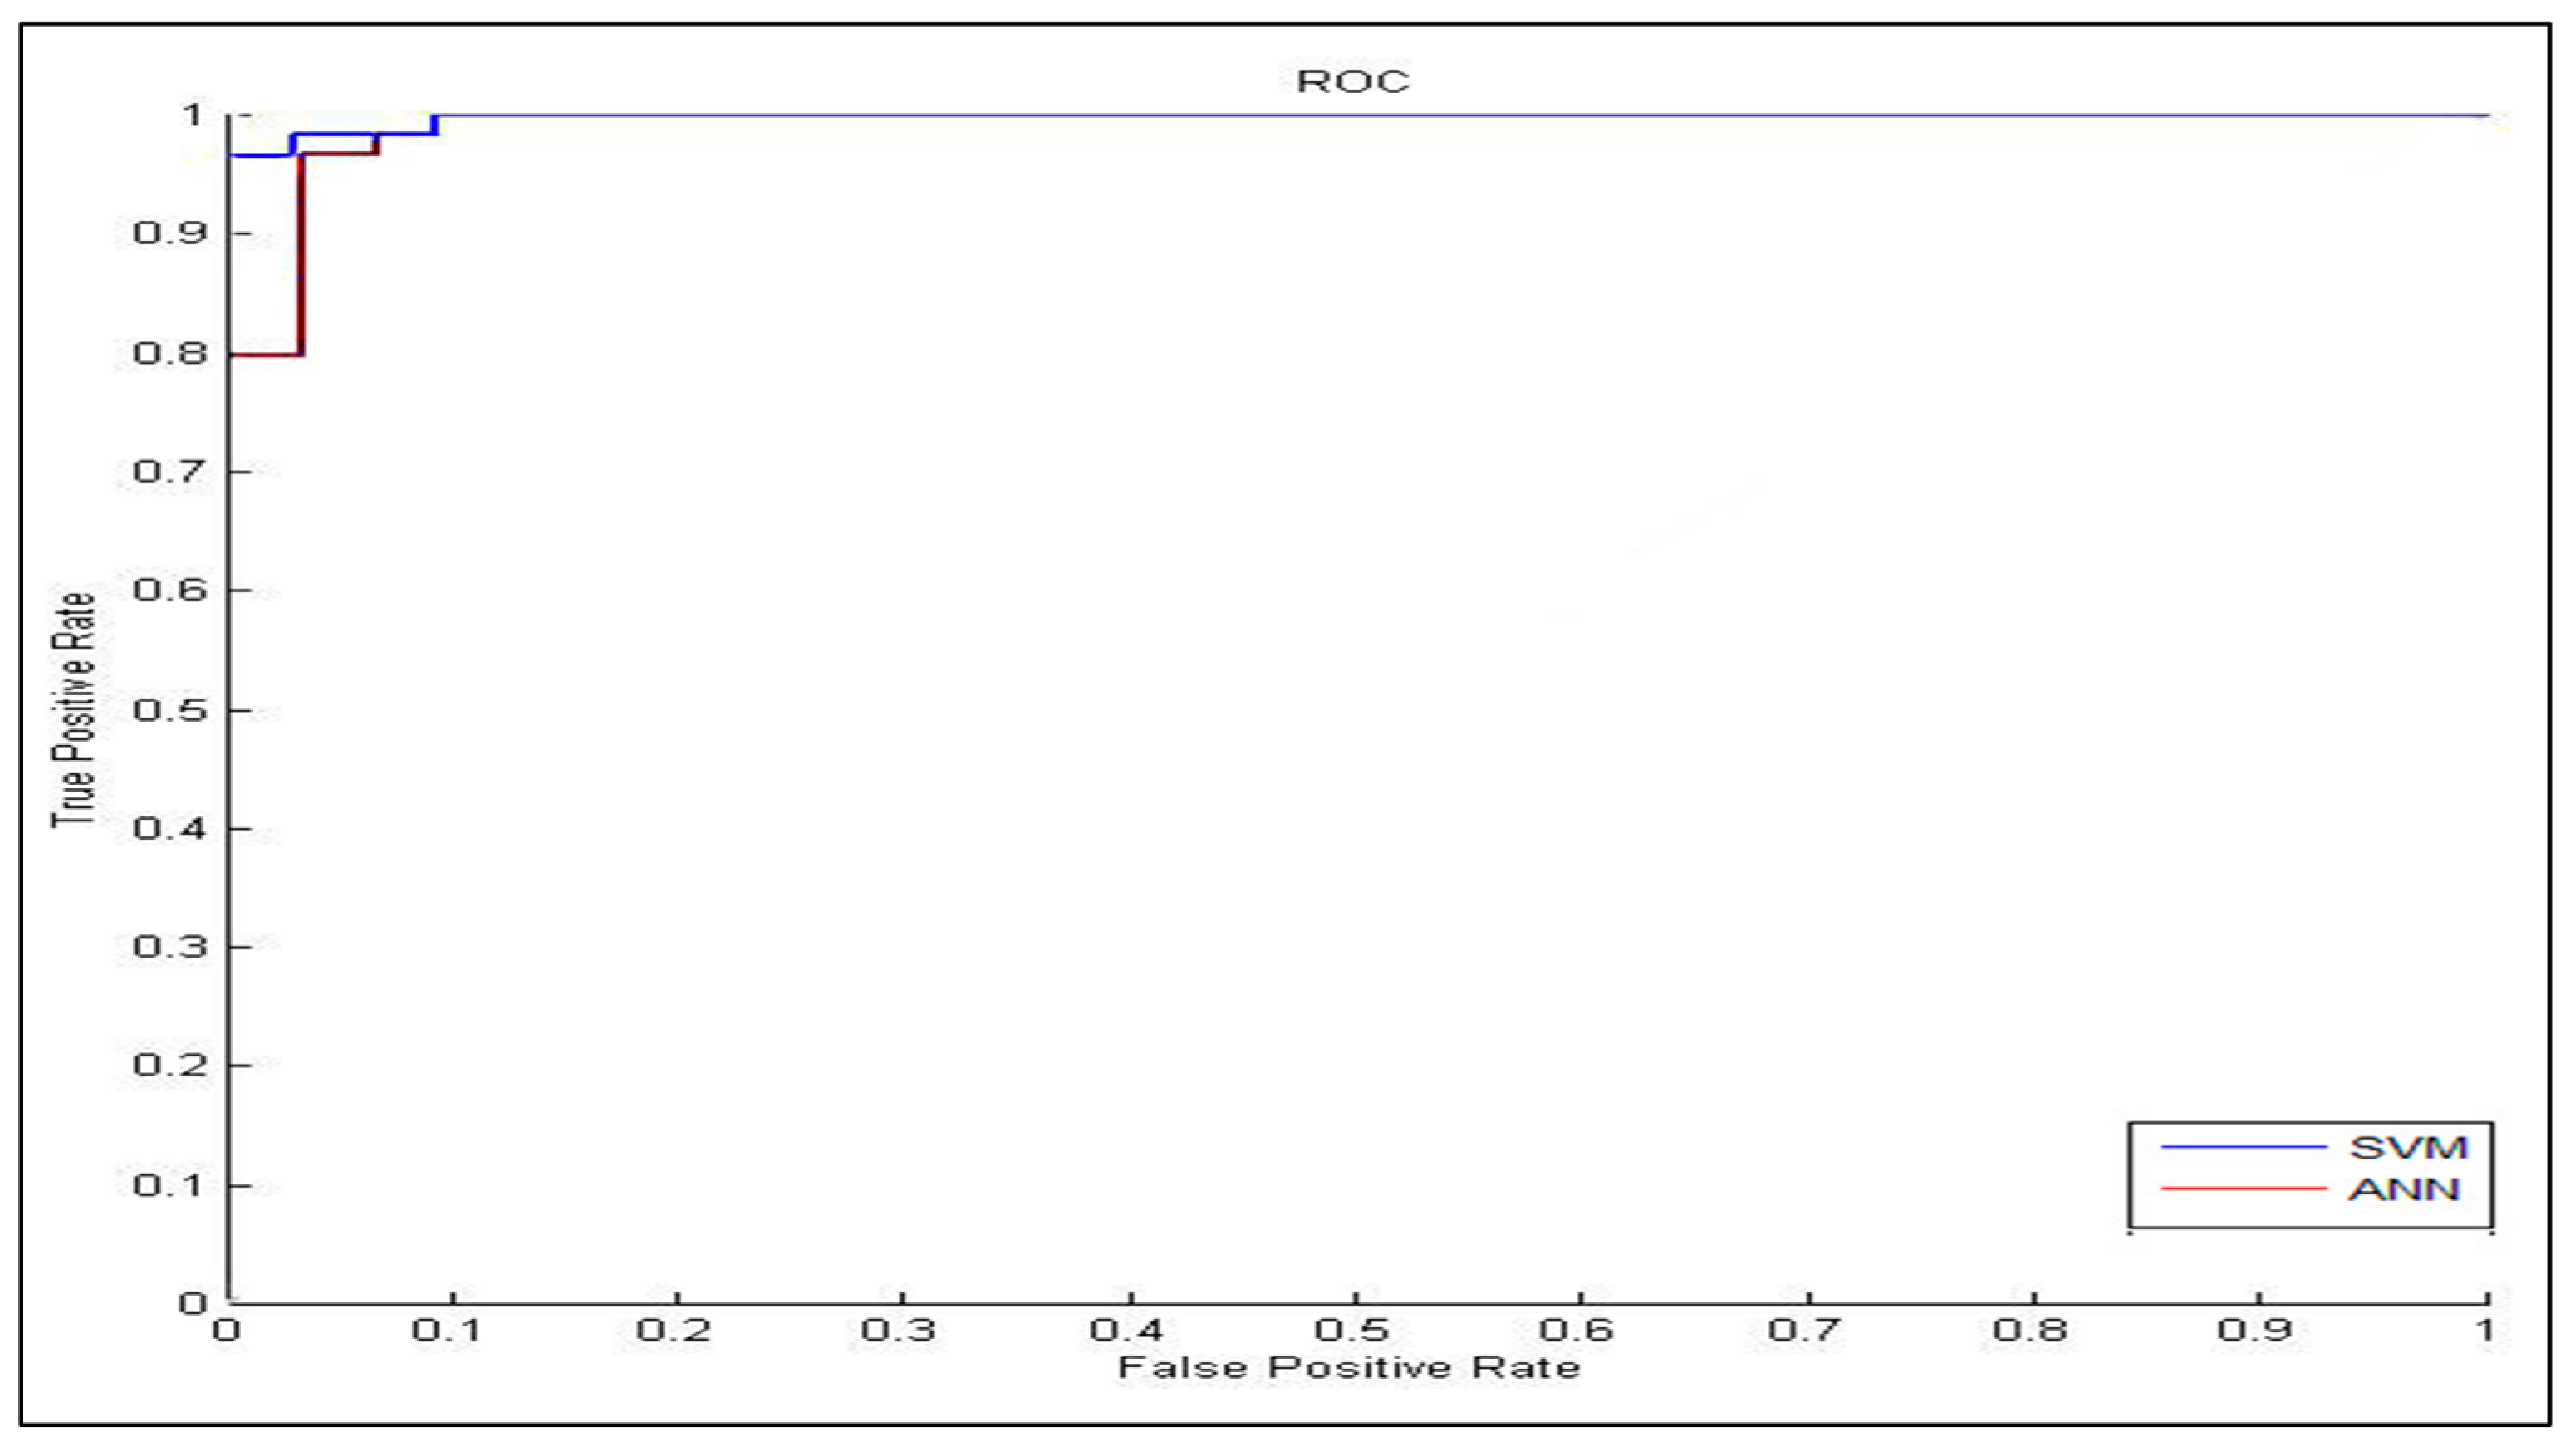
The comparison between the ROC-curves obtained from ANN and SVM classifiers, (as depicted in Figure 16) reveal a clear superiority of the SVM classifier, as it gives the highest accuracy. These ROC curves are generated by considering the rate at which true positives accumulate versus the rate at which false positives accumulate with each one corresponding to the vertical axis and horizontal axis. The point (0,1) means perfect classification, since it gives a correct classification for all the true positive and true negative cases. Therefore, an ideal system will be initiated by identifying all the positive instances, thus, the curve will rise to (0, 1) directly, which means zero false positive rates, and then continue along to (1,1). As can be seen for SVM (blue line in Figure 16), which gives the optimal high performance, i.e., high classification rate with low false alarm rate.
Figure 16. ROC curve obtained using ANN and SVM classifiers.
Algorithms 08 01088 g016

6. Comparing the Proposed CAD System with Others

The proposed CAD system is based on the analysis of sputum color images to detect lung cancer in its early stage. Other existing CAD systems for detecting lung cancer in the literature were based on other modalities such as chest radiograph, PET, CT scans and others as was explained earlier in Section 2 (Background). Therefore, we cannot compare our proposed CAD system results to these results as we have used different patient data.
Nevertheless, we compared the proposed CAD system with the previous one which was presented in [12]. Table 7 shows the comparison between the two CAD systems on performance criteria. As can be seen, the new proposed CAD system achieved a superior performance over the previous CAD system across all the criteria, where the new CAD system obtained an accuracy of 97% in experiments. A significant reduction in the number of FP and FN rates was achieved. The superiority of our system is in the robust techniques employed in the sputum image segmentation and classification. We tested the proposed CAD system with a database of 100 of sputum color images from different patients. The pathologist-identified cells are used as the gold standard to analyze the accuracy of the proposed CAD.
Table 7. Performance criteria of the computer aided diagnosis (CAD) systems.
PerformancePrevious CAD SystemProposed CAD System
Sensitivity93%97%
Specificity70%96%
Accuracy85%97%

7. Conclusions

We have proposed a novel CAD system for the early diagnosis of lung cancer. We have used a database of 100 sputum color images for different patients collected by the Tokyo center of lung cancer. The new CAD system can process sputum images and classify them into benign or malignant cells. For the color quantization, it was found that, the higher the color space resolution, the more accurate the detection and extraction of the sputum cell. It was found that the Bayesian classification is better than the heuristic rule-based classification as the former achieved an accuracy of 98%. The comparability of the performance with regard to the color format reveals close scores for histogram resolution above 64. In the segmentation process, it was demonstrated that the mean shift approach significantly outperforms the HNN technique, especially after acquiring additional information such as pixel space coordinates. The mean shift has a reasonable accuracy of 87%.
In the classification process: it was found that the performance of the SVM is superior compared to the ANN classifier. The SVM classifier allows a clear separation and classification of the cells into benign and malignant classes. Therefore, it is more stable and reliable for the proposed CAD system. The SVM achieved an accuracy of 97%. The experimental result shows that the proposed CAD system is able to detect the false positives and false negatives correctly. The new system has achieved a good performance in terms of sensitivity, specificity and accuracy equal to: 97%, 96% and 97% respectively. In addition, the use of extreme SVM as a learning model increased the accuracy of detecting the malignant cells. The new CAD system will be useful in screening a large number of people for lung cancer while helping pathologists to focus on candidate samples, and reducing the pathologists fatigue to a great extent.
With respect to the experimental work described in this paper, there is also considerable further work which could be undertaken. To solve the problem of inhomogeneity in the cytoplasmic region, we plan to use active contour snake segmentation which has the ability to work with images that have an overlapped nucleus and cytoplasm. This will be done by using Otsu’s automated thresholding selection method to segment the dysplastic sputum cells due to high inhomogeneities between the cells. We plan to extend the research to address these limitations as well as use a more extended data set of available sputum images.

Acknowledgments

We would like to thank Mohamad Al-Homssi the pathologist in the Medical College at University of Sharjah, UAE, for his kind collaboration.

Author Contributions

This work is part of a research project conducted by Fatma Taher under the supervision of Naoufel Werghi and Hussain Al-Ahmad.

Conflicts of Interest

The authors declare no conflict of interest.

References

  1. Cancer Facts & Figures 2015. Available online: http://www.cancer.org/research/cancerfactsfigures/cancerfactsfigures/cancer-facts-figures-2015 (accessed on 15 March 2015).
  2. Rachid, S.; Niki, N.; Nishitani, H.; Nakamura, S.; Mori, S. Segmentation of sputum color image for lung cancer diagnosis. In Proceedings of the International Conference on Image Processing, Santa Barbara, CA, USA, 26–29 October 1997; Volume 1, pp. 243–246.
  3. El-Baz, A.; Beache, G.M.; Gimel’farb, G.; Suzuki, K.; Okada, K.; Elnakib, A.; Soliman, A.; Abdollahi, B. Computer-Aided Diagnosis Systems for Lung Cancer: Challenges and Methodologies. Int. J. Biomed. Imaging 2013. [Google Scholar] [CrossRef] [PubMed]
  4. Suzuki, K. A review of computer-aided diagnosis in thoracic and colonic imaging. Quant. Imaging Med. Surg. 2012, 2, 163–176. [Google Scholar] [PubMed]
  5. Costaridou, L. Medical Image Analysis Methods; CRC Press/Taylor & Francis: Boca Raton, FL, USA, 2005. [Google Scholar]
  6. Dougherty, G. Digital Image Processing for Medical Applications; Cambridge University Press: Cambridge, UK, 2009. [Google Scholar]
  7. Kumar, S.A.; Ramesh, J.; Vanathi, P.T.; Gunavathi, K. Robust and Automated Lung Nodule Diagnosis from CT Images Based on Fuzzy Systems. In Proceedings of the 2011 International Conference on Process Automation, Control and Computing (PACC), Coimbatore, India, 20–22 July 2011; pp. 1–6.
  8. Chang, S.; Emoto, H.; Metaxas, D.N.; Axel, L. Pulmonary Micronodule Detection from 3D Chest CT. In Proceedings of the Medical Image Computing and Computer-Assisted Intervention—MICCAI 2004, Saint-Malo, France, 26–29 September 2004; Barillot, C., Haynor, D.R., Hellier, P., Eds.; Springer: Berlin, Germany; Heidelberg, Germany, 2004; pp. 821–828. [Google Scholar]
  9. Kanakatte, A.; Mani, N.; Srinivasan, B.; Gubbi, J. Pulmonary Tumor Volume Detection from Positron Emission Tomography Images. In Proceedings of the International Conference on BioMedical Engineering and Informatics, BMEI 2008, Sanya, China, 27–30 May 2008; Volume 2, pp. 213–217.
  10. Patil, S.A.; Udupi, V.R.; Kane, C.D.; Wasif, A.I.; Desai, J.V.; Jadhav, A.N. Geometrical and texture features estimation of lung cancer and TB images using chest X-ray database. In Proceedings of the International Conference on Biomedical and Pharmaceutical Engineering, ICBPE ’09, Singapore, Singapore, 2–4 December 2009; pp. 1–7.
  11. Sammouda, R.; Taher, F. Comparison of Hopfield Neural Network and Fuzzy Clustering in Segmenting Sputum Color Images for Lung Cancer Diagnosis. WSEAS Trans. Biol. Biomed. 2006, 3, 629–637. [Google Scholar]
  12. Taher, F.; Sammouda, R. Identification of Lung Cancer Based on Shape and Color. In Proceedings of the 4th International Conference on Innovations in Information Technology, IIT’07, Dubai, UAE, 18–20 November 2007; pp. 481–485.
  13. Schulte, E.; Wittekind, D. Standardization of the Papanicolaou stain. I. A comparison of five nuclear stains. Anal. Quant. Cytol. Histol. Int. Acad. Cytol. Am. Soc. Cytol. 1990, 12, 149–156. [Google Scholar]
  14. Taher, F.; Werghi, N.; Al-Ahmad, H.; Donner, C. Extraction and Segmentation of Sputum Cells for Lung Cancer Early Diagnosis. Algorithms 2013, 6, 512–531. [Google Scholar] [CrossRef]
  15. Fukunaga, K. Introduction to Statistical Pattern Recognition; Academic Press: Boston, MA, USA, 1990. [Google Scholar]
  16. Chan, K.-S.; Koh, C.-G.; Li, H.-Y. Mitosis-targeted anti-cancer therapies: Where they stand. Cell Death Dis. 2012. [Google Scholar] [CrossRef] [PubMed]
  17. Werghi, N.; Donner, C.; Taher, F.; Al-Ahmad, H. Detection and segmentation of sputum cell for early lung cancer detection. In Proceedings of the 2012 19th IEEE International Conference on Image Processing (ICIP), Orlando, FL, USA, 30 September–3 October 2012; pp. 2813–2816.
  18. Nixon, M.S.; Aguado, A.S. Feature Extraction & Image Processing for Computer Vision; Academic Press: Oxford, UK, 2012. [Google Scholar]
  19. Davies, E.R. Computer and Machine Vision Theory, Algorithms, Practicalities; Elsevier: Waltham, MA, USA, 2012. [Google Scholar]
  20. Bankman, I.N. (Ed.) Handbook of Medical Image Processing and Analysis, 2nd ed.; Academic Press: Amsterdam, NY, USA, 2008.
  21. Anton, H.; Rorres, C. Elementary Linear Algebra: Applications Version; Wiley: New York, NY, USA, 2005. [Google Scholar]
  22. Ye, X.; Lin, X.; Dehmeshki, J.; Slabaugh, G.; Beddoe, G. Shape-Based Computer-Aided Detection of Lung Nodules in Thoracic CT Images. IEEE Trans. Biomed. Eng. 2009, 56, 1810–1820. [Google Scholar] [PubMed]
  23. Astion, M.L.; Wilding, P. The application of backpropagation neural networks to problems in pathology and laboratory medicine. Arch. Pathol. Lab. Med. 1992, 116, 995–1001. [Google Scholar] [PubMed]
  24. Dayan, P.; Abbott, L.F. Theoretical Neuroscience Computational and Mathematical Modeling of Neural Systems; Massachusetts Institute of Technology Press: Cambridge, MA, USA, 2001. [Google Scholar]
  25. Bankman, I.N. Handbook of Medical Imaging Processing and Analysis; Academic Press: San Diego, CA, USA, 2000. [Google Scholar]
  26. Vapnik, V.N. Statistical Learning Theory; Wiley: New York, NY, USA, 1998. [Google Scholar]
  27. Weruaga, L.; Kieslinger, B. Tikhonov training of the CMAC neural network. IEEE Trans. Neural Netw. 2006, 17, 613–622. [Google Scholar] [CrossRef] [PubMed]