Abstract
Cloud computing is an emerging technology where IT resources are virtualized to users as a set of a unified computing resources on a pay per use basis. The resources are dynamically chosen to satisfy a user Service Level Agreement and a required level of performance. Divisible load applications occur in many scientific and engineering applications and can easily be mapped to a Cloud using a master-worker pattern. However, those applications pose challenges to obtain the required performance. We model divisible load applications tasks processing on a set of cloud resources. We derive a novel model and formulas for computing the blocking probability in the system. The formulas are useful to analyze and predict the behavior of a divisible load application on a chosen set of resources to satisfy a Service Level Agreement before the implementation phase, thus saving time and platform energy. They are also useful as a dynamic feedback to a cloud scheduler for optimal scheduling. We evaluate the model in a set of illustrative scenarios.
1. Introduction
The capacity of today’s infrastructures and data centers, the ubiquity of network resources, and the low storage cost has led to the emergence of a new field which is the Cloud Computing [1,2,3]. This new field has emerged with the directions, in which computation philosophy has shifted from the use of a personal computer or an individual server to a cloud of distributed resources. The main objective is to draw benefits from the underlying infrastructure services to satisfy a Service Level Agreement [4] and a required performance to users [5].
Many scientific and engineering applications present a high complexity; i.e., the number of operations generated is very high, which limits the benefits from the performance of a Cloud infrastructure if such an application runs sequentially on one node of the Cloud. If an application is divisible into a number of tasks, then parallelizing it on a number of workers within the Cloud would decrease the execution time or makespan of the application. The producer-consumer pattern [6], also called master-worker, represents a parallelization strategy that is suitable for many of the scientific and engineering applications. For instance, it is used in Google map-reduce programming model [7]; i.e., the rationale of why we have chosen the master-worker model as a base model. The master-worker model arises in divisible-load applications, where there is no communication between the workers, such as search for a pattern, compression, join, graph coloring and generic search applications [8], convolution-based applications [9], and image processing applications [10]. Furthermore, as stated in [5], a Cloud is considered as a candidate platform to run heavy-load applications to satisfy performance requirements. Consequently, there is a great interest to run master-worker applications in the Cloud. However, running a divisible load application using a master-worker strategy in a Cloud of nodes face challenges to obtain an optimal performance and analyze the performance of the application for an optimal scheduling of the application’s partitions. In the master-worker model, every computing worker processes the load received and transmits the results back to the master worker, which in turn, in a next iteration, performs some data preparations and sends news loads until the application is completed. In this case, the network capacity, the Cloud topology, and the computing performance of individual computing workers must be taken into account to model the system and the tasks’ processing. In this work, we use those system parameters and we derive formulas to calculate the blocking probability and the processing time of computing workers, thus providing a dynamic feedback to a scheduler which dynamically alters its resource allocation strategy for optimal performance and better system utilization. By blocking probability, we mean the probability of a task being in a waiting state and blocking all other tasks behind. Our model can also be used as a performance analysis tool to software engineers and Cloud providers to predict the behavior of a divisible load application on a set of Cloud nodes and consequently the system utilization. Although our model and derived formulas can be used for any distributed environment, our model is more useful in a cloud structure where resources are shared in space and time and thus blocking probability is higher as we believe, and an adjustment of scheduling is needed more often. In this paper, we model a Star Cloud topology. However, the mechanisms developed in this paper can be applied to other topologies as well. For instance, the master-worker model can be used in a ring topology; transmissions and computing processing capacities of computing workers should be considered.
Several works studied the problem of finding an optimal scheduling algorithm based on system parameters. However, to the best of our knowledge, there is no work which uses the behavior of the tasks processing to provide a dynamic feedback to a scheduler for an optimal scheduling algorithm. The multi-installment algorithm, studied in [11], proposed a model of scheduling communication and computation, in which communication time and computation time are assumed to be proportional and an application’s tasks are allocated in a sequence to a list of computing workers. A multiround algorithm [12] was built based on [11] by adding communication and computation latencies to the model. However, it assumed no memory limit in computing workers. The effect of memory limitation was studied in [13] under an assumption that the time of returning the results of computations from a computing worker is negligible, and that computations are suspended by communications. By contrast, in this work, we develop a novel model of the system and we derive formulas to compute the blocking probability of computing workers following tasks allocations as a feedback mechanism to a dynamic scheduling algorithm for an optimal performance and load balanced distribution of system utilization. Those probabilities help a dynamic scheduler to dynamically modify the load, in terms of the sizes of the tasks that should be allocated to computing workers, to increase the performance of an application.
The rest of the paper is structured as follows. Section 2 provides the background and the motivations for this work. Section 3 describes the computing platform model we consider and the assumptions we set in this work. The model and its analysis are described in Section 4. In Section 5, we evaluate the proposed model and discuss the obtained results. Section 6 concludes the work.
2. Background and Motivations
Cloud Computing [1,2,3] is an emerging technology to provide users with services, which are accessible through networks including local area network (LAN), wide area network (WAN) or even Internet. More precisely, a Cloud computing platform houses 2 types of software: users’ applications and system software. The users’ applications are delivered as services to users, known by software as a service (SaaS) and the system software is a middleware in support of those services with a quality of service according to a Service Level Agreement [4]. Complicated applications often require a huge amount of available computing processing and network capacity, provided as an infrastructure as a service (IaaS), in support of large-scale experiments. Examples of such applications are in the domain of seismic imaging [14], aerospace [15], meteorology [16], and convolution-based applications [9]. In this work, we focus on divisible load applications, where an application load can be divided into a number of tasks that can be processed independently in parallel ( [17,18,19]). Divisible Load Theory [17] provides a framework for mapping divisible loads to a platform of heterogeneous machines using master-worker model. The master is a processor which divides an application load into tasks and assigns each task to a separate worker. Many scientific and engineering applications can be divided using the master-worker model, such as search for a pattern, compression, join and graph coloring and generic search applications [8], multimedia and video processing ( [20,21]), and image processing [22].
Divisible load applications based on the master-worker model can be easily implemented and deployed on a computational Cloud [1]. A Cloud is defined as a type of parallel and distributed system consisting of a collection of interconnected and virtualized computers that are dynamically provisioned and presented as one or more computing resources based on a Service Level Agreement. Hardware resources and software are presented to users as services. Therefore, one of the main goals of a Cloud is to deliver resources on pay-as-you-use basis. By means of virtualization and the ability of users to scale up and down their use of hardware, Cloud offers a flexible and an efficient platform for scientists and engineers [5] to run heavy-load applications.
The issue of finding an optimal scheduling algorithm to schedule a divisible load application to heterogeneous distributed computing platforms have been studied thoroughly [11,12,13,23]. Reference [18] describes the research in this area over the past decades, which involves the linear and continuous modeling of partitionable communication and computation loads for parallel processing. The main issue to solve was to find the optimal sizes of load partitions (tasks) that have to be distributed to a distributed computing system for application optimal execution, and the ideal number of rounds needed for optimal performance [11,12,13,23]. Reference [24] discusses a scheduler efficiency based on different strategies of overlapping communication and computation on target systems. However, to our knowledge, there is no work which has studied the behavior of those applications and their blocking probabilities as a set of resources virtualized to users. The blocking probabilities are dynamically computed and provided as a feedback to a dynamic scheduler which alters resources allocations accordingly to obtain an optimal scheduling algorithm.
In this work, we propose a novel model to analyze the behavior of a divisible load application implemented in a cloud system. In particular, we compute the blocking probability of running an application’s tasks on a computing worker located in a Cloud computing platform. The proposed model is based on Markov chain process model. This is because a task mapped to a computing worker is usually undertaking 3 stages of manipulations that are linked to each others: (1) the transmission of the task from the master processor to a worker processor; (2) the processing of the task by the computing worker processor; and (3) the transmission of the results from the computing worker processor to the master processor. We then, based on this model, analyze the blocking probabilities of a computing worker as tasks are assigned to it. We believe that this novel model helps software engineers to predict the behavior of a distributed application, considering a set of computing resources, offered by a Cloud. In addition this model provides feedback to a dynamic scheduler which allocate adequate resources to provide users with a quality of service when running their scientific and engineering applications in the Cloud.
3. System Modeling
As shown in Figure 1, a Cloud consists of multiple Computing Workers and one Master Worker, where these computing workers are independently connected to the master worker in a star topology. Note that the data speed of the link connecting these computing workers and the master worker dictates the speed of communication processing when a task is transmitted. The computing workers could be located at remote distance, and they are operating in an independent heterogeneous mode since each individual computer worker may consist of one or multiple processors, which depend on the built-in capacity in terms of computing power, memory limitation and communication protocols.
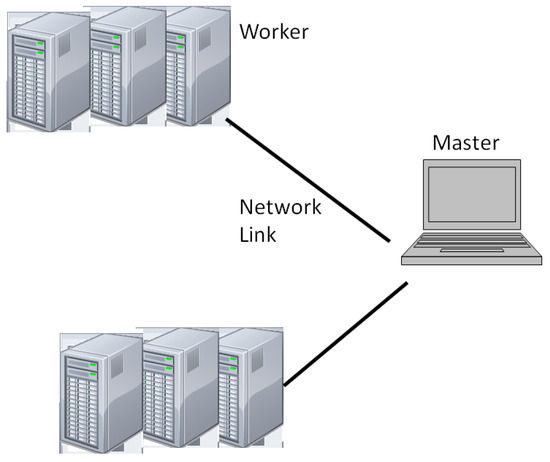
Figure 1.
A Star-Topology Computing Platform Model.
Upon receiving of an application or a user’s request, the master worker divides the whole application into a sequence of tasks, which are defined as the minimum data unit to be processed at a computing worker. Since each task contains certain amount of overheads for transmission and computing purposes. To minimize the overheads as well as to achieve an optimum performance efficiency, the master worker includes a scheduler which must take into account of the capacity of the selected computing workers in terms of the capacity of the communication link between the master worker and the selected computing worker, the available memory capacity and the existing computing power in the process of task segmentation, schedule and distribution. On the other hand, the efficiency of scheduling and distributing process at the master is certainly affected by the status of operating process at the workers. This paper focuses on the statistics of computing process at the workers under various conditions, including the capacity of receiving computing tasks from the master, the capacity of computing processing at the worker and the capacity of transmitting tasks back to the master. From the best practice point of view, such statistics are able to provide valuable information for the master to dynamically control the process of scheduling the task, selecting the suitable workers and distributing the tasks to the selected workers using a scheduling algorithm [23,25]. Note that the master worker can assign tasks to itself; i.e., the master itself can be a computing worker. The master worker collects partial results from the computing workers and combines them to constitute the final application’s result.
In the following analysis, a Cloud is considered to have R heterogeneous computing workers. A computing worker r, , in the Cloud is modeled by a tandem processing system consisting of 3 components in series. The first component represents the task receiving processing capacity of tasks per second, r is the index of computing worker. The second component represents the computing capacity of tasks per second, and the third component represents the task transmission capacity of . It is assumed that all the computing workers can run in parallel, but our model does not impose this and computing workers may run at different stages during application execution.
An application can be either dynamically submitted to the Cloud to run or it is statically there but a dynamic request of execution is submitted by the user. Applications’ or execution requests’ arrival is assumed to be a Poisson process with a mean rate . Poisson is often an assumption made for the arrival of tasks to a master scheduler ( [12,26]). When an application arrives at the Cloud, the master worker segments the application into R tasks to be assigned for each individual computing worker. The task assigned to a computing worker r is , which is also a Poisson process. Note that is the weight of a task load assigned to a computing worker r and is the whole application load.
4. Analysis of a Divisible Load Application in a Star Network Cloud
4.1. Modeling of Tasks Processing
As discussed previously, each computing worker consists of three process components, including task receiving process denoted as Station 1, a computing process denoted as Station 2 and a transmission process denoted as Station 3. The Station 1 depicts the time delay needed for receiving a task from the master worker before starting the computing process. The Station 2 defines the time needed to execute the received task. The Station 3 depicts the time needed to transfer the result obtained at the Station 2 back to the master worker.
These three stations, associated with a computing worker , are connected in a tandem model without any queuing spaces between them. In the process of receiving tasks at the Station 1, the task flow arriving at the receiver is a Poisson process and the entire process of receiving tasks from master worker is exponential distribution with a mean value of tasks per second since each task is accumulated by a bulk of data packets in sequence order with Poisson distribution. Likewise, the processing at the Station 2 is an exponential distribution with a mean value of of tasks per second. The transmission of the results back to master worker at the Station 3 is performed in a manner that the results are packetized into data packets with exponential distribution, so that the transmission time of each packet is also exponentially distributed. Hence, the transmission of tasks at the Station 3 is exponentially distributed with a mean value of tasks per second.
A computing worker r is operating based on the following procedures:
- The computing worker r is a tandem connected sequential processing chain.
- The master worker does not assign a new task to the computing worker r if an application task is in process at Station 1, even if Station 2 and/or Station 3 are empty.
- An application task is blocked when it completes the process at any Station and finds that the next Station is busy.
4.2. Computing Tasks Steady States Diagram
As shown in Table 1, a 3-digit symbol is used to represent the operation status of a computing worker, where digit “0" represents the processor in an “idle" status and “1" represents the processor in a “busy" status. For example, symbol “101" represents that the process of receiving a task from the master worker is on-going, the computing processor is “free" and that the transmitting processor is “busy" on sending the results back to master worker. Furthermore, the status “b" represents an application task that is blocked due to one application task’s arrival into a processor in “busy" status. For example, symbol “b11" represents that when a completely received application task is sent to a computing processor, this application task is blocked due to the computing processor being in a “busy" status, meanwhile, the transmitting processor is also in a “busy" on sending results back to master worker. It is clear that a particular scheduling algorithm ( [17,18]) has also an impact on the steady states of a computing worker.

Table 1.
Steady State Status during Tasks Processing.
While a master worker is assigning tasks to a computing worker,
different states transitions may happen. Figure 2 shows a Markov model for the operating process in the computing worker, where all possible operating states and transitions between these states are presented. When the computing worker is operating in steady-state, its steady state equations (Equations (1)–(2)) can be obtained by the following procedures:
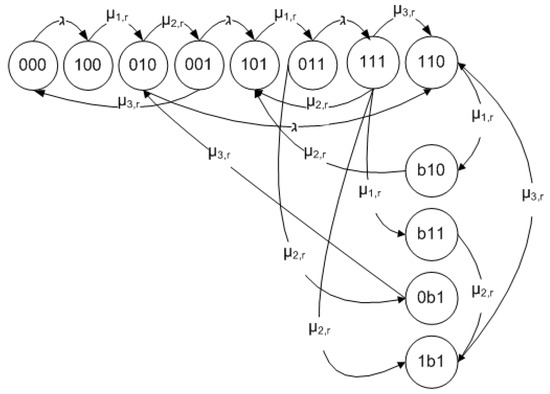
Figure 2.
Steady State Transitions on a Computing Worker.
Considering the state “000", which is directly related to the two states “100" and “001". When the computing worker in state “000" is starting to receive a new task from the master worker, it transits to state “100" at the rate of , which is an outbound flow from the state “000". On the other hand, when the computing worker is in state “001" completes the process of transmitting data back to the master worker, it transits to state “000" at the rate of , which is an inbound flow into the state “000". When the operation is stable, the outbound flows from the state “000" is equal to the inbound flows to the state “000". Consequently, we obtain Equation (1) as:
in which the left side represents the outbound flow and right side represents the inbound flow.
Similarly, applying the same strategy to the rest of the states, we can obtain the steady-state Equations (2)–(12) for all the corresponding states.
The steady-state equations for this multidimensional Markov processing chain are then as follows:
From above twelve steady-state equations, we are able to solve for the steady-state probabilities , , , , , , , , , , in terms of and using boundary equation to find as follows:
Based on Equation (1), we obtain:
From Equations (4) and (13), we obtain the following formula:
From Equations (2), (3), (6), and (9) we obtain by substitutions the following equation:
Consequently, is obtained from Equation (6) as follows:
is obtained based on Equations (9), and (16):
Based on Equation (7), is obtained as follows, and then can be computed thanks to Equations (16) and (17):
From Equation (12), we obtain:
Based on Equation (5), we obtain:
Based on Equations (10) and (11), is obtained using the following formula:
From Equation (10), we obtain:
The total task blocking probability in computing worker r is given by the following formula, which denotes as well the computing worker efficiency:
The total effective utilization of a computing worker r is given by:
4.3. Processing Time at Computing worker
The calculation of the processing time at each computing worker allows a cloud provider to predict the usage pay on each computing worker.
The processing time for a task to be successfully completed in computing worker r is the sum of the processing times taken for that task to be successfully completed in Stations 1, 2 and 3. The average processing time on a computing worker is equivalent to the ratio of the time spent for all the tasks to be successfully completed by the computing worker r over the average of the sizes of all the tasks assigned to the computing worker r.
5. Performance Evaluation
In this section, we evaluate the efficiency of a Cloud system considering the system and application parameters. In particular we analyze the impact of the system parameters (, , , , and ) on the system state using the model.
5.1. Evaluation Method
We evaluate the proposed model and analyze the behavior of a divisible application in a Cloud system for a range of parameters presented in Table 2.

Table 2.
Illustrative Parameter Values.
Those parameters are based on those described in [12] and [26]. The latter were based on real world scenarios. We take different values of a workload , assigned to a computing worker r. By incrementing the load assigned to each computing worker, we assess the impact of a bigger load on the system performance. We also assess the impact of the variation of the receiving rate at a computing worker r, by considering different receiving rates, as presented in Table 2. As different applications may arrive or run at different rates on a master worker, then different arrival rate are considered to assess the impact of the arrival rate on the system performance.
5.2. Illustrative Scenarios
In order to analyze the impact of the relationship among the data receiving, the computing and the data transmission processing powers of a computing worker, we illustrate the model by using 3 scenarios: (1) in the first scenario, the 3 processing powers are equal (); (2) in the second scenario, the receiving processing power is less than the computing processing power (); and (3) in the third scenario, the receiving processing power is greater than the computing processing power (). In our experiments a load will be divided equally on the available computing workers. We consider a range of chunk sizes to analyze the system. In our experiments we vary the chunk sizes arriving at computing workers to explore several scenarios of data distribution and their impact on the system efficiency. To analyze the impact of an arrival rate to the system efficiency, we vary the Poisson rates, representing real world scenarios [26].
5.3. Numerical Results and Evaluation
In this section, we explore the numerical data obtained to evaluate our model. For simplicity, is represented by on the figures, and , , and are represented by , , and respectively.
Figure 3 shows that, for equal capacities of receiving, computing and transmitting stations, the efficiency of the system is at its optimal for small chunks of data sizes or for small arrival rate. It also shows that the system blocks increase with bigger arrival rate and bigger data chunk. When the data chunk is relatively big (), the system probability to block is exponential versus an increase in arrival rate.
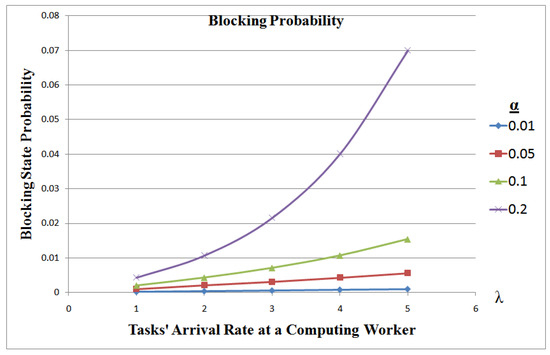
Figure 3.
Computing Worker Efficiency when .
When the transmission capability of the system is smaller than its computing capability, then the efficiency of the system increases. Figure 4 shows that the blocking probability can reach 5.2% (when ) in case the transmitting power is smaller than the computing processing power vis-a-vis 7% when the computing power of the receiving, processing and transmitting are all equal. It also shows that if the transmission capability is higher than the computing capability, then the system efficiency decreases considerably, as the computing capability will not be able to cope with the transmission power. The system blocking probability can reach 8.9%.
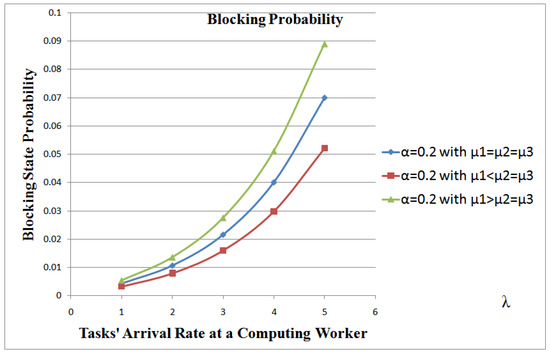
Figure 4.
Comparison of Computing Worker Efficiency in 3 scenarios: , , and .
A Computing Worker CPU usage is affected by 3 factors: (1) the system efficiency, which is determined from the rate of blocking situations; (2) the chunk size; and (3) the chunks’ arrival rates. Figure 5 and Figure 6 show the CPU usage in 2 scenarios: (1) CPU usage during blocking and non-blocking situations () versus an increase in arrival rate and chunk size; and (2) CPU usage for non-blocking situations only (). These figures show that CPU utilization is higher with higher arrivals’ rates and larger chunks sizes. The CPU usage percentage can reach up to 18% when the receiving, computing and transmitting capabilities of the system are equal (Figure 5). This usage increases when the receiving capability is higher than the computing and the transmitting capabilities (35%), as the computing power will not be able to cope with the receiving rate. When the receiving capability is less than the computing and the transmitting capabilities of the system, then the usage is 25%.
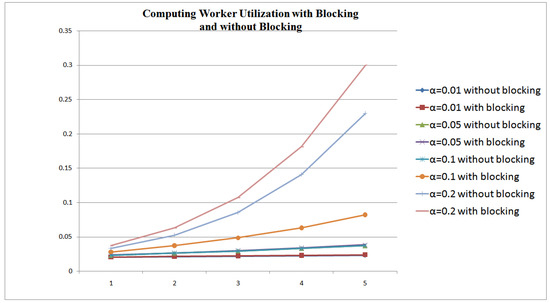
Figure 5.
Computing Worker CPU Usage when .
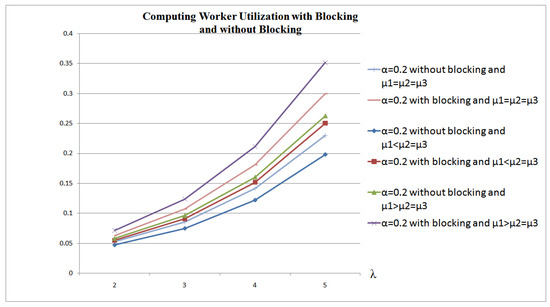
Figure 6.
Comparison of Computing Worker CPU Usage in 3 scenarios: (1) ; (2) ; and (3) .
6. Conclusions
In this paper, we presented a model to predict the behavior of a divisible load application using a producer-consumer pattern, also called master-computing worker pattern in a Star network Cloud. A Cloud computing platform offers to users a virtualized distributed system, where computing resources are dynamically allocated to satisfy a user’s Service Level Agreement. In this work, we proposed a novel model to predict the behavior of an application allocated to a set of computing resources; i.e., computing workers, within the Cloud. The model computes the blocking probability of a computing worker considering computing and networking capacities of the Cloud presented to users. In particular, we set out to answer two open questions: (1) how can the resources efficiency and system utilization be measured in terms of blocking probability? and (2) what is the average processing time of application’s tasks on a computing worker to estimate resources usage payment? First, we developed a modeling of a star network cloud using Markov chain process model. A computing worker was represented by 3 components or queues: (1) the data receiving queue, which is used to transmit a task assigned by a master processor from the master processor to the computing worker processor; (2) the task computing queue, which is used to compute the task assigned by the master processor to the computing worker processor; and (3) the data transmitting queue, which is used to transmit results from the computing worker processor to the master processor. Then, we used that model to derive formulas which are used to calculate the blocking probabilities of tasks processing within the system. We believe that the model provides software engineers and Cloud providers with a tool to predict the behavior of divisible load applications on a set of chosen distributed resources from within a Cloud. The model allows software engineers to analyze the behavior of their applications before implementation phase. It allows Cloud providers to analyze the performance of the applications considering a set of resources for the purpose of satisfying a user’s Service Level Agreement and providing a quality of service for users upon application execution. The proposed model can also be used to dynamically provide feedback to a dynamic scheduler which can alter its scheduling strategy dynamically to enhance system utilization and therefore decrease the overall makespan of the divisible load application. We have evaluated the model in a set of scenarios and analyzes corresponding performance behavior of a computing worker. Our work continues and we aim to implement a scheduler tool which uses the proposed model in this work to adapt its scheduling strategy for an optimal scheduling performance. Performance evaluations will then be conducted similar to the one performed for our work in IEEE Transactions on Parallel and Distributed Systems [27] and in Software: Practice and Experience by Wiley [27].
Acknowledgements
The authors would like thank the anonymous reviewers whose feedbacks have contributed to the paper.
References
- Buyya, R.; Yeo, C.S.; Venugopal, S. Market-Oriented Cloud Computing: Vision, Hype, and Reality for Delivering IT Services as Computing Utilities, Keynote Paper. In Proceedings of the 10th IEEE International Conference on High Performance Computing and Communications (HPCC 2008), Dalian, China, 25–27 September 2008. [Google Scholar]
- Buyya, R.; Yeo, C.S.; Venugopal, S.; Broberg, J.; Bric, I. Cloud computing and emerging IT platforms: Vision, hype, and reality for delivering computing as the 5th utility. Future Gener. Comput. Syst. 2009, 25. [Google Scholar] [CrossRef]
- Armbrust, M.; Fox, A.; Griffith, R.; Joseph, A.; Katz, R.; Konwinski, A.; Lee, G.; Patterson, D.; Rabkin, A.; Stoica, I.; Zaharia, M. Above the Clouds: A Berkeley View of Cloud Computing; Technical Report No. UCB/EECS-2009-28; University of California: Berkley, CA, USA, 10 February 2009. [Google Scholar]
- Service Level Agreement Zone. The Service Level Agreement. 2007. Available online: http://www.sla-zone.co.uk/index.htm (accessed on 4 May 2012).
- Vecchiola1, C.; Pey1, S.; Buyya, R. High-Performance Cloud Computing: A View of Scientific Applications. In Proceedings of the 10th International Symposium on Pervasive Systems, Algorithms and Networks (I-SPAN 2009), Kaohsiung, Taiwan, 14–16 December 2009. [Google Scholar]
- Foster, I. Designing and Building Parallel Programs; Addison-Wesley: Boston, MA, USA, 1995. [Google Scholar]
- Dean, J.; Ghemawat, S. MapReduce: Simplified Data Processing on Large Clusters. In Proceedings of the 6th Symposium on Operating Systems Design and Implementation (OSDI-04), San Francisco, CA, 06–08 December 2004; pp. 137–150. [Google Scholar]
- Drozdowski, M.; Wolniewicz, P. Experiments with Scheduling Divisible Tasks in Cluster of Workstations. In Proceedings of the 6th International Euro-Par Conference on Parallel Processing (Euro-Par 2000), Munich, Germnay, 29-8–01-09, 2000; pp. 311–319. [Google Scholar]
- Ismail, L.; Guerchi, D. Performance evaluation of convolution on the IBM cell processor. IEEE Trans. Parallel Distrib. Syst. 2011, 22, 337–351. [Google Scholar] [CrossRef]
- Bharadwaj, V.; Ranganath, S. Theoretical and experimental study on large size image processing applications using divisible load paradigms on distributed bus networks. Image Vis. Comput. 2002, 20, 917–1034. [Google Scholar]
- Bharadwaj, V.; Ghose, D.; Mani, V. Multi-installment load distribution in tree networks with delays. IEEE Trans. Aerosp. Electron. Syst. 1995, 31, 555–567. [Google Scholar] [CrossRef]
- Yang, Y.; van der Raadt, K.; Casanova, H. Multiround algorithms for scheduling divisible loads. IEEE Trans. Parallel Distrib. Syst. 2005, 16, 1092–1102. [Google Scholar] [CrossRef]
- Drozdowski, M.; Lawenda, M. Multi-installment divisible load processing in heterogeneous systems with limited memory. Parallel Process. Appl. Math. 2006, 3911/2006, 847–854. [Google Scholar]
- Rowe, C.A.; Aster, R.C.; Borchers, B.; Young, C.J. An automatic, adaptive algorithm for refining phase picks in large seismic data sets. Bull. Seismol. Soc. Am. 2002, 92, 1660–1674. [Google Scholar] [CrossRef]
- Manke, J.W. Parallel computing in aerospace. Parallel Comput. 2001, 27, 329–336. [Google Scholar] [CrossRef]
- Global Modeling, US Naval Research Laboratory, Monterrey, Ca., August 2003. Available online: http://www.nrlmry.navy.mil/sec7532.htm (accessed on 4 May 2012).
- Ghose, D.; Robertazzi, T. Special issue on divisible load scheduling. Cluster Computing, 2003, 6, 1. [Google Scholar] [CrossRef]
- Bharadwaj, V.; Ghose, D.; Robertazzi, T. Divisible load theory: A new paradigm for load scheduling in distributed systems. Clust. Comput. 2003, 6, 7–17. [Google Scholar] [CrossRef]
- Shokripour, A.; Othman, M. Categorizing DLT researches and its applications. Eur. J. Sci. Res. 2009, 37, 496–515. [Google Scholar]
- Altilar, D.; Paker, Y. An Optimal Scheduling Algorithm for Parallel Video Processing. In Proceedings of the IEEE International Conference on Multimedia Computing and Systems, Austin, Tx, 28 June–1 July, 1998. [Google Scholar]
- Altilar, D.; Paker, Y. Optimal Scheduling Algorithms for Communication Constrained Parallel Processing. In Proceedings of the 8th International Euro-Par Conference on Parallel Processing (Euro-Par 2002), Paderborn, Germany, August 27–30, 2002; Springer Verlag: London, UK, 2002. LNCS 2400. pp. 197–206. [Google Scholar]
- Lee, C.; Hamdi, M. Parallel image processing applications on a network of workstations. Parallel Comput. 1995, 21, 137–160. [Google Scholar] [CrossRef]
- Beaumount, O.; Casanova, H.; Legr, A.; Robert, Y.; Yang, Y. Scheduling divisible loads on star and tree networks: Results and open problems. IEEE Trans. Parallel Distrib. Syst. 2005, 16. [Google Scholar] [CrossRef]
- Yu, C.; Marinescu, D.C. Algorithms for divisible load scheduling of data-intensive applications. J. Grid Comput. 2010, 8, 133–155. [Google Scholar] [CrossRef]
- Ismail, L.; Mills, B.; Hennebelle, A. A Formal Model of Dynamic Resource Allocation in Grid Computing Environment. In Proceedings of the IEEE 9th ACIS International Conference on Software Engineering, Artificial Intelligence, Networking and Parallel/Distributed Computing (SNPD 2008), Phuket, Thailand, August 06–08, 2008; pp. 685–693. [Google Scholar]
- Medernach, E. Workload Analysis of a Cluster in a Grid Environment. In Proceedings of the 11th international conference on Job Scheduling Strategies for Parallel Processing, Cambridge, USA, 18–21 June, 2005; Volume 3834/2005, pp. 36–61. [Google Scholar]
- Ismail, L.; Barua, R. Implementation and performance evaluation of a distributed conjugate gradient method in a cloud computing environment. Softw. Pract. Exp. 2012. [Google Scholar] [CrossRef]
© 2012 by the authors. Licensee MDPI, Basel, Switzerland. This article is an open access article distributed under the terms and conditions of the Creative Commons Attribution (CC BY) license (https://creativecommons.org/licenses/by/4.0/).