1. Introduction
Traffic safety remains a paramount concern in our society [
1]. Factors such as drunk driving [
2], speeding, and fatigue driving [
3] not only endanger the lives of drivers but also pose a threat to public transportation safety. Unlike drunk driving and speeding, which are regulated by laws and policies, issues related to fatigue driving can be mitigated through instantaneous detection and warning technologies [
4].
Fatigue driving impairs driving stability and decision-making ability [
5], representing a significant factor contributing to traffic accidents. According to previous studies, fatigue driving is linked to approximately 16.5% of fatal crashes and 12.5% of injury-related collisions in the United States. Globally, it may account for up to 20% of all traffic accidents [
6]. This article aims to mitigate traffic accidents attributable to fatigue driving by proposing a fatigue driving detection algorithm that takes into account individual driver characteristics.
Currently, the detection of fatigue driving is mainly divided into subjective and objective methods [
7]. The subjective method relies on questionnaires such as the Stanford ‘Sleepiness Scale (SSS) [
8], Visual Analog Scale (VAS) [
9], and Karolinska Sleepiness Scale (KSS) [
10], which depend on drivers’ subjective perceptions. Due to its subjective nature, this method cannot serve as a standardized approach for detecting fatigue driving. Objective methods involve utilizing auxiliary tools to detect the driver’s physiological characteristics [
11,
12], vehicle information [
13,
14], or facial features [
15,
16] to ascertain fatigue driving. Physiological feature detection using wearable sensors is not only employed in medical contexts [
17], but also extensively utilized in fatigue driving detection. While wearable sensors are undeniably becoming smaller, lighter, and more accurate [
18,
19,
20], their costliness and potential discomfort during prolonged use may hinder the widespread adoption of fatigue detection based on physiological characteristics [
21,
22]. For instance, electroencephalography (EEG) headsets are commonly priced between USD 1000 and 25,000, presenting a substantial economic barrier for widespread deployment. Moreover, user experience studies have reported that extended use of ECG chest straps can cause skin irritation and physical discomfort, which may reduce driver compliance and affect the overall effectiveness of fatigue detection systems [
23]. Techniques that indirectly evaluate driver fatigue levels by monitoring alterations in vehicle speed and steering entail diverse data collection and analysis procedures, thereby markedly escalating the complexity of the detection system.
Fatigue detection based on facial features typically involves non-contact methods that minimize interference with the driver and directly reflect the driver’s fatigue state, becoming the mainstream direction of related research [
24]. This method usually considers feature variations from the eyes, mouth, and head pose. Li [
15] proposed a method utilizing deep learning techniques to analyze facial features, achieving high accuracy in detecting driver fatigue. However, challenges arise when facial features are obscured, such as when drivers wear masks or cover their mouths while yawning or coughing. Qu, S. et al. [
25] developed a multi-attention fusion model that improves fatigue detection performance by enhancing feature extraction across multiple facial regions. However, this approach still faces limitations in detecting fatigue when significant facial occlusions occur, such as in poor lighting conditions or when the driver’s head is tilted at extreme angles.
Detection based on human eye features provides the most intuitive characterization of fatigue. Ramzan, M. et al. [
1] reported a method for detecting fatigued driving by eye tracking and dynamic template matching using the Hue-Saturation-Intensity (HSI) color model and the Sobel edge operator with an accuracy of up to 88.9%. Percentage of eyelid closure versus pupil change over time (PERCLOS) is one of the most popular algorithms [
26], which is accurate but takes a relatively long time to compute fatigue results [
27]. A method to calculate blinking frequency (BF) by analyzing specific image frames was proposed in [
28]. Although the method gives appropriate criteria for determining the level of fatigue, the number of blinks in a given period of time needs to be counted prior to the computation, which prolongs the response time. As reported in [
29,
30,
31], eye aspect ratio (EAR) calculation is simple to perform and has a fast response; however, a single detection parameter is difficult to reflect an accurate and reliable fatigue level.
In practical applications, fatigue detection must be accurate, reliable, and responsive. However, existing methods often rely on single or limited behavioral features, or apply uniform thresholds across all subjects, which limits their adaptability and leads to potential misjudgments. To address these limitations, this article proposes a fatigue monitoring algorithm based on facial multi-feature fusion, which combines three evaluation indexes: blinking frequency (BF), yawning frequency (YF), and nodding frequency (NF). Additionally, considering individual driver characteristics, a personalized threshold is introduced to assess the driver’s eye, mouth, and head status by normalizing the degree of eye and mouth openness, rather than using a traditional average threshold. Compared to previous approaches, the proposed method provides improved adaptability to individual differences and more comprehensive behavioral representation, thereby enhancing overall detection robustness. It demonstrates significant applicability in a wide range of fatigue detection scenarios.
The main innovations of this article include the following:
The introduction of a personalized threshold model based on the normalization of eye and mouth openness, which accounts for individual differences in facial features.
The use of a sliding window model to dynamically track changes in fatigue indicators (BF, YF, and NF) in real time, enhancing detection accuracy.
The development of a multi-feature fusion approach that integrates multiple fatigue-related behaviors (blinking, yawning, and nodding) to improve overall system reliability and response time.
2. Algorithm and Methodology
2.1. Model Description
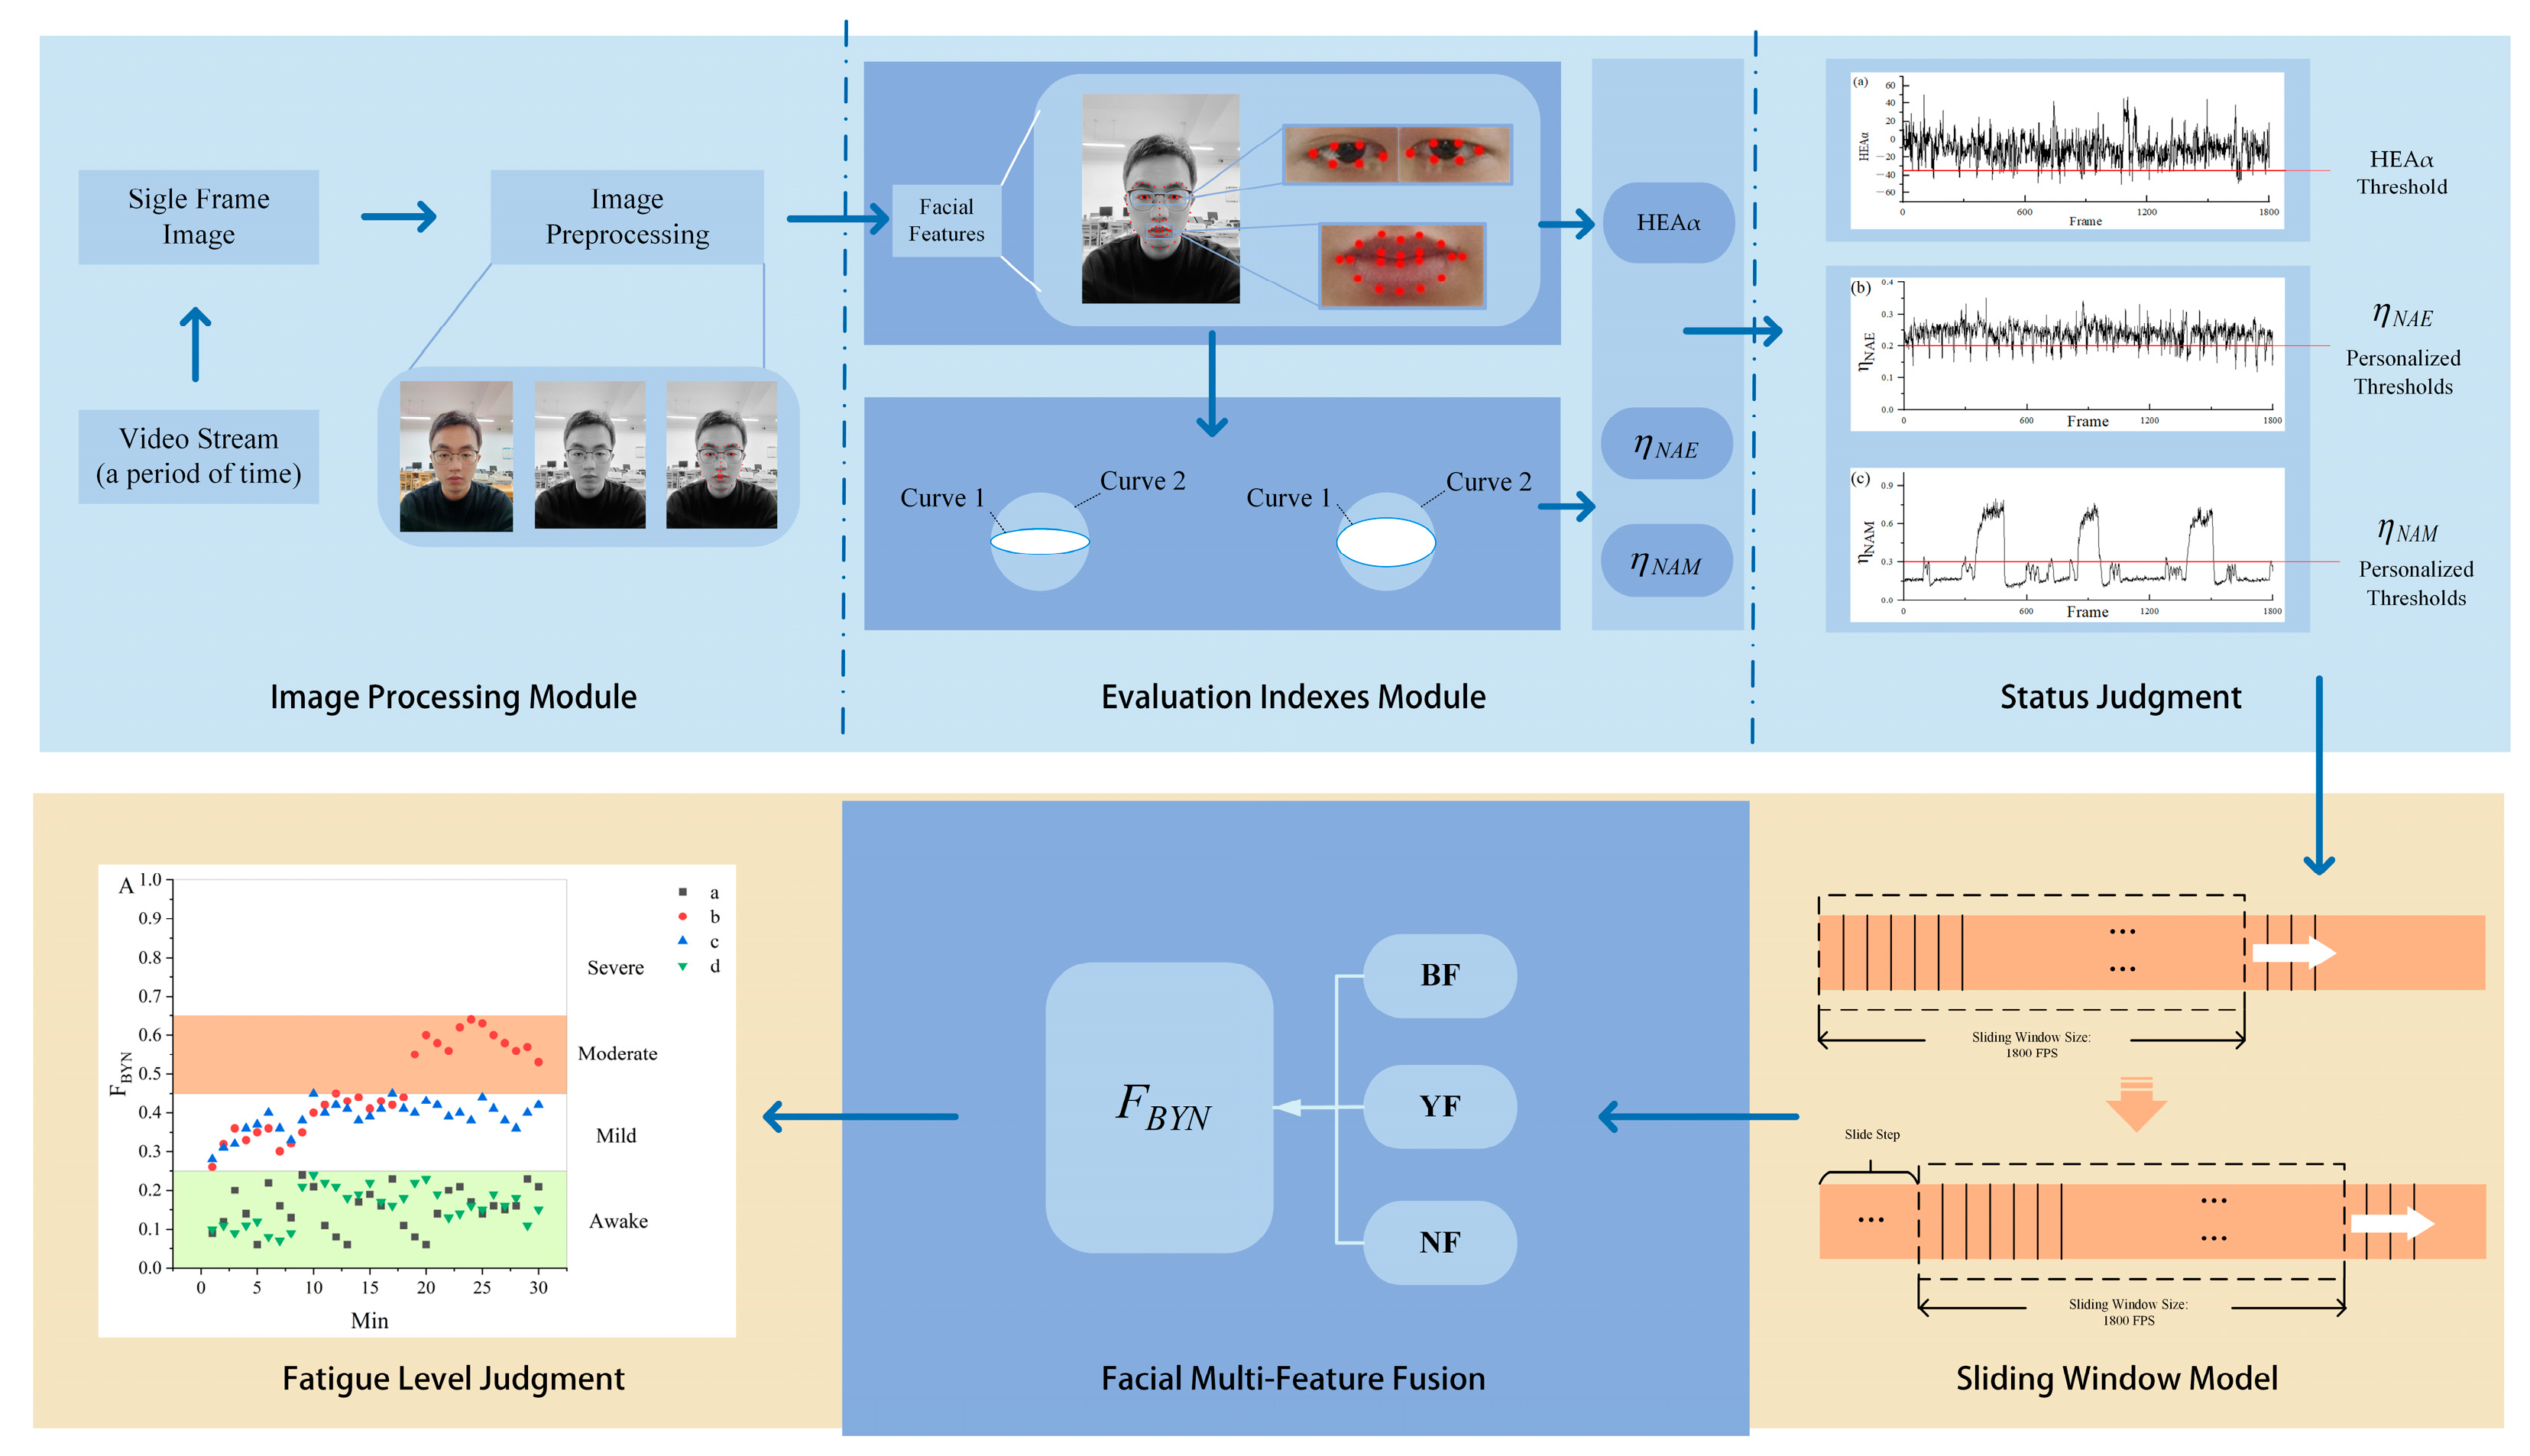
The proposed fatigue detection model utilizes a video stream to capture details of the driver’s facial contours. The algorithm operates within the framework depicted in
Figure 1. Initially, the video is captured at a frame rate of 30 frames per second (fps) and segmented into a series of image frames with a resolution of 640 × 480 pixels. To reduce computational complexity, each frame is uniformly resized to 320 × 240 pixels. The frames are then converted to grayscale using standard color space transformation techniques, followed by histogram equalization to enhance image contrast. A Gaussian blur with a kernel size of 5 × 5 is subsequently applied to suppress high-frequency noise. Finally, all pixel values are normalized to the range [0, 1] to ensure consistency in illumination across frames. These preprocessing operations improve the robustness of the system by mitigating the effects of lighting variability and image noise, thereby enabling more reliable feature extraction and fatigue detection [
32].The illustrations in
Figure 1 depict the difference between the images before and after processing. Subsequently, the key facial points are extracted from the preprocessed image. The Dlib toolkit [
33] is employed to extract the feature points of the driver’s eyes and mouth. First, the head Euler angle α (HEAα) [
34] values are calculated from the head features. Then, to distinguish the facial features of different drivers, the eye and mouth contour curves are fitted using the eye and mouth feature points, and the normalized evaluation indexes (
,
) for the eyes and mouth are calculated from the open and closed normalization model [
30]. Based on the obtained values of
and
, personalized thresholds can be assigned to judge the states of the eyes and mouth for each driver. Subsequently, these values are input into the sliding window model t to further calculate the three evaluation indexes: blinking frequency (BF), yawning frequency (YF), and nodding frequency (NF) [
1]. Finally, the obtained three evaluation indexes are input into the feature fusion model to derive the integrated features and assess the degree of fatigue.
2.2. Evaluation Indexes
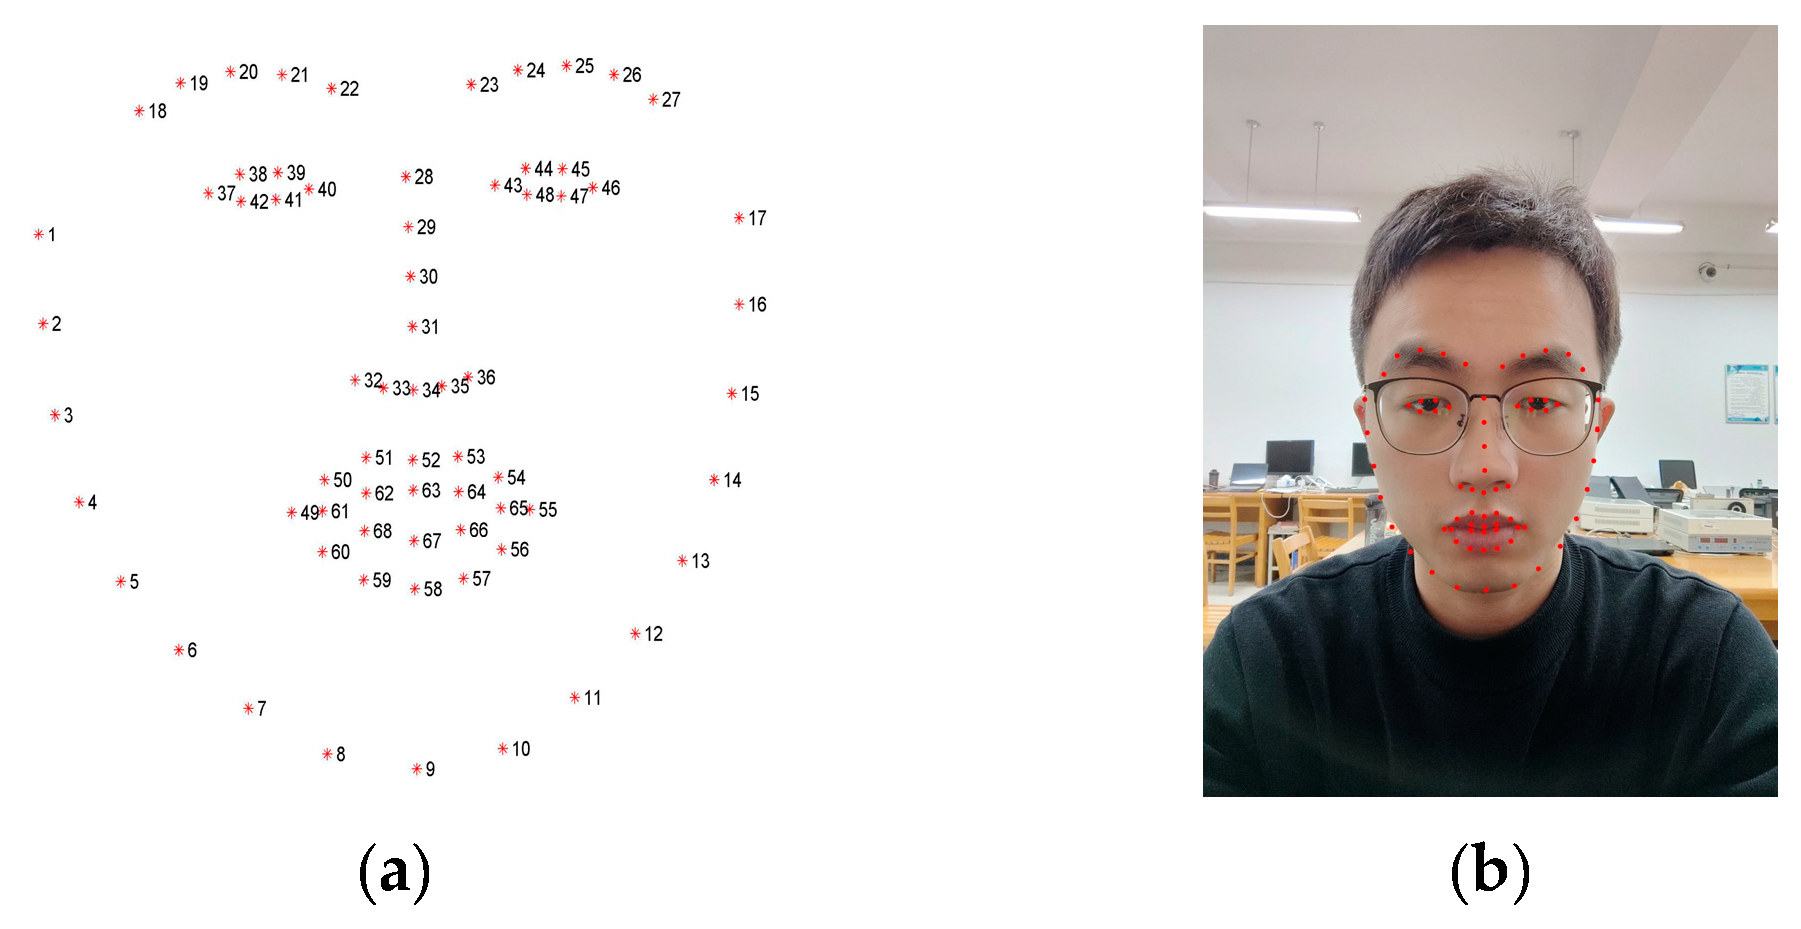
In this study, Dlib was used to extract 68 facial key points related to the eyes, mouth, and facial contours. These landmarks are illustrated in
Figure 2a, and their actual detection results on video frames are shown in
Figure 2b. The extracted feature points serve as the basis for calculating fatigue-related indicators and subsequent facial behavior analysis.
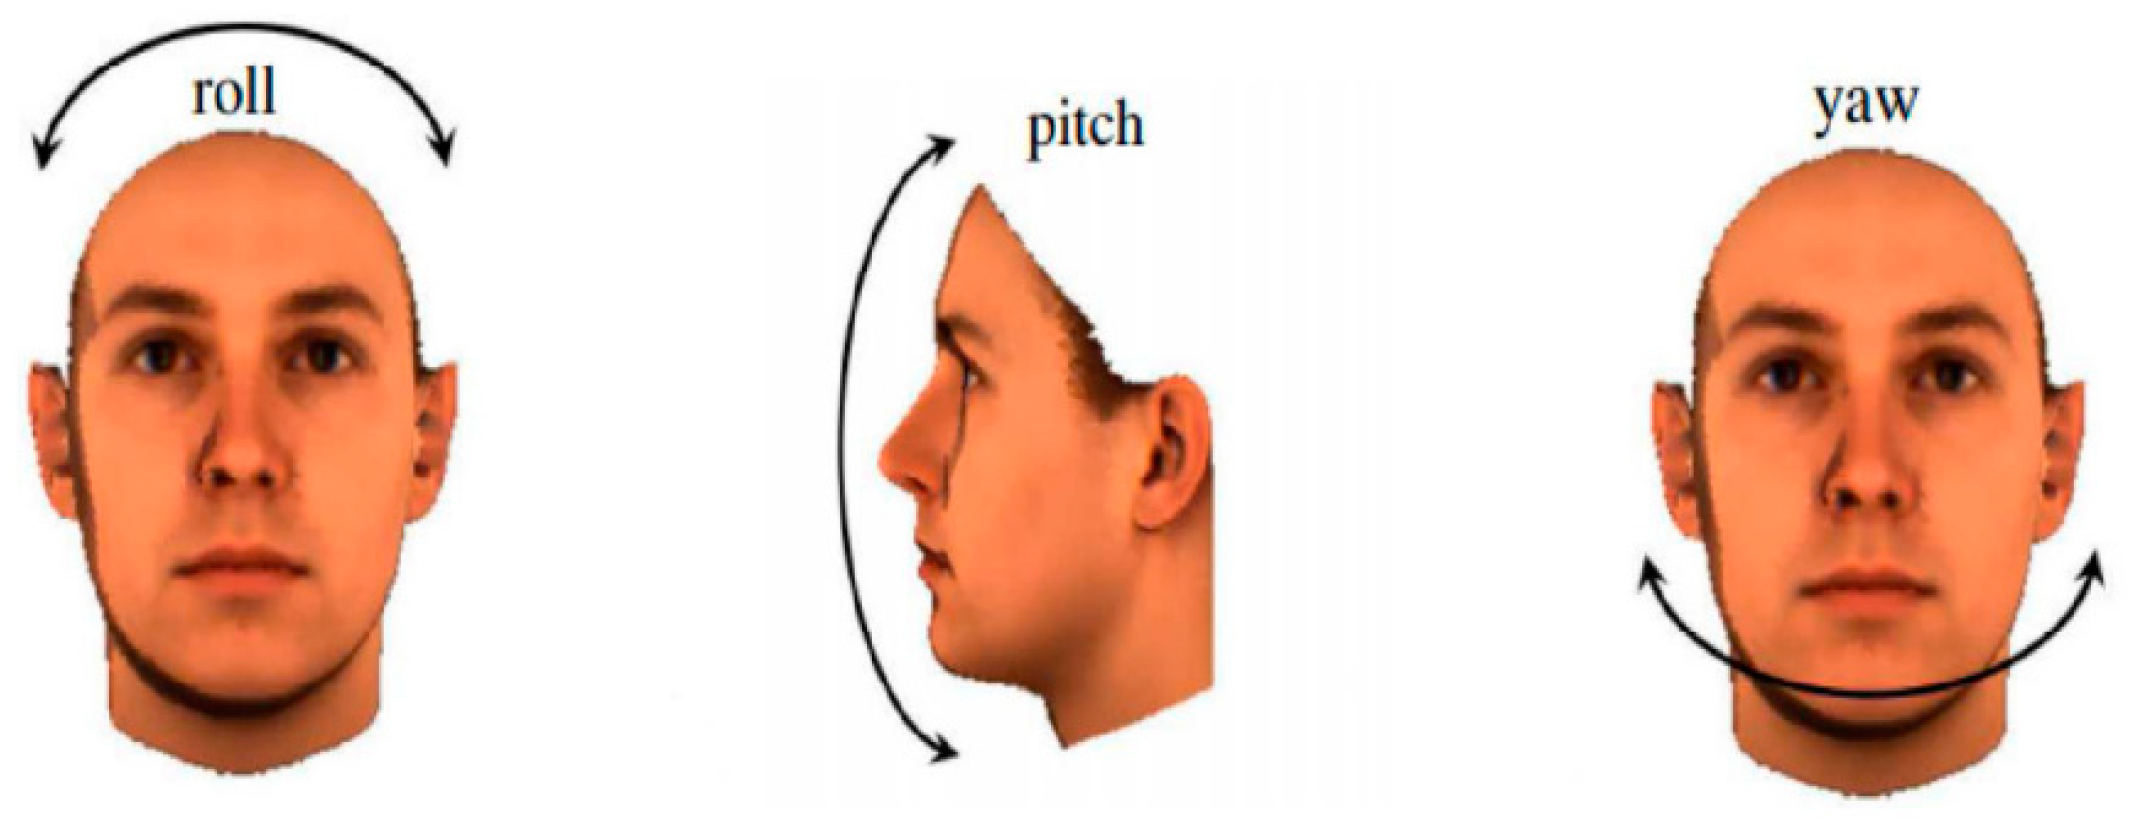
Vertical head movement, particularly downward nodding, is widely recognized as a key behavioral indicator of driver fatigue. As illustrated in
Figure 3, head pose is described by three rotational angles: roll, pitch, and yaw. Among these, the pitch angle is most directly associated with vertical head motion and was therefore adopted as the primary evaluation metric for fatigue detection in this study.
Head pose estimation is performed based on facial landmark detection using the Dlib toolkit, which extracts 2D image feature points corresponding to predefined 3D facial model coordinates. Combined with the intrinsic parameters of the camera, the Perspective-n-Point (PnP) [
36] algorithm is employed to solve for the rotation vector. This vector is then converted into a rotation matrix via the Rodrigues transformation [
37]. The pitch angle, denoted as HEAα (head Euler angle α), is calculated from the elements of the rotation matrix using the following formula:
where
,
,
are the elements in the third row of the rotation matrix [
37]. This angle effectively captures vertical head movements, which are highly indicative of drowsiness-related behavior. The function arctan2(
v,u) used here denotes the two-argument inverse tangent function, which calculates the angle between the point (
v,u) and the horizontal axis. It returns values in the range (−π,π]. Unlike the traditional arctan(
u/v), the arctan2 function takes into account the sign of both arguments to determine the correct quadrant of the angle, thereby avoiding division-by-zero errors.
According to the biomechanical literature [
38], the natural pitch angle range of the human head spans approximately from −50° to 45°. In this study, abnormal nodding is defined as any instance where HEAα falls within the lowest 30% of this range, specifically between −50° and −35°. When HEAα enters this range and meets certain temporal continuity or frequency conditions, it is identified as an abnormal nodding event and used as an indicator of driver fatigue.
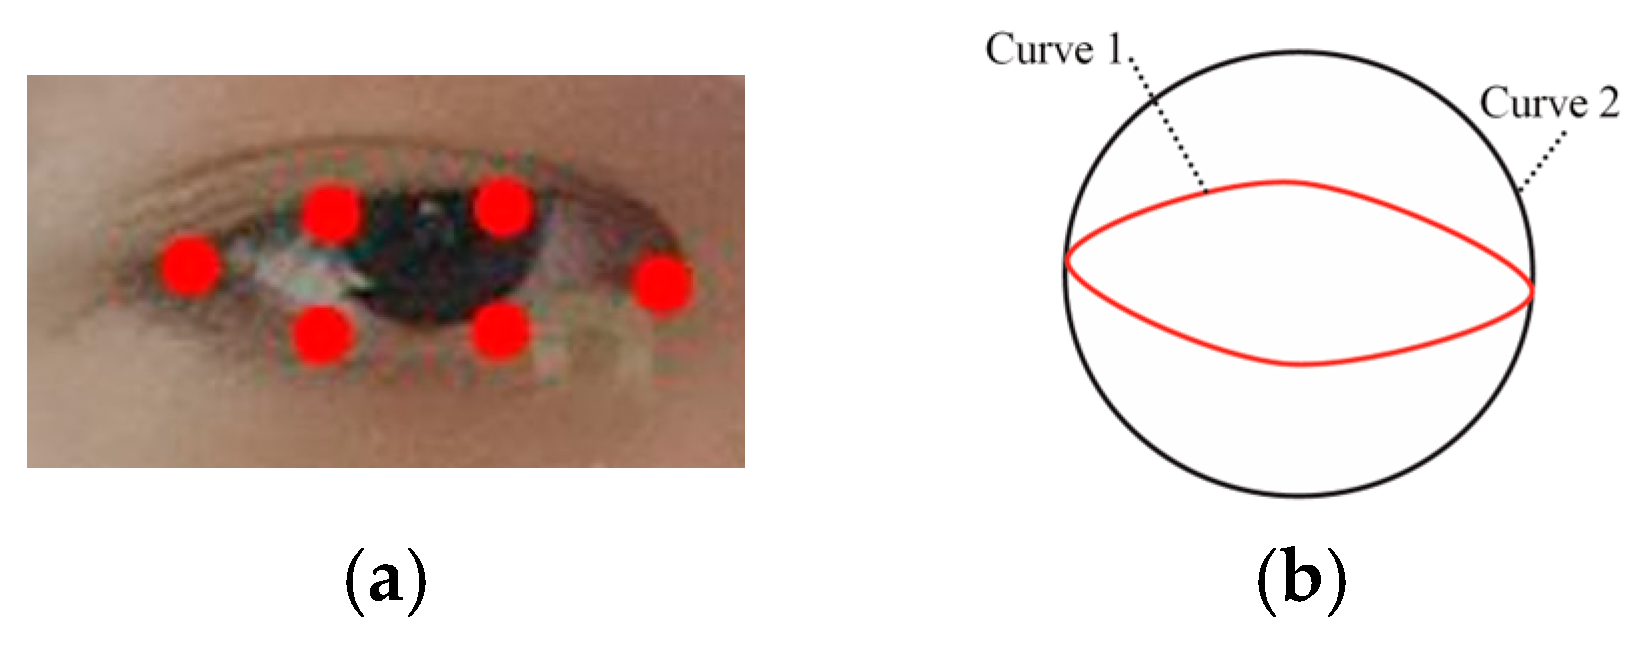
To model the opening and closing states of the eyes and mouth, parabolic fitting is applied to their contour curves. This method captures the essential vertical shape variation using limited facial landmarks and ensures a good trade-off between fitting accuracy and computational efficiency. It is well-suited for real-time fatigue detection tasks.
Specifically, the right eye contour curve is segmented into upper and lower parts by nodes 43 and 46, while the left eye contour curve is segmented into upper and lower parts by nodes 37 and 40. Similarly, the mouth contour curve is divided into upper and lower parts by nodes 49 and 55. The upper part of the contour curve is represented by
in Equation (2), while the lower part is represented by
in Equation (2).
The data of the upper and lower parts of the nodes of the left eye, the right eye, and the mouth are inputted into
and
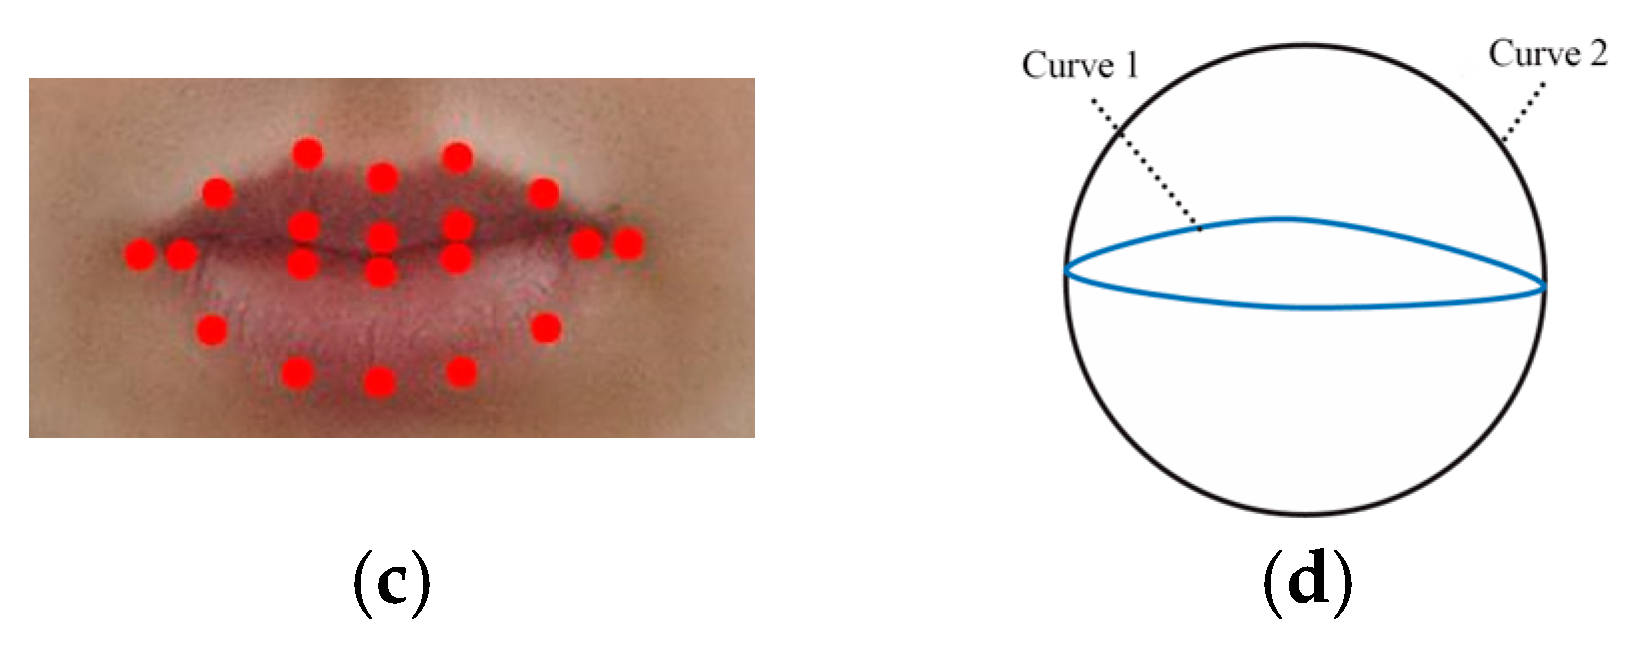
, respectively. Then, the sum of the error squares is calculated, and the function minimizing this sum is determined as the contour fitting curve. Curve 1 in
Figure 4b illustrates the contour fitting curve for the eyes in the open state, while Curve 1 in
Figure 4d depicts the contour fitting curve for the mouth in the closed state.
To normalize the openness of the eyes and mouth, the area enclosed by the fitted contours and the area of their circumscribed circle are calculated. The process for constructing the circumscribed circle and calculating the enclosed area is as follows:
- (1)
Determining the center of the circumscribed circle:
The x-coordinates of the vertices of the fitted parabolas,
= −
/2
and
= −
/2
, are used to compute the center
C = (
,
) of the circle:
- (2)
Radius of the circumscribed circle:
The radius
R is determined as the maximum Euclidean distance from the center to the sampled points along both parabolas:
- (3)
Area of the circumscribed circle:
The area of the circumscribed circle is given by:
- (4)
Fitted area between the contours:
The area between the upper and lower parabolic contours is computed using the definite integral over the fitting interval:
- (5)
Normalized aperture metric:
The final normalized aperture metric is defined as:
The degree of eye and mouth opening and closing is calculated by Equation (7) and is used as a normalized index for the calibration of opening size.
represents the area enclosed by the fitted contour curve of the eyes and mouth, whereas
represents the area of their circumscribed circle. In
Figure 4b, Curve 2 represents the circumscribed circle of the eye’s feature points in the open state. In
Figure 4d, Curve 2 represents the circumscribed circle of the mouth’s feature points in the closed state.
The normalized aperture indicator
for the eyes is shown in
Section 3.1. The normalized aperture indicator
for the mouth is shown in
Section 3.1.
2.3. Personalized Thresholds
Considering the individual differences in eye and mouth sizes among drivers, using uniform average thresholds may reduce the accuracy of facial state detection. To enhance the adaptability and robustness of the system, a personalized threshold database was constructed based on (Normalized Eye Area) and (Normalized Mouth Area). This database adjusts threshold values according to the driver’s facial features under normal conditions (i.e., eyes open and mouth closed), accommodating variations across different individuals. To improve the reliability of the threshold calibration, initial video frames are selected from the beginning of the driving task, when participants are typically in a rested and alert state. Additionally, subjective questionnaires and manual screening are employed to ensure that the selected frames reflect the driver’s baseline (non-fatigued) condition.
The and ranges used for threshold classification were derived from the publicly available WIDER FACE dataset. More than 600 representative facial images were selected from this dataset, covering a wide range of diversity in gender, ethnicity, facial structure, and the presence of accessories such as eyewear, facial hair, and masks. As WIDER FACE is a widely used benchmark in facial analysis with extensive demographic variability, the derived thresholds offer better generalizability and robustness across heterogeneous driver populations.
Method for Determining Personalized Thresholds:
1. Initial Data Collection:
During the first interaction with the system, the initial data are collected by selecting the video frames where the eyes are open and the mouth is closed.
Theandvalues are calculated from these frames, and the sizes of the driver’s eyes and mouth are assessed to determine whether they fall within the normal range.
As shown in
Table 1, the driver’s eye and mouth sizes are evaluated using standardized indexes and categorized based on different facial feature ranges.
2. Adaptive Threshold Adjustment:
The personalized thresholds for each driver are set based on their individual eye and mouth sizes, determined from the initial measurements of
and
. For example, if the driver’s eye and mouth sizes fall into the “Normal eyes, Undersize mouth” category, the system sets the corresponding
and
thresholds. Other categories are similarly adjusted according to the driver’s individual characteristics. The threshold divisions for eye sizes and mouth sizes are listed in
Table 2 and
Table 3, respectively.
2.4. Sliding Window Model
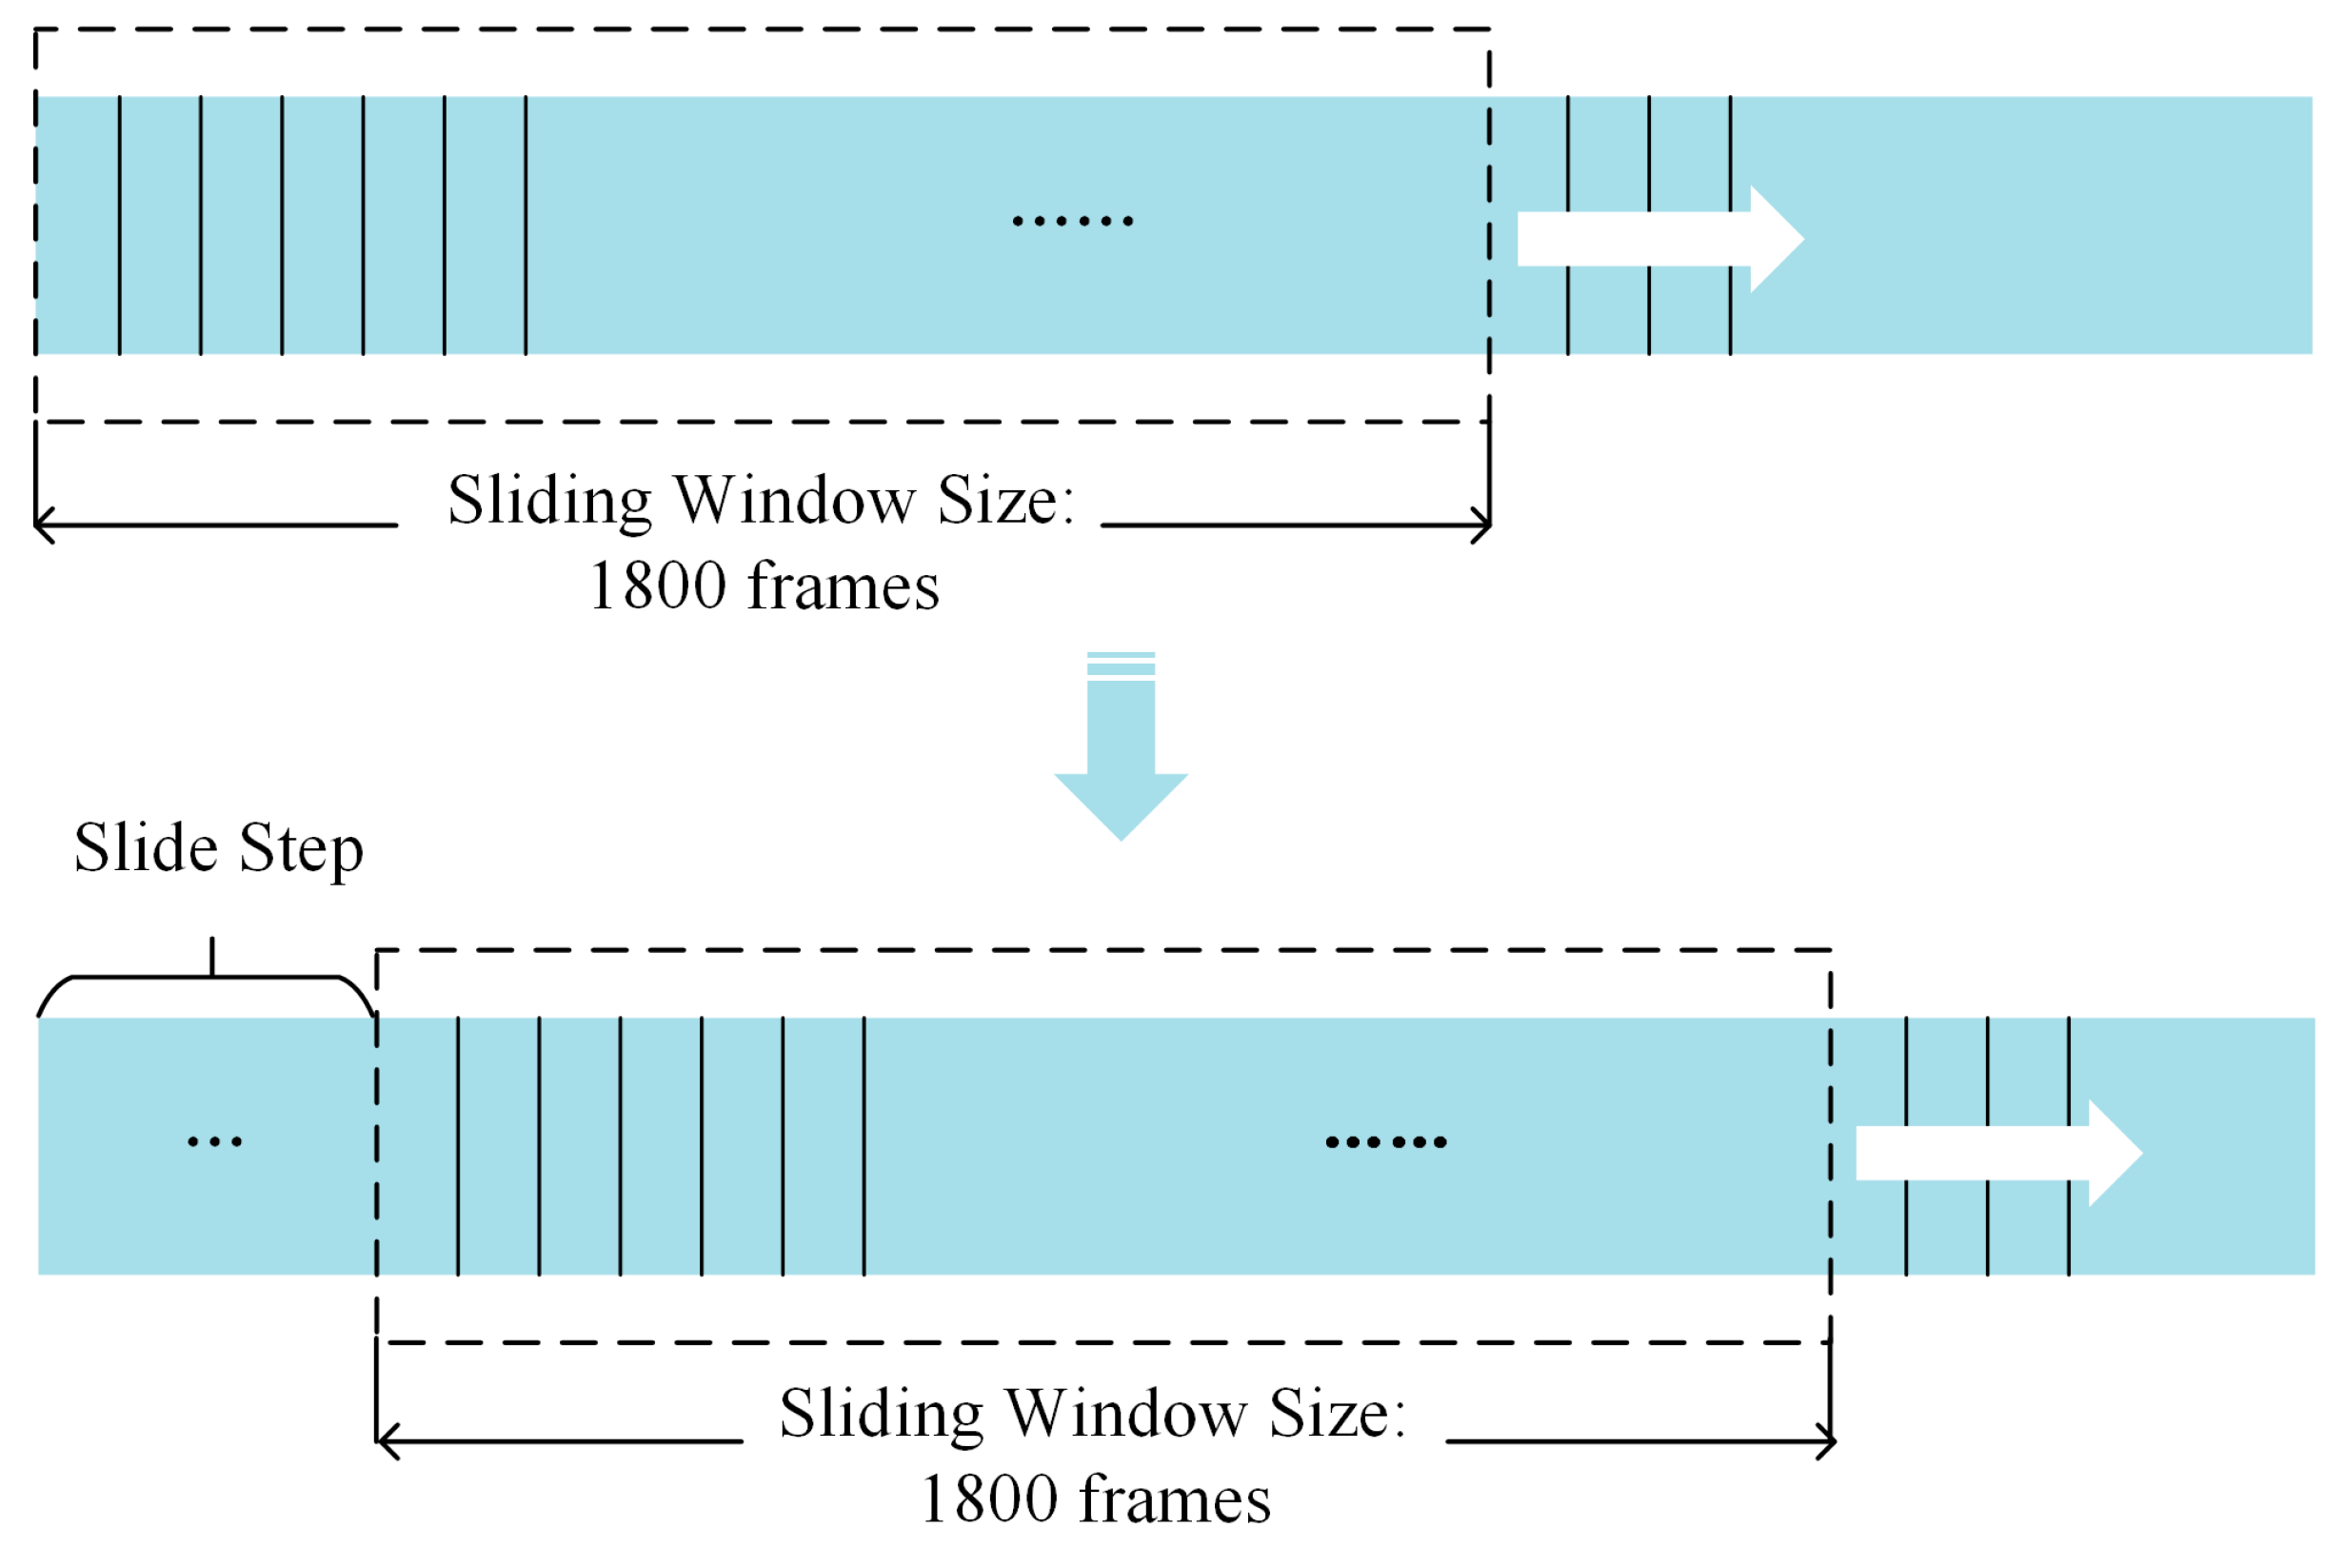
Driver fatigue is a dynamic process that requires assessing the driver’s state over time. To capture this, a sliding window model is employed, as illustrated in
Figure 5. In this model, it is as follows:
Eye state is labeled as 0 (closed) when is below the personalized threshold, and 1 (open) otherwise.
Mouth state is labeled as 0 (closed) when is below the threshold, and 1 (open) otherwise.
Nodding state is labeled as 0 (normal) when HEAα is below its threshold, and 1 (nodding) otherwise.
The window size is set to 1800 frames, and the step size is 30 frames, ensuring that fatigue state is determined based on continuous feature data from 1800 frames.
After obtaining head Euler angles (HEAs),
and
, the blinking frequency (BF), yawning frequency (YF), and nodding frequency (NF) can be further calculated from these evaluation indexes, which are calculated as follows:
where
n represents the number of frames of blinking, yawning, or nodding in a sliding window, and
T is set to 1800 frames (equivalent to 1 min of video at 30 frames per second). The blinking frequency (BF) is calculated based on the average of both eyes. Since blinking is a synchronized bilateral behavior, using the average of both eyes provides a reliable and accurate measure.
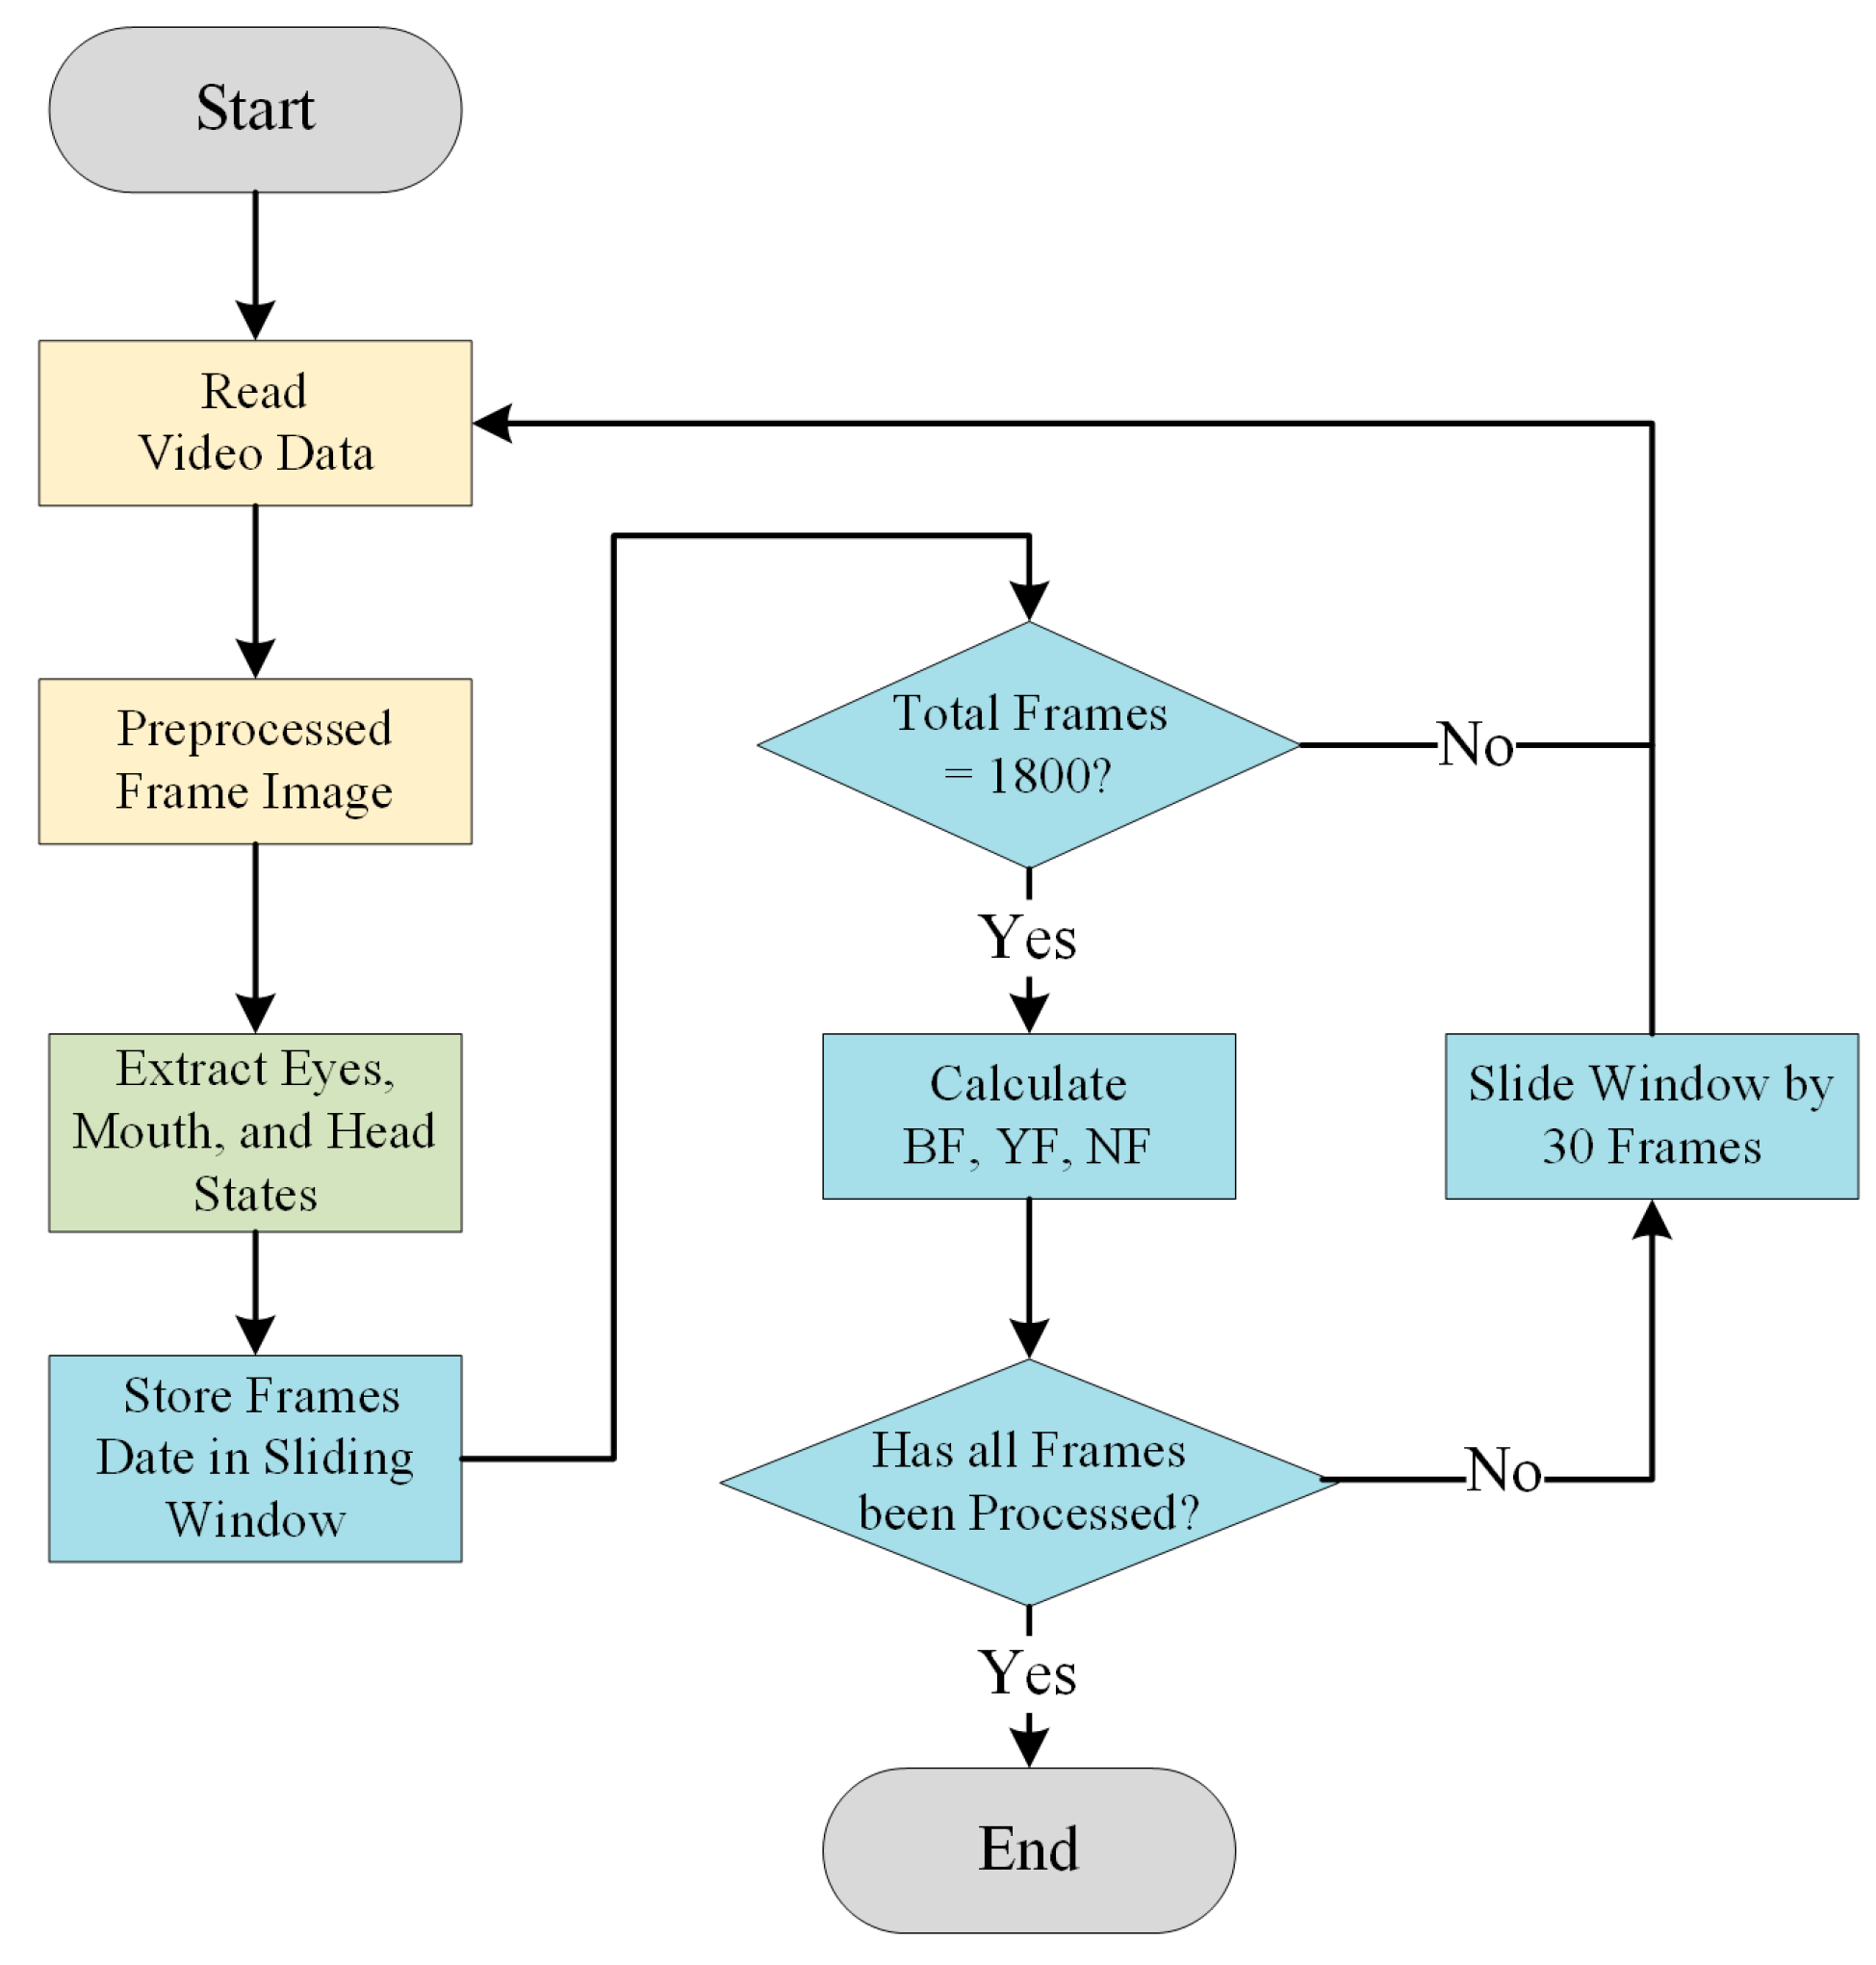
As shown in
Figure 6, the flowchart illustrates the process of calculating BF, YF, and NF using the sliding window model. The specific algorithm for calculating these evaluation indexes is detailed in Algorithm 1.
| Algorithm 1 Evaluation Indexes |
| T = 1800; | # Sliding window size, set to 1800 frames |
| S = 30; | # The step size of the sliding window, set to 30 frames |
| = [ ]; | # Blink frequency in the i-th sliding window |
| = [ ]; | # Yawning frequency in the i-th sliding window |
| = [ ]; | # Nodding frequency in the i-th sliding window |
| # n is the number of sliding windows and N is the total number of frames acquired continuously |
| i = 1, 2, 3 … n; | |
| |
represents the blinking state in the t-th frame image, represents the yawning state in the t-th frame image, and represents the nodding state in the t-th frame image. The expression ⌊(N − T)/S⌋ denotes rounding down to ensure that the total number of frames N is not exceeded.
2.5. Feature Fusion Model
Following the normalization, the three evaluation indexes BF, YF, NF are combined into a single fatigue evaluation index
. Its expression is as follows:
The expression indicates that
represents the
i-th evaluation index, and
represents the distribution weight of the
i-th index. According to the importance and practicability of each physiological behavior in reflecting the fatigue degree, and incorporating the continuously updated
from the experimental validation in
Section 3.6, the values of the
W were distributed as: The value of
is maximized (valued as 0.4) because research and experimental observations indicate that BF is typically considered one of the most important indicators in fatigue driving detection. A significant increase in BF may indicate that the driver is experiencing fatigue. Additionally, by matching the personalized
threshold for different drivers, the impact of eye size is effectively eliminated, thereby justifying a higher weight for BF. YF and NF are regarded as secondary indicators. Although they can also reflect fatigue, their changes may not be as significant or frequent as those of BF Therefore, they are assigned lower weights (
= 0.3,
= 0.3) to reflect their relative importance in detecting fatigue while driving. Assigning weights of 0.4, 0.3, and 0.3 maintains the dominant role of blink frequency while appropriately considering the contributions of yawning and nodding, ensuring that the fatigue driving detection system remains sensitive and accurate under various conditions.
2.6. Fatigue Classification Based on Fuzzy Logic
Fatigue is a gradual, continuous, and subjective process influenced by physiological and psychological fluctuations. Traditional classification methods often segment fatigue into discrete levels—such as awake, mild, moderate, and severe—by applying fixed thresholds to a composite fatigue index. However, such rigid boundaries can lead to classification instability, especially near the threshold regions where small input variations cause abrupt state transitions.
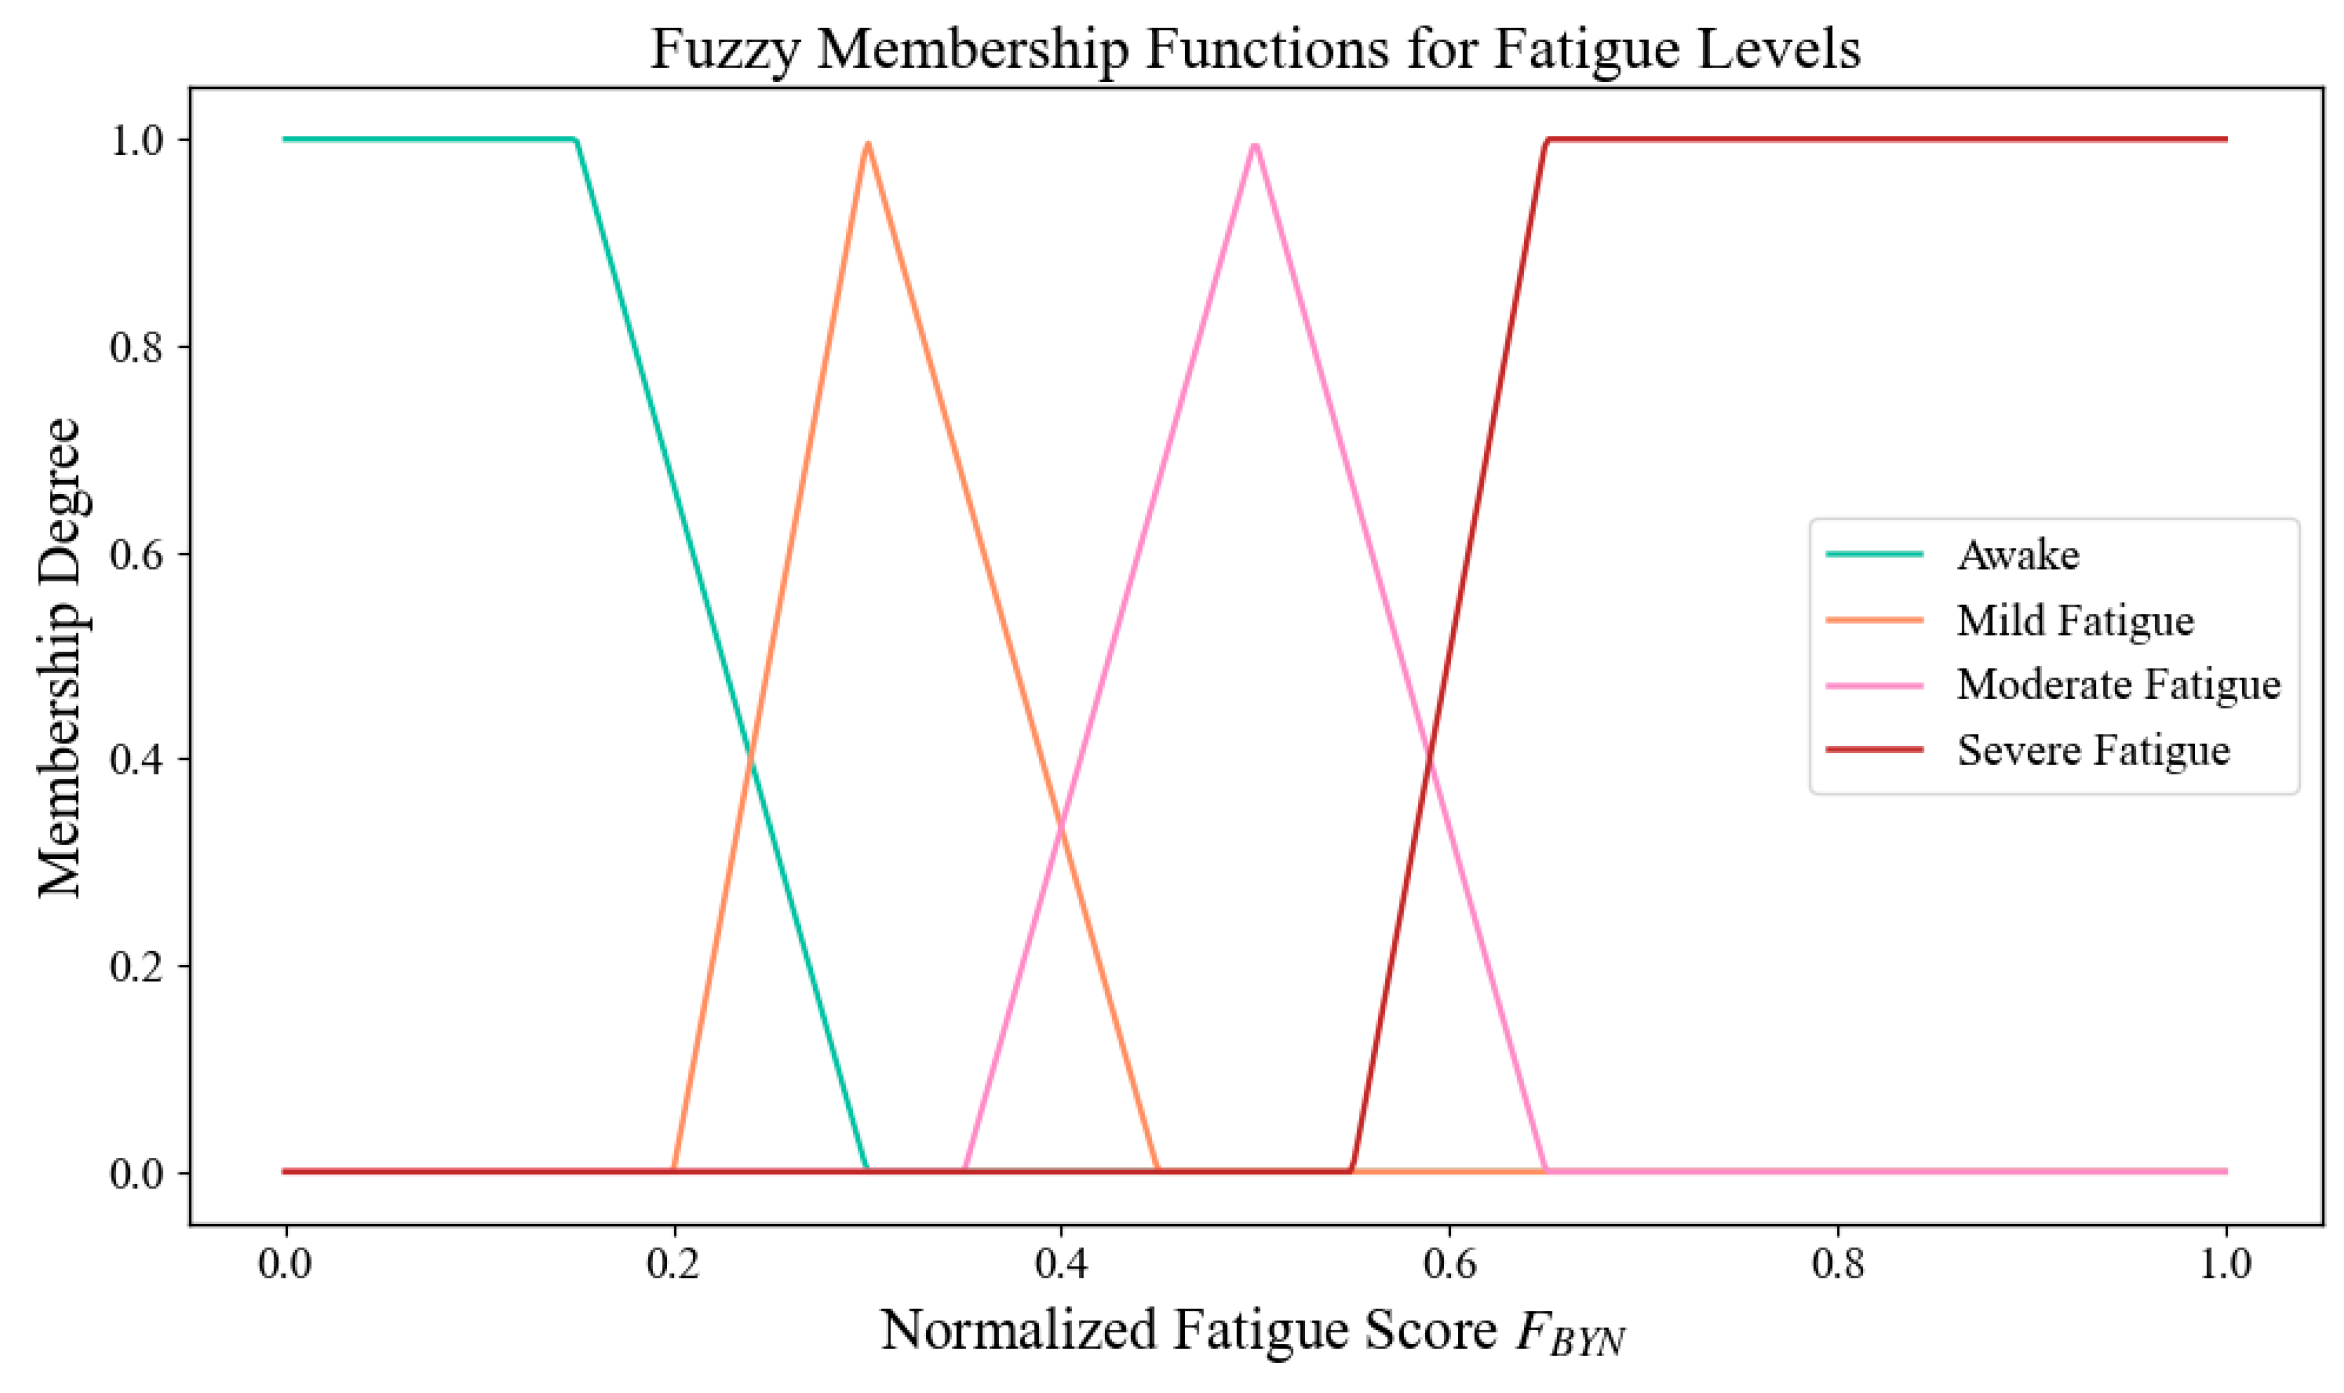
To address this limitation, a fuzzy logic-based classification approach is employed in this study. The normalized fatigue score
∈ [0, 1] is mapped to overlapping fuzzy sets, each corresponding to a fatigue level. These sets are defined by triangular or trapezoidal membership functions, allowing a single input to simultaneously belong to multiple states with varying degrees of membership. The final fatigue level is determined by selecting the label with the highest membership value, as described in Algorithm 2.
| Algorithm 2 Fatigue Classification Based on Fuzzy Logic |
| Input:. |
Output:.
1: Define fuzzy membership functions:
2:
3: Initialize fatigue level Y ← null |
| 4: do |
| 5: to Awake |
| 6: to Mild Fatigue |
| 7: to Moderate Fatigue |
| 8: to Severe Fatigue |
9: ← {
10: ,
11: ,
12: ,
13:
14: } |
| 15: Determine output Y ← argmax() |
| 16: end for |
| 17: return Y |
Let denote the normalized fatigue score. The membership functions for each class are defined as follows:
Awake (left-shoulder trapezoidal function):
Mild Fatigue (triangular function):
Moderate Fatigue (triangular function):
Severe Fatigue (right-shoulder trapezoidal function):
The final fatigue level is determined using the maximum membership principle:
This fuzzy classification mechanism significantly enhances the continuity and interpretability of fatigue detection. It reduces instability caused by hard thresholds and provides a more flexible and physiologically consistent approach to identifying driver fatigue states. The corresponding membership curves are illustrated in
Figure 7.
3. Experimental Results and Analysis
This article evaluates the performance of our proposed facial multi-feature fusion for fatigue detection. Initially, the algorithm’s feasibility and robustness were verified through online experiments with 12 participants, divided into three groups (A, B, and C), each consisting of 4 subjects. All participants completed a 30 min simulated driving task in a laboratory designed to replicate real-world conditions, including ambient noise and driving visuals.
To simulate different fatigue levels, experiments were conducted during both afternoon and late-night hours. Within each group, two participants performed the task in the afternoon, and two others during late-night sessions. This schedule ensured variations in mental alertness and induced mild to moderate fatigue. Participants followed a controlled daily schedule with limited rest, and caffeine intake was prohibited 3 h before the test. The experimental protocol was reviewed and approved by the institutional ethics committee.
Additionally, 45 randomly selected video segments from the YawDD dataset were used to further assess the algorithm’s accuracy in an offline setting, confirming the effectiveness of the personalized thresholds and the algorithm’s overall performance.
The data extraction and analysis platform used the programming language python 3.9 operated in a PyCharm environment based on the Windows 11 system. In addition, the Dlib toolkit was used to detect the face profile information and estimate the head posture for the 3D coordinate establishment. The camera provided an image resolution of 640 × 480 pixels, meeting the image acquisition requirement.
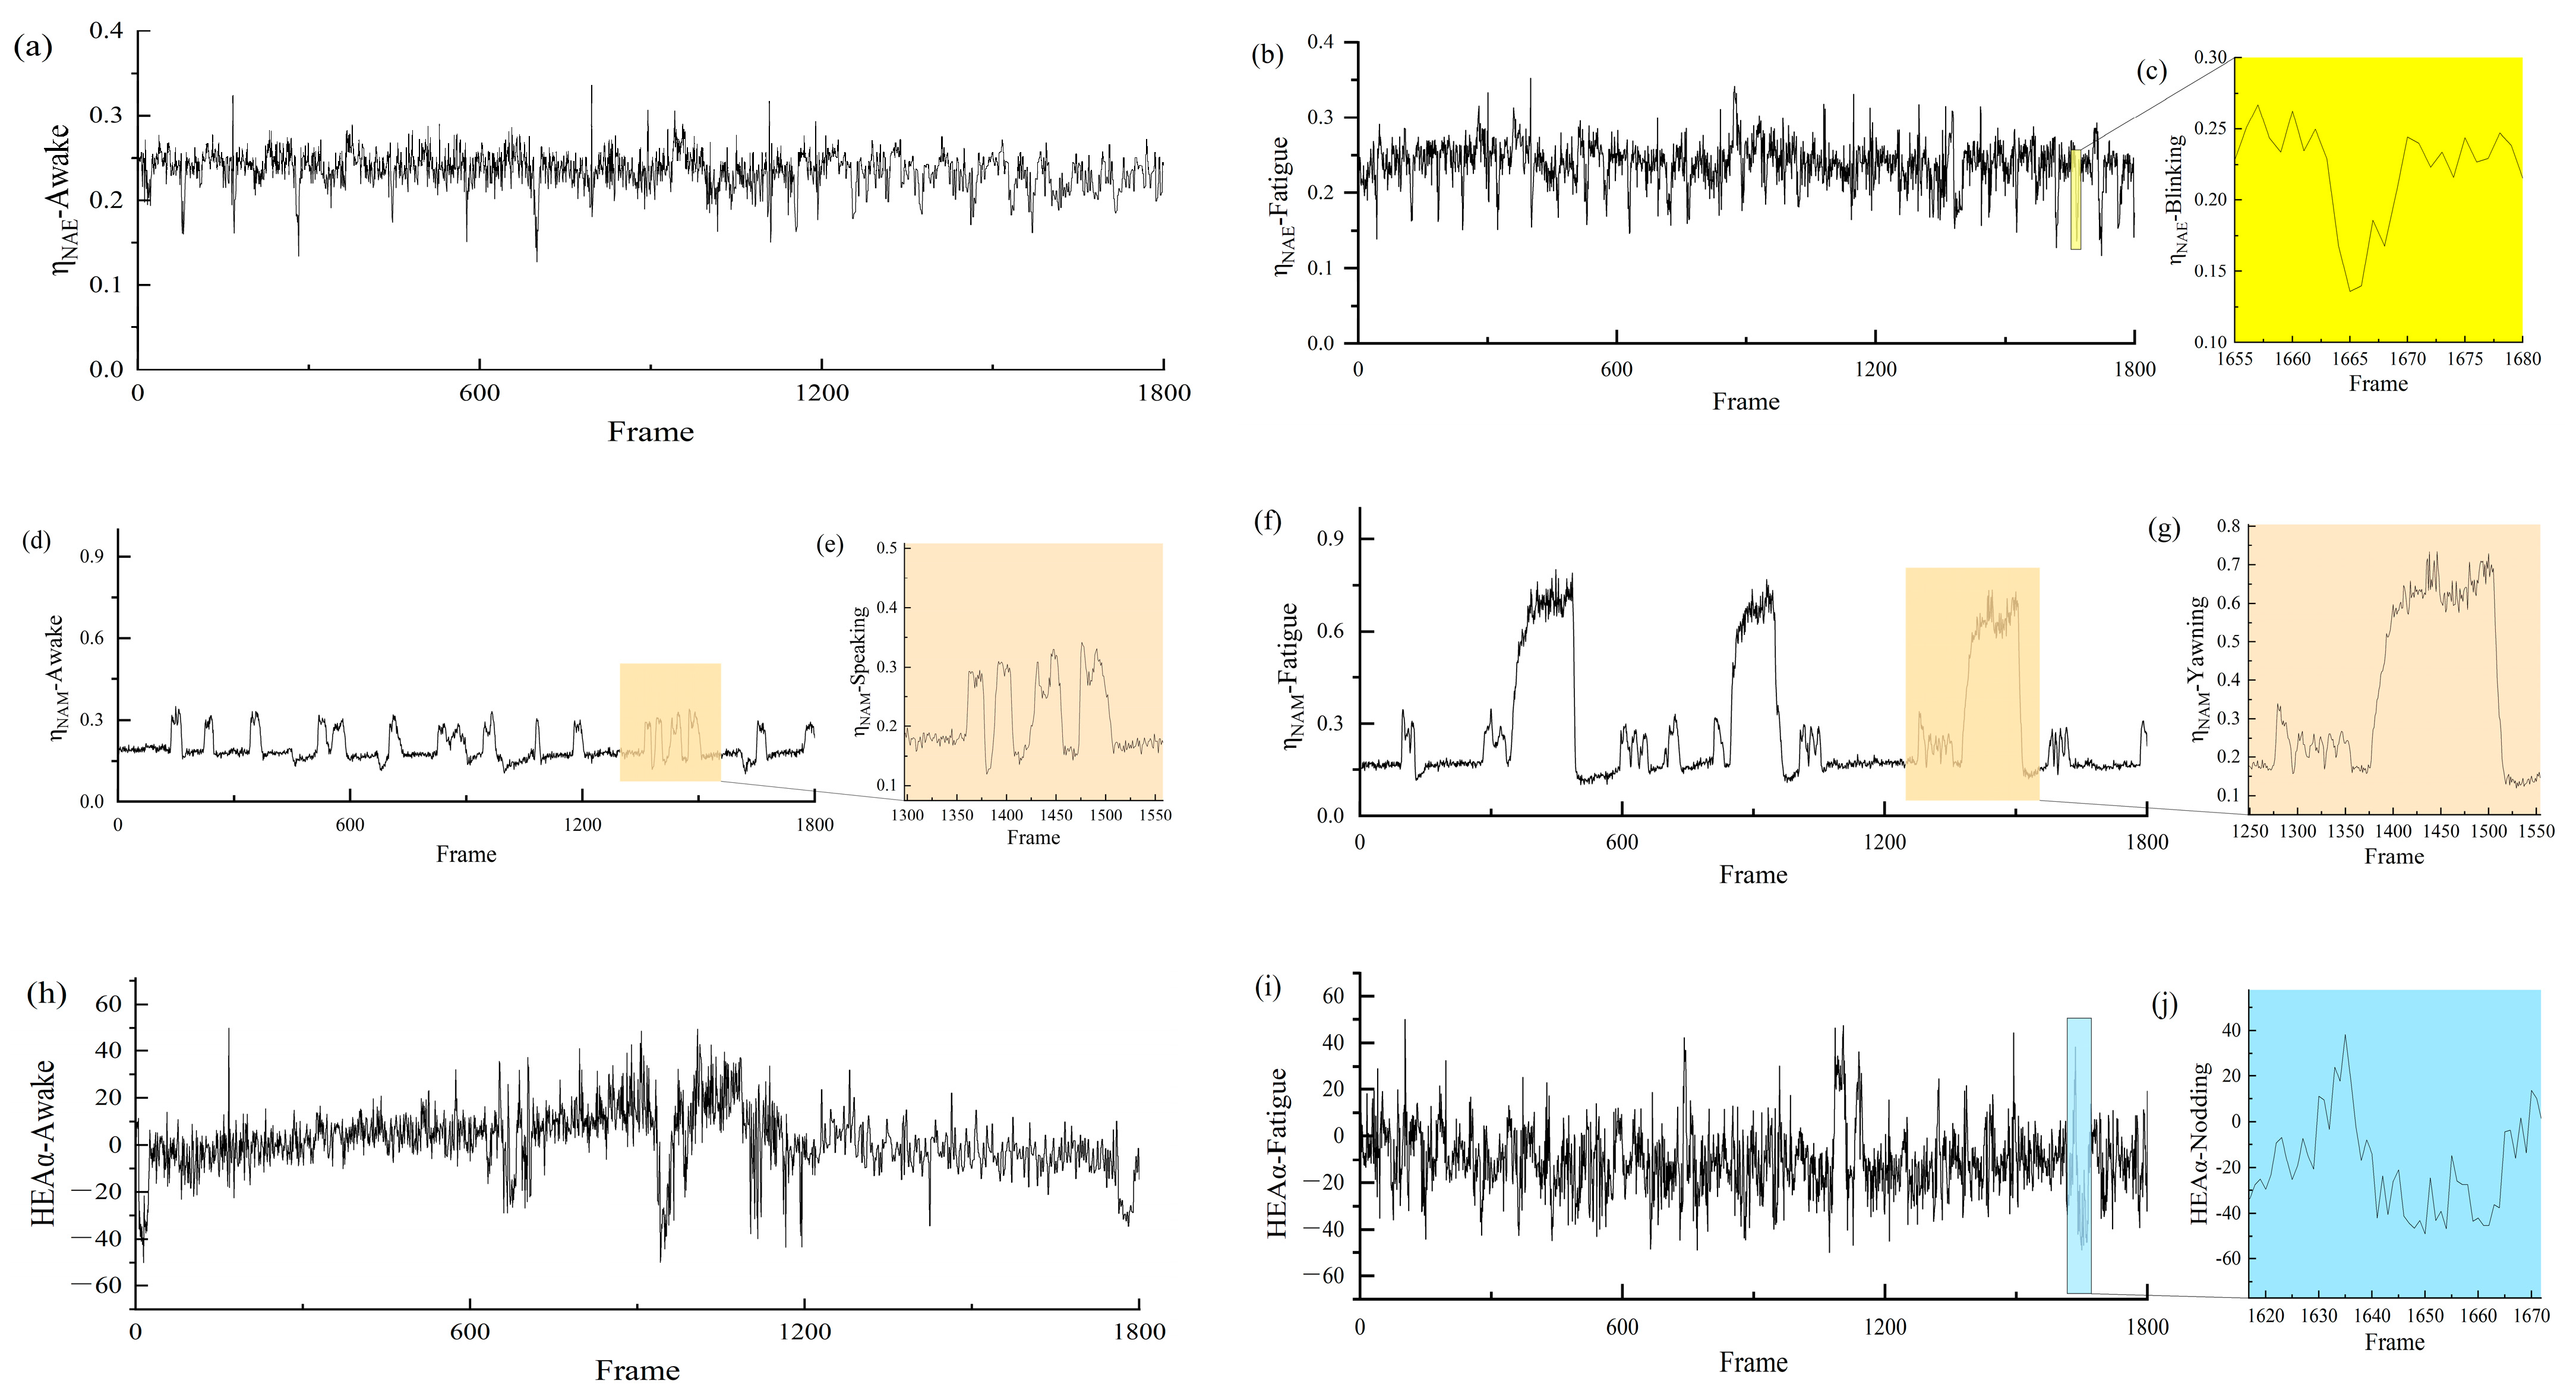
3.1. Changes in ,, and HEAα Values for Fatigue Detection
Figure 8 presents the blinking, yawning, and head movement behavior recorded from a single subject (participant “e”) among the 12 participants. This sample is used to illustrate the dynamic changes in
,
, and HEAα values across different fatigue states.
Figure 8a,d,h record the changes in
,
, and HEAα values of an alert individual over a sliding window of 1800 test frames (approximately one min). Specifically, the
values remain mostly on a stable baseline, as shown in
Figure 8a. When normal blinking occurs, a significant drop in the
values is observed. However, in a fatigue state [see
Figure 8b], the troughs in the
values become more frequent, reflecting the true physiological state of fatigue. As illustrated in
Figure 8c, an enlarged view of one
wave indicates that, under normal open-eye conditions, the
values fluctuate randomly within a narrow range of 0.20 to 0.26. However, when the eyes are closed or blinking, the
values sharply drop to around 0.13 but return to the original level once the eyes open. In summary, blink detection can be achieved by calculating the
values.
Similarly, the
values indicate the mouth’s open or closed state, as shown in
Figure 8d. Minor fluctuations around the 0.15 mean line represent a closed mouth state, while significant jumps in the
values occur during talking and yawning. The duration and amplitude of the value increase reflect the differences between normal open-mouth states (such as speaking) and physiological signs of fatigue. When yawning, the peaks in the
values last longer (over 80 frames) and have greater amplitude.
Figure 8e,g detail the changes in
values during talking and yawning, respectively. This demonstrates that the
values differentiate between normal and fatigue states.
Generally, when a person is awake, the head posture remains within a limited range of motion angles, whereas involuntary nodding occurs when feeling fatigued. This is well demonstrated in
Figure 8h,i, where the HEAα curves in the fatigued state show more frequent instances of HEAα exceeding the threshold.
Figure 8j captures a segment of the HEA curve during nodding, revealing that the HEAα values fluctuate within a larger range, with more frequent fluctuations in the fatigued state.
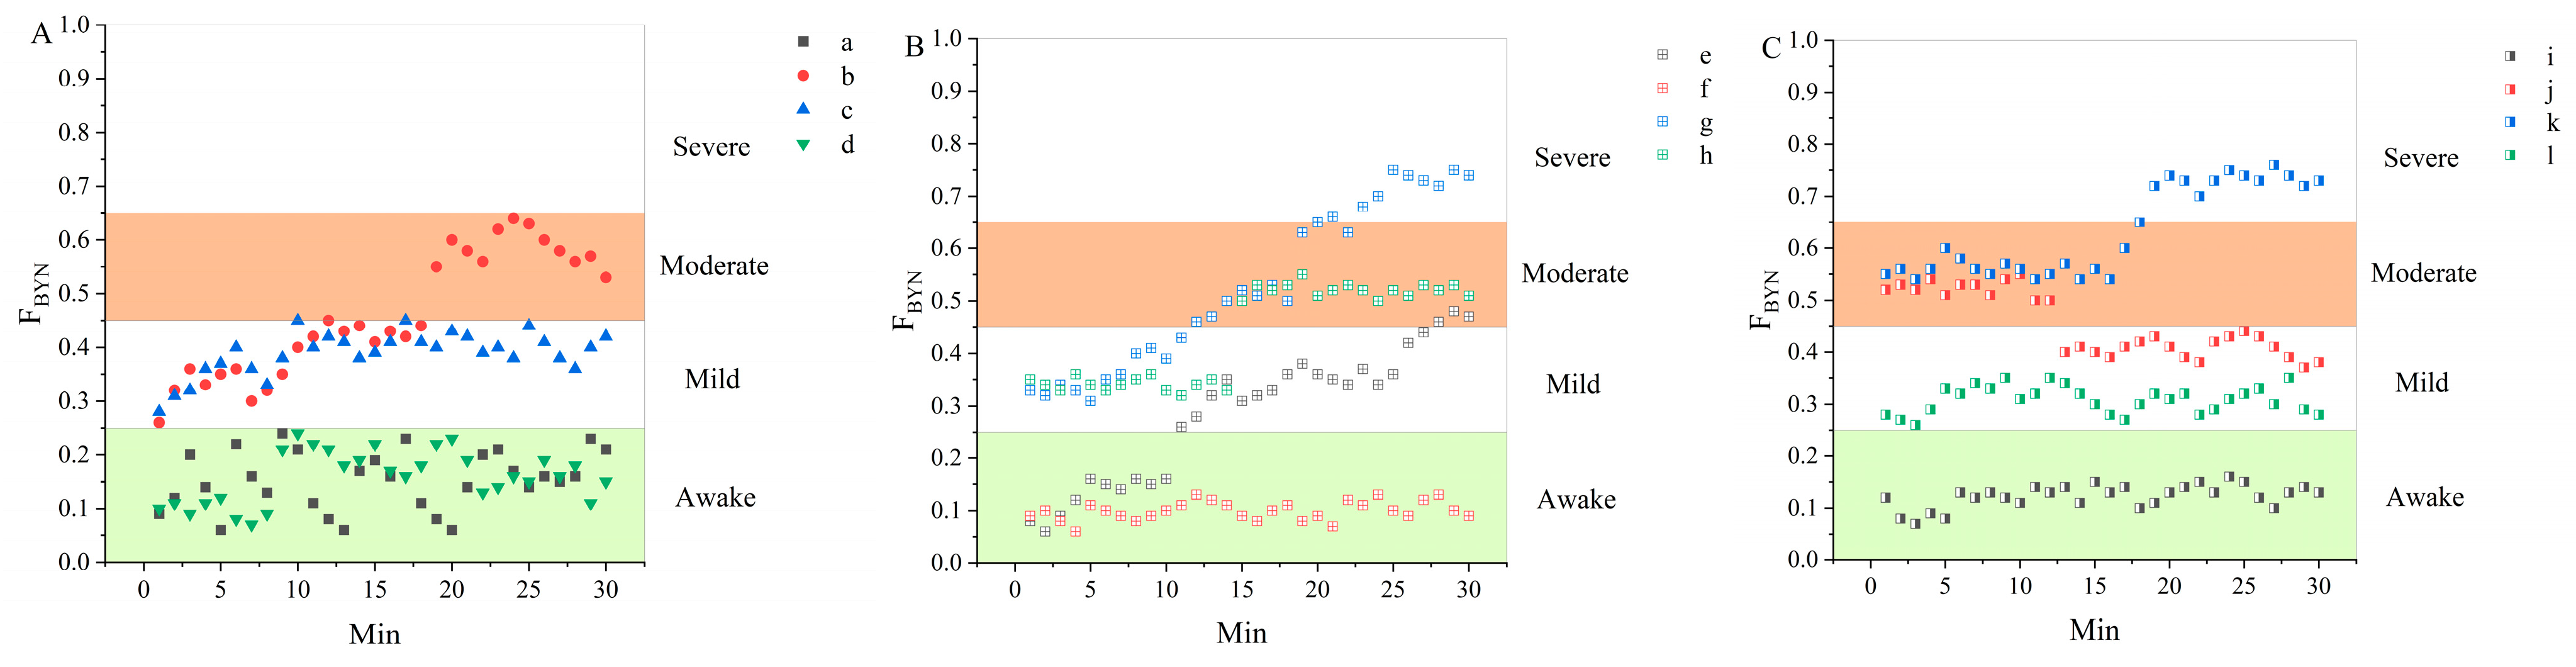
3.2. Fatigue State Changes in Driving Experiments
Figure 9 illustrates the changes in fatigue states among 12 participants from Groups A, B, and C over the course of a 30 min simulated driving experiment. The sessions were conducted during both afternoon and late-night periods. Most participants assigned to the afternoon sessions (Participants “a, d, e, f, i, l”) were in an alert state at the beginning of the experiment and gradually progressed to mild or moderate fatigue. In contrast, participants tested at late-night (Participants “b, c, g, h, j, k”) generally exhibited mild or even moderate fatigue from the outset due to reduced physiological alertness.
Overall, fatigue levels increased progressively as the experiment proceeded. Several individuals showed distinct fatigue progression patterns. For instance, Participant “e” exhibited a rapid transition from an alert state to mild fatigue, eventually progressing to moderate fatigue, indicating a continuous accumulation of fatigue. In contrast, Participant “j” showed a temporary decrease in fatigue level during the middle stage of the experiment, which may suggest a brief recovery or self-regulation phase. These observations highlight the influence of the time of day on fatigue development and emphasize the significant inter-individual variability in fatigue progression.
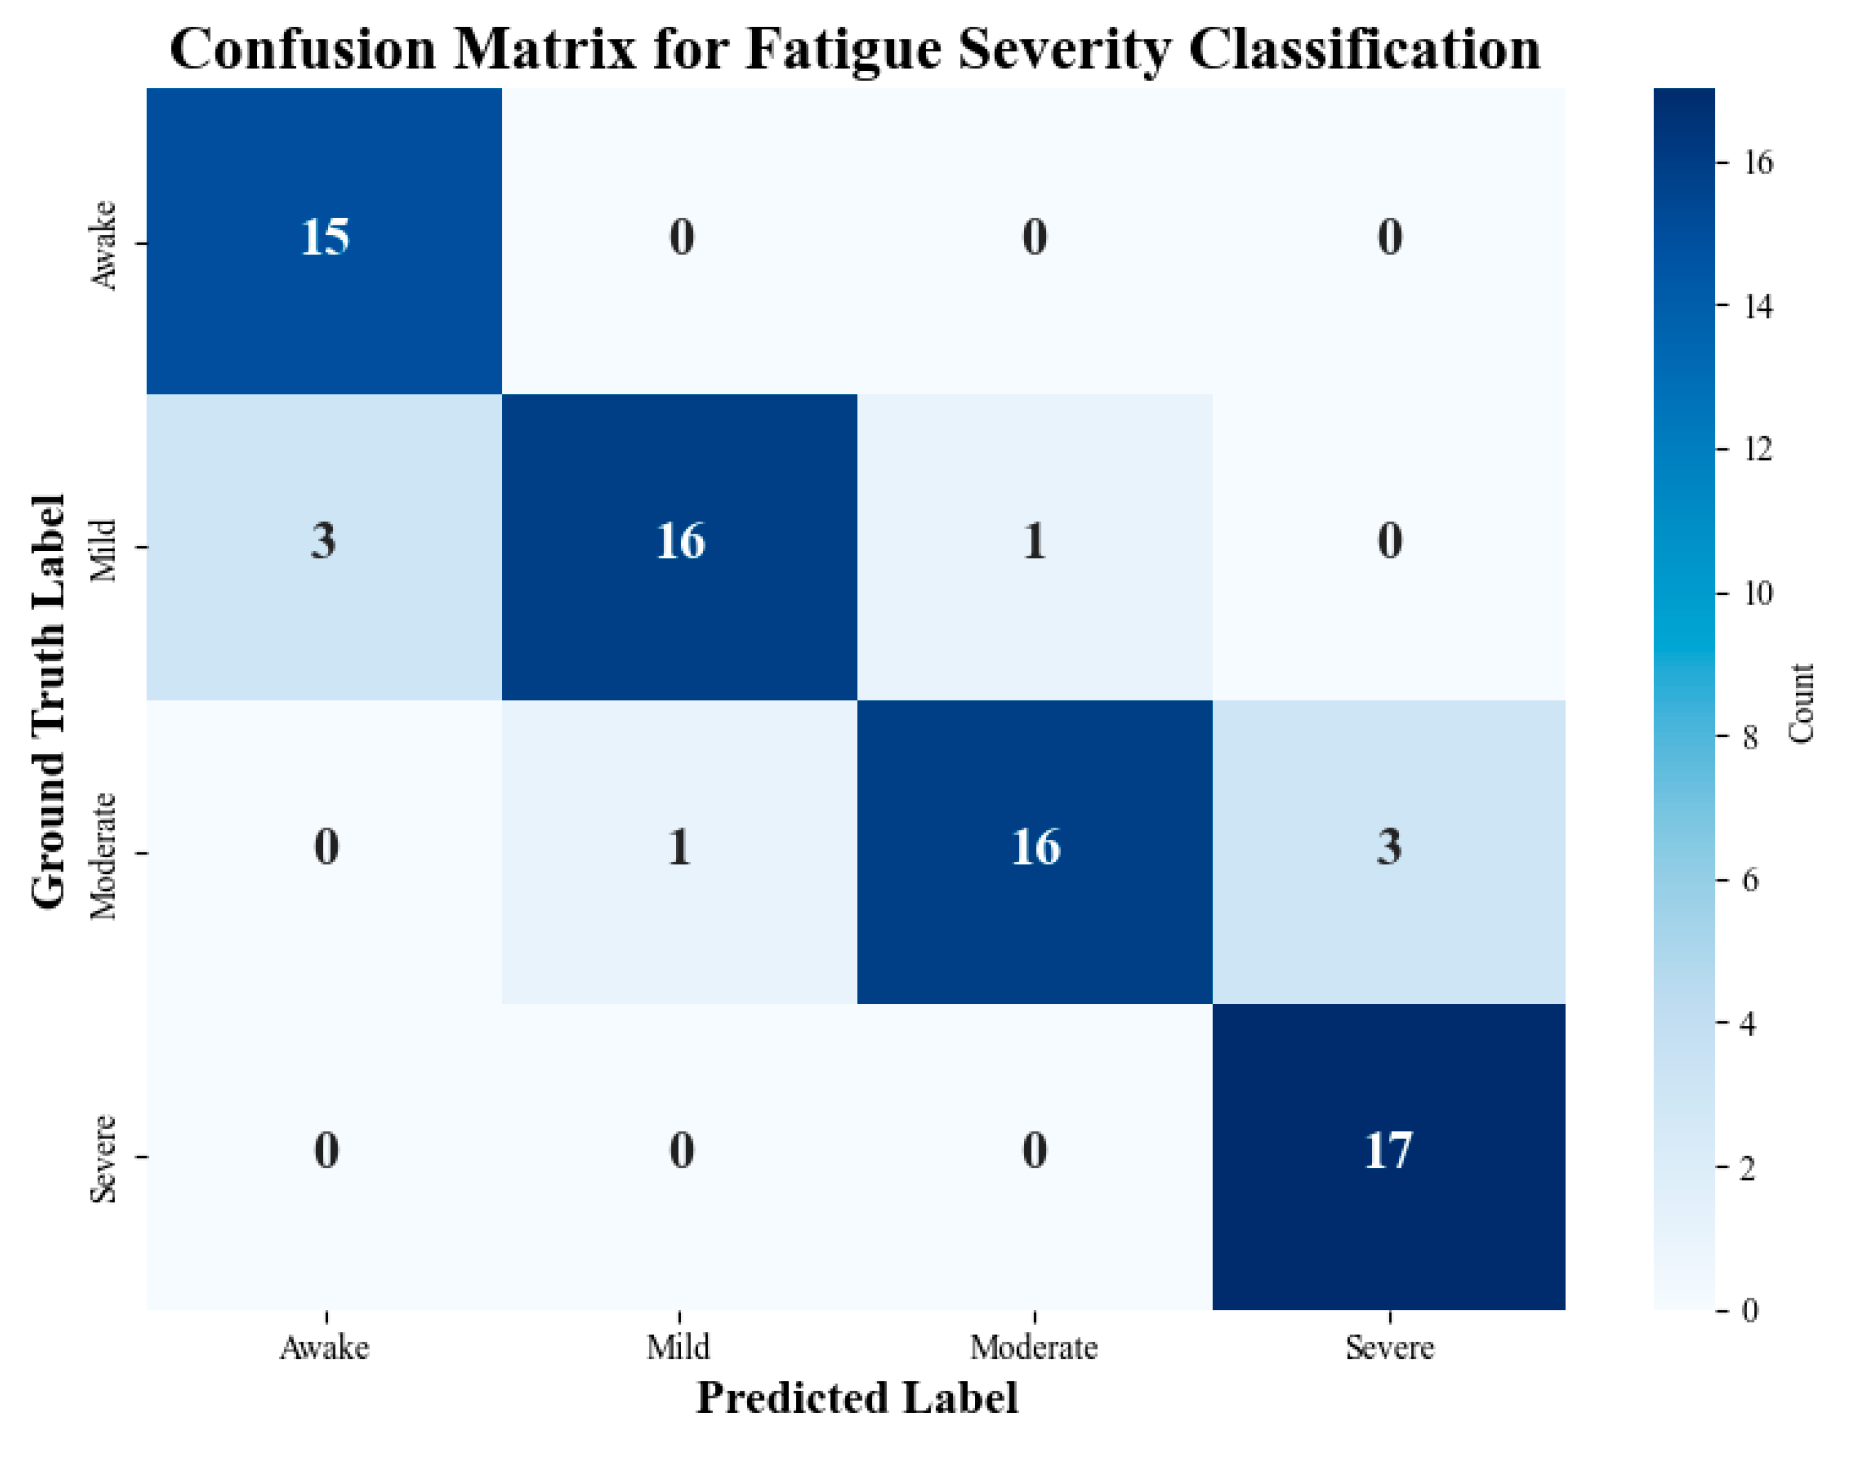
To evaluate the system’s ability to distinguish between multiple fatigue severity levels, a multi-class classification experiment was conducted based on data from 12 participants across six time points during a 30 min simulated driving task (72 total samples). Ground truth labels were determined through a combination of participant self-reported fatigue ratings and expert annotations of behavioral cues. The predicted fatigue levels were produced by the proposed model using fused behavioral indicators.
As shown in
Figure 10, the classification results yielded an overall accuracy of 91.7%, with particularly strong performance in recognizing Awake and Severe states (both achieving 100% classification accuracy). Misclassifications primarily occurred between adjacent classes, such as Mild and Moderate, which are often difficult to distinguish due to their gradual transitions in real-world conditions. The confusion matrix confirms that the proposed system can reliably distinguish between four fatigue levels, supporting its applicability in graded fatigue warning systems.
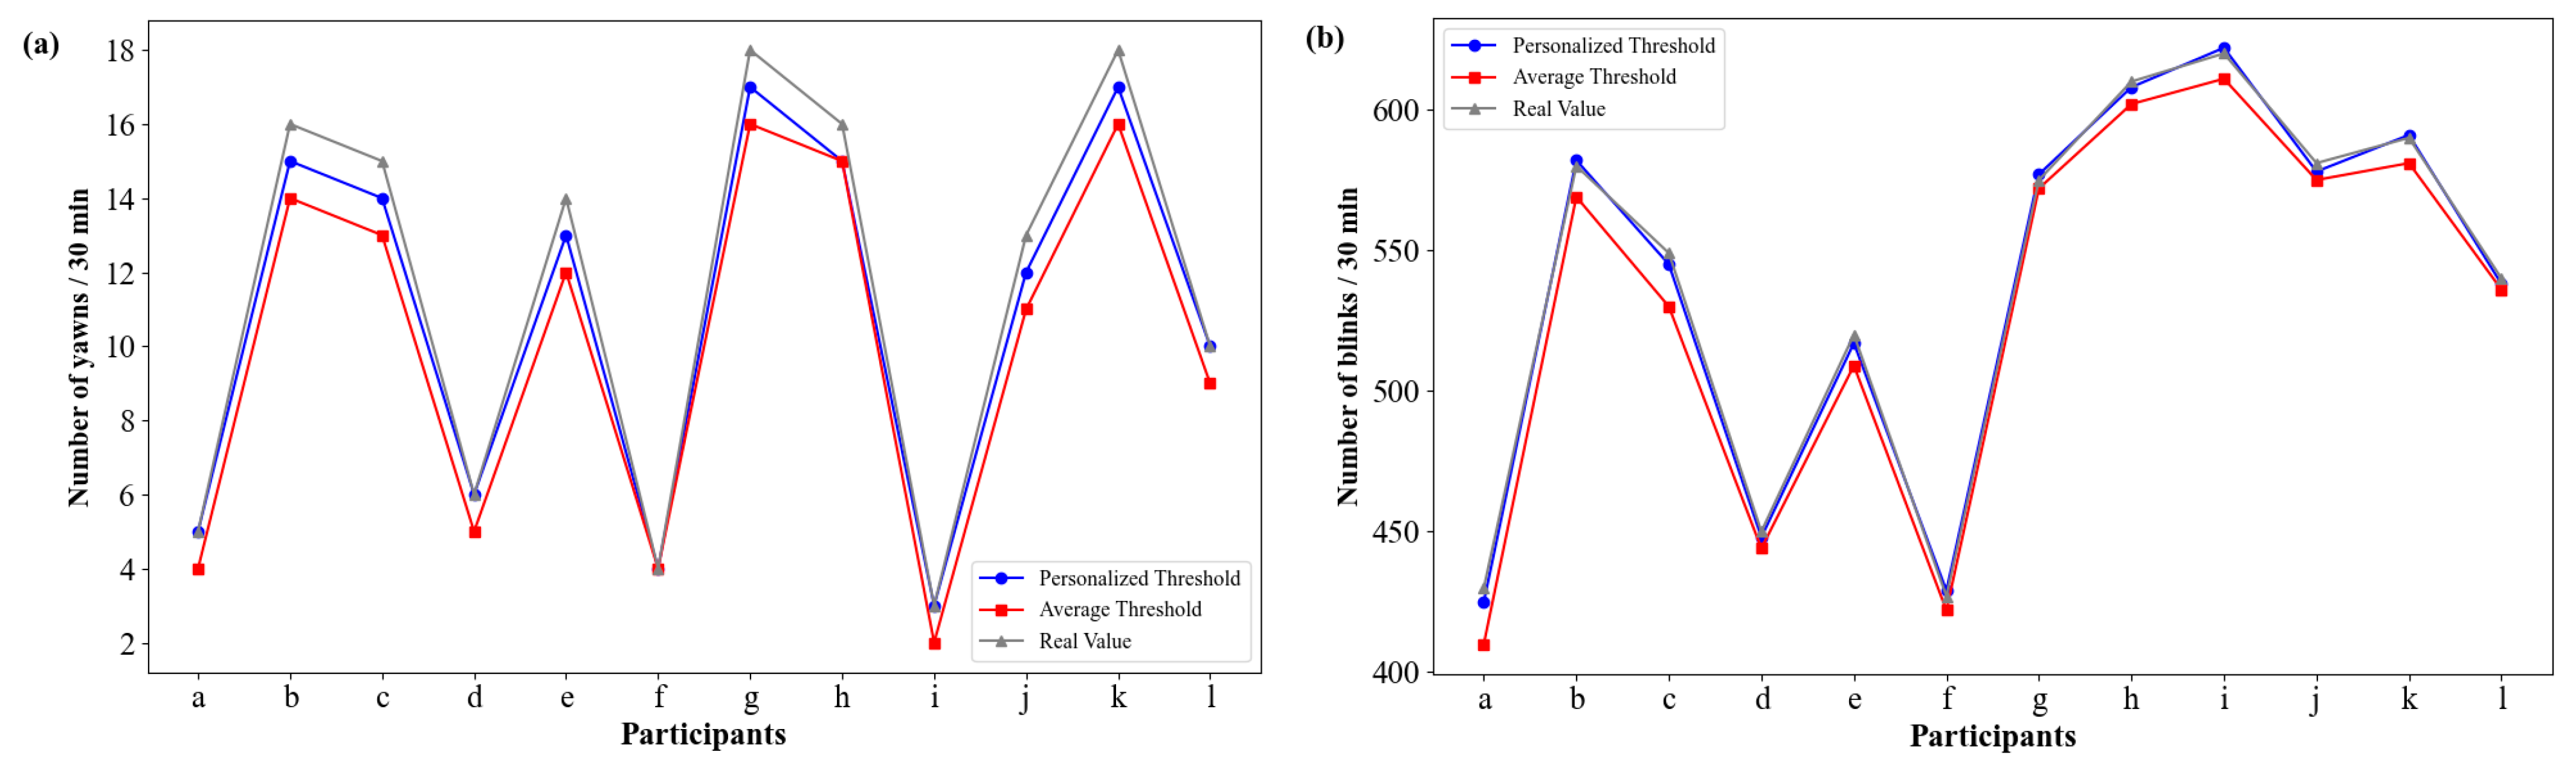
3.3. Effectiveness of Personalized Thresholds in Improving Detection Accuracy
Figure 11a,b present line plots of yawns and blinks observed during fatigue driving tests on 12 participants. The plots compare the results of two detection methods: the personalized threshold method (blue dots) and the average threshold method (red squares), with the gray dashed line representing the real values.
It is evident from the figures that the personalized threshold detection consistently produces results that are closer to the real values, demonstrating superior detection accuracy. In contrast, the average threshold method shows greater deviation from the real values, reflecting its lower performance.
To better assess the performance of the personalized threshold and average threshold methods in fatigue driving detection, we calculated the Mean Absolute Error (MAE) and Root Mean Squared Error (RMSE), and the results are presented in
Table 4. The MAE is calculated as:
where
represents the actual values,
represents the predicted values, and
n is the number of data points. The RMSE is calculated as:
As shown in
Table 4, the MAE and RMSE values of the personalized threshold method are significantly lower than those of the average threshold method, indicating its ability to more accurately approximate the real values in practical applications.
These results clearly highlight the effectiveness of the personalized threshold method, which provides a closer approximation to the real values and outperforms the traditional average threshold method in both yawns and blinks detection. This confirms that the personalized threshold method offers a significant improvement in detection accuracy and reliability, making it a superior choice for fatigue driving detection.
3.4. Fatigue Detection Accuracy
To calculate the average accuracy of the proposed fatigue driving detection algorithm, 45 video segments randomly selected from the YawDD dataset were used to detect fatigue status under various conditions. The multi-feature fatigue detection method records the number of blinks, yawns, and nods, as well as the fatigue status for each video segment, and the detection results are compared with the actual values. The experimental results are shown in
Table 5 (only a portion of the results is presented).
The results indicate that, out of 45 detections, 43 correctly identified the fatigue status, with only 2 instances where the fatigue state was mistakenly identified as normal. The average accuracy reached 95.6%. Upon review of the dataset, certain conditions were found to be unfavorable for detection, such as talking, laughing, yawning with the mouth covered, facial obstructions, and extreme lighting conditions (either too strong or too weak), all of which reduce detection accuracy. Therefore, future research may focus on improving fatigue detection under these challenging conditions. However, based on the experimental results, the overall detection accuracy remains high, which does not affect the practicality and reliability of the proposed method.
3.5. Comparison with Benchmark Methods
To objectively evaluate the effectiveness and advantages of the proposed multi-feature fusion fatigue detection method, comparative experiments were conducted against existing benchmark methods from the relevant scientific literature. Experimental results from these methods and the proposed algorithm are summarized in
Table 6.
As shown in
Table 6, the proposed method achieves the highest accuracy (95.6%) among all compared approaches. Traditional methods without personalized thresholds, although integrating one or more fatigue indicators, generally result in slightly lower performance. For example, the method by Chen et al. [
39] reached only 87.37%, while Li et al.’s [
22] method achieved 95.10% but did not consider nodding behavior. By incorporating blinking, yawning, and nodding frequencies along with a personalized threshold strategy, the proposed approach demonstrates superior detection accuracy.
3.6. Impact of Weight Combinations on Fatigue Detection Accuracy
This section investigates the impact of different weight combinations for blinking frequency (BF), yawning frequency (YF), and nodding frequency (NF) on the accuracy of fatigue detection. As shown in
Table 7, the weight distribution across multiple experimental steps was optimized to understand how changes in feature weights affect detection performance.
The experiment began with an initial setup (Step 1) that was biased towards NF, resulting in a detection accuracy of 88.9%. The weight of YF was then increased (Step 2), making YF more influential in the detection process, which led to an increase in accuracy to 90.2%. In Step 3, the weights of BF and YF were balanced, and the accuracy further increased to 91.7%.
However, when the weight of BF was increased to 0.4 in Step 4, the highest accuracy of 95.6% was achieved. Increasing the BF weight further in Step 5 to 0.45 caused the accuracy to drop to 93.8%. This suggests that while BF plays a significant role in fatigue detection, its weight cannot be increased indefinitely to improve performance. Beyond a certain point, increasing BF’s weight reduces the influence of other variables, such as YF and NF, leading to a decrease in overall accuracy.
When the weights of YF and NF were slightly adjusted in Steps 6 and 7, the detection accuracies were 94.2% and 93.1%, respectively. This indicates that while YF and NF contribute to fatigue detection, their impact on improving detection accuracy is more limited compared to BF.
These experiments validate the importance of BF in fatigue detection and reveal its non-linear effect on detection performance. The optimal weight combination ( = 0.4, = 0.3, = 0.3) was achieved by fine-tuning the weights of BF, YF, and NF, representing the best configuration for this task.
4. Conclusions
In this article, a multi-feature fusion fatigue detection algorithm that accounts for individual driver characteristics is proposed. By analyzing facial data, the algorithm employs personalized thresholds to determine the states of the eyes and mouth. The algorithm evaluates BF, YF, and NF as evaluation indexes, employing a sliding window model to track dynamic changes in fatigue levels. Unlike fatigue detection algorithms based solely on a single feature, our approach comprehensively considers various facial features associated with fatigue behavior, including the eyes, mouth, and head. This comprehensive approach enhances judgment accuracy and response speed. Experimental results validate the accuracy of the algorithm, with an average accuracy of 95.6%. Moreover, the algorithmic model successfully distinguishes between different levels of fatigue, such as Mild, Moderate, or Severe.
Although the proposed method demonstrates high detection accuracy in the experiments, it still has the following limitations:
The algorithm is sensitive to variations in lighting intensity, and detection accuracy decreases under extreme lighting conditions (e.g., overly strong or weak light).
The initial calibration of personalized thresholds depends on baseline data from the participants, which may limit large-scale application.
The feature weight settings are based on manual experience; future work could incorporate machine learning techniques to adaptively optimize the weights.
Future research will aim to overcome these limitations by introducing more robust image preprocessing algorithms (such as illumination normalization techniques) and advanced feature fusion models (such as deep learning). In addition, expanding the sample size and increasing participant diversity—covering a broader range of ages, genders, and facial structures—as well as validating the algorithm across multiple publicly available fatigue detection datasets, are essential steps to further improve the model’s generalizability and practical applicability.


