
Encoding-Based Machine Learning Approach for Health Status Classification and Remote Monitoring of Cardiac Patients


Abstract

1. Introduction
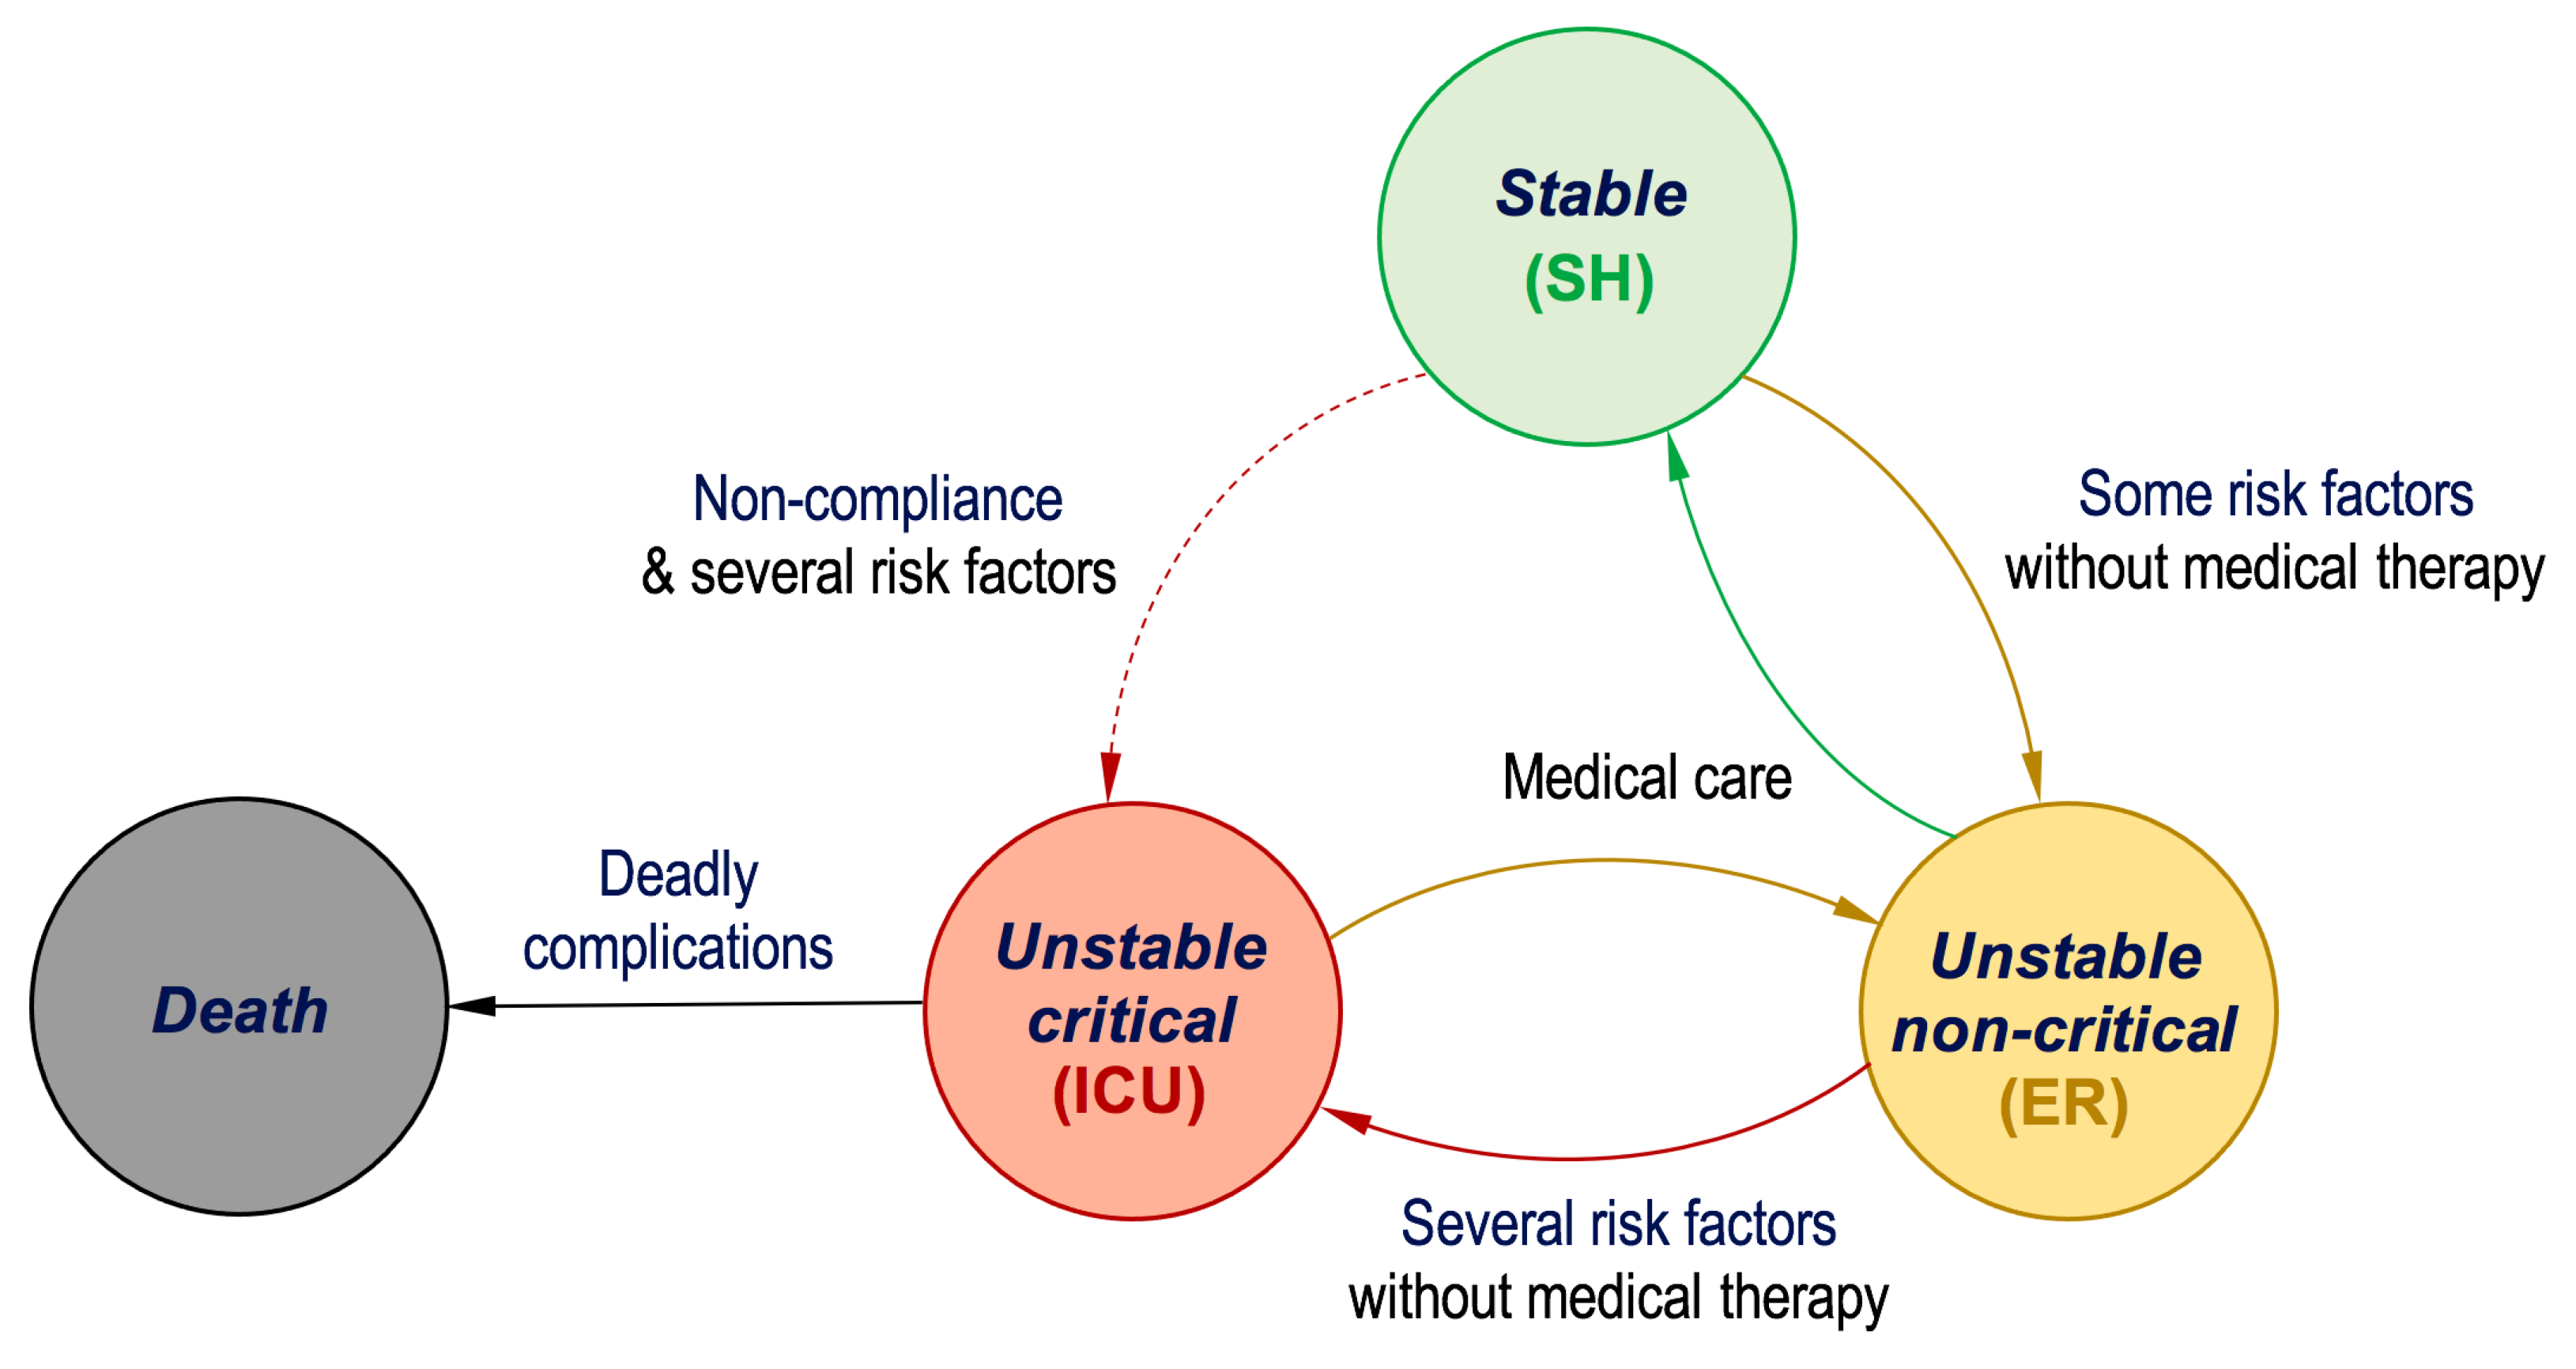
- We curated a balanced dataset of 750 patient records from three hospitals, categorized into three health statuses, namely stable, unstable non-critical, and unstable critical. This dataset serves as a valuable resource for training and evaluating machine learning models.
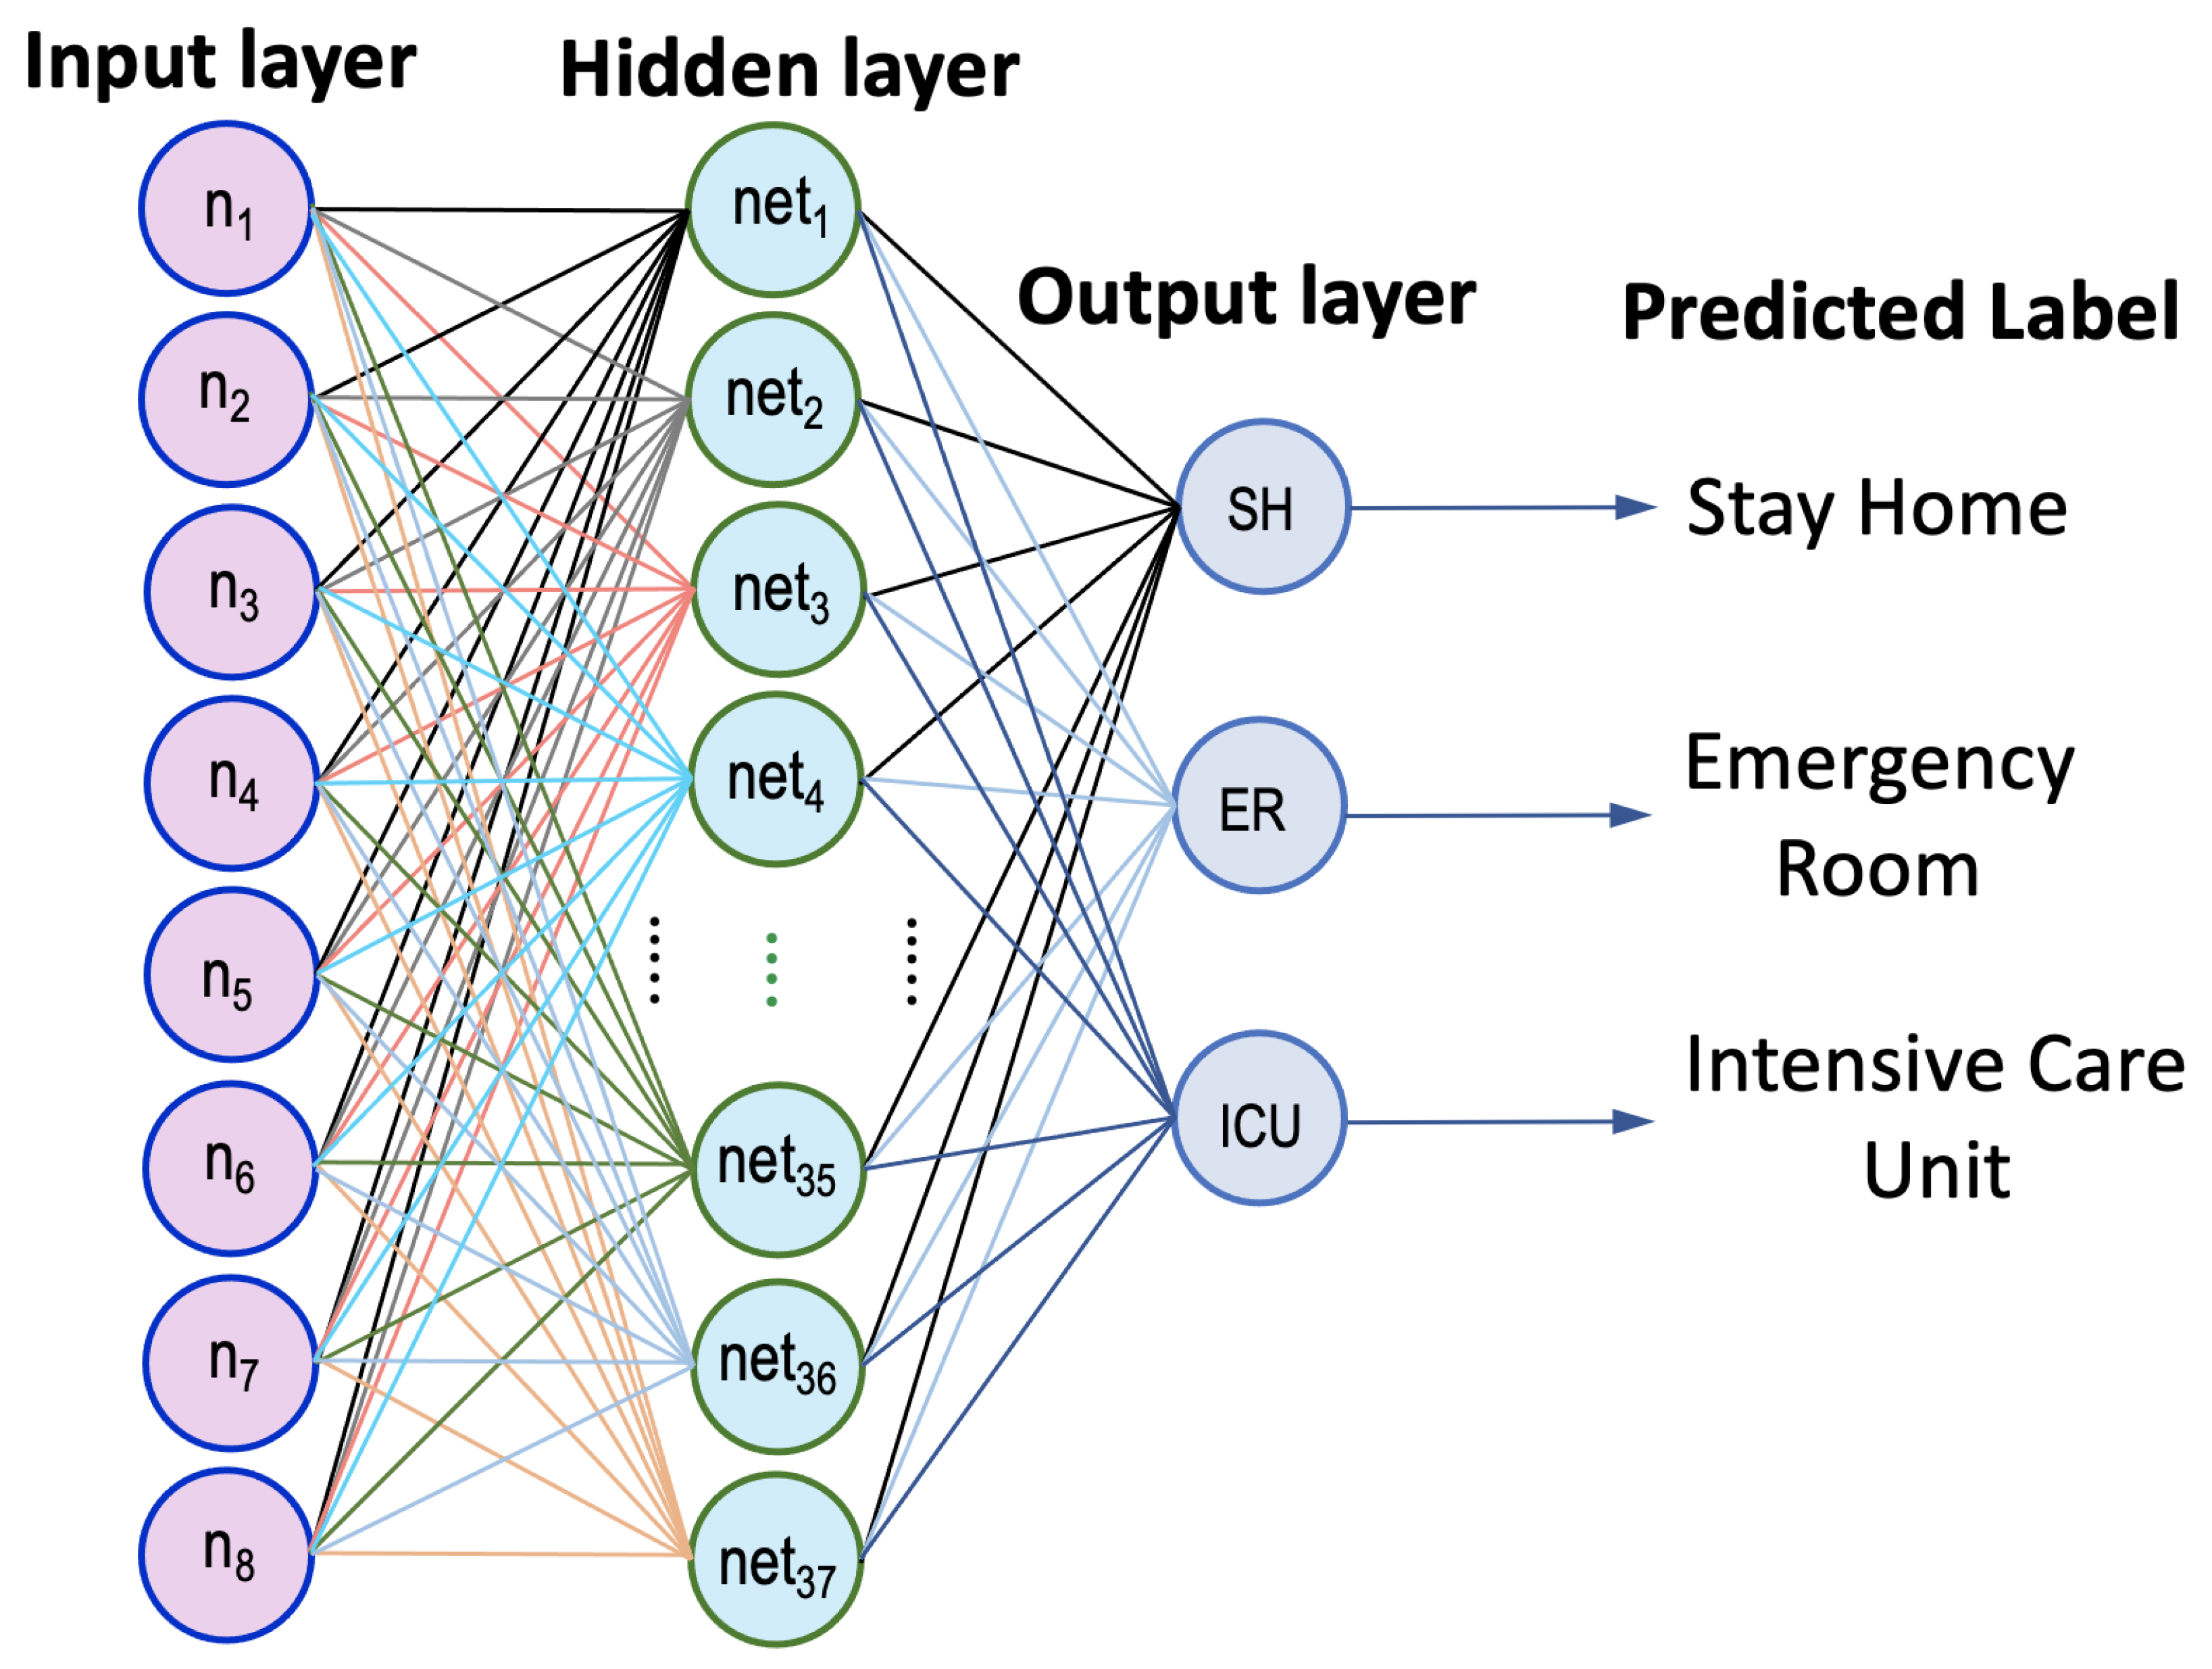
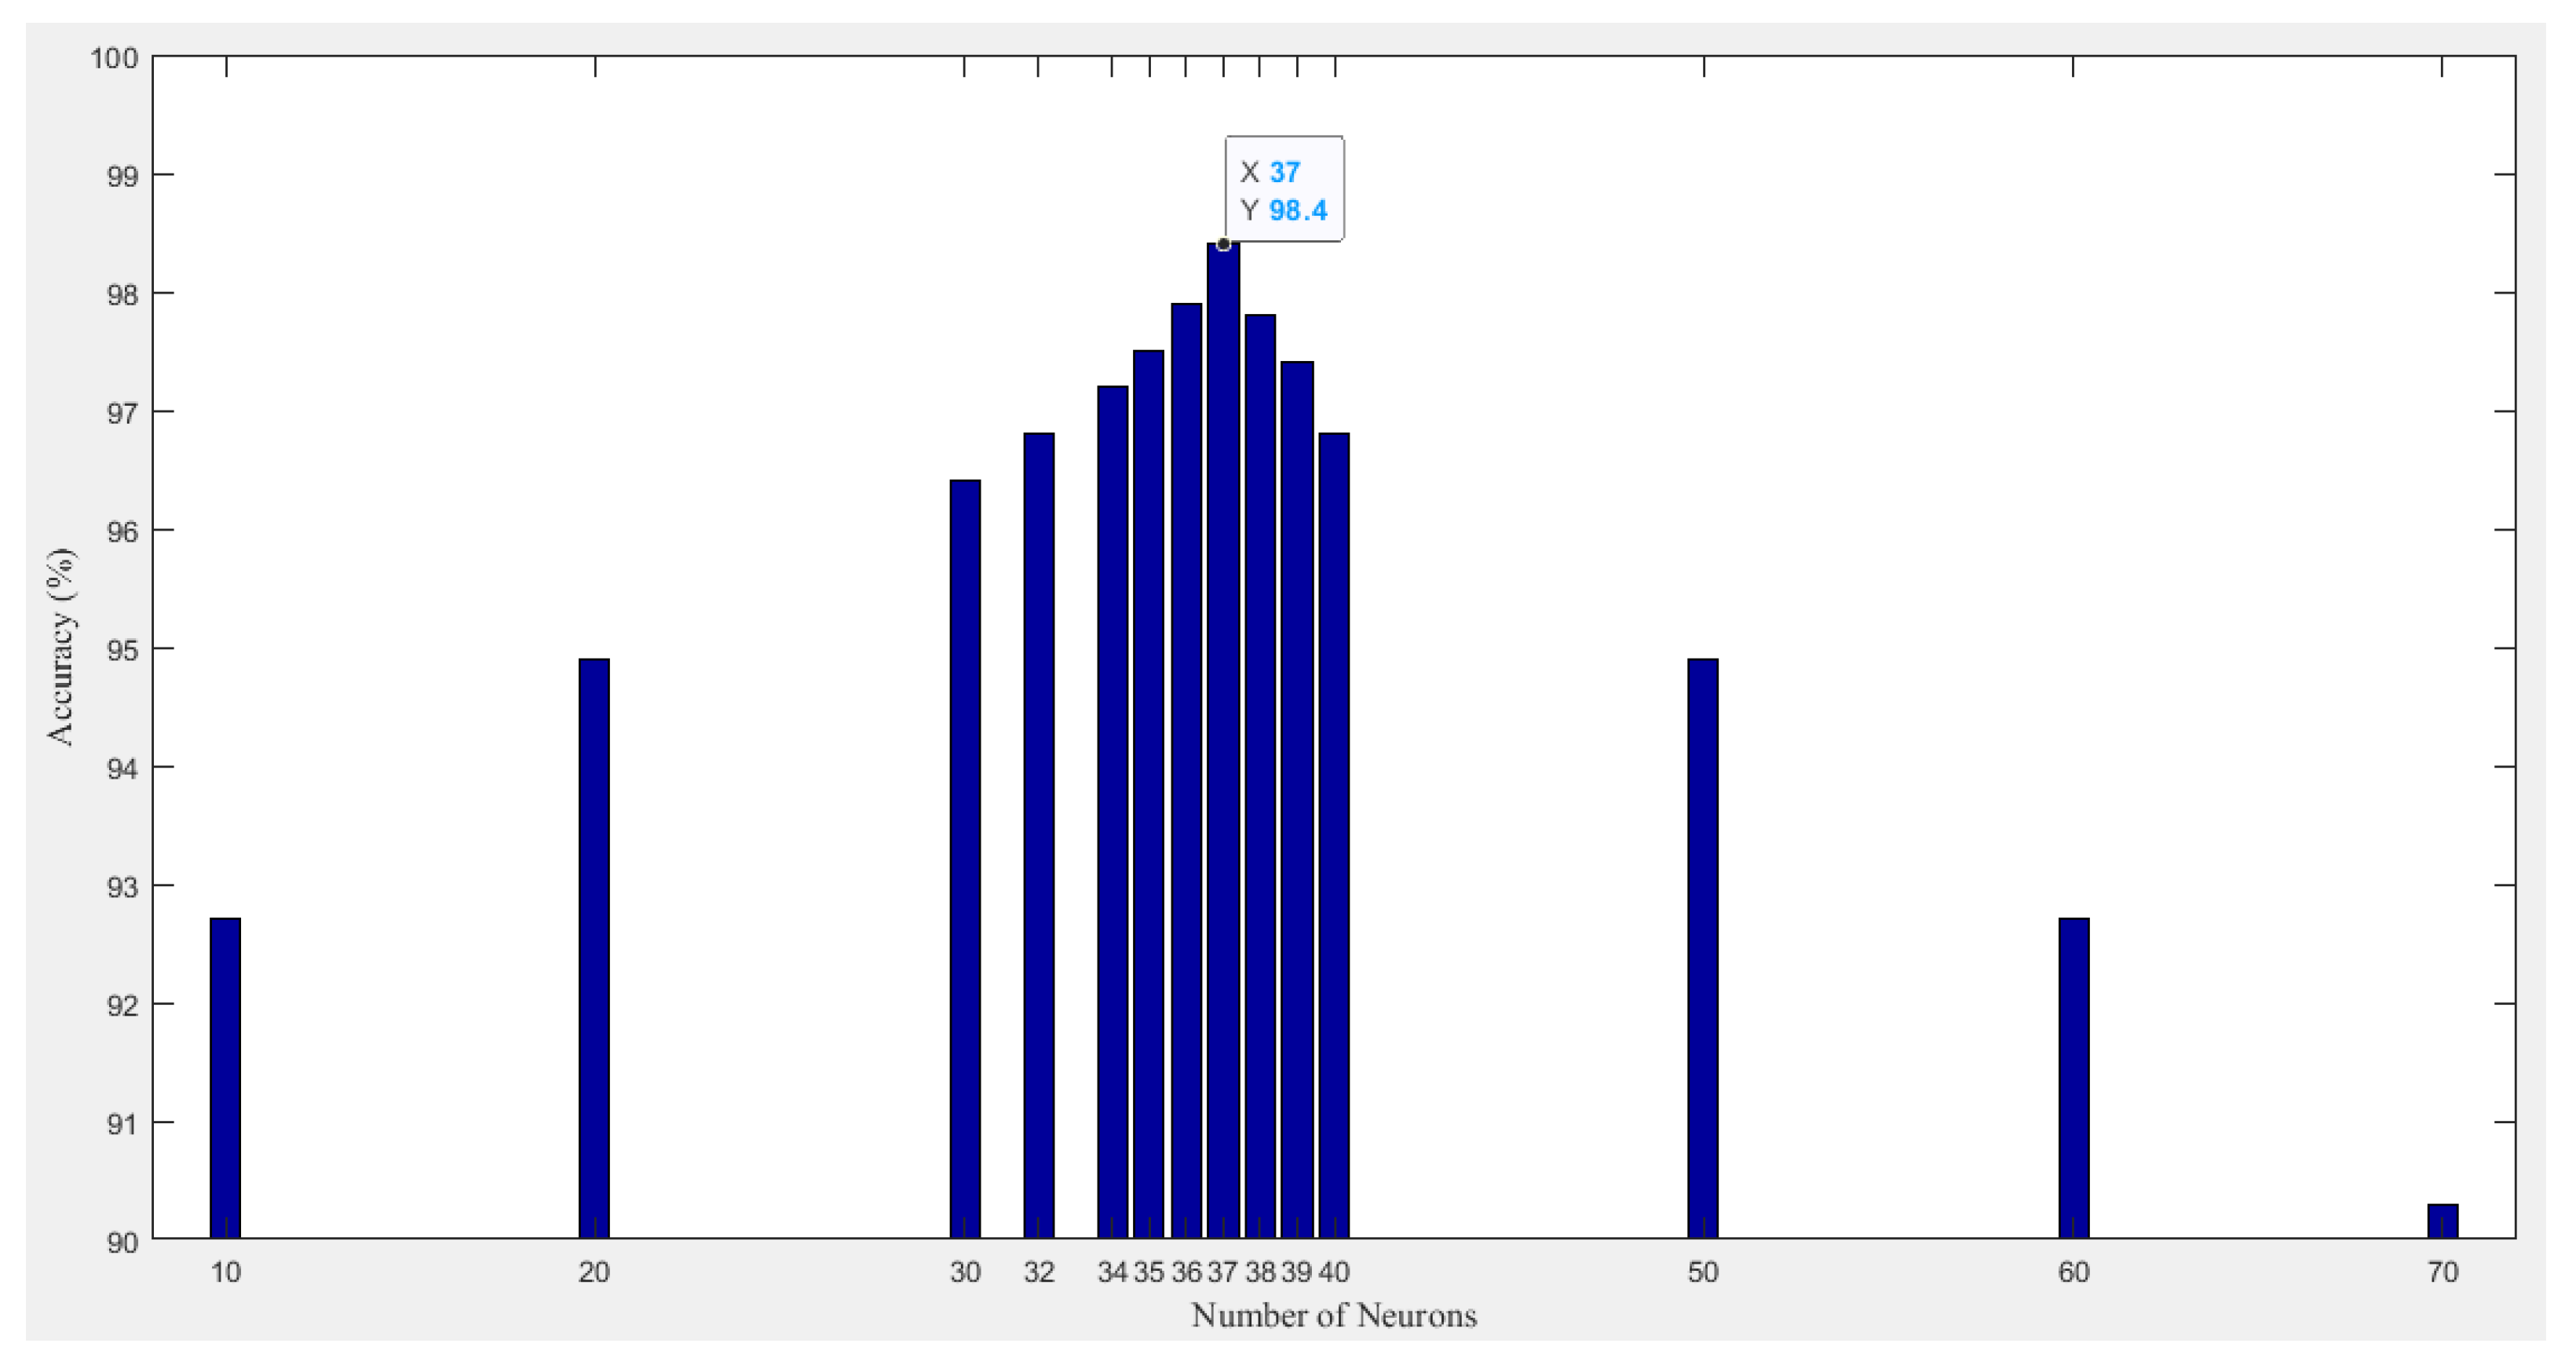
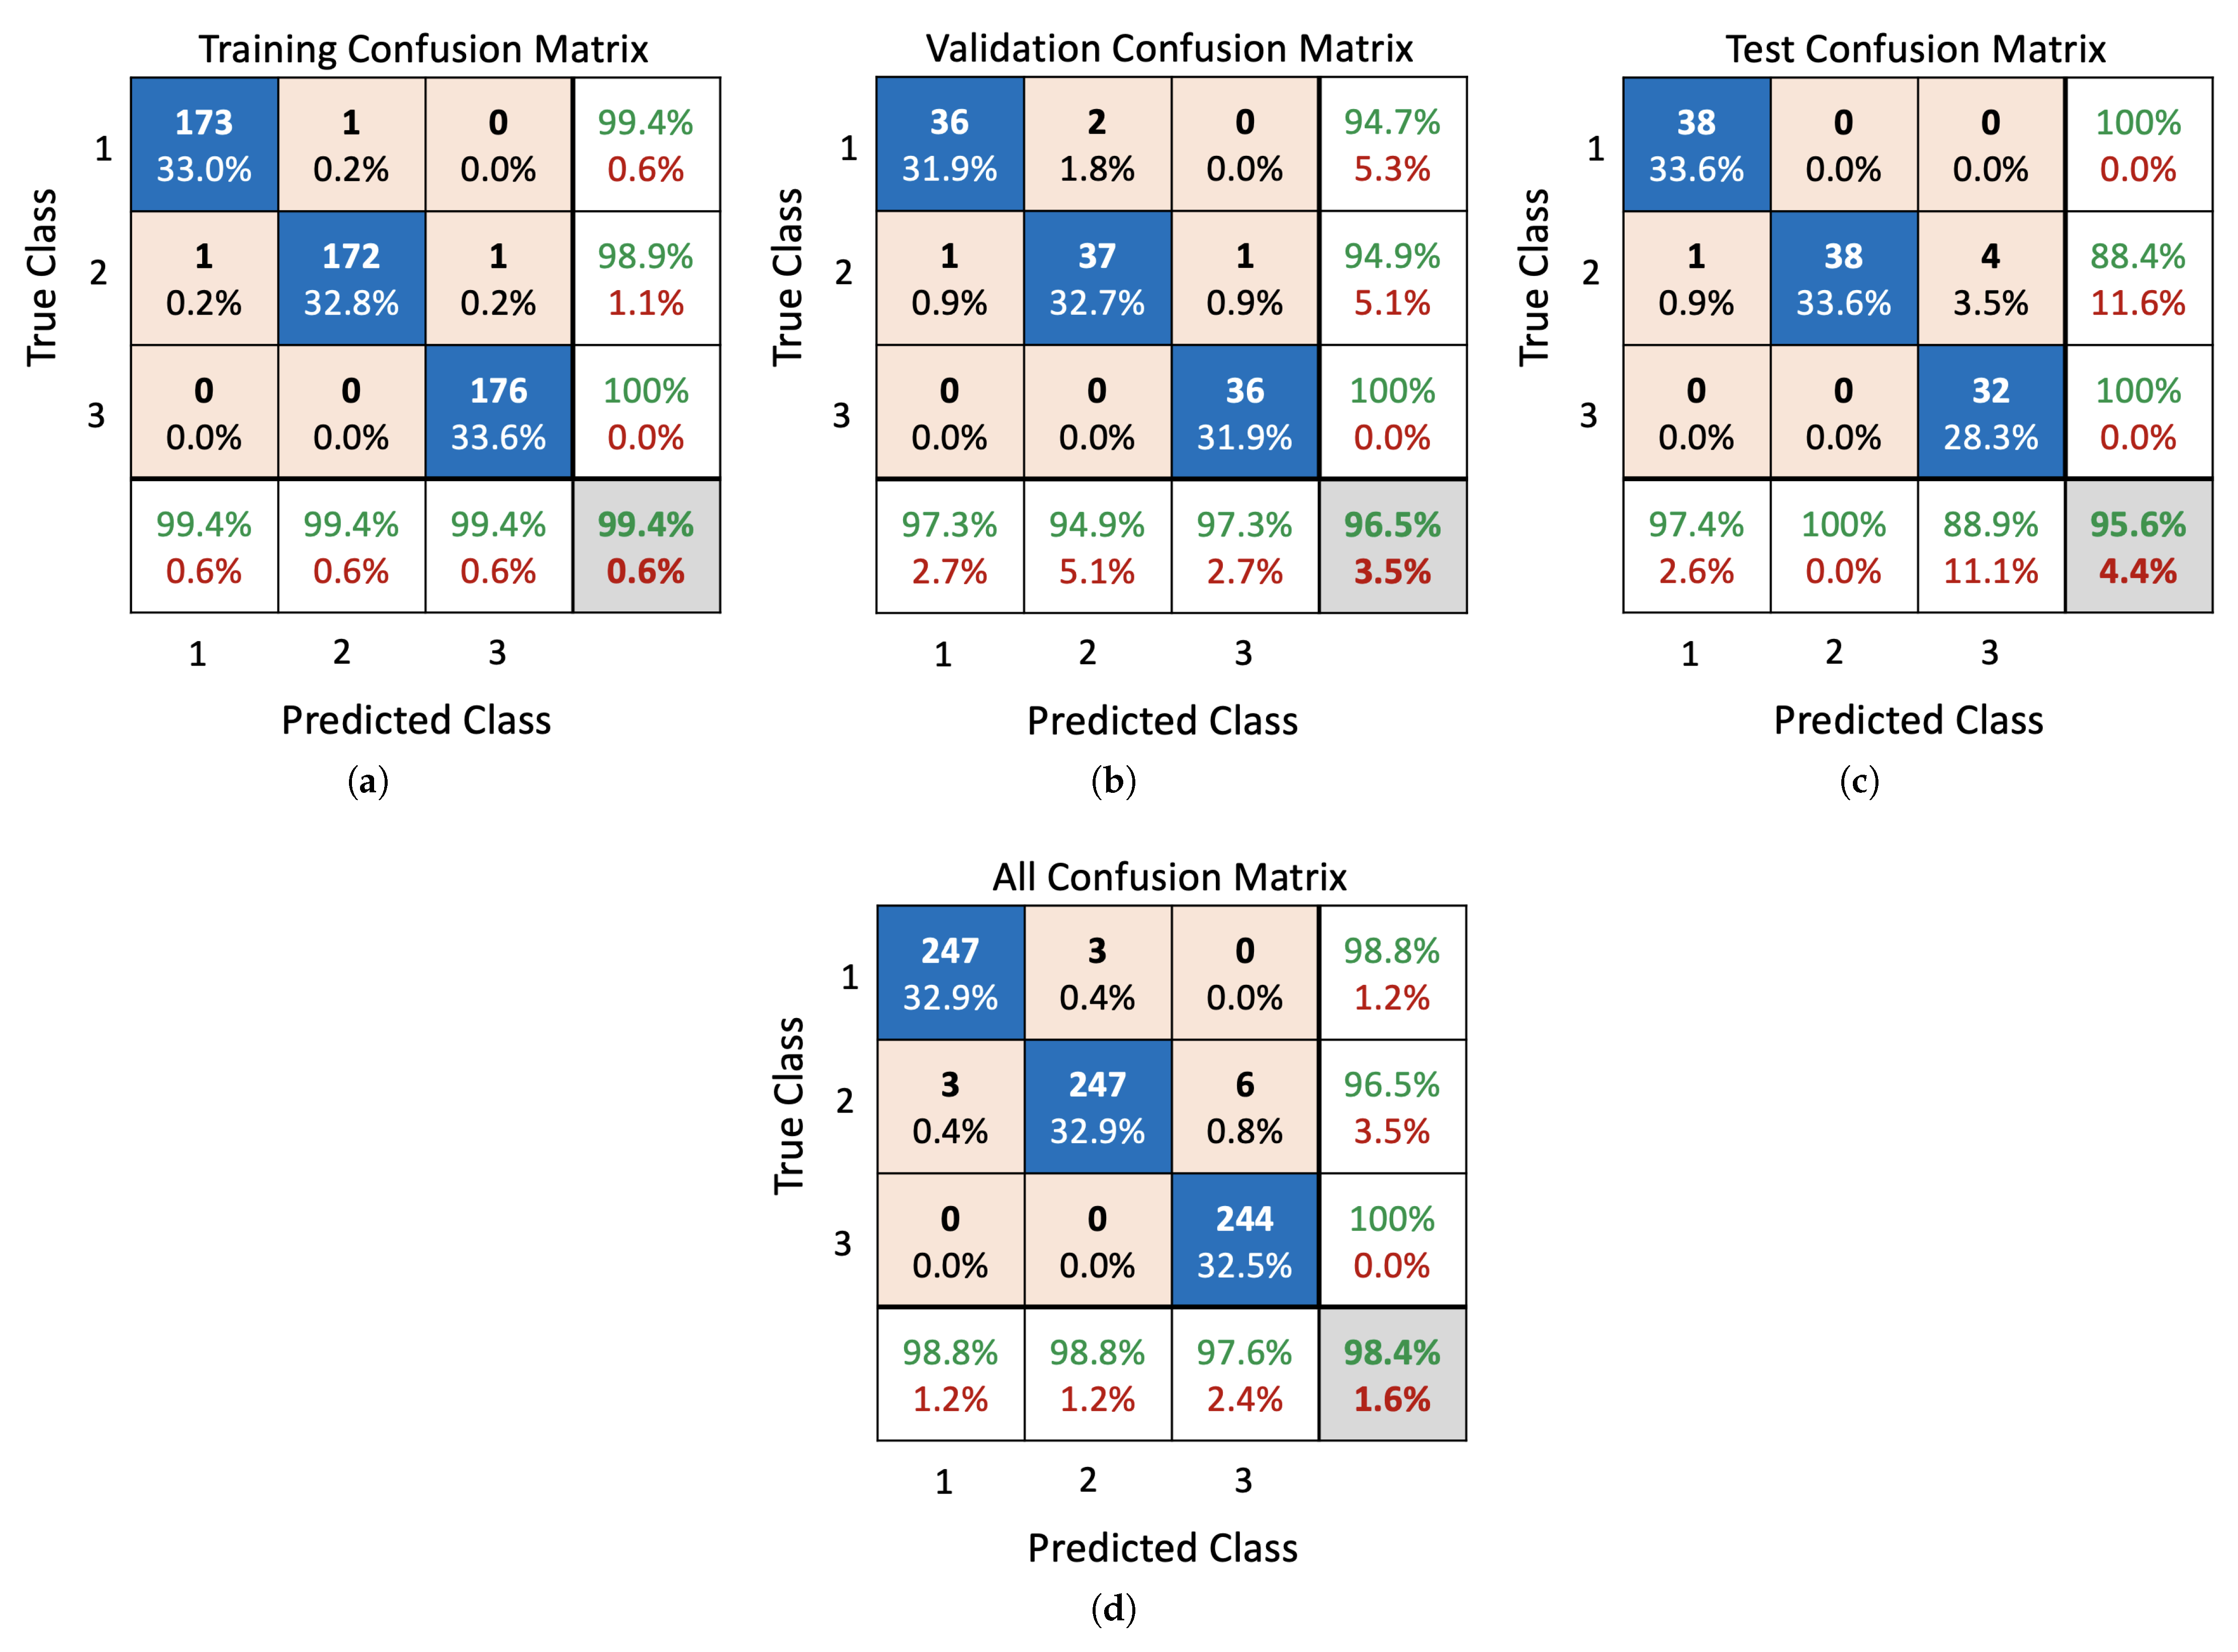
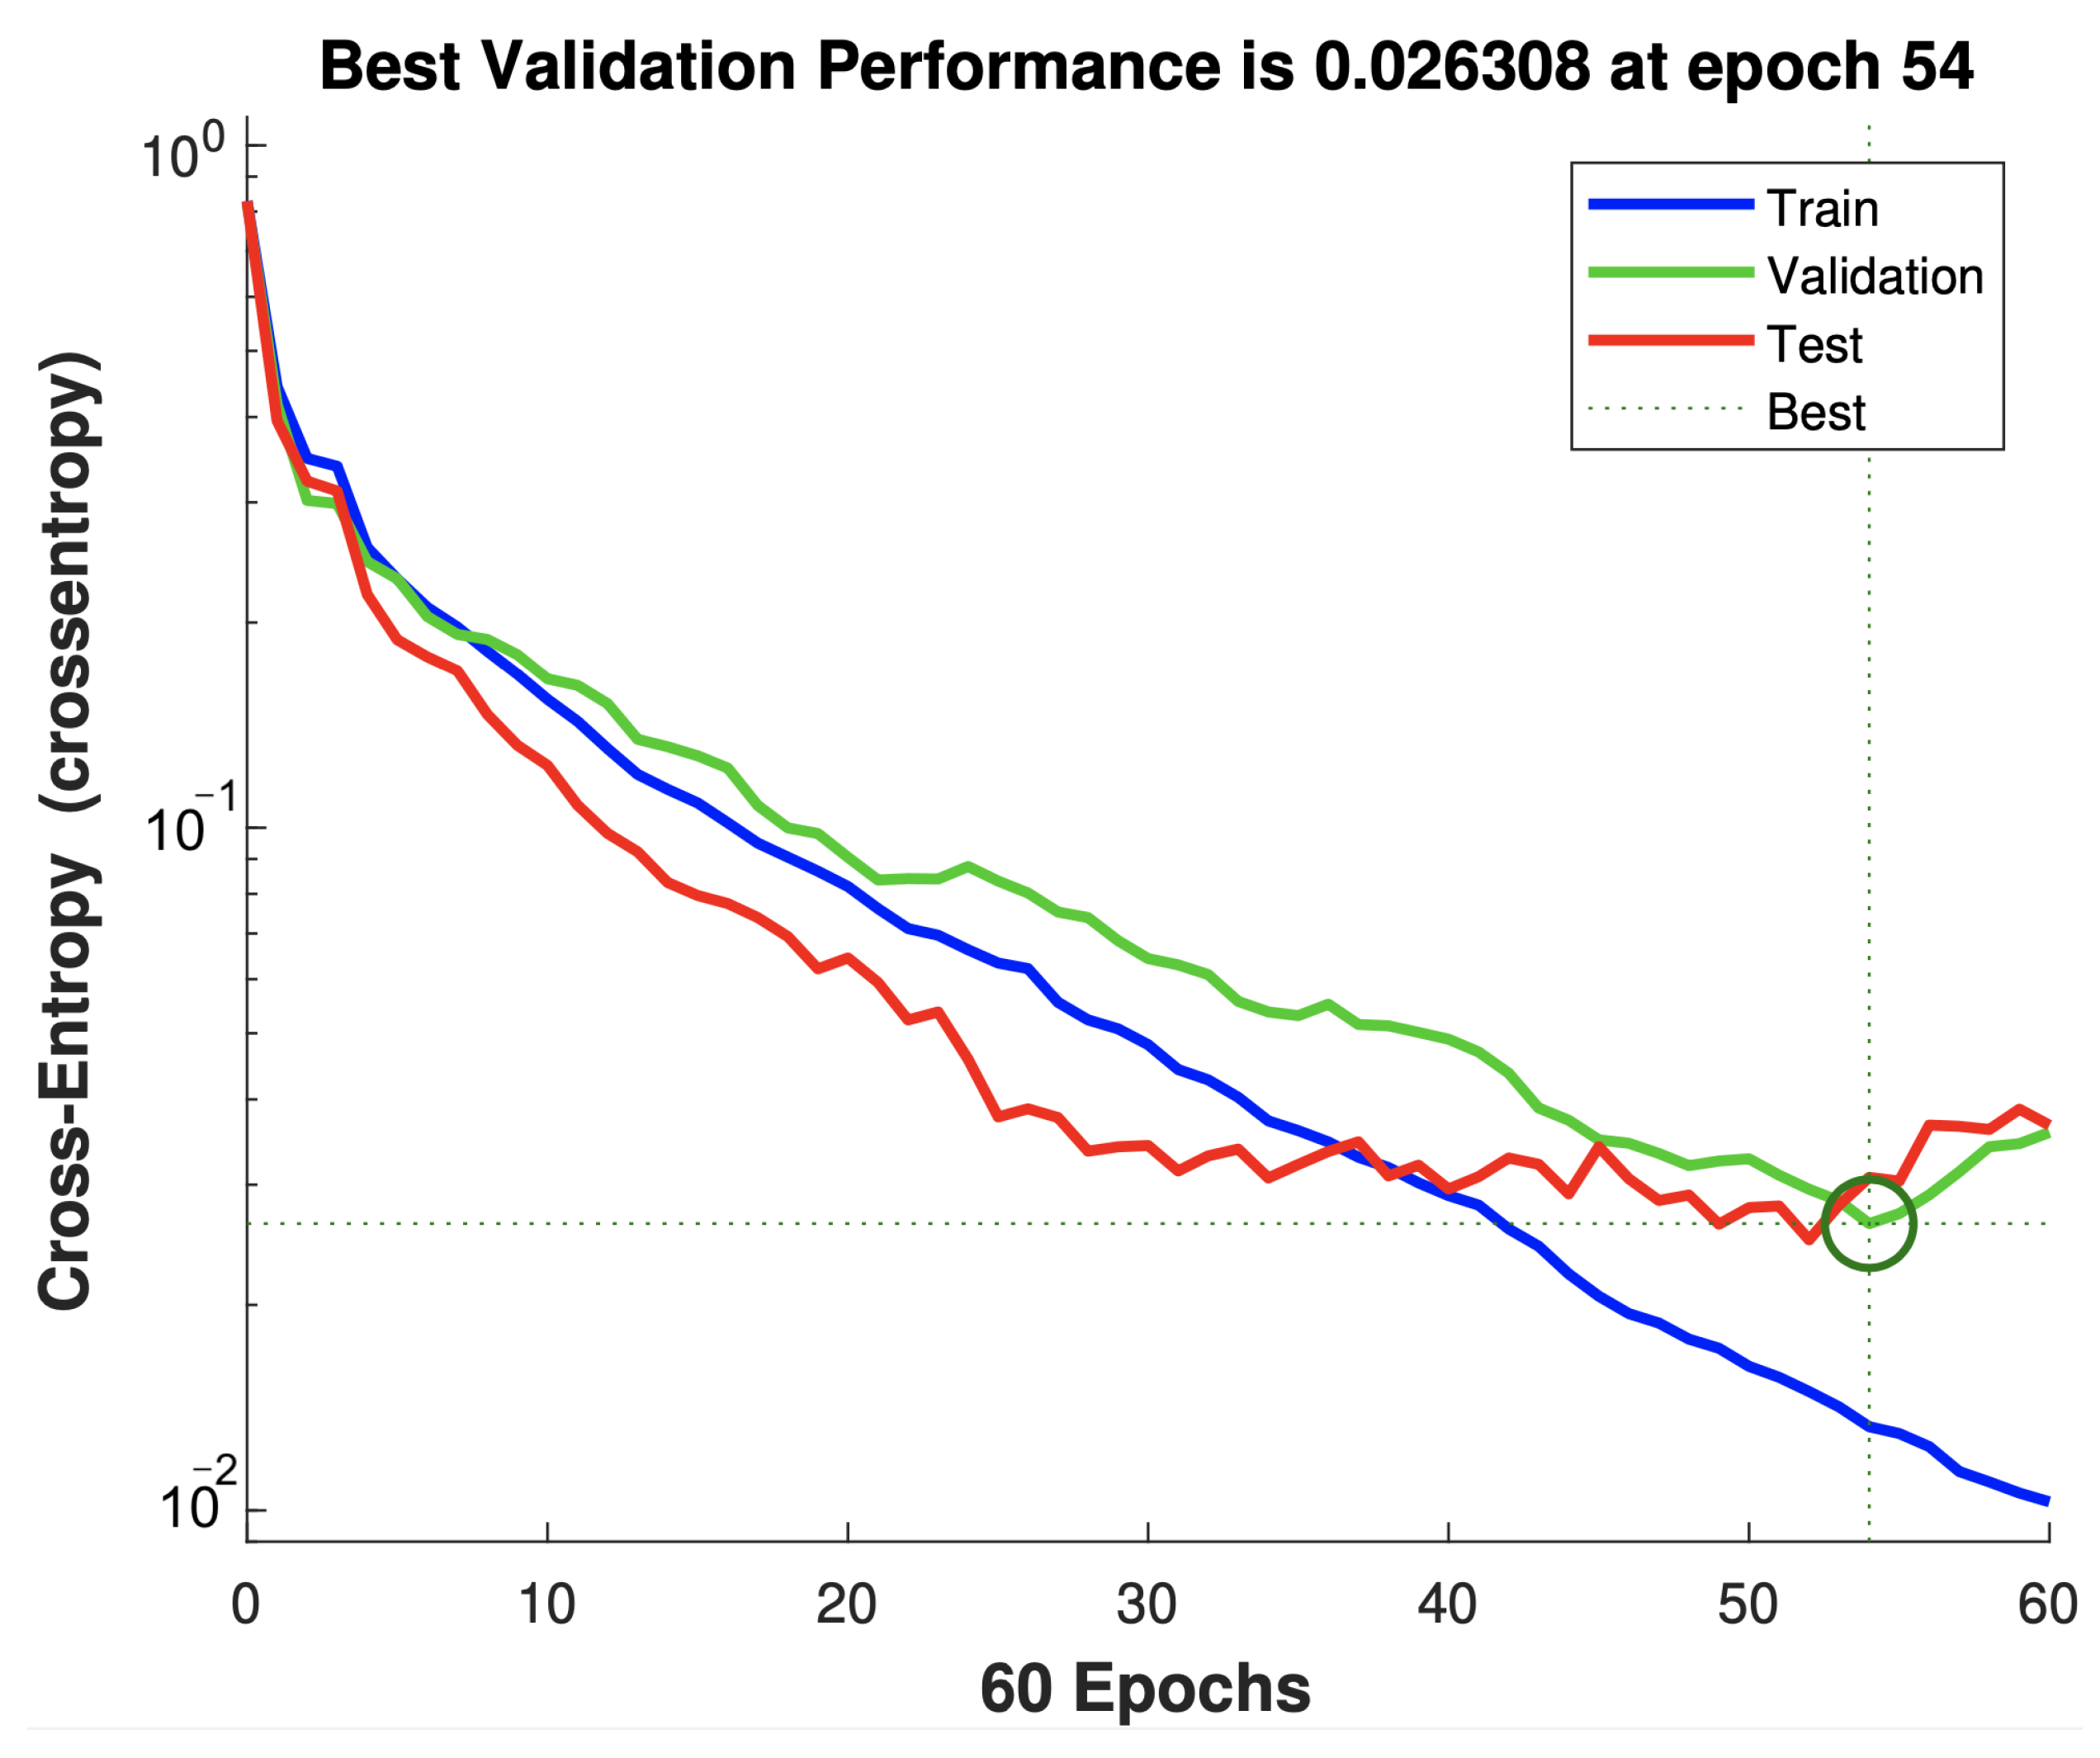
- Development of an efficient ANN classifier designed to achieve competitive accuracy compared to state-of-the-art ML models while optimizing the architecture by reducing the number of hidden-layer neurons.
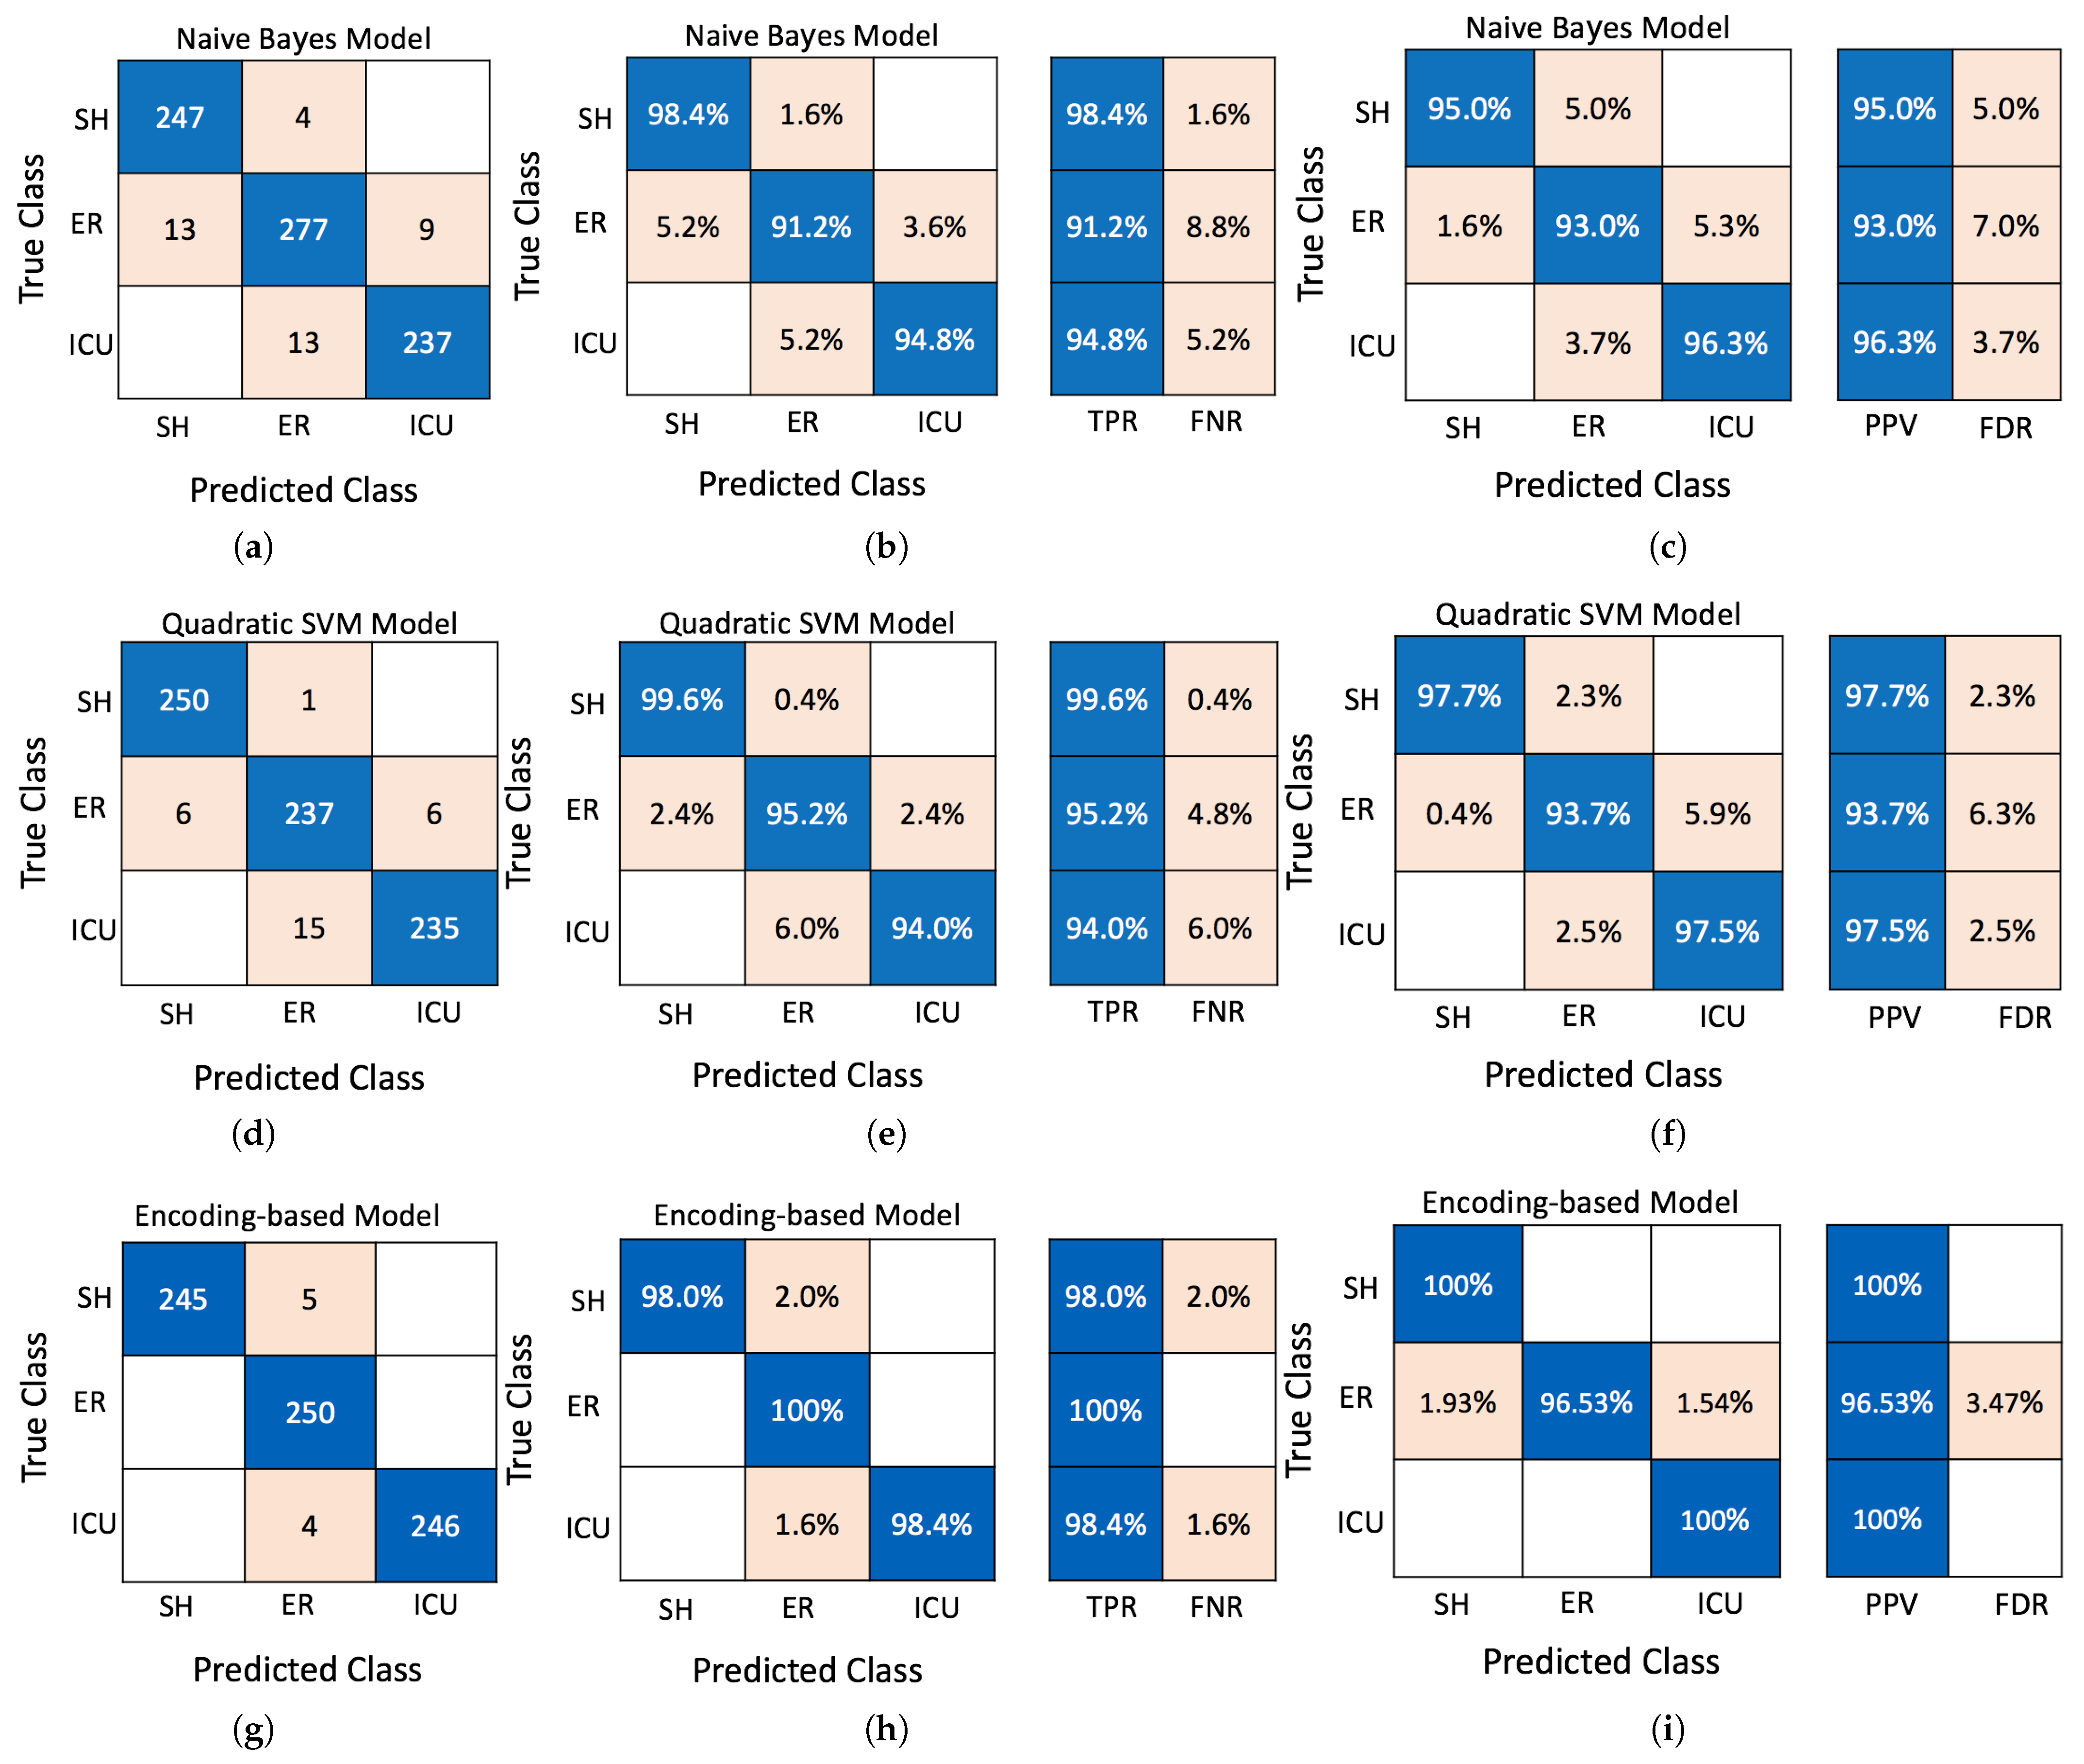
- Introducing a novel encoding-based ML algorithm proposed that surpasses conventional methods, such as Naive Bayes, SVM, and KNN, in classification accuracy for predicting cardiac patient health, achieving up to 98.8% accuracy.
- The proposed encoding-based algorithm has demonstrated the efficacy of the encoding-based ML approach in enabling accurate predictions, supporting proactive monitoring and timely medical interventions.
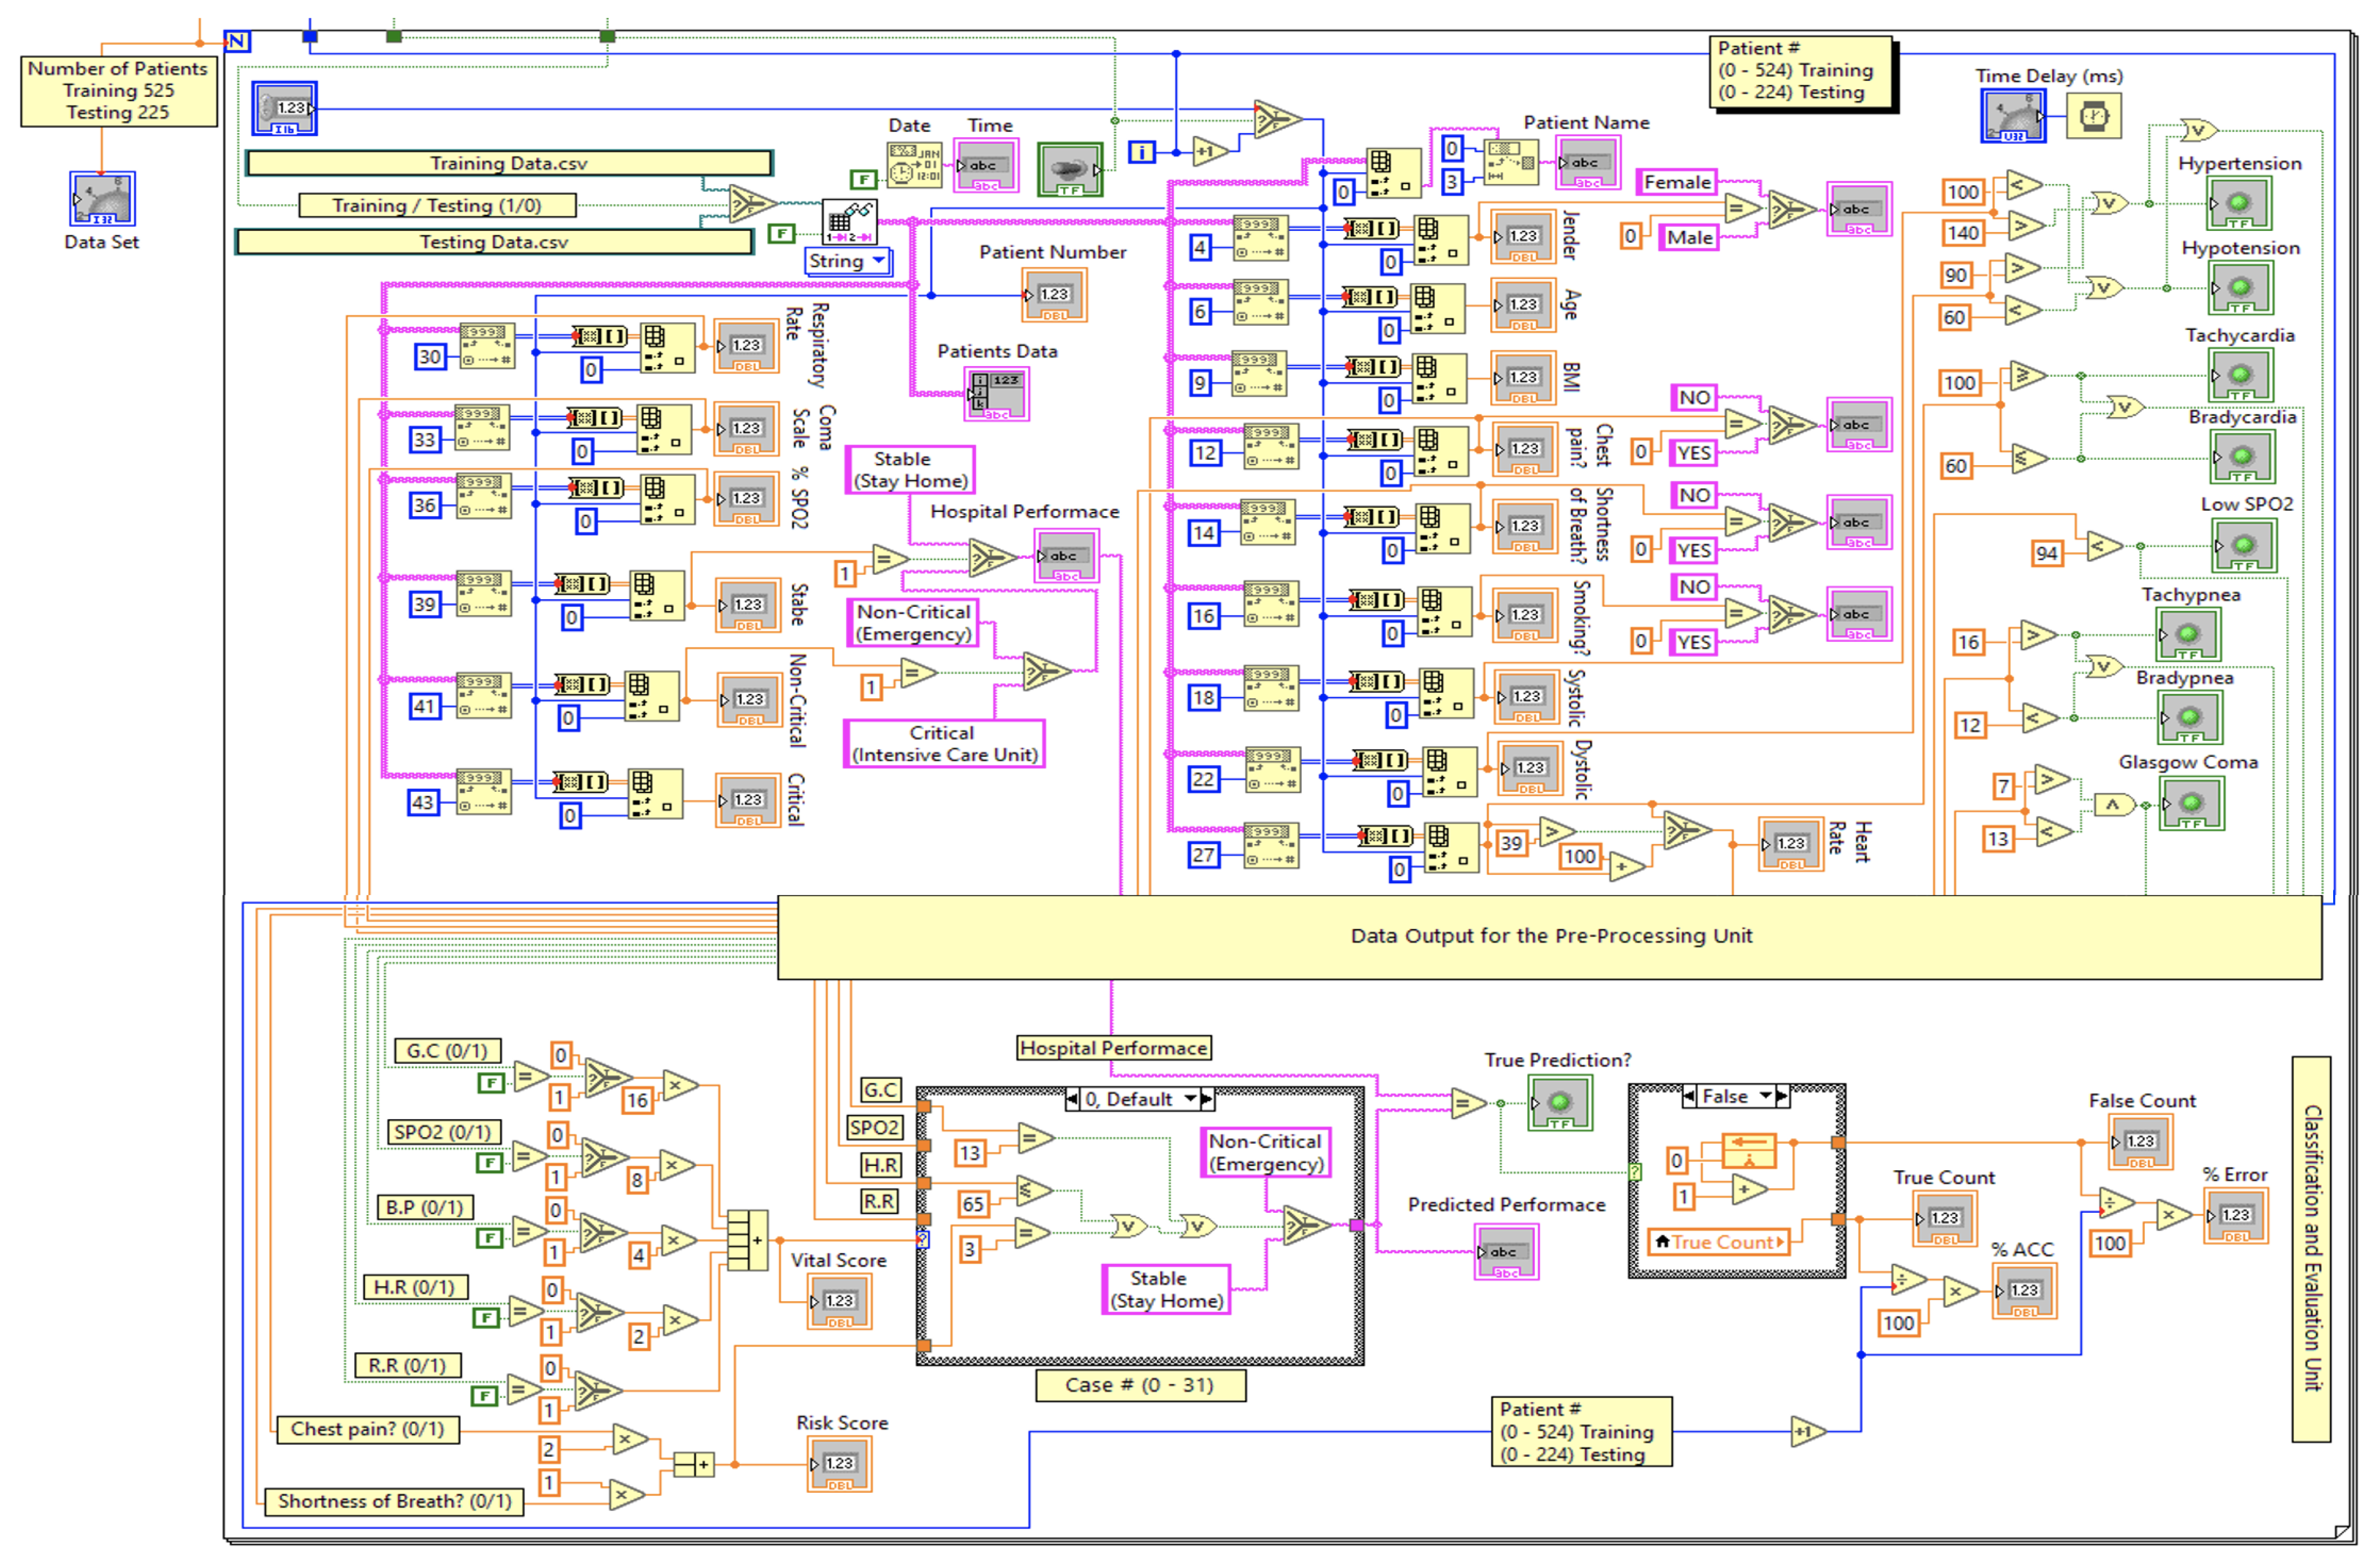
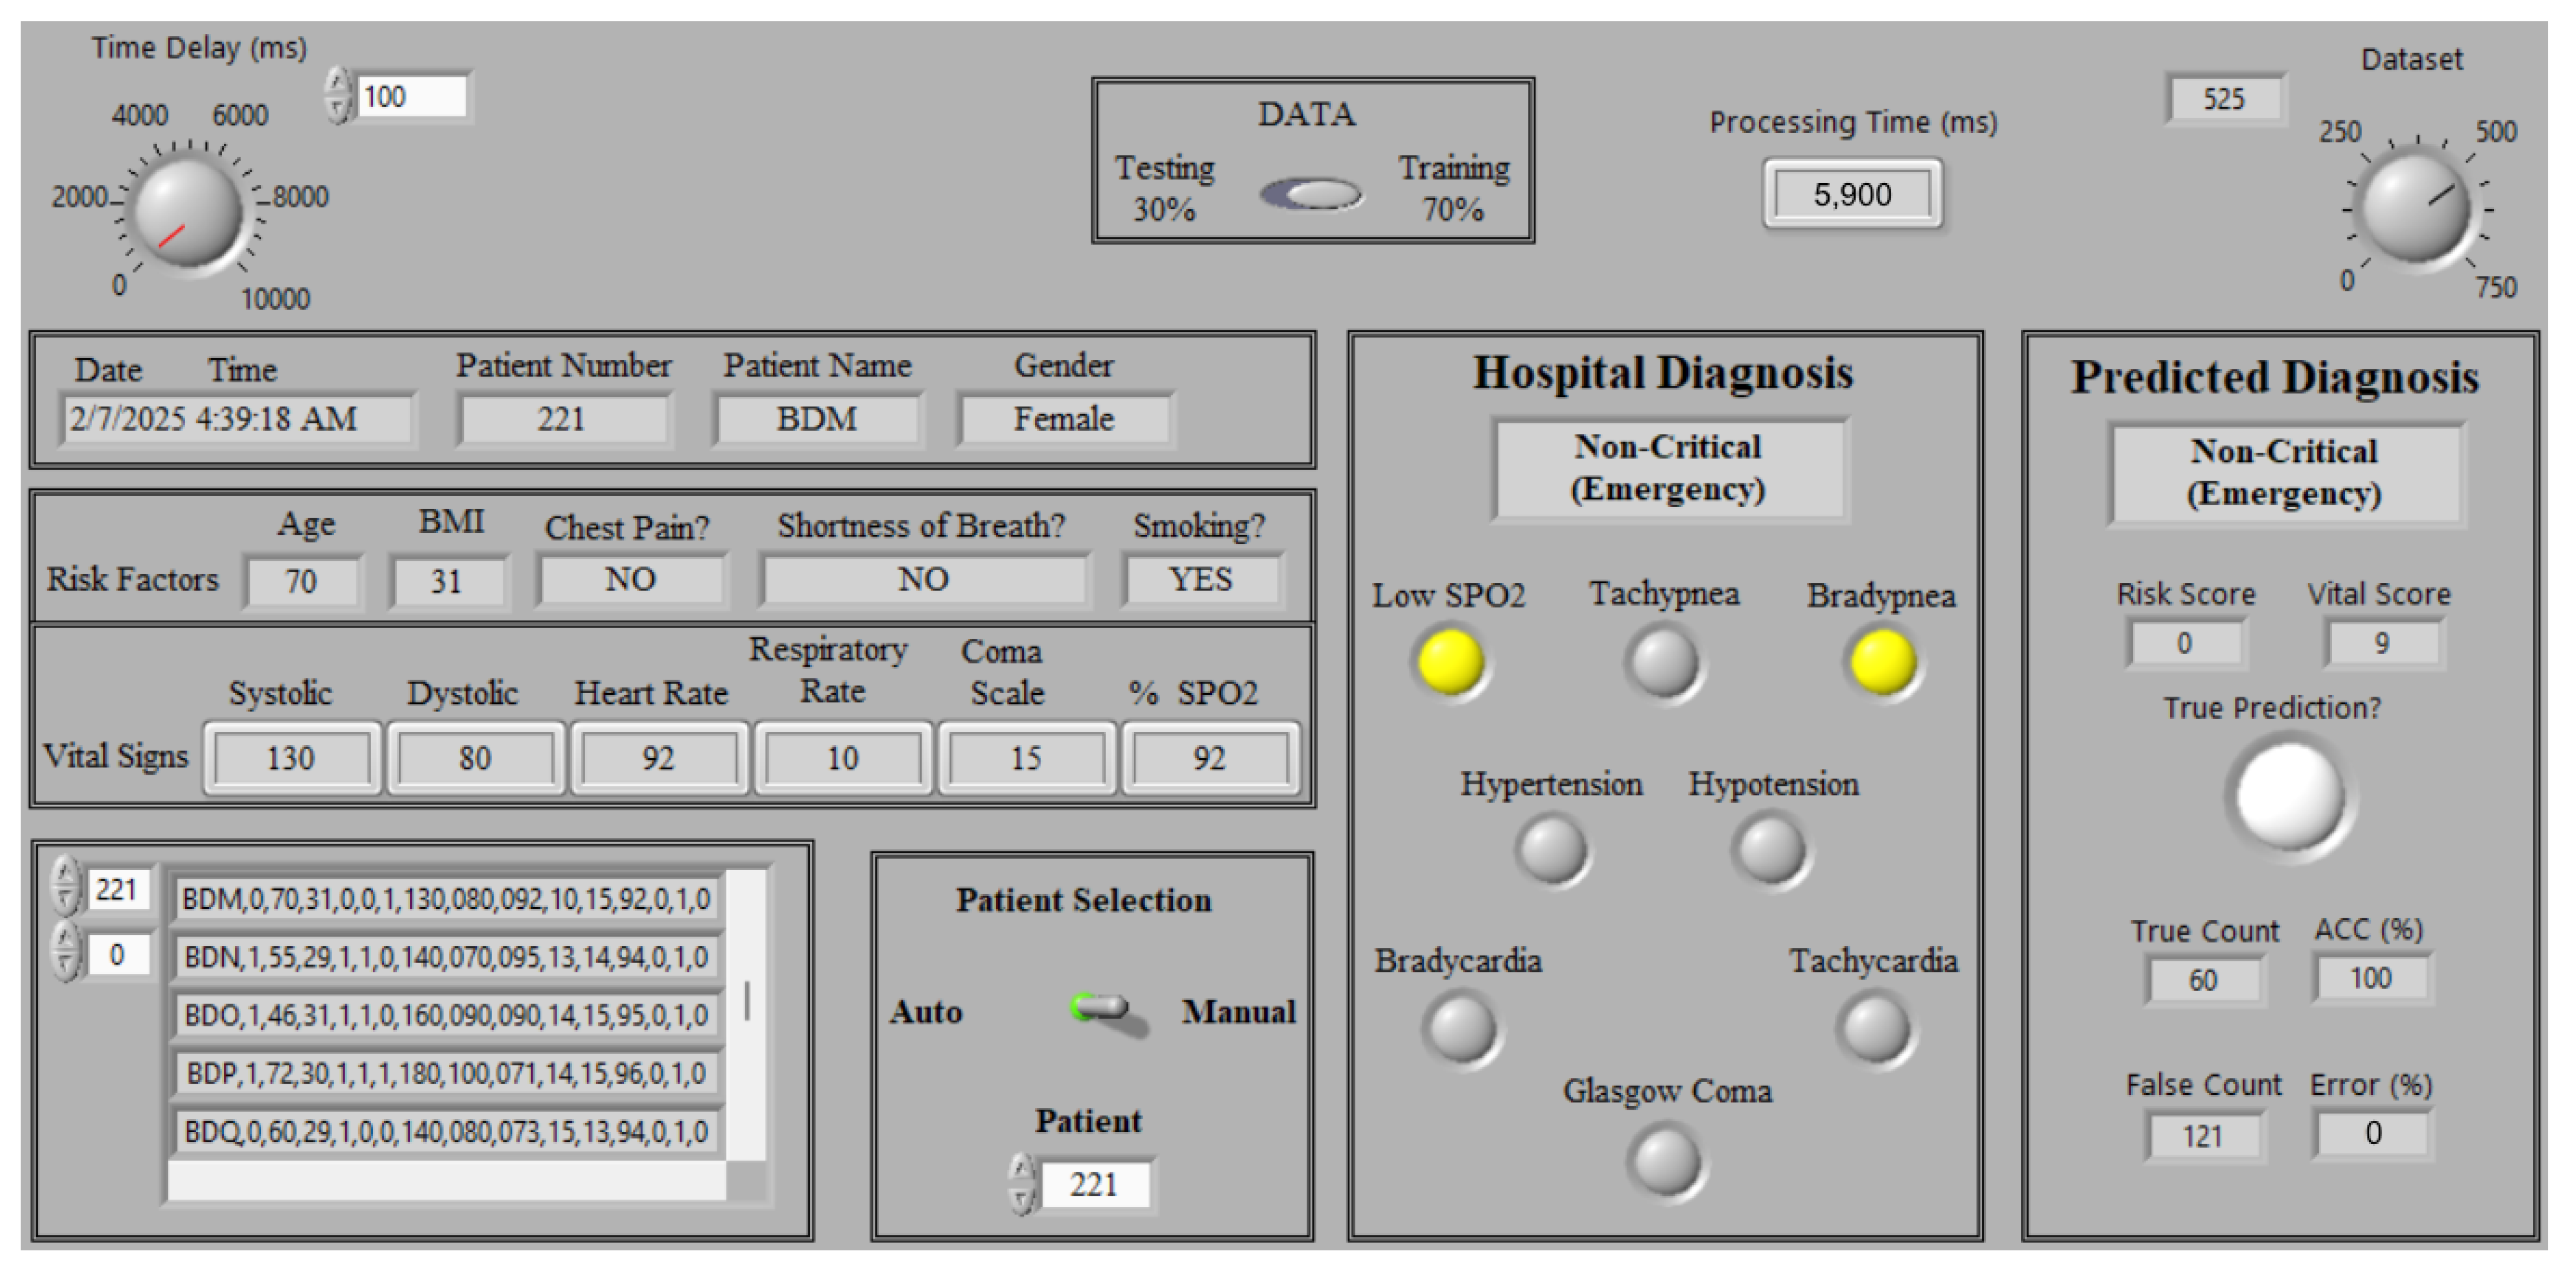
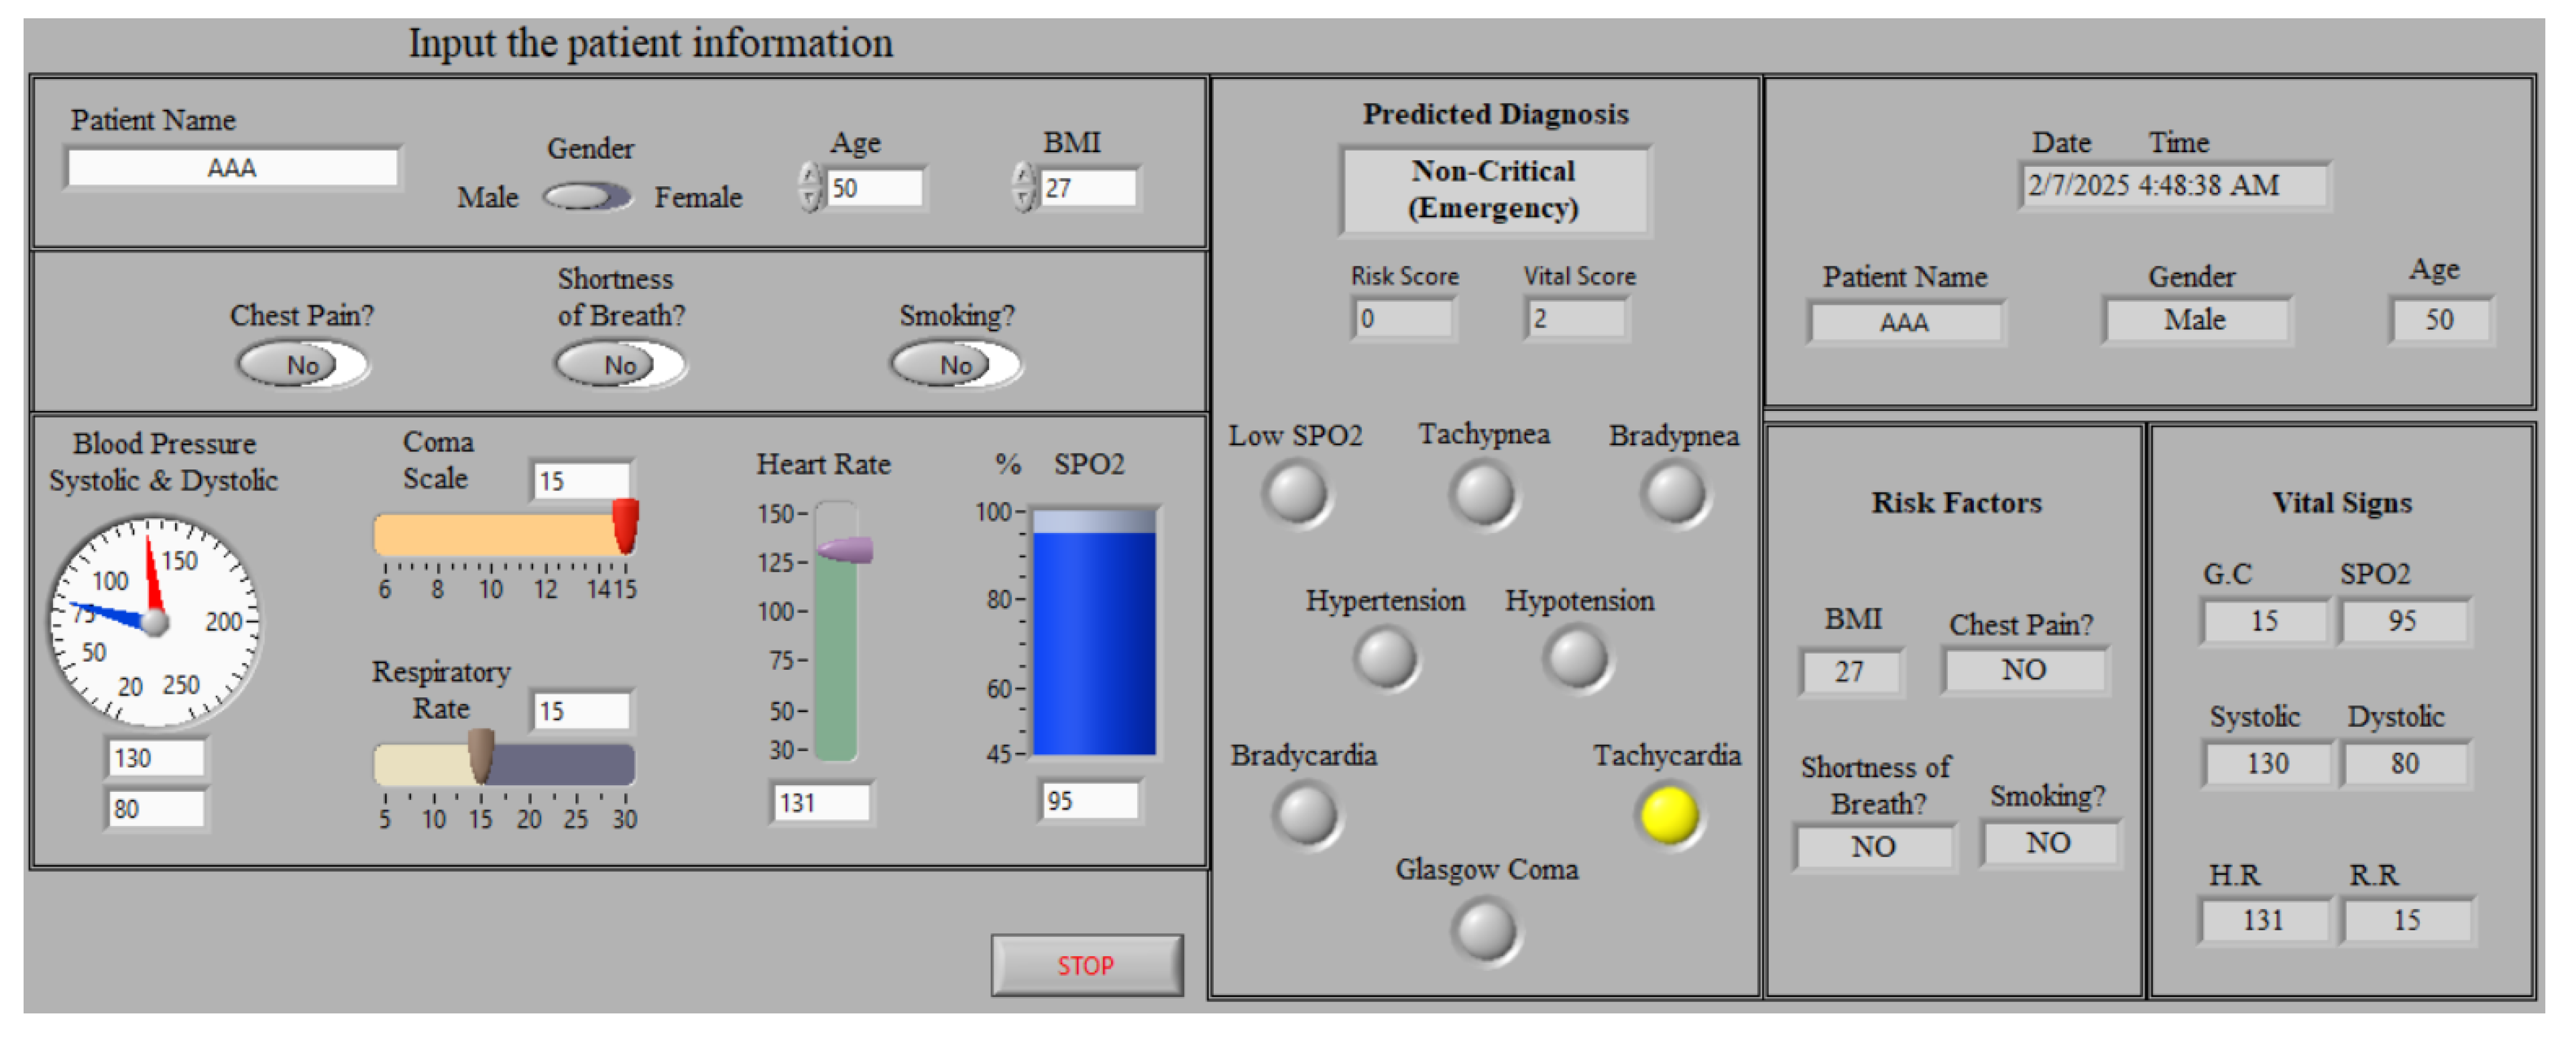
- Implementing a LabVIEW-based monitoring system by integrating the proposed framework into a LabVIEW environment with an intuitive GUI, facilitating real-time remote monitoring for cardiac patients. This system enhances medical decision-making by allowing medical doctors to track patient status and provide immediate essential consultations and therapy.
2. Related Works
3. Dataset Description
4. The Proposed Real-Time Monitoring System
4.1. Developed ANN Model
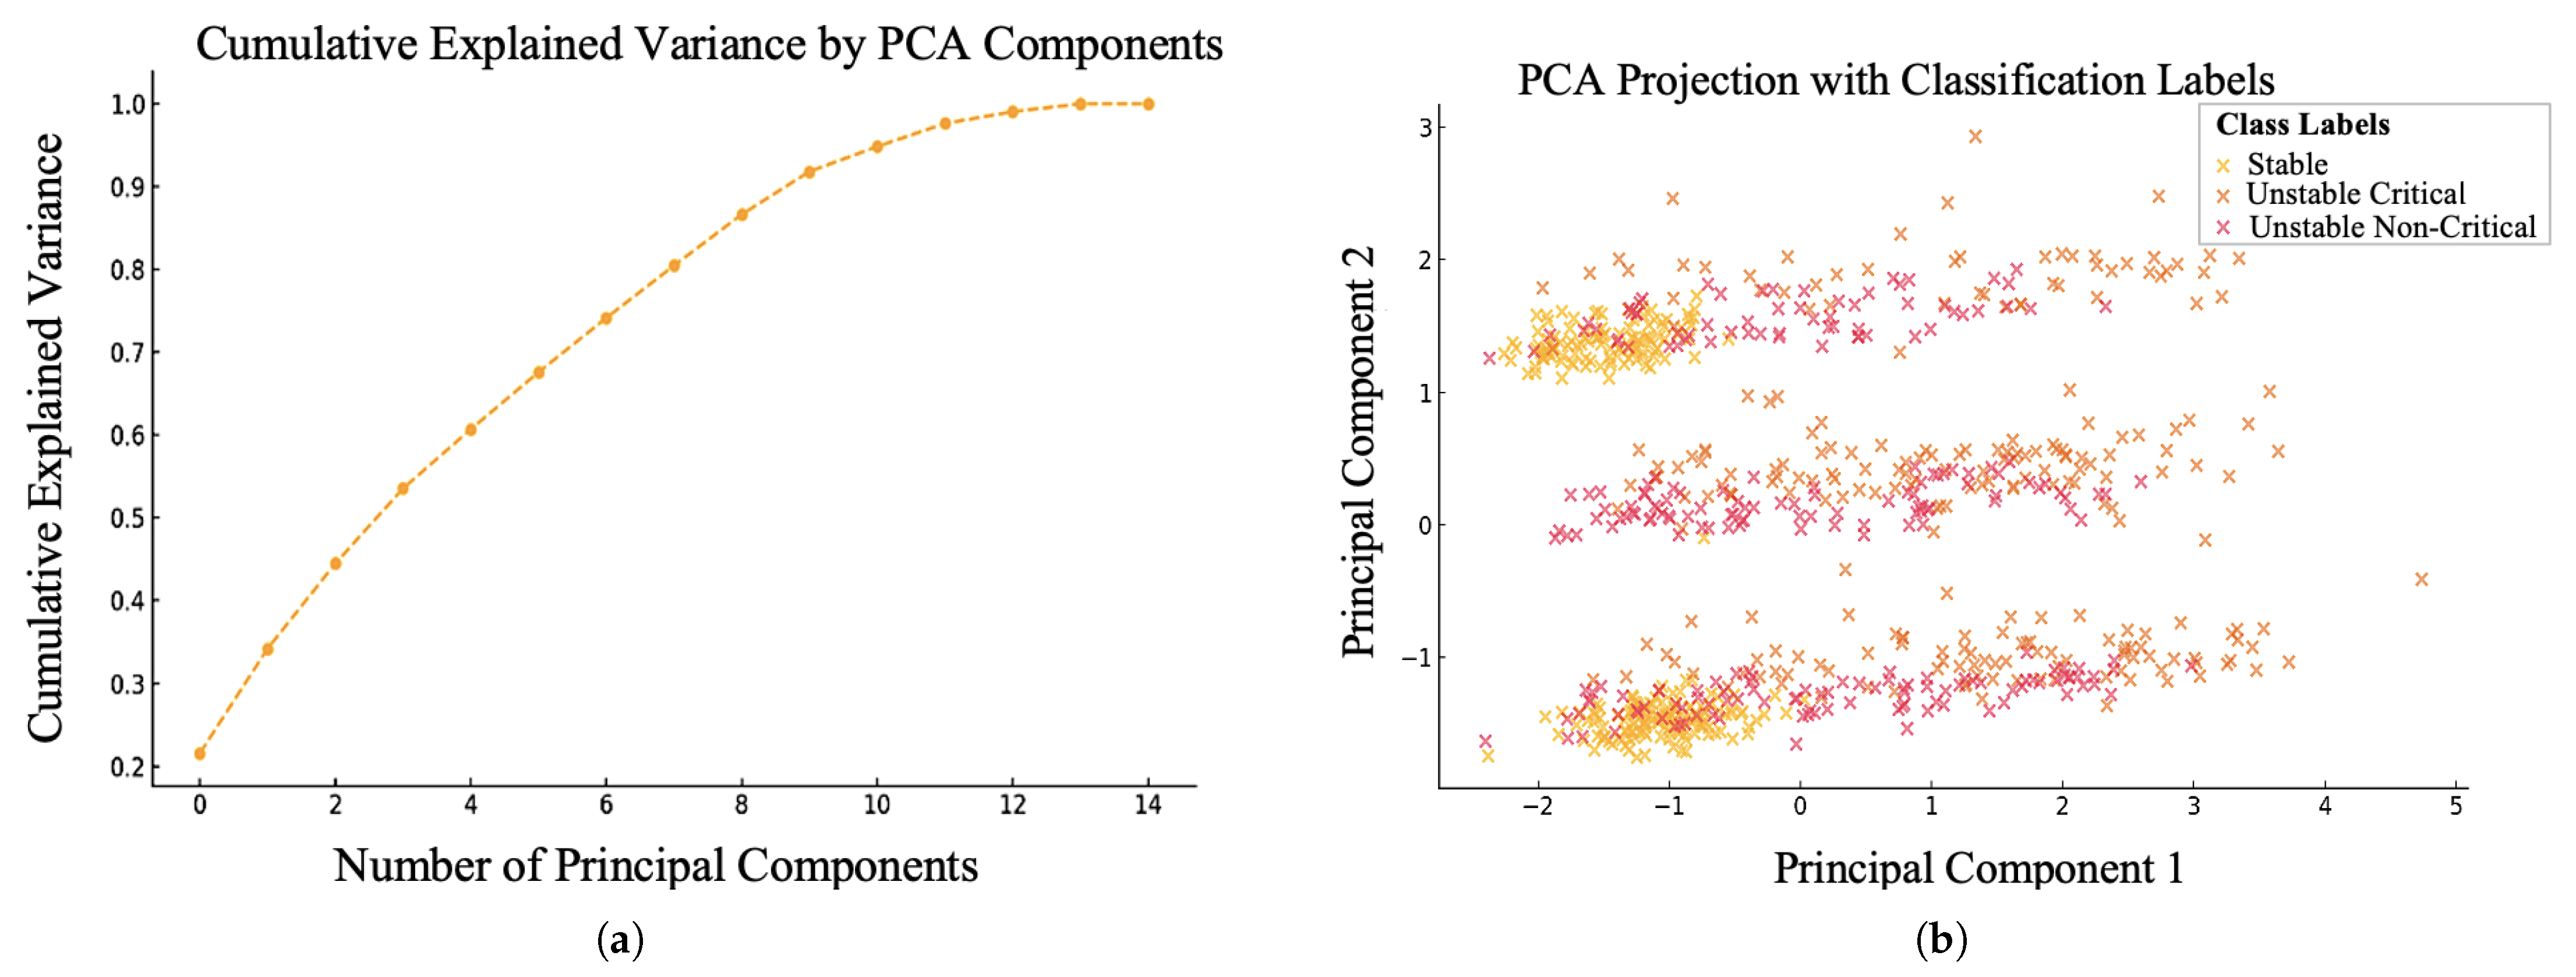
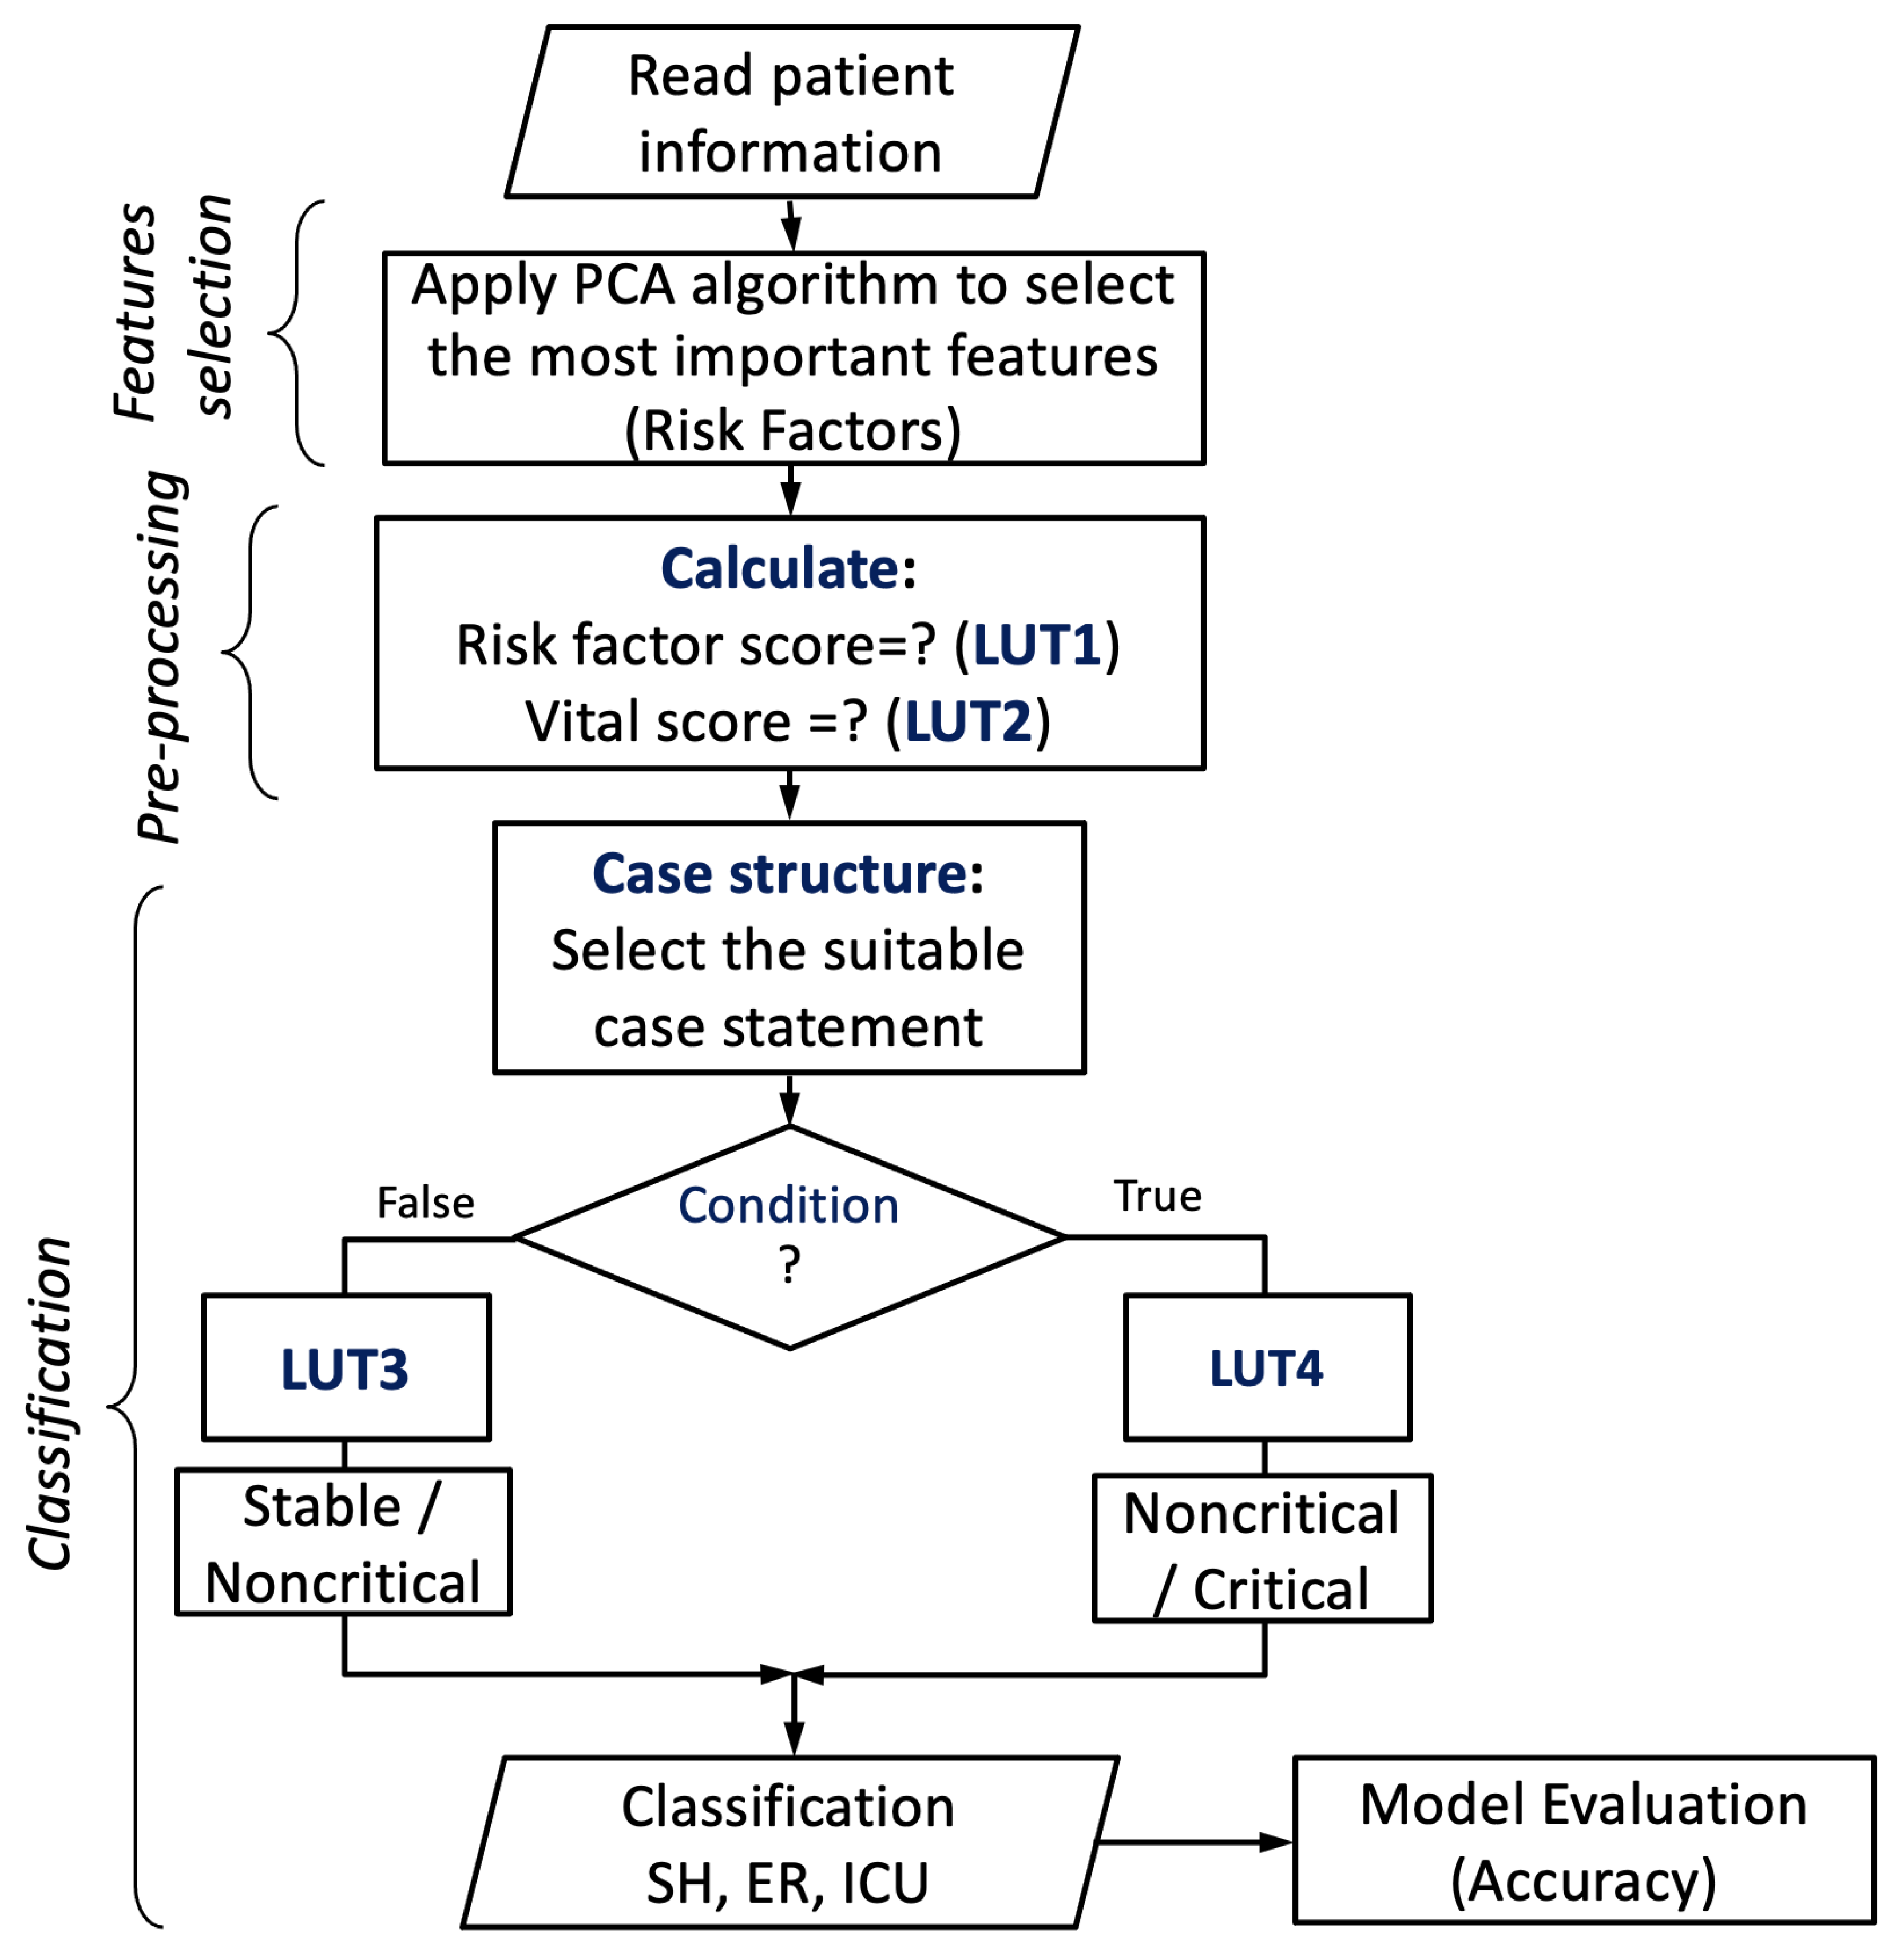
4.2. Feature Selection Based on PCA Algorithm
4.3. Proposed Encoding-Based Machine Learning Model
| Algorithm 1 Pseudocode algorithm of the encoding-based model |
|
5. Experimental Setup and Results Evaluation
5.1. Performance Evaluation
5.2. Status Monitoring
6. Conclusions
Author Contributions
Funding
Data Availability Statement
Conflicts of Interest
References
- Ayon, S.I.; Islam, M.M.; Hossain, M.R. Coronary artery heart disease prediction: A comparative study of computational intelligence techniques. IETE J. Res. 2022, 68, 2488–2507. [Google Scholar] [CrossRef]
- Rashme, T.Y.; Islam, L.; Jahan, S.; Prova, A.A. Early prediction of cardiovascular diseases using feature selection and machine learning techniques. In Proceedings of the 2021 6th International Conference on Communication and Electronics Systems (ICCES), Coimbatre, India, 8–10 July 2021; pp. 1554–1559. [Google Scholar]
- Yew, H.T.; Ng, M.F.; Ping, S.Z.; Chung, S.K.; Chekima, A.; Dargham, J.A. IoT based real-time remote patient monitoring system. In Proceedings of the 2020 16th IEEE International Colloquium on Signal Processing & Its Applications (CSPA), Langkawi, Malaysia, 28–29 February 2020; pp. 176–179. [Google Scholar]
- Chen, X.; Xie, J.; Fang, Z.; Xia, S. Low power electrocardiography and impedance cardiography detection system based on LabVIEW and bluetooth low energy. In Proceedings of the 2015 IET International Conference on Biomedical Image and Signal Processing (ICBISP 2015), Beijing, China, 19 November 2015; pp. 1–4. [Google Scholar]
- Khan, M.U.; Aziz, S.; Iqtidar, K.; Zaher, G.F.; Alghamdi, S.; Gull, M. A two-stage classification model integrating feature fusion forcoronary artery disease detection and classification. Multimed. Tools Appl. 2022, 81, 13661–13690. [Google Scholar] [CrossRef]
- Speier, W.; Dzubur, E.; Zide, M.; Shufelt, C.; Joung, S.; Van Eyk, J.E.; Bairey Merz, C.N.; Lopez, M.; Spiegel, B.; Arnold, C. Evaluating utility and compliance in a patient-based ehealth study using continuoustime heart rate and activity trackers. J. Am. Med. Informat. Associat. 2018, 25, 1386–1391. [Google Scholar] [CrossRef] [PubMed]
- Pecchia, L.; Melillo, P.; Bracale, M. Remote health monitoring of heart failure with data mining via CART method on HRV features. IEEE Trans. Biomed. Eng. 2011, 58, 800–804. [Google Scholar] [CrossRef]
- Chandralekha, M.; Shenbagavadivu, N. Data analytics for risk of hospitalization of cardiac patients. IETE J. Res. 2021, 69, 3193–3202. [Google Scholar] [CrossRef]
- Ghosh, P.; Azam, S.; Jonkman, M.; Karim, A.; Shamrat, F.M.; Ignatious, E.; Shultana, S.; Beeravolu, A.R.; De Boer, F. Efficient prediction of cardiovascular disease using machine learning algorithms with relief and LASSO feature selection techniques. IEEE Access 2021, 9, 19304–19326. [Google Scholar] [CrossRef]
- Rahman, M.Z.; Akbar, M.A.; Leiva, V.; Tahir, A.; Riaz, M.T.; Martin-Barreiro, C. An intelligent health monitoring anddiagnosis system based on the internet of things and fuzzy logicfor cardiac arrhythmia COVID-19 patients. Comput. Biol. Med. 2023, 145, 106583. [Google Scholar]
- Ong, M.K.; Romano, P.S.; Edgington, S.; Aronow, H.U.; Auerbach, A.D.; Black, J.T.; De Marco, T.; Escarce, J.J.; Evangelista, L.S.; Hanna, B.; et al. Effectiveness of remote patient monitoring after discharge of hospitalized patients with heart failure: The better effectiveness after transition–heart failure (BEAT-HF) randomized clinical trial. JAMA Intern. Med. 2016, 176, 310–318. [Google Scholar] [CrossRef]
- Kondaka, L.S.; Thenmozhi, M.; Vijayakumar, K.; Kohli, R. Anintensive healthcare monitoring paradigm by using IoT based machinelearning strategies. Multimed. Tools Appl. 2021, 81, 36891–36905. [Google Scholar] [CrossRef]
- Stuart, H.R.; Ian, D.P.; Strachan, M.W.; Hobson, R.P. Davidson’s Principles and Practice of Medicine, 23rd ed.; Elsevier Health Sciences: Amsterdam, The Netherlands, 2018. [Google Scholar]
- Naraei, P.; Abhari, A.; Sadeghian, A. Application of multilayer perceptron neural networks and support vector machines in classification of healthcare data. In Proceedings of the 2016 Future Technologies Conference (FTC), San Francisco, CA, USA, 6–7 December 2016; pp. 848–852. [Google Scholar]
- Haq, A.U.; Li, J.; Memon, M.H.; Memon, M.H.; Khan, J.; Marium, S.M. Heart disease prediction system using model of machine learning and sequential backward selection algorithm for features selection. In Proceedings of the 2019 IEEE 5th International Conference for Convergence in Technology (I2CT), Bombay, India, 29–31 March 2019; pp. 1–4. [Google Scholar]
- Sahoo, S.; Bisoy, S.K.; Mallick, P.K. Cardiac Disease Detection Using Machine Learning Algorithms: A Review. In Proceedings of the 2024 International Conference on Advancements in Smart, Secure and Intelligent Computing (ASSIC), Bhubaneswar, India, 27–29 January 2024; pp. 1–5. [Google Scholar]
- Ullah, T.; Ullah, S.; Ullah, K.; Ishaq, M.; Khan, A.; Ghadi, Y.; Algarni, A. Machine Learning-Based Cardiovascular Disease Detection Using Optimal Feature Selection. IEEE Access 2024, 12, 16431–16446. [Google Scholar] [CrossRef]
- Yuvaraj, R.; Chadha, S.; Prince, A.A.; Murugappan, M.; Islam, M.S.B.; Sumon, M.S.I.; Chowdhury, M.E.H. A Machine Learning Framework for Classroom EEG Recording Classification: Unveiling Learning-Style Patterns. Algorithms 2024, 17, 503. [Google Scholar] [CrossRef]
- Machado, R.; Dodhy, R.S.; Sehgal, A.; Rattigan, K.; Lalwani, A.; Waynforth, D. A Machine Learning Approach to Identifying Risk Factors for Long COVID-19. Algorithms 2024, 17, 485. [Google Scholar] [CrossRef]
- Senthil, P.S.; Kumaragurubaran, T.; Vijay, S.R.; Vigneshwaran, R. Predictive Modelling of Critical Vital Signs in ICU Patients by Machine Learning: An Early Warning System for Improved Patient Outcomes. In Proceedings of the 2024 3rd International Conference for Innovation in Technology (INOCON), Bangalore, India, 1–3 May 2024. [Google Scholar]
- Ali, G.; Abdullah Al-Kafi, G.M.; Faiza, J.T.; Hoque, M.I.; Suha, S.A. Revolutionizing Intensive Care: A Machine Learning Based Approach for ICU Patients’ In-Hospital Mortality Prediction. In Proceedings of the 2024 6th International Conference on Electrical Engineering and Information & Communication Technology (ICEEICT), Dhaka, Bangladesh, 2–4 May 2024; pp. 711–716. [Google Scholar]
- Tan, E.T.; Halim, Z.A. Health care monitoring system and analytics based on internet of things framework. IETE J. Res. 2019, 65, 653–660. [Google Scholar] [CrossRef]
- Naik, K.T.; Garg, B. A Machine Learning Model for Disease Prediction and Remote Patient Monitoring. In Proceedings of the 4th International Conference on Information Management & Machine Intelligence (ICIMMI ’22), Jaipur, India, 23–24 December 2022; Association for Computing Machinery: New York, NY, USA Article 7. ; pp. 1–5. [Google Scholar]
- Dalal, K.R. Analysing the implementation of machine learning in healthcare. In Proceedings of the 2020 International Conference on Electronics and Sustainable Communication Systems (ICESC), Coimbatore, India, 2–4 July 2020; pp. 133–137. [Google Scholar]
- Meng, Y.; Speier, W.; Shufelt, C.; Joung, S.; Van Eyk, J.E.; Merz, C.N.; Lopez, M.; Spiegel, B.; Arnold, C.W. A machine learning approach to classifying self-reported health status in a cohort of patients with heart disease using activity tracker data. IEEE J. Biomed. Health Inf. 2020, 24, 878–884. [Google Scholar] [CrossRef]
- Piri, S.; Delen, D.; Liu, T.; Zolbanin, H.M. A data analytics approach to building a clinical decision support system for diabetic retinopathy: Developing and deploying a model ensemble. Decis. Support Syst. 2017, 101, 12–27. [Google Scholar] [CrossRef]
- Schouten, P. Big data in health care: Solving provider revenue leakage with advanced analytics. Healthc. Financ. Manag. 2013, 67, 40–43. [Google Scholar]
- Patil, M.; Lobo, V.B.; Puranik, P.; Pawaskar, A.; Pai, A.; Mishra, R. A proposed model for lifestyle disease prediction using support vector machine. In Proceedings of the 2018 9th International Conference on Computing, Communication and Networking Technologies (ICCCNT), Bengaluru, India, 10–12 July 2018; pp. 1–6. [Google Scholar]
- Katarya, R.; Srinivas, P. Predicting heart disease at early stages using machine learning: A survey. In Proceedings of the 2020 International Conference on Electronics and Sustainable Communication Systems (ICESC), Coimbatore, India, 2–4 July 2020; pp. 302–305. [Google Scholar]
- Kaur, P.; Kumar, R.; Kumar, M. A healthcare monitoring systemusing random forest and internet of things (IoT). Multimed. Tools Appl. 2019, 78, 19905–19916. [Google Scholar] [CrossRef]
- Sabarmathi, G.; Chinnaiyan, R. Reliable machine learning approach to predict patient satisfaction for optimal decision making and quality health care. In Proceedings of the 2019 International Conference on Communication and Electronics Systems (ICCES), Coimbatore, India, 17–19 July 2019; pp. 1489–1493. [Google Scholar]
- Graham, B.; Bond, R.; Quinn, M.; Mulvenna, M. Using data mining to predict hospital admissions from the emergency department. IEEE Access 2018, 6, 10458–10469. [Google Scholar] [CrossRef]
- Paudel, N.; Neupane, R.C. A general architecture for a real-time monitoring system based on the internet of things. In Proceedings of the 2019 3rd International Symposium on Computer Science and Intelligent Control, ser. ISCSIC, Amsterdam, The Netherlands, 25–27 September 2019; Association for Computing Machinery: New York, NY, USA, 2019. [Google Scholar]
- Dinesh, K.G.; Arumugaraj, K.; Santhosh, K.D.; Mareeswari, V. Prediction of cardiovascular disease using machine learning algorithms. In Proceedings of the 2018 International Conference on Current Trends towards Converging Technologies (ICCTCT), Coimbatore, India, 1–3 March 2018; pp. 1–7. [Google Scholar]
- Sujatha, P.; Mahalakshmi, K. Performance evaluation of supervised machine learning algorithms in prediction of heart disease. In Proceedings of the 2020 IEEE International Conference for Innovation in Technology (INOCON), Bangluru, India, 6–8 November 2020; pp. 1–7. [Google Scholar]
- Manikandan, M.; Vijayakumar, P. Improving the performance of classifiers by ensemble techniques for the premature finding of unusual birth outcomes from cardiotocography. IETE J. Res. 2020, 69, 1734–1744. [Google Scholar] [CrossRef]
- Qadri, A.M.; Raza, A.; Munir, K.; Almutairi, M.S. Effective Feature Engineering Technique for Heart Disease Prediction With Machine Learning. IEEE Access 2023, 11, 56214–56224. [Google Scholar] [CrossRef]
- Ardabili, S.Z.; Bahmani, S.; Lahijan, L.Z.; Khaleghi, N.; Sheykhivand, S.; Danishvar, S. A Novel Approach for Automatic Detection of Driver FatigueUsing EEG Signals Based on Graph Convolutional Networks. Algorithms 2024, 24, 364. [Google Scholar]
- Mohajelin, F.; Sheykhivand, S.; Shabani, A.; Danishvar, M.; Danishvar, S.; Lahijan, L.Z. Automatic Recognition of Multiple Emotional Classes fromEEG Signals through the Use of Graph Theory andConvolutional Neural Networks. Algorithms 2024, 24, 5883. [Google Scholar]
- Innes, J.A.; Dover, A.R.; Fairhurst, K. Macleod’s Clinical Examination, 14th ed.; Elsevier: Amsterdam, The Netherlands, 2018. [Google Scholar]
- Bishop, C.M. Pattern Recognition and Machine Learning; Springer Publishing Company: Cambridge, UK, 2006. [Google Scholar]

| Risk Factors and Extracted Features | |||
|---|---|---|---|
| Medical History | Medical Examination | ||
| Features | Type | Features | Type |
| Age | Continuous | Heart Rate | Continuous |
| Body Mass Index (BMI) | Continuous | Respiratory Rate | Continuous |
| Chest Pain (CP) | Nominal (0 → NO; 1 → YES) | SPO2 | Continuous |
| Shortness of Breath (SoB) | Nominal (0 → NO; 1 → YES) | Blood Pressure | Continuous |
| Smoking | Nominal (0 → NO; 1 → YES) | Glasgow Coma Scale | Continuous |
| Possible Labels and Required Medical Therapy | |||
| Health Status (Labels) | Medical Therapy | ||
| Stable | Stay Home (SH) | ||
| Unstable Non-critical | Emergency Room (ER) | ||
| Unstable Critical | Intensive Care Unit (ICU) | ||
| Factors | Applicable Sensors |
|---|---|
| Gender, Age, and Smoking | User Interface (input) |
| Body Mass Index (BMI) | Weight Sensor (e.g., load cell), Height Sensor (e.g., ultrasonic/infrared) |
| Chest Pain | User Interface (input) |
| Shortness of Breath | Piezoelectric Belt or Pulse Oximeter |
| Blood Pressure (Systolic and Diastolic) | Blood Pressure Monitor (Oscillo-metric) |
| Heart Rate | Heart Rate Sensor (e.g., photoplethysmography) |
| Respiratory Rate | Respiration Sensor (e.g., chest belt or nasal airflow sensor) |
| Glasgow Coma Scale | Clinician Assessment (e.g., EEG optionally for brain activity) |
| SPO2 | Pulse Oximeter |
| Factors | Min. | Max. | Mean () | Std. Dev. () |
|---|---|---|---|---|
| Gender | 0 | 1 | ||
| Age | 23 | 87 | ||
| BMI | 22 | 35 | ||
| Chest pain | 0 | 1 | ||
| Shortness of breath | 0 | 1 | ||
| Smoking | 0 | 1 | ||
| Systolic | 50 | 200 | ||
| Diastolic | 50 | 130 | ||
| Heart rate | 45 | 140 | ||
| Respiratory rate | 10 | 22 | ||
| Glasgow coma scale | 8 | 15 | ||
| SPO2 | 52 | 98 | ||
| Class | 0 | 2 | 1 |
| Risk Factors | ||
|---|---|---|
| Risk Score (RS) | Chest Pain? | Shortness of Breath? |
| 0 | 0 | 0 |
| 1 | 0 | 1 |
| 2 | 1 | 0 |
| 3 | 1 | 1 |
| # | Name | CP | SoB | Sys. | Dia. | HR | RR | GC | SPO2 (%) | Actual Status |
|---|---|---|---|---|---|---|---|---|---|---|
| 1 | Person1 | YES | NO | 90 | 50 | 93 | 12 | 10 | 87 | Critical |
| 2 | Person2 | YES | NO | 100 | 80 | 83 | 13 | 14 | 97 | Stable |
| 3 | Person3 | NO | YES | 150 | 70 | 95 | 13 | 15 | 92 | Non-critical |
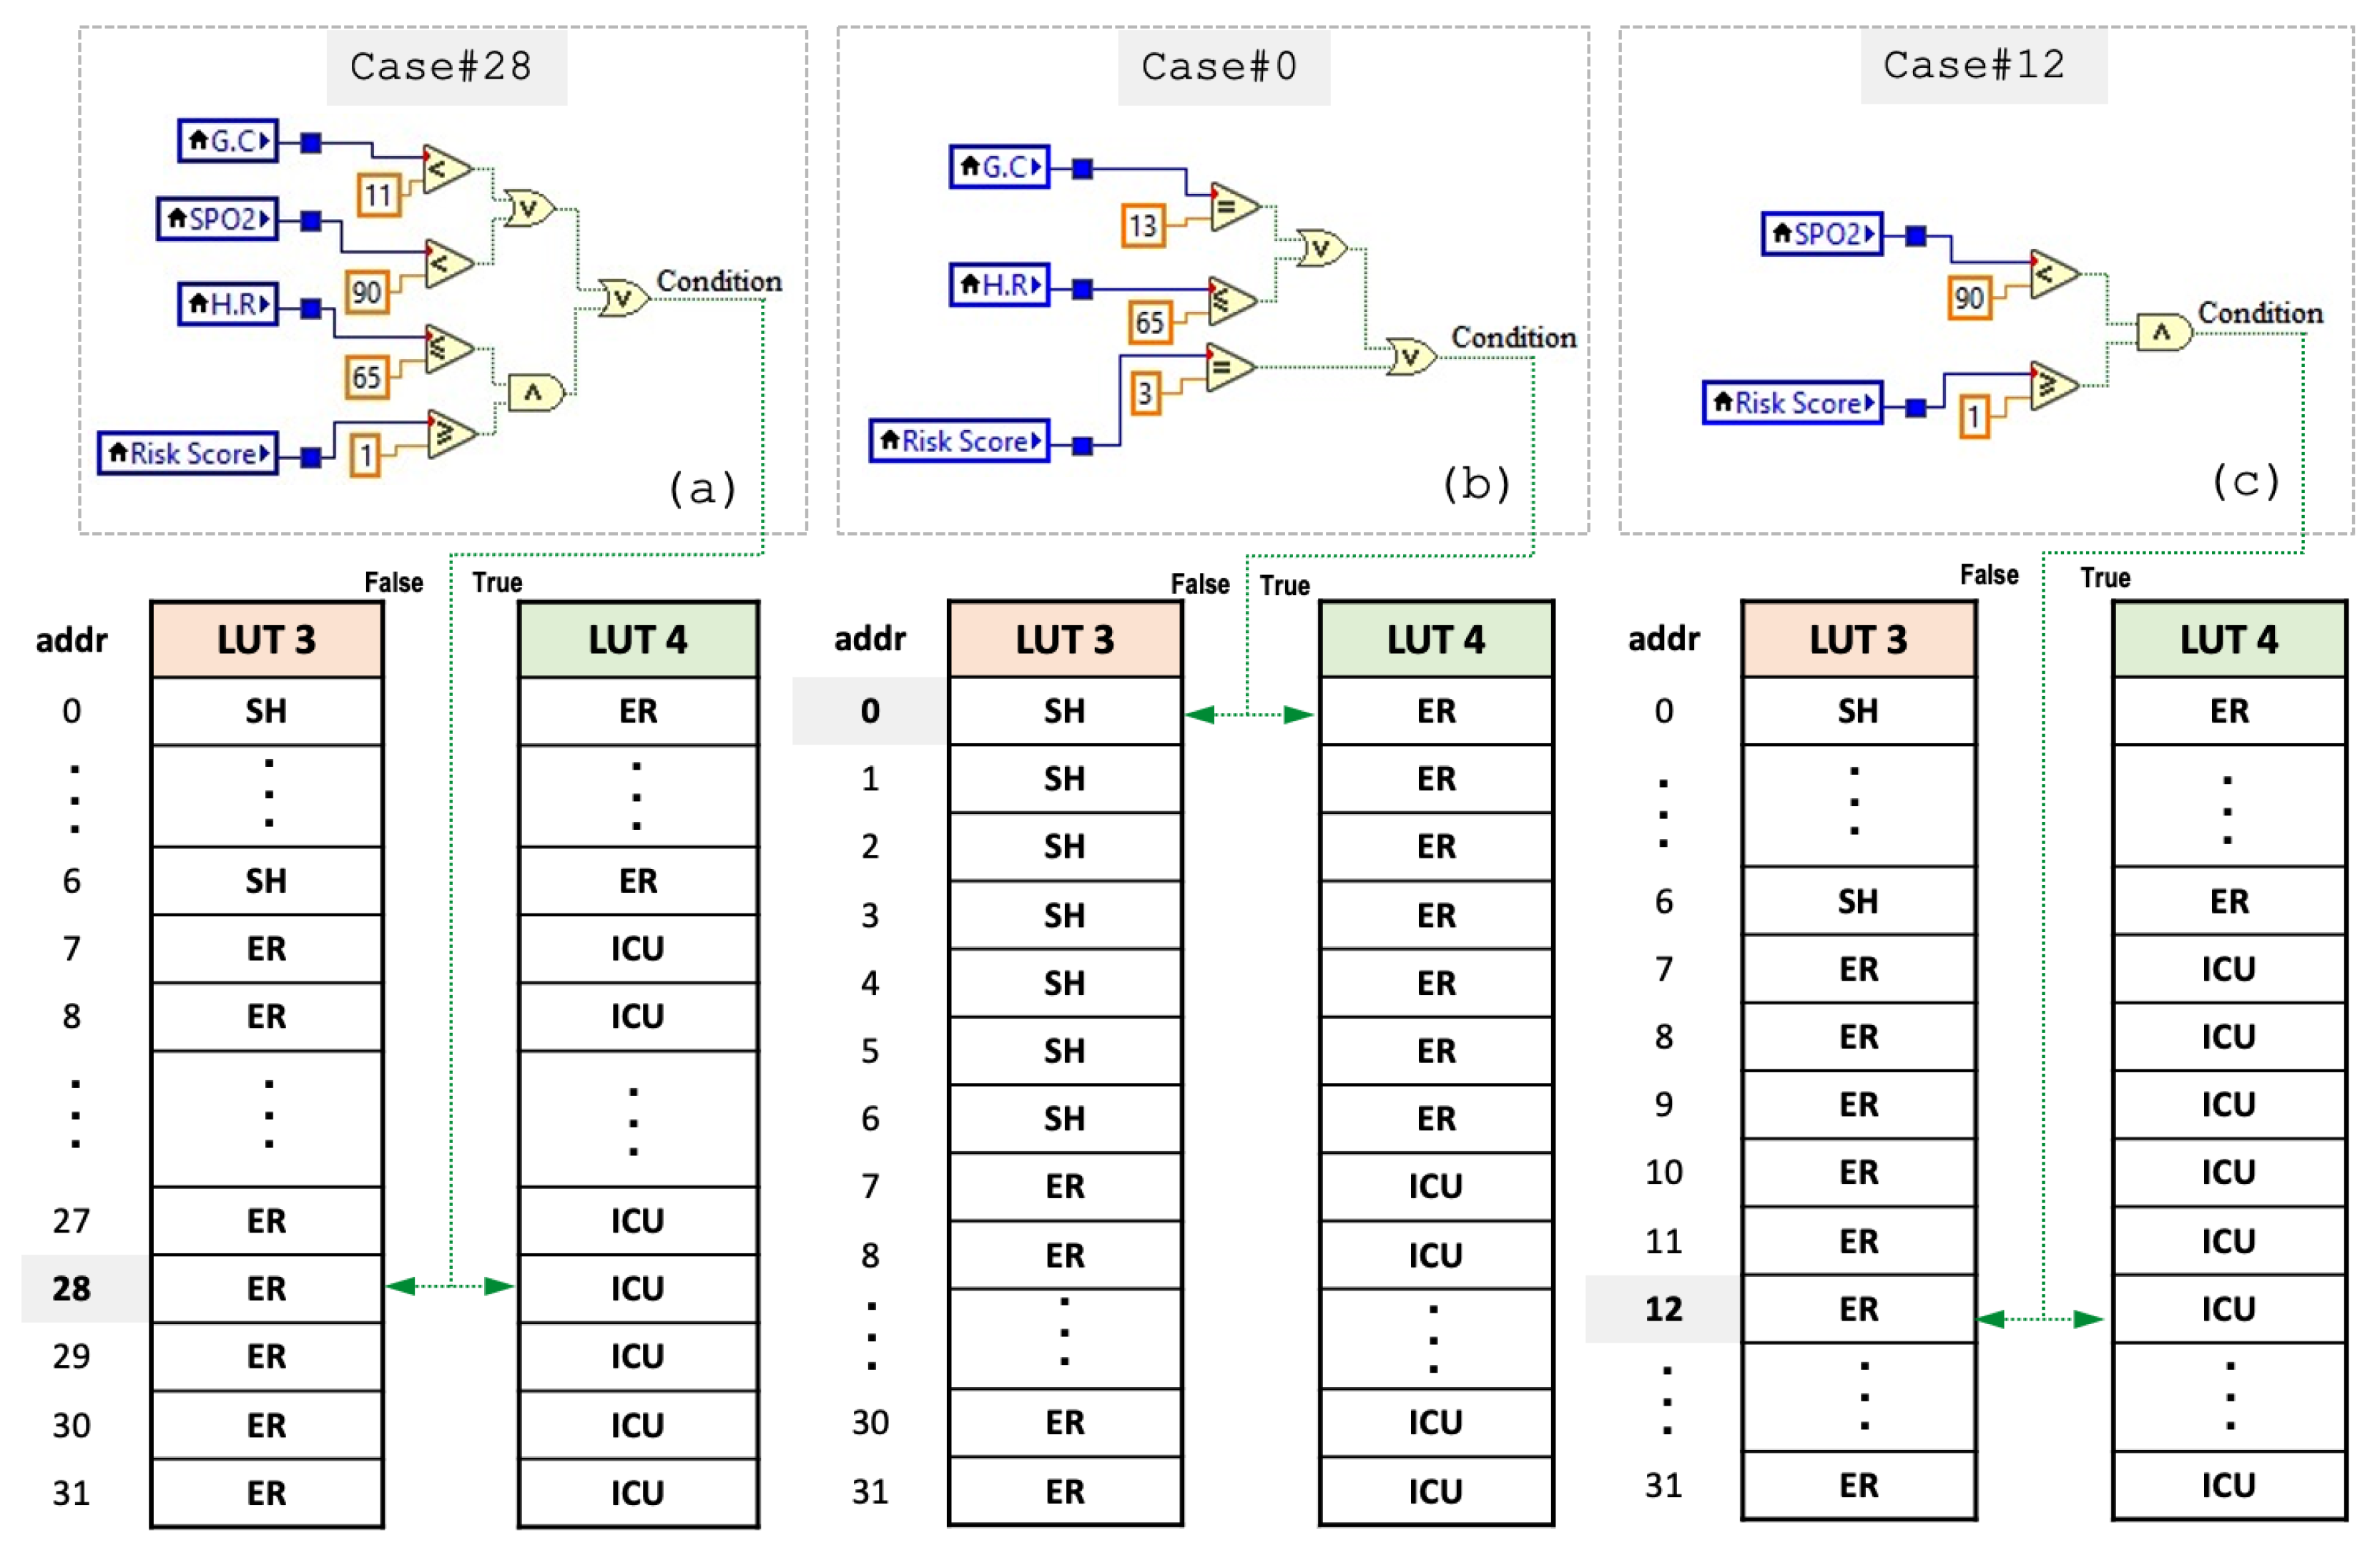
| Switch Case (VS) | Condition? | ||
|---|---|---|---|
| Vital Score | Case # | False (LUT3) | True (LUT4) |
| 0 | Case 0 | Stable (SH) | Non-Critical (EM) |
| 1 | Case 1 | Stable (SH) | Non-Critical (EM) |
| 2 | Case 2 | Stable (EH) | Non-Critical (EM) |
| 3,4 | Case 3,4 | Stable (SH) | Non-Critical (EM) |
| 5 | Case 5 | Stable (SH) | Non-Critical (EM) |
| 6 | Case 6 | Stable (SH) | Non-Critical (EM) |
| 7 | Case 7 | Non-Critical (ER) | Critical (ICU) |
| 8 | Case 8 | Non-Critical (ER) | Critical (ICU) |
| 9 | Case 9 | Non-Critical (ER) | Critical (ICU) |
| 10 | Case 10 | Non-Critical (ER) | Critical (ICU) |
| 11 | Case 11 | Non-Critical (ER) | Critical (ICU) |
| 12 | Case 12 | Non-Critical (ER) | Critical (ICU) |
| 13 | Case 13 | Non-Critical (ER) | Critical (ICU) |
| 14 | Case 14 | Non-Critical (ER) | Critical (ICU) |
| 15 | Case 15 | Non-Critical (ER) | Critical (ICU) |
| 16,17 | Case 16,17 | Non-Critical (ER) | Critical (ICU) |
| 18,19 | Case 18,19 | Non-Critical (ER) | Critical (ICU) |
| 20 | Case 20 | Non-Critical (ER) | Critical (ICU) |
| 21 | Case 21 | Non-Critical (ER) | Critical (ICU) |
| 22 | Case 22 | Non-Critical (ER) | Critical (ICU) |
| 23 | Case 23 | Non-Critical (ER) | Critical (ICU) |
| 24 | Case 24 | Non-Critical (ER) | Critical (ICU) |
| 25 | Case 25 | Non-Critical (ER) | Critical (ICU) |
| 26 | Case 26 | Non-Critical (ER) | Critical (ICU) |
| 27 | Case 27 | Non-Critical (ER) | Critical (ICU) |
| 28 | Case 28 | Non-Critical (ER) | Critical (ICU) |
| 29 | Case 29 | Non-Critical (ER) | Critical (ICU) |
| 30 | Case 30 | Non-Critical (ER) | Critical (ICU) |
| 31 | Case 31 | Non-Critical (ER) | Critical (ICU) |
| ML-Based Algorithm | Accuracy (%) | Failure Prediction Rate (%) |
|---|---|---|
| Decision Tree (DT) | ||
| Medium Tree | ||
| XGBoost | ||
| RUSBoosted Trees | 92 | 8 |
| Linear Discriminant | ||
| Gaussian Naive Bayes | ||
| Kernel Naive Bayes | ||
| Linear SVM | ||
| Quadratic SVM | 96 | 4 |
| Medium Gaussian SVM | ||
| Fine KNN | 90 | 10 |
| Medium KNN | ||
| Weighted KNN | ||
| Developed ANN Model | ||
| Proposed Encoding-based Model |
| Model | Precision (%) | Sensitivity (%) | F1-Score (%) |
|---|---|---|---|
| Gaussian Naive Bayes | 91 | ||
| Quadratic SVM | |||
| Developed ANN | 96 | 97 | |
| Proposed Encoding-based Model |
| Testing Dataset (30%) | All Dataset (100%) | |||
|---|---|---|---|---|
| K | Range | Accuracy | Range | Accuracy |
| K1 | 1 → 22 | 1 → 75 | ||
| K2 | 23 → 45 | 76 → 150 | ||
| K3 | 46 → 68 | 151 → 225 | ||
| K4 | 69 → 91 | 226 → 300 | ||
| K5 | 92 → 114 | 301 → 375 | ||
| K6 | 115 → 137 | 376 → 450 | ||
| K7 | 138 → 160 | 451 → 525 | ||
| K8 | 161 → 183 | 526 → 600 | ||
| K9 | 184 → 206 | 601 → 675 | ||
| K10 | 207 → 225 | 676 → 750 | ||
| AVE | AVE | |||
Disclaimer/Publisher’s Note: The statements, opinions and data contained in all publications are solely those of the individual author(s) and contributor(s) and not of MDPI and/or the editor(s). MDPI and/or the editor(s) disclaim responsibility for any injury to people or property resulting from any ideas, methods, instructions or products referred to in the content. |
© 2025 by the authors. Licensee MDPI, Basel, Switzerland. This article is an open access article distributed under the terms and conditions of the Creative Commons Attribution (CC BY) license (https://creativecommons.org/licenses/by/4.0/).
Share and Cite
Awad, S.R.; Alghareb, F.S. Encoding-Based Machine Learning Approach for Health Status Classification and Remote Monitoring of Cardiac Patients. Algorithms 2025, 18, 94. https://doi.org/10.3390/a18020094
Awad SR, Alghareb FS. Encoding-Based Machine Learning Approach for Health Status Classification and Remote Monitoring of Cardiac Patients. Algorithms. 2025; 18(2):94. https://doi.org/10.3390/a18020094
Chicago/Turabian StyleAwad, Sohaib R., and Faris S. Alghareb. 2025. "Encoding-Based Machine Learning Approach for Health Status Classification and Remote Monitoring of Cardiac Patients" Algorithms 18, no. 2: 94. https://doi.org/10.3390/a18020094
APA StyleAwad, S. R., & Alghareb, F. S. (2025). Encoding-Based Machine Learning Approach for Health Status Classification and Remote Monitoring of Cardiac Patients. Algorithms, 18(2), 94. https://doi.org/10.3390/a18020094