Article

Encoding-Based Machine Learning Approach for Health Status Classification and Remote Monitoring of Cardiac Patients

by
Sohaib R. Awad
and
Faris S. Alghareb
*
Department of Computer and Informatics Engineering, College of Electronics, Ninevah University, Mosul 41002, Iraq
*
Author to whom correspondence should be addressed.
Algorithms 2025, 18(2), 94; https://doi.org/10.3390/a18020094
Submission received: 12 December 2024 / Revised: 27 January 2025 / Accepted: 5 February 2025 / Published: 7 February 2025
(This article belongs to the Section Algorithms for Multidisciplinary Applications)

Abstract

:
Remote monitoring of a patient’s vital activities has become increasingly important in dealing with various medical applications. In particular, machine learning (ML) techniques have been extensively utilized to analyze electrocardiogram (ECG) signals in cardiac patients to classify heart health status. This trend is largely driven by the growing interest in computer-aided diagnosis based on ML algorithms. However, there has been inadequate investigation into the impact of risk factors on heart health, which hinders the ability to identify heart-related issues and predict the conditions of cardiac patients. In this context, developing a GUI-based classification approach can significantly facilitate online monitoring and provide real-time warnings by predicting potential complications. In this paper, a general framework structure for medical real-time monitoring systems is proposed for modeling the vital signs of cardiac patients in order to predict the patient’s status. The proposed approach analyzes AI-driven interventions to provide a more accurate cardiac diagnosis and real-time monitoring system. To further demonstrate the validity of the presented approach, we employ it in a LabVIEW-based remote tracking system to predict three healthcare statuses (stable, unstable non-critical, and unstable critical). The developed monitoring system receives various information about patients’ vital signs, and then it leverages a novel encoding-based machine learning algorithm to pre-process, analyze, and classify patient status. The developed ANN classifier and proposed encoding-based ML model are compared to other conventional ML-based models, such as Naive Bayes, SVM, and KNN for model accuracy evaluation. The obtained outcomes demonstrate the efficacy of the presented ANN and encoding-based ML approaches by achieving an accuracy of 98.4 % and 98.8 % for the developed ANN classifier and the proposed encoding-based technique, respectively, whereas Naive Bayes and quadratic SVM algorithms realize 94.8 % and 96 % , respectively. In short, this study aims to explore how ML algorithms can enhance diagnostic accuracy, improve real-time monitoring, and optimize treatment outcomes. Meanwhile, the proposed tracking system outperforms most existing monitoring systems by offering high classification accuracy of the heart health status and a user-friendly interactive interface. Therefore, it can potentially be utilized to improve the performance of remote healthcare monitoring for cardiac patients.

Graphical Abstract

1. Introduction

Hundreds of preventable cardiac arrests occur every year as a result of a lack of real-time monitoring at home or in places apart from specialized healthcare facilities, i.e., the Intensive Care Unit (ICU) [1,2]. Fortunately, due to advances in healthcare technologies, the lifespan of chronic patients has been effectively extended [3]. People suffering from heart disease often require long-term daily monitoring of their vital signs, including blood pressure, heart beating rate, respiratory rate, chest pain, and other factors [4,5]. The available cardiac monitoring systems are very expensive since they rely on many complicated hardware devices that employ complex algorithms [6]. Additionally, medical care costs have been exponentially increased due to the growing number of people suffering from chronic diseases such as diabetes and cardiac disease [7,8,9].
Typically, complicated measurement devices are utilized in hospitals worldwide to diagnose serious heart diseases. Meanwhile, these types of healthcare equipment require physical in-person examination by medical specialists to identify any arrhythmia issues, i.e., irregular heartbeats [10]. One strategy for overcoming the healthcare delivery challenges of chronic diseases is to utilize a remote patient management system [11,12]. LabVIEW-based patient real-time monitoring systems have been sought to cope with unaffordable medical care. This is due to LabVIEW offering an excellent Graphical User Interface (GUI) for remote tracking that can be shared online via the LabVIEW webserver. In addition, LabVIEW provides a more user-friendly interactive interface, which allows quick understanding and cognitive medical care. On the other hand, to allow a practicing as an assistant tool for medical doctors, solid knowledge and skills are strongly required [13]. This is because any misinterpretation of the vital signs increases the diagnostic error, which is estimated to be 0∼15% wrong in different specialties such as general practice, emergency, and internal medicine [13]. Machine learning (ML) techniques have been widely implemented for data mining of medical applications since they have proven to be excellent tools for analyzing big data and revealing hidden patterns that can assist in making precise medical decisions [14,15]. Data mining in the medical field deals with patient outcomes, thereby applying machine learning techniques necessitates precise and careful decisions to achieve a high level of accuracy [16].
AI algorithms can accurately interpret and extract patterns from the vital signs and medical examinations of cardiac patients, particularly in identifying critical symptoms. These techniques enable the detection and precise identification of anomalies, facilitating early signs detection of cardiovascular diseases and timely intervention. This capability can significantly improve cardiac care and potentially save lives [17]. Moreover, identifying risk factors for heart-related issues is essential for effective patient risk stratification, which can direct management and preventive measures to decrease related morbidity and healthcare costs [18,19]. Due to the numerous and diverse predictors affecting health-related factors, machine learning has emerged and proved to be a leading technique [19]. Consequently, the accumulation of healthcare for personalized treatment can be facilitated through employing machine learning approaches to help analyze patients’ symptoms and predict whether or not a patient has developed risk factors that require urgent treatment. In this regard, only patients exhibiting severe symptoms will be transferred to the emergency room or ICU [20,21].
In response to these challenges, this paper presents a novel machine learning-based model that can be used to precisely anticipate the status of cardiac patients. The model employs a multi-class classification technique that encodes the most crucial risk factors and vital signs to reduce the computation complexity while increasing the prediction accuracy, achieving 97.3 % and 100 % minimum and maximum accuracy, respectively, based on K-fold cross-validation analysis. We have developed a real-time tracking system designed to monitor the health status of cardiac patients remotely, enabling comprehensive performance assessments that enhance the stability and efficiency of the healthcare system for cardiac patients. Below, we itemize the contributions of this manuscript as follows.
  • We curated a balanced dataset of 750 patient records from three hospitals, categorized into three health statuses, namely stable, unstable non-critical, and unstable critical. This dataset serves as a valuable resource for training and evaluating machine learning models.
  • Development of an efficient ANN classifier designed to achieve competitive accuracy compared to state-of-the-art ML models while optimizing the architecture by reducing the number of hidden-layer neurons.
  • Introducing a novel encoding-based ML algorithm proposed that surpasses conventional methods, such as Naive Bayes, SVM, and KNN, in classification accuracy for predicting cardiac patient health, achieving up to 98.8% accuracy.
  • The proposed encoding-based algorithm has demonstrated the efficacy of the encoding-based ML approach in enabling accurate predictions, supporting proactive monitoring and timely medical interventions.
  • Implementing a LabVIEW-based monitoring system by integrating the proposed framework into a LabVIEW environment with an intuitive GUI, facilitating real-time remote monitoring for cardiac patients. This system enhances medical decision-making by allowing medical doctors to track patient status and provide immediate essential consultations and therapy.
The remainder of the article is organized as follows: Section 2 provides a literature review and discusses the state-of-the-art of various machine learning approaches employed at different abstraction levels for medical applications. Section 3 covers the description of the dataset and the preprocessing for feature extraction. The proposed models for cardiac patient status prediction are discussed in Section 4. Section 5 analyzes the performance of the presented model and evaluates the obtained results by comparing them with different machine learning techniques considering effective evaluation metrics such as accuracy, precision, and F1-score, while Section 6 concludes the paper.

2. Related Works

Applying machine learning concepts has been carried out in several studies [8,22,23,24,25], dealing with a variety of challenges that the healthcare industry encounters. These scholarly studies aim to support the medical field by thoroughly analyzing the medical information of a patient and providing excellent decisions that help improve healthcare systems to potentially open new industrial paths for different applications. Data analytics in medical diagnostics has been substantially employed to develop risk prediction models that involve machine learning approaches for decision support systems, intervention, and resuscitation [26,27] to lower healthcare costs.
The authors in [14] carried out a comparison between implementing a multilayer back-propagation perceptron network (MLPN) and Support Vector Machine (SVM) algorithms to diagnose five classes of heart disease with a dataset of 303 patients. The results revealed that applying SVM for online classification achieves higher prediction accuracy by delivering more accurate decisions. An economic model that also implements the SVM algorithm was proposed in [28]. It was simulated as an alternative to DNA testing to identify possible threats that form the foundation of diagnostic tests and disease prevention. This indicates that the presented model is able to predict unhealthy lifestyles arising from diseases that patients might suffer from. The developed model can provide a detailed report that tracks changes in an individual’s diet and weight to help maintain a healthy lifestyle. In [29,30], the authors applied machine learning techniques to conduct a survey that predicts heart diseases at the early stages. They employed various ML-based algorithms such as SVM, Naive Bayes, Decision Tree, K-Nearest Neighbor (KNN), and ANN to aware cardiac patients in case they develop complications. The survey concludes that higher performance and classification accuracy can be realized when the input features are selected efficiently by applying search methods first to specify only the most suitable features. Likewise, ML-based concepts have also been employed in [31] to improve the healthcare system through patient satisfaction by determining related characteristics of various parameters. The model concentrates on specific criteria to build a safe and supportive healthcare environment. However, the decision-making process is not adequately matured to provide a precise decision ( 88 % regression accuracy).
Predicting hospitalization emergencies for cardiac patients was studied in [8,32]. The model developed in [8] takes several risk factors, such as age, disease types, disease conditions, etc., as input features and analyzes them to identify those associated with the high risk, whereas the authors in [32] employed data mining techniques to specify patients at high risk so that they could accurately and efficiently manage the admission of inpatients at the emergency department. Even though the predictive model facilitates emergency admissions and patient satisfaction, it only achieves a maximum classification accuracy of 80.31 % . Therefore, clinical examination remains necessary. Additionally, IoT-based patient monitoring systems have been widely researched in the literature. The researchers in [22] proposed an IoT-based healthcare system that leverages remote monitoring. This would help in advancing the healthcare business by reducing consultations and in-person meetings with doctors. However, integrating the classification model into the monitoring system requires a real-time GUI-based display to indicate potential risks at early stages and then provide timely treatment and life care. In [33], the authors built an IoT-based architecture that can be employed in various types of online systems. Nevertheless, deep investigations are still in demand to achieve more customized models that provide an acceptable level of security and prediction outcomes.
Alternatively, cardiovascular diseases (CVDs) were investigated in [34] by applying ML techniques to predict whether people have heart disease or not, thereby providing a further diagnosis and awareness to the cardiac patients. The researchers combined different ML algorithms such as SVM, Naive Bayes classifier, Random Forest, and Logistic Regression to achieve hybrid ML-based algorithms. Pre-processing techniques were used to remove the noisy or missing data, auto-fill with default values if possible, and classify attributes for prediction and deciding different levels. The logistic regression model showed better data analysis and higher accuracy compared to the other aforementioned algorithms. However, the developed model fails to realize high-level accuracy, delivering 91.6 % . Similarly, different supervised ML algorithms were applied in [35] to perform binary classification on 91 records and determine whether a patient has heart disease or not. It was shown that the Random Forest (RF) algorithm achieved the highest accuracy and F1-score ( 83.52 % and 84.21 % , respectively). This is consistent with the results in [36], which confirms that the RF algorithm provided the highest accuracy, achieving ( 96.61 % ) accurate classification. To further improve the classification accuracy of heart diseases, a deep neural network was deployed in [1] to classify diseases of the coronary artery. The developed model delivers an accuracy of 98.15 % . However, this was achieved at the expense of incurring complicated structure and massive computation operations. In [17], a scalable architecture for early cardiovascular disease prediction was proposed based on optimal feature selection approaches, such as FCBF and PSO optimization. Nevertheless, the developed system only concentrates on improving prediction performance while neglecting to offer real-time monitoring and warning outcomes.
The authors in [9] proposed a hybrid machine learning technique that employs different boosting approaches of machine learning to increase accuracy. The model involves a complicated feature extraction by combining Relief and the Least Absolute Shrinkage and Selection Operator (LASSO) to deliver accuracy of 99.05 % . Similarly, an intelligent health surveillance system based on Fuzzy Logic for cardiac patients was introduced in [10]. The system is used to monitor patients with critical arrhythmia conditions via IoT-based health tracking to make an autonomous diagnosis. Likewise, the authors in [37] presented a Principal Component Heart Failure (PCHF) feature engineering approach, which identifies the most prevalent features to provide optimal hyperparameters. The proposed approach employs machine learning methods (PCHF with Decision Tree) to identify heart failure with a prediction accuracy of 100 % . However, the proposed method fails to provide real-time remote monitoring of cardiac patients. In [19], machine learning algorithms were used for COVID-19 infection prediction, in which the Random Forest classification algorithm was demonstrated to deliver the highest classification performance of 97.4 % .
Driver fatigue detection using electroencephalography (EEG) signals and deep neural networks was explored in [38], where five types of fatigue were classified. The study employed generative adversarial networks (GANs) and graph convolutional networks (GCNs) for preprocessing and feature selection. While the model demonstrated impressive classification performance, it exhibited higher computational complexity compared to other counterpart methods presented in the literature. Similarly, EEG signals were utilized in [39] to analyze human emotions triggered by different events. Following a similar approach to [38], a combination of graph theory and GAN was applied to achieve accurate recognition of various facial emotional categories. However, the proposed network architecture was computationally intensive, necessitating substantial resources to achieve real-time classification.
Prior approaches to monitoring cardiac patients often involve overly complex processing methods or rely on traditional machine learning techniques, which are suitable for making single decisions but struggle to adapt to complex applications, such as integrating new features and output labels. This presents a challenge in accurately modeling the conditions of cardiac patients. Consequently, there is an ongoing pursuit for alternative solutions that can reliably operate in real-time and achieve higher classification accuracy. In this paper, we concentrate on monitoring and quantifying various risk factors related to cardiac patients to improve the quality of healthcare. The developed system is designed to monitor the conditions of cardiac patients and share their health information with authorized medical facilities via a LabVIEW web server. Ultimately, this study aims to provide remote health tracking for cardiac patients, assisting medical doctors in online monitoring of their patients’ statuses through a GUI that displays the predicted health status of each patient.

3. Dataset Description

Our structured dataset has been collected from two to three hospitals located in Mosul city, and the output classes have been verified by more than three specialist medical doctors. The dataset consists of 750 information reports of cardiac patients, and each record has 13 features of which 10 are considered risk factors that represent the most important input features, listed in Table 1 under medical history and examination. The first five rows of Table 1 describe the selected features of our collected dataset. As shown, the type of these features can be either continuous or nominal. Features that deal with Boolean expressions (false/true) are considered nominal while the others are continuous variables. The dataset was classified as stable, unstable non-critical, and unstable critical cases. These classes were collected in a way that creates a balance among the output labels.
To analyze the dataset, first, preprocessing is conducted to convert the ten most popular risk factors into five vital signs. This conversion process is carried out using a clinical decision-making comprehensive guide [13,40] to ensure excellent delivery of efficiency and safe medical care. These crucial vital signs can greatly aid medical doctors in rapidly delivering the necessary medical therapy. Hence the preprocessing for feature selection has been handled carefully. This is due to crucial information related to the modeling of the problem possibly being discarded, leading to degrading the system’s overall accuracy [41].
Table 2 outlines the necessary sensors and communication components for the proposed monitoring system for cardiac patients. These sensors are crucial for effective implementation of the system, while Table 1 presents the data volume from the sensors to illustrate the feasibility and realization of the system. It is important to note that the data types can be either continuous or categorical. Lastly, Table 3 lists the statistical summary of the collected dataset samples. These features include cardiac disease such as age, BMI, chest pain, shortness of breath, smoking, and so on, which mainly causes the hospitalization of cardiac patients.

4. The Proposed Real-Time Monitoring System

To enable mobility of cardiac patients and improve their life quality, herein we propose a tracking and supervision real-time system that monitors the vital signs of a cardiac patient. The system analyzes the received data from the patients and then performs machine learning operations to classify the status of the patient whether it is stable, unstable non-critical, or unstable critical, illustrated in Figure 1. In case of a stable state, the patient should be advised to stay at home and maintain monitoring, while in the case of an unstable state, the patient should be taken to the nearest associated healthcare facility or hospital to receive the necessary medical therapy at the appropriate time. In the event of an emergency, the system sends out alert signals to indicate that medical assistance is urgently required. Patients in the ICU require proper monitoring of their blood circulatory and respiratory systems since these are time-critical processes that must be monitored regularly and intensively. Therefore, this article proposes two machine learning approaches that can be employed to predict the status of cardiac patients, listed in the lower portion of Table 1. Next, the proposed models are discussed.

4.1. Developed ANN Model

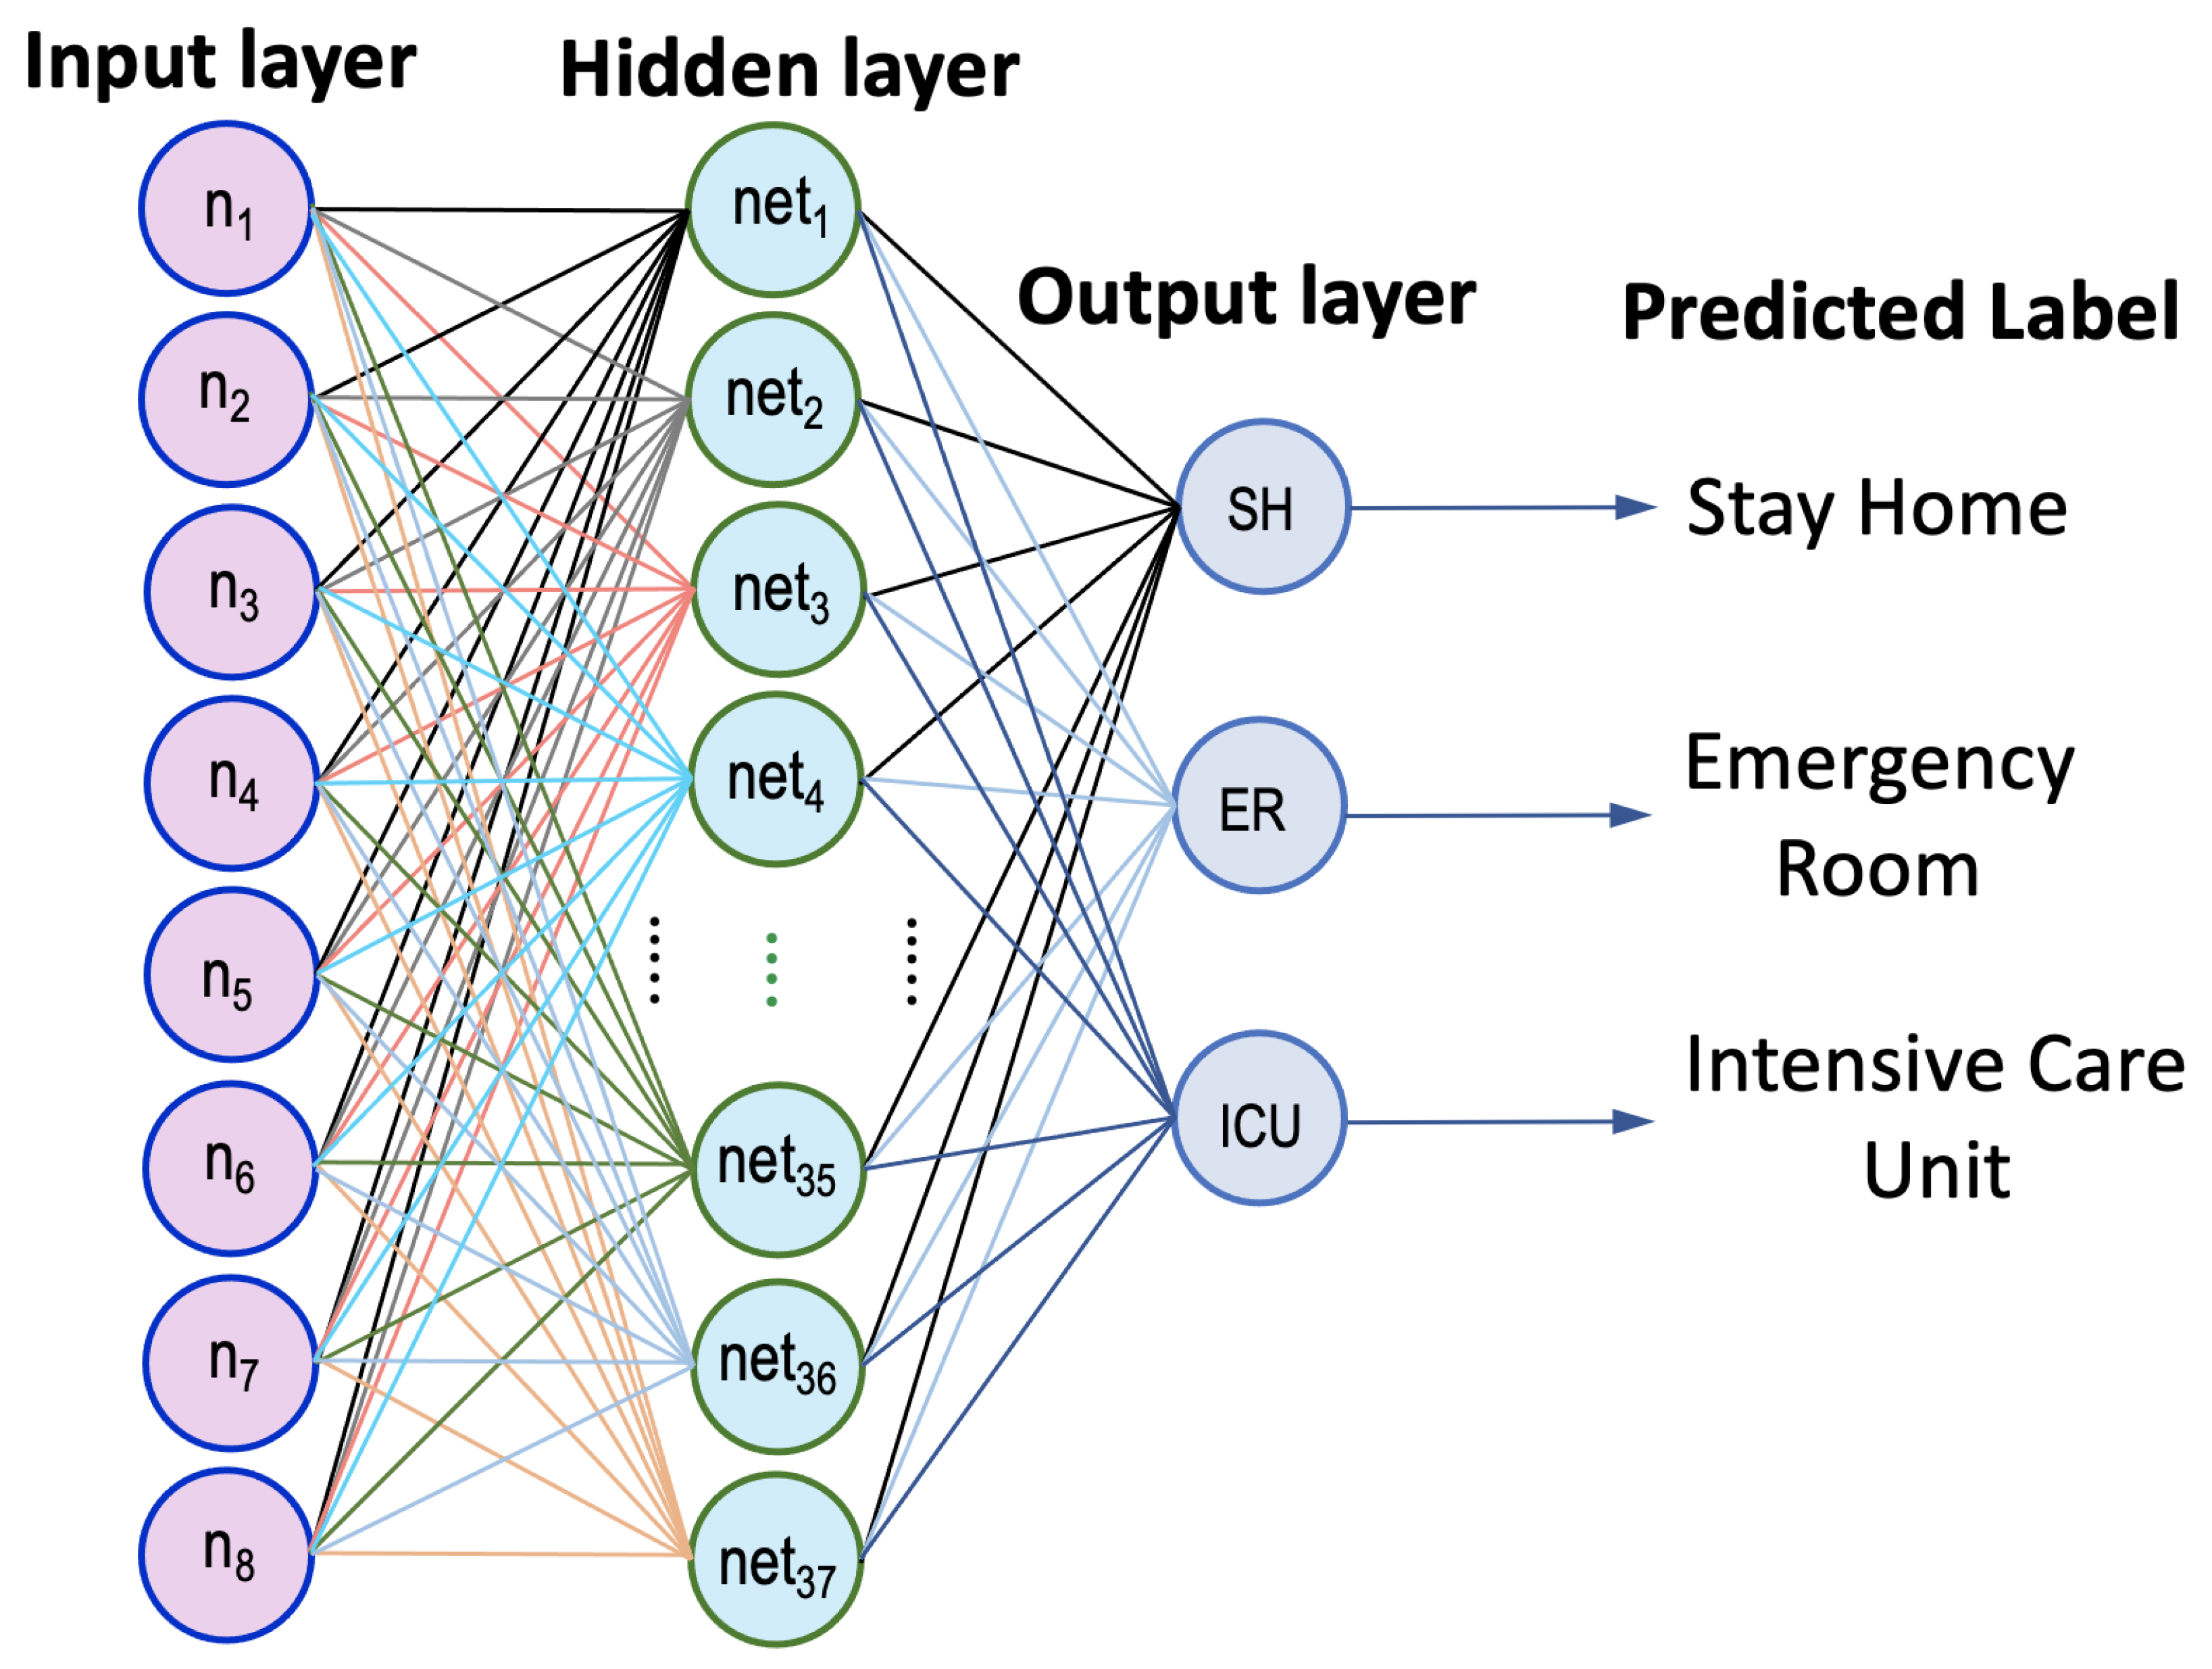
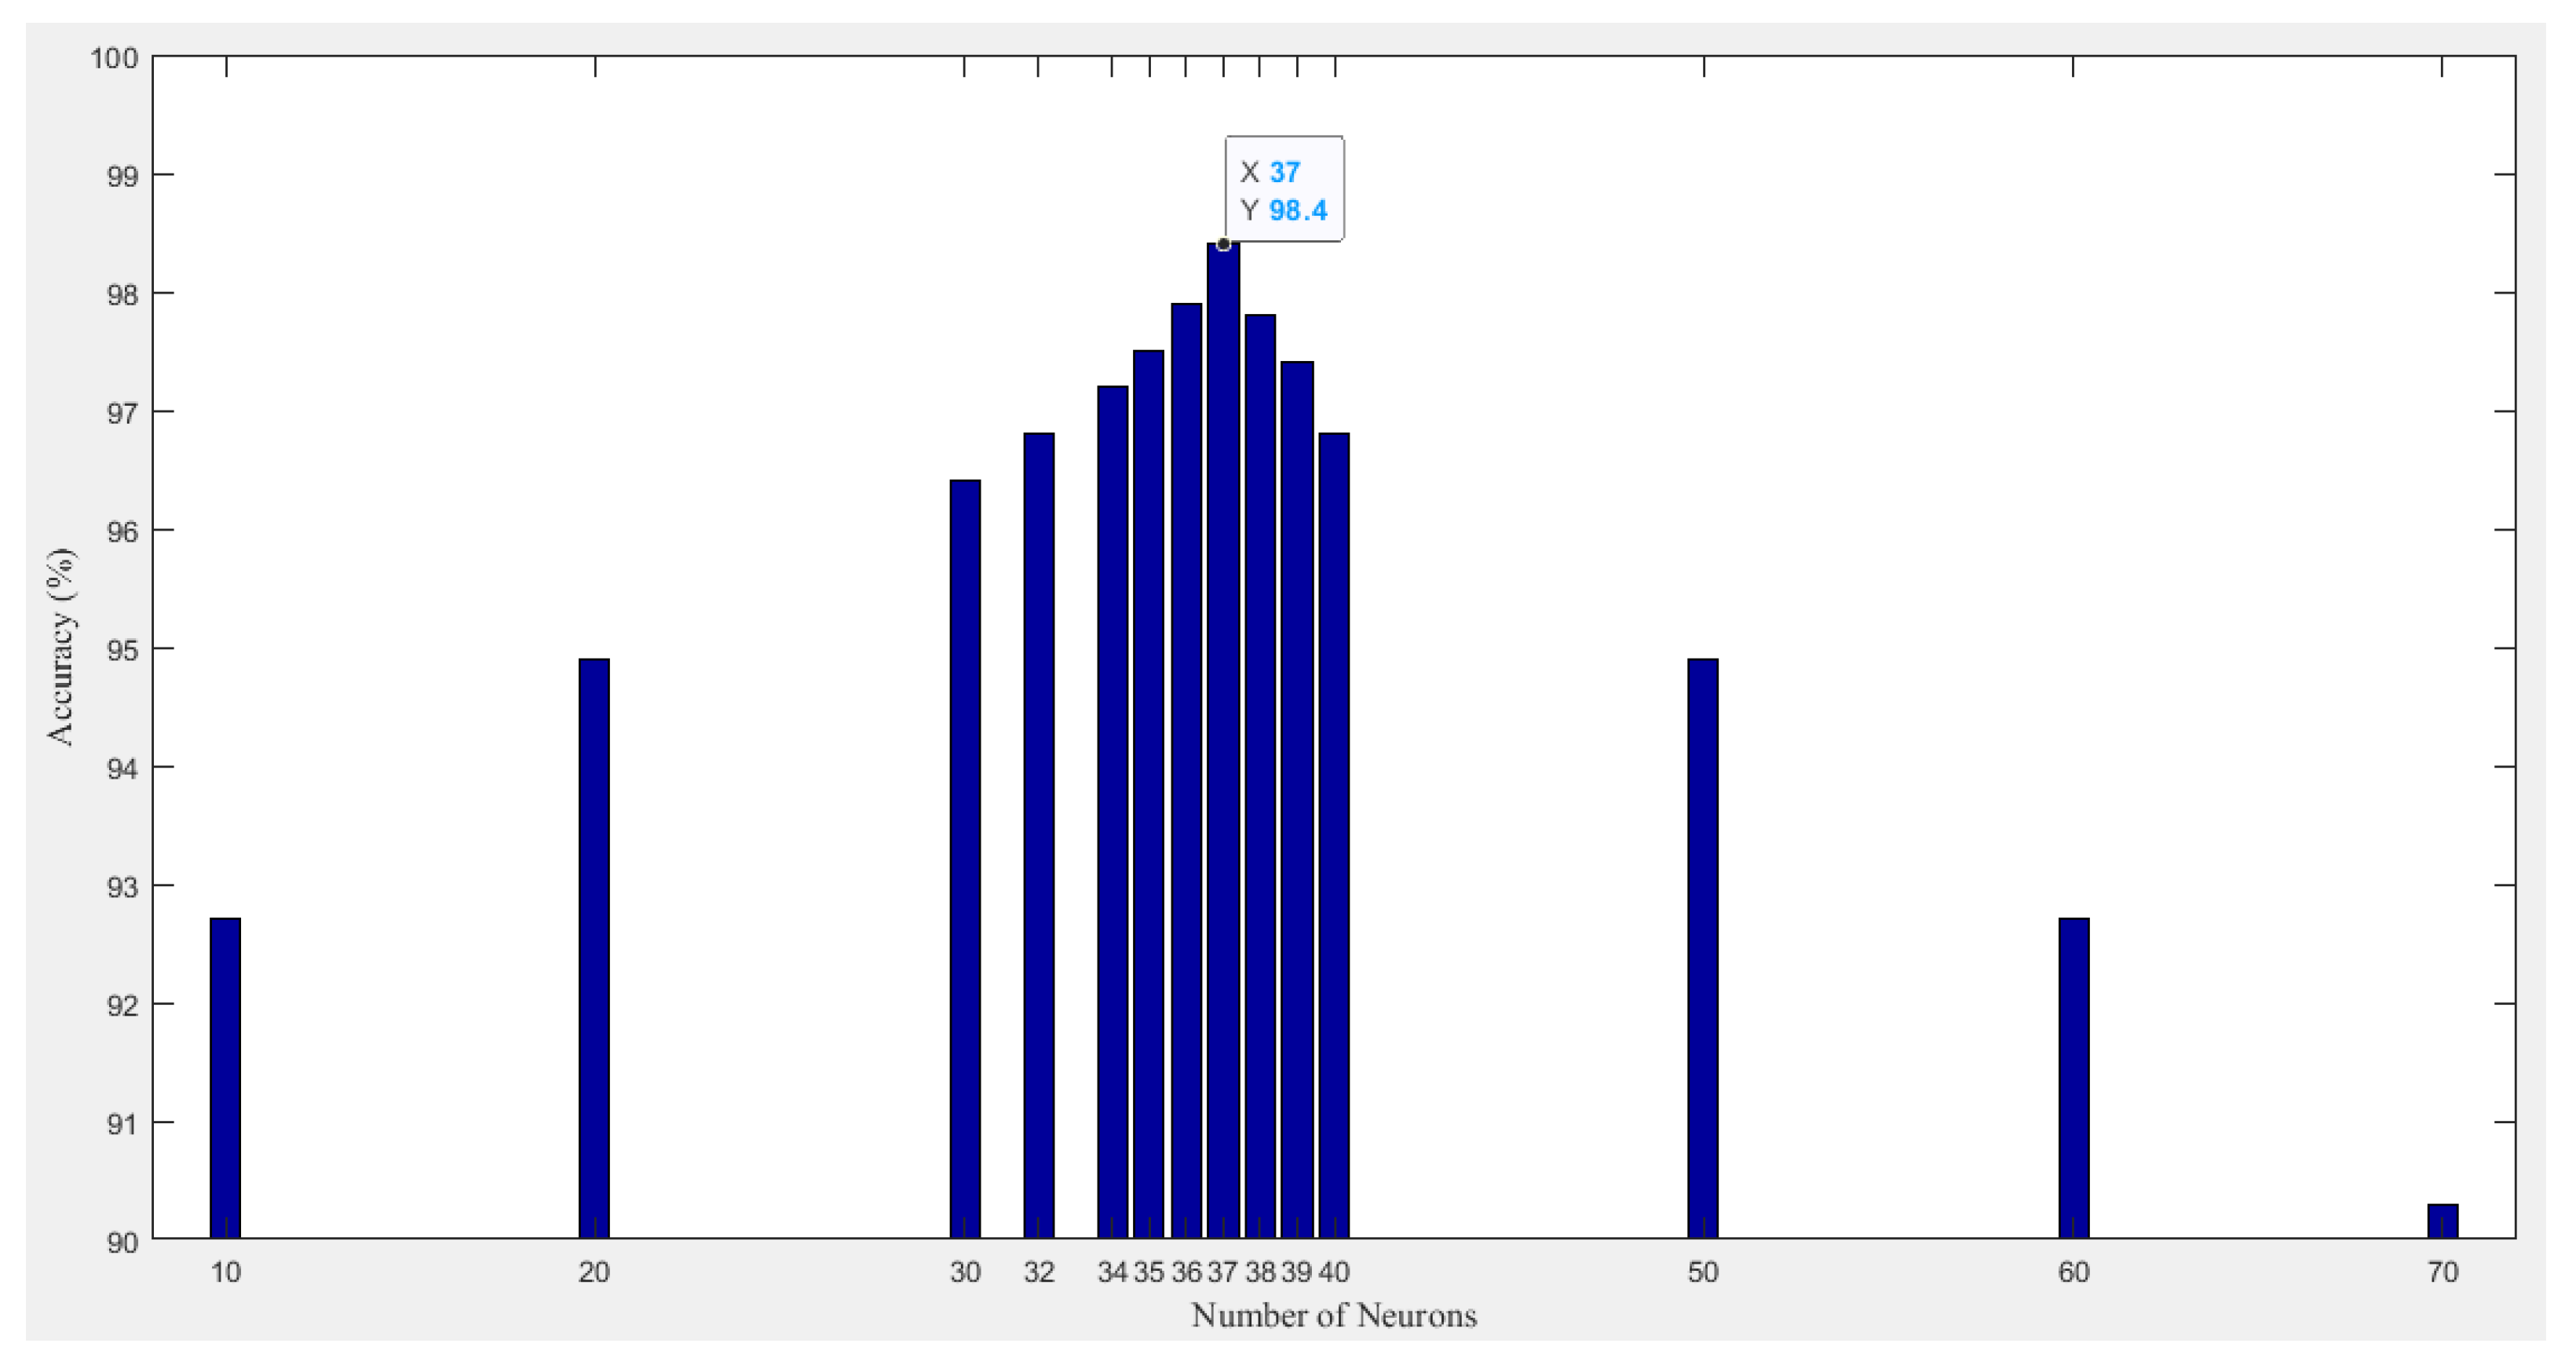
Here, neural networks are employed to predict the status of cardiac patients, as depicted in Figure 1. An artificial neural network (ANN) with one fully connected hidden layer and an output layer of three classes was utilized. The hidden layer is a single layer since the inputs of the network are extracted features that do not require deep analysis to be trained for making correct decisions and therefore the structure of the developed ANN is not complicated. For model training and performance evaluation, Stochastic Gradient Decent with Momentum (SGDM) of 0.9 provided the best fine-tuning, the learning rate was set to be 0.001, and maximum epochs of 60 were configured for the model to terminate the training. The training time per iteration is 14 s, and thus the performance was found to incur 829 s for completing all epochs, which confirms the straightforward training process of the developed ANN classifier. However, we could not determine how to construct an optimized number of neurons in the hidden layer, so modeling the dataset required intensive examinations of different design structures. Thus, a trial and error technique was used to determine the required number of neurons in the hidden layer. We started with from 10 to 70 neurons, and it turned out that the accurate solution can be realized when the number of neurons in the hidden layer equals 37, illustrated in Figure 2. As shown in Figure 3, we conducted various setups of the loss function for model fine-tuning via applying adaptive optimizers like Adam, SGD with momentum, etc., associated with increasing the number of neurons to more than 37; however, we found out that does not improve the accuracy ( 98.4 % was the best achieved accuracy), and instead, it becomes worse.
Additionally, the developed ANN model, containing 37 neurons, is specifically designed for a task-oriented dataset involving cardiac patients. Therefore, if the dataset type changes, the ANN classifier must be retrained to adapt and optimize for the new data. For this reason, we switched to come up with a more fine-grained model that can deliver higher prediction accuracy while incurring less intensive computational complexity, i.e., a lightweight model. Next, we discuss the proposed encoding-based machine learning model.

4.2. Feature Selection Based on PCA Algorithm

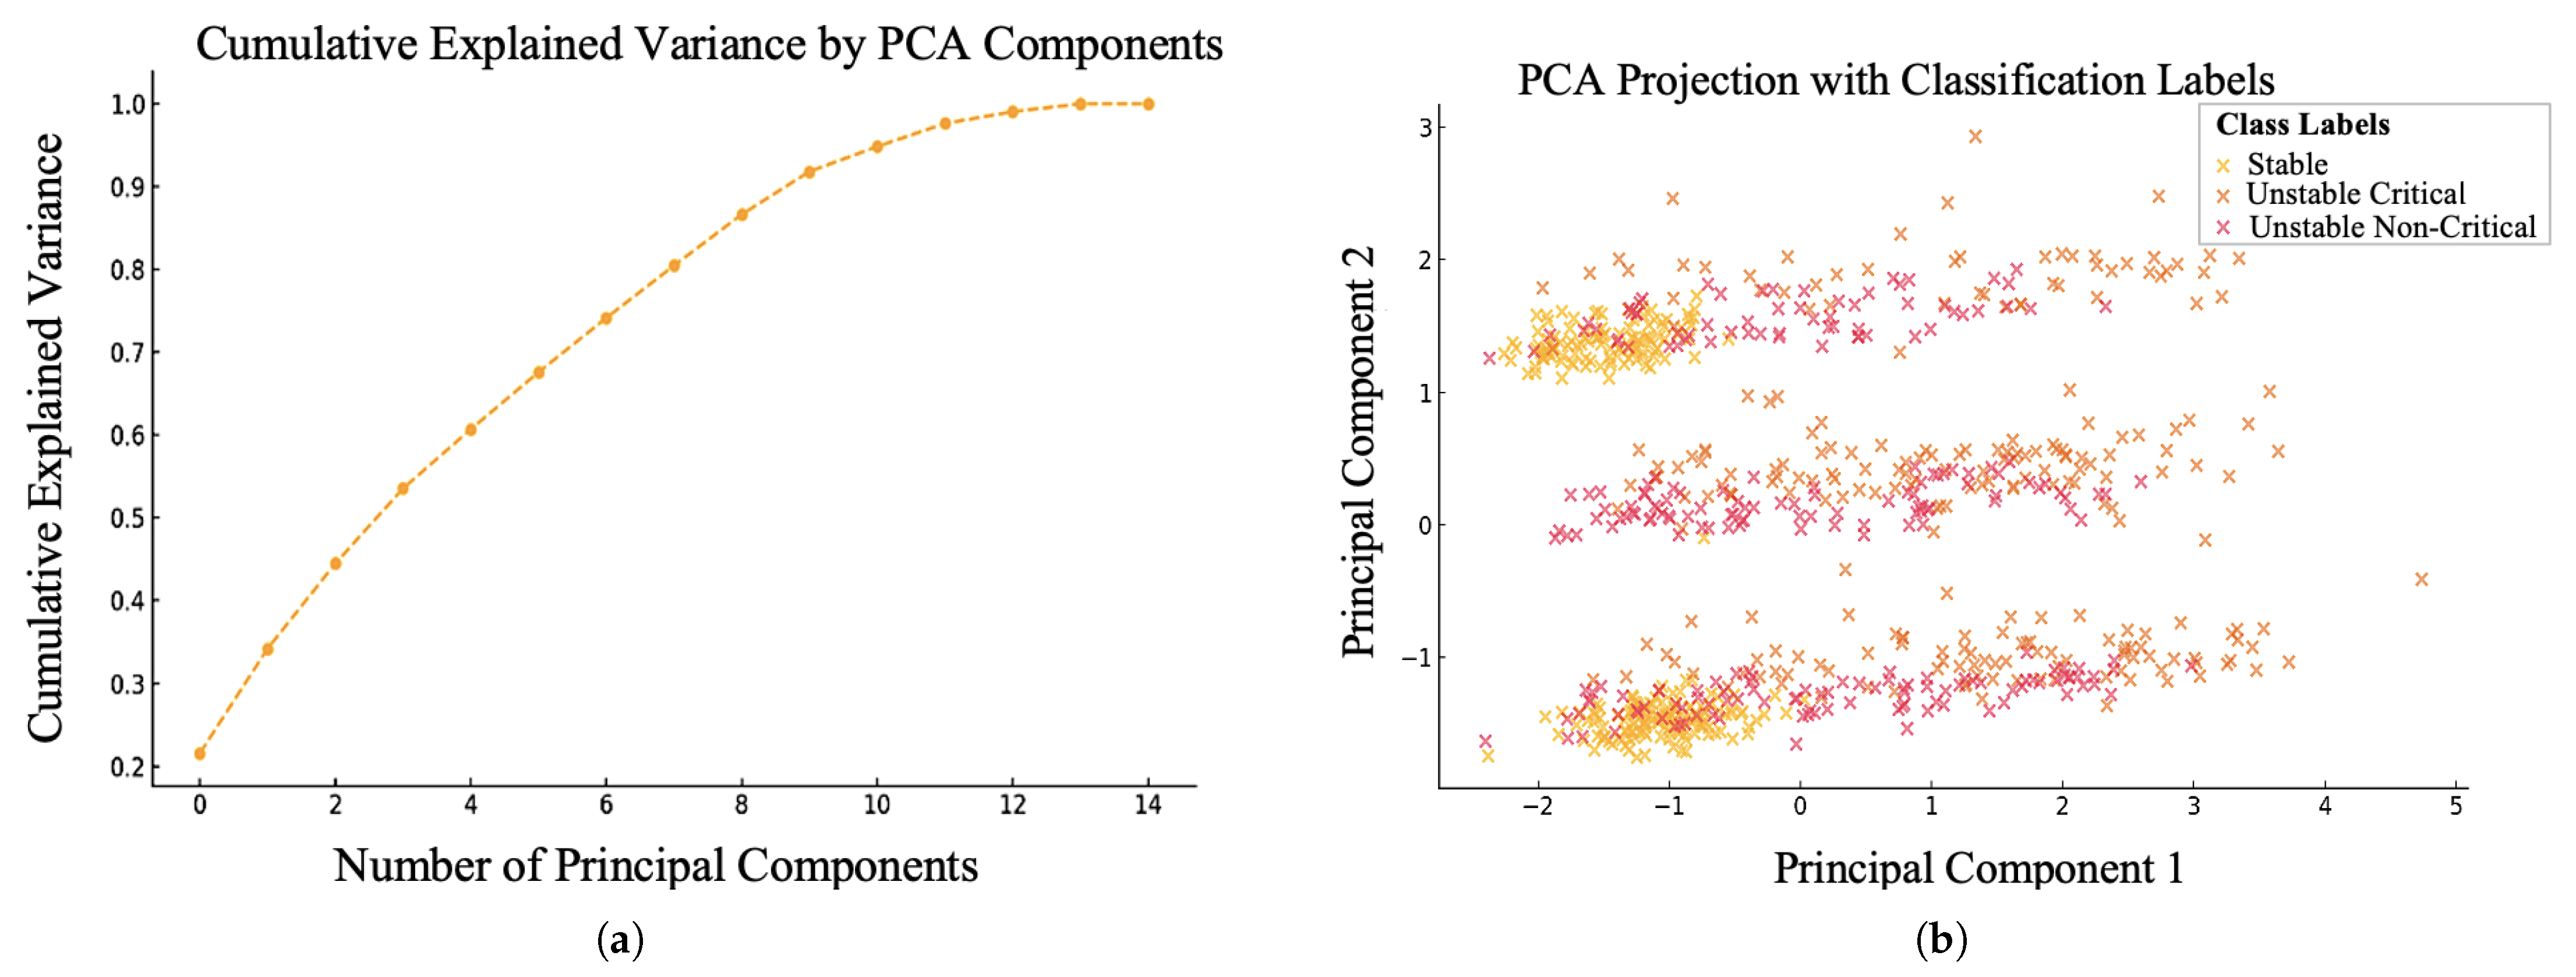
We primarily employed the Principal Component Analysis (PCA) algorithm to reduce the dimensionality of our dataset. PCA helps prioritize the most crucial features that contribute to the variance in the data. This process not only simplifies the dataset but also removes redundant or less significant features, allowing the model to learn more effectively from the available data. The statistical analysis of applying the PCA as a preprocessing step assisted in making the proposed encoding-based algorithm more robust, flexible, and applicable to various datasets. The analysis presented in Figure 4a revealed that the PCA retained 12 principal components, which together explained 80% of the variance in the dataset. Consequently, only the most informative components were considered, leading to significant improvements in classification outcomes for cardiac patients. Notably, the features contributing most significantly to the PCA components were found to be SPO2, GC, RR, HR, blood pressure (including diastolic and systolic (Dia. and Sys.)), CP, and SoB.
On the other hand, the clustering shown in Figure 4b demonstrates that the first two principal components (PC1 and PC2) effectively capture the key variations in the dataset concerning criticality and stability. Specifically, PC1 represents primary indicators of stability and criticality, such as HR and blood pressure (both systolic and diastolic). In contrast, PC2 reflects secondary factors, including SPO2, GC, and RR. As seen in Figure 4b, these five vital signs are insufficient to accurately differentiate the model classes. Therefore, we encoded the CP and SoB, along with the previously determined vital signs, to realize outstanding classification accuracy, and we discuss it further in the next section.

4.3. Proposed Encoding-Based Machine Learning Model

ML models evaluate a patient’s risk for heart attack, stroke, or sudden cardiac arrest by analyzing risk factors such as age, chest pain, and shortness of breath. This assessment helps in identifying heart-related issues in real-time and provides preventive care. In the proposed encoding-based model, the risk factors are encoded to calculate the risk score (RS) and vital score (VS), which represent the preprocessing for the feature extraction process. The calculation of the risk factor score is performed based on encoding two features (chest pain and shortness of breath) that have high priority for being important symptoms as listed in Table 4. However, this is due to applying the PCA algorithm for providing initial preprocessing, demonstrating that only the CP and SoB have a strong influence on impacting the model performance. Hence, we only considered these two crucial risk factors in the proposed encoding-based algorithm. It can be seen from Table 4, for instance, when R S is equal to 0, this implies that the patient does not have an issue with these signs, whereas R S = 1 indicates that the patient is suffering from shortness of breath. When R S = 3 , then the patient has both chest pain (CP) and shortness of breath (SoB). Therefore, they are encoded with two bits ( b 0 and b 1 ), which are equivalent to SoB and CP, where CP represents the most significant bit (MSB = b 1 ) and SoB represents the least significant bit (LSB = b 0 ). The values of R S are then encoded (steps 6 to 11 in the pseudo-algorithm) and stored in a lookup table (LUT1).
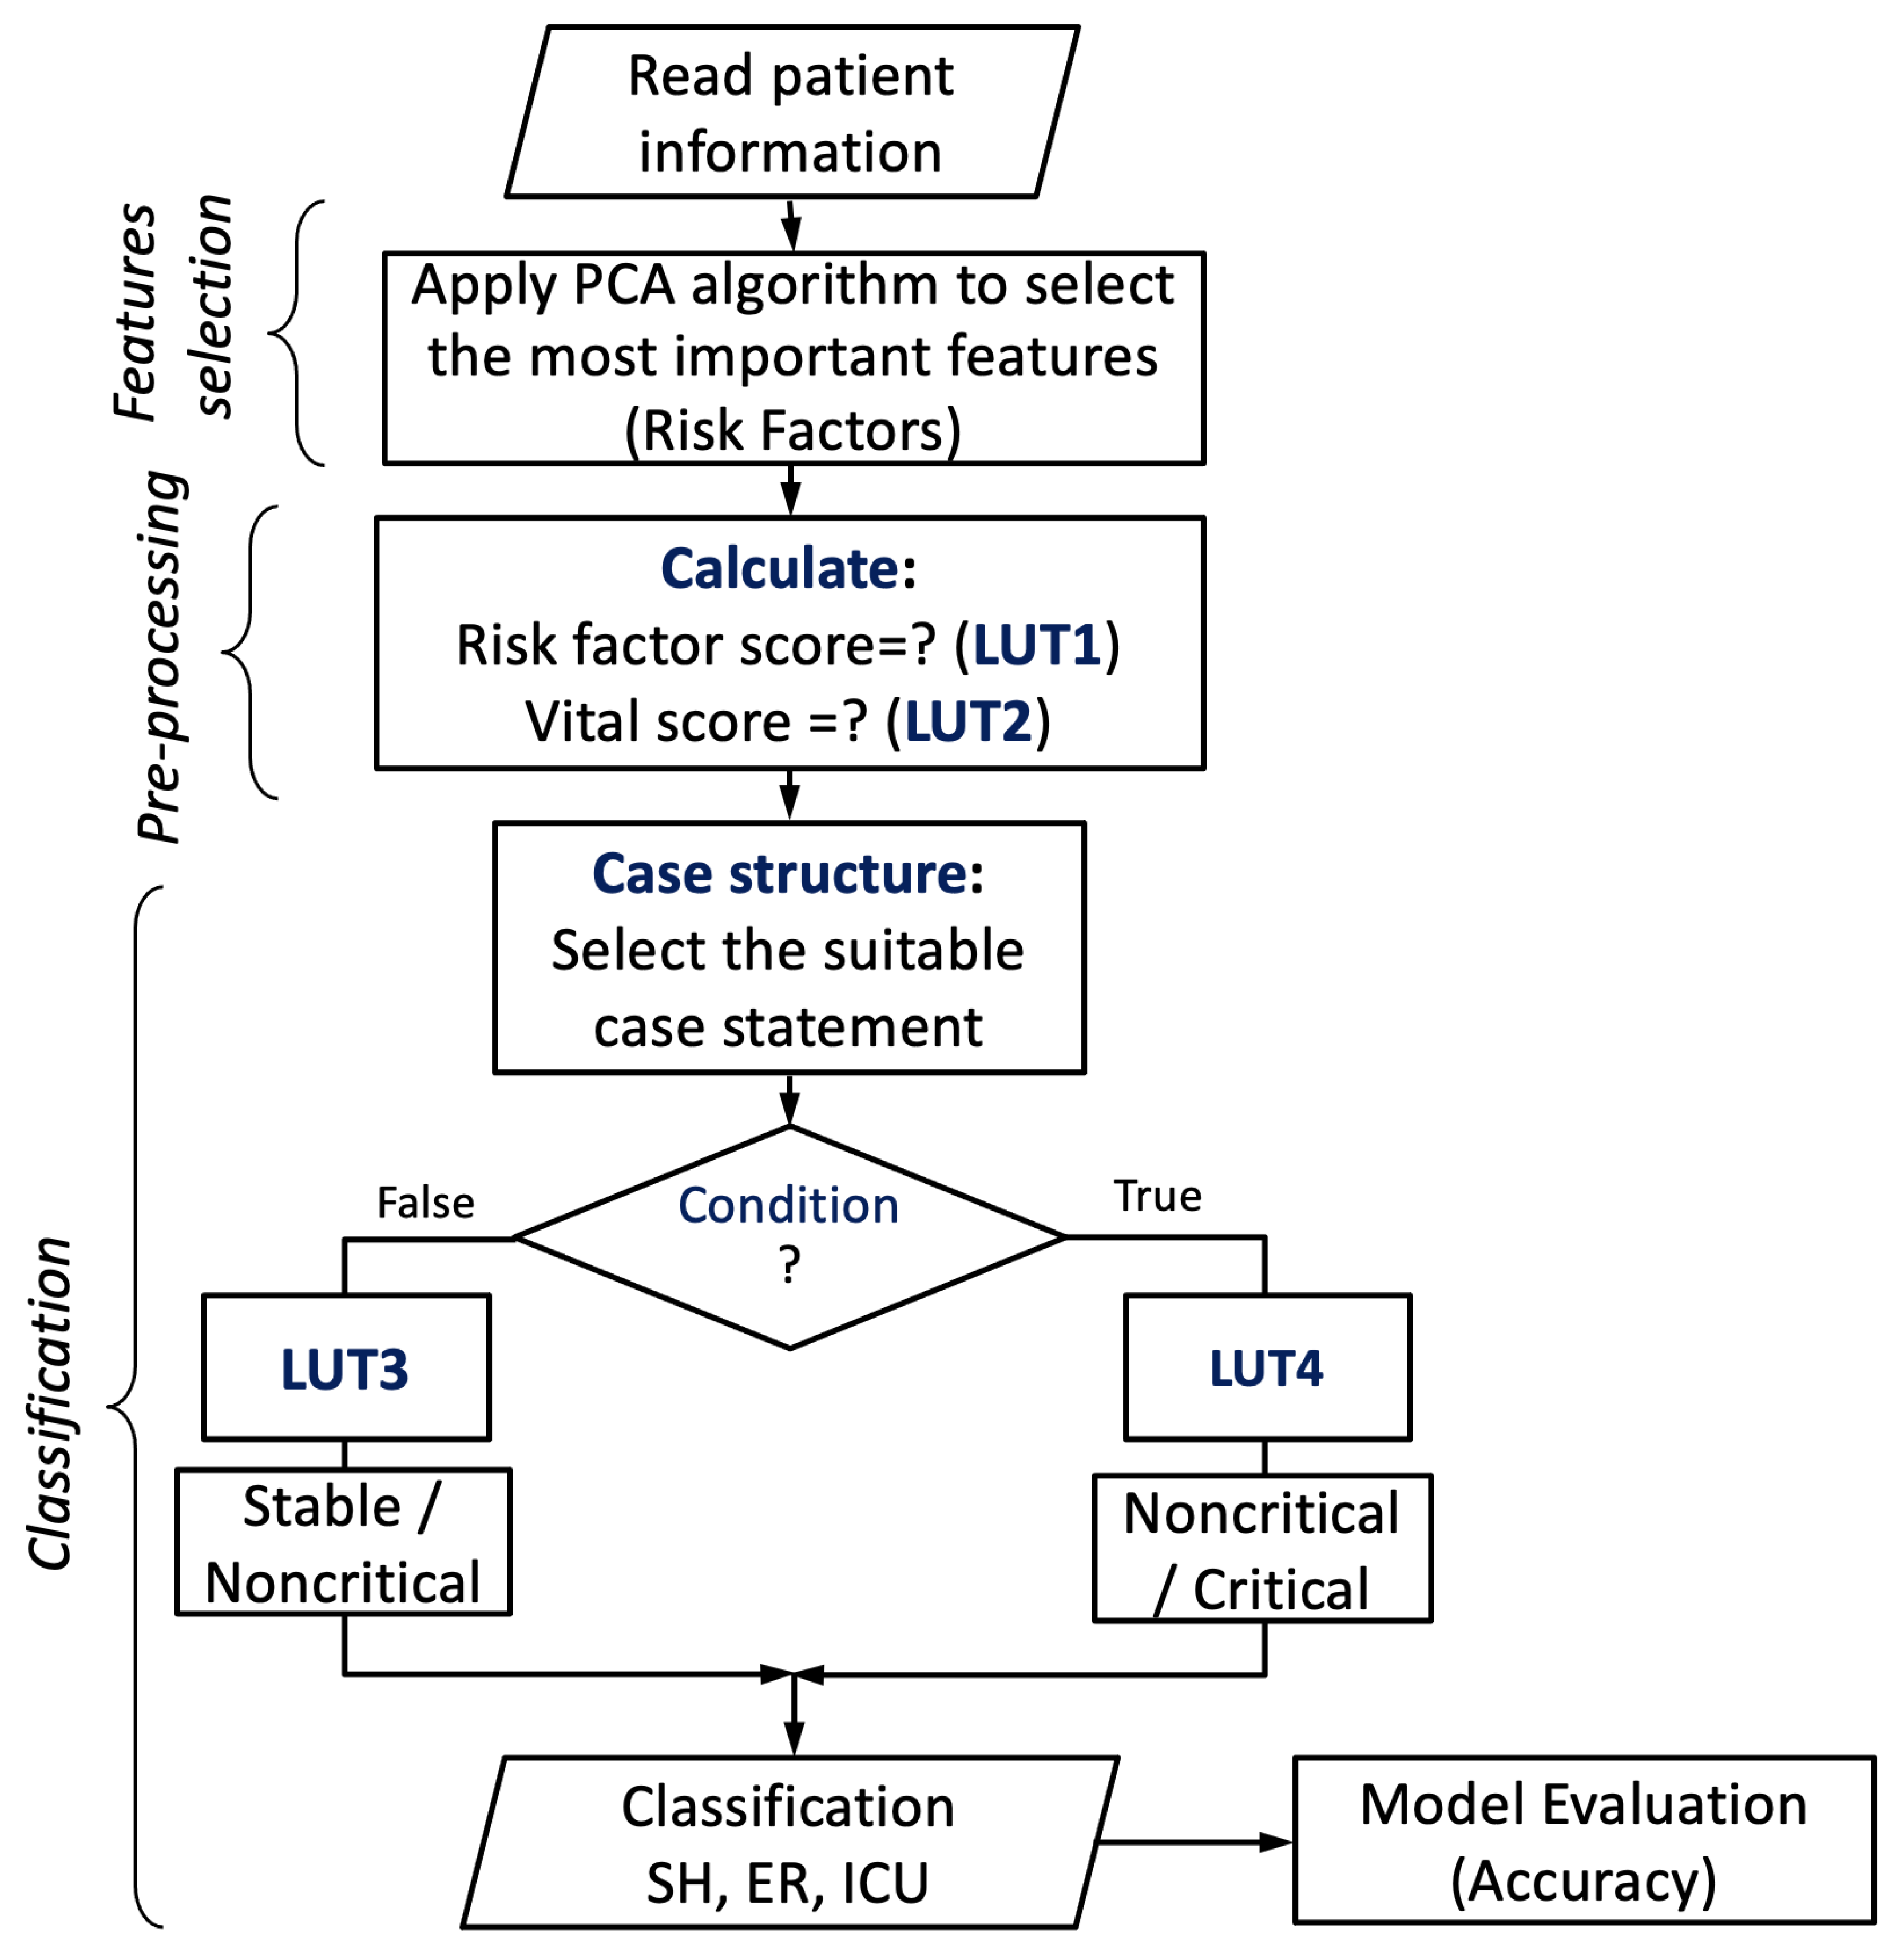
Vital score (VS), on the other hand, has been encoded based on the five most important vital signs, including Glasgow coma (GC), SPO2, systolic/diastolic blood pressure (BP), heart rate (HR), and respiratory rate (RR), which is equivalent to ( b 4 b 3 b 2 b 1 b 0 ), respectively. These vital signs have been considered the highest priority factors to guide labeling the output classes for the classification process. We represent each factor with a single bit; thus, five bits are needed for encoding the vital signs and calculating the value of V S , as illustrated in Algorithm 1 from step 12 to step 26. Afterward, the values of the vital score are stored in a lookup table (LUT2). The encoded values of both RS and VS are then fed to 32 case statements to predict the status of a cardiac patient. The output condition of the comparison process, along with the vital sign score, is then fed to a lookup table (LUT3/LUT4) to provide the predicted status of the patient, as illustrated in Figure 5. Because the output of the condition is a Boolean (false/true), 64 possible statements are stored in two LUTs (LUT3 and LUT4) with a capacity of 32 locations. These LUTs work in parallel with a control signal for read enable. The VS value (five bits) is used as the address lines for both LUTs, whereas the condition is inverted and connected to the read enable (RE) signal of LUT3 and directly connected to the RE signal of LUT4. Thus, if the condition becomes false, then the status stored at the location indicated by the VS value of LUT3 goes to the output to be the predicted status. Otherwise, the statement in the equivalent location of LUT4 passes to the output.
To further understand the working mechanism of the encoding-based model, we provide a case study that takes an example of three different cardiac patients, listed in Table 5 as follows:
Algorithm 1 Pseudocode algorithm of the encoding-based model
  1:
procedure MyProcedure
  2:
    for  i 1 to N do
  3:
        Read patient information
  4:
        Applay the PCA module to select the most important features (Risk Factors)
  5:
        Calculate:
Risk Score (RS)=? (LUT1); As follows:
  6:
        if ( C h e s t p a i n = = Y e s ) then CP =1
  7:
           Else  CP = 0
  8:
        end if
  9:
        if ( S h o r t n e s s o f b r e a t h = = Y e s ) then SoB =1
10:
           Else  SoB = 0
11:
        end if
Vital Score (VS)=? (LUT2); As follows:
12:
        if ( C o m a S c a l e < 13 ) then GC =1
13:
           Else  GC = 0
14:
        end if
15:
        if ( S P O 2 < 94 % ) then SPO2 =1
16:
           Else  SPO2 = 0
17:
        end if
18:
        if ( S y s t o l i c < 100 OR S y s t o l i c > 140 ) OR ( D i a s t o l i c > 90 OR D i a s t o l i c < 60 )
then Systolic/Diastolic (BP) = 1
19:
           Else  Systolic/Diastolic (BP) = 0
20:
        end if
21:
        if ( H R > 100 OR H R < 60 ) then HR =1
22:
           Else  HR = 0
23:
        end if
24:
        if ( R R < 12 OR R R > 16 ) then RR =1
25:
           Else  RR = 0
26:
        end if
27:
        Case structure:
28:
        Begin:
29:
        Select the suitable case statement (case 0 to 31)
30:
        if  ( c o n d i t i o n = = t r u e ) then
Status = Non-critical OR Critical
31:
        else
Status = Stable OR Non-critical
32:
        end if
33:
        Index = VS
34:
        if  ( c o n d i t i o n = = t r u e ) then
35:
           Read LUT4(index) for decision making
36:
        else
37:
           Read LUT3(index) for decision making
38:
        end if
39:
        Select the predicted status (SH, ER, ICU)
40:
        EndCase;
41:
        goto step3
42:
    end for
43:
end procedure
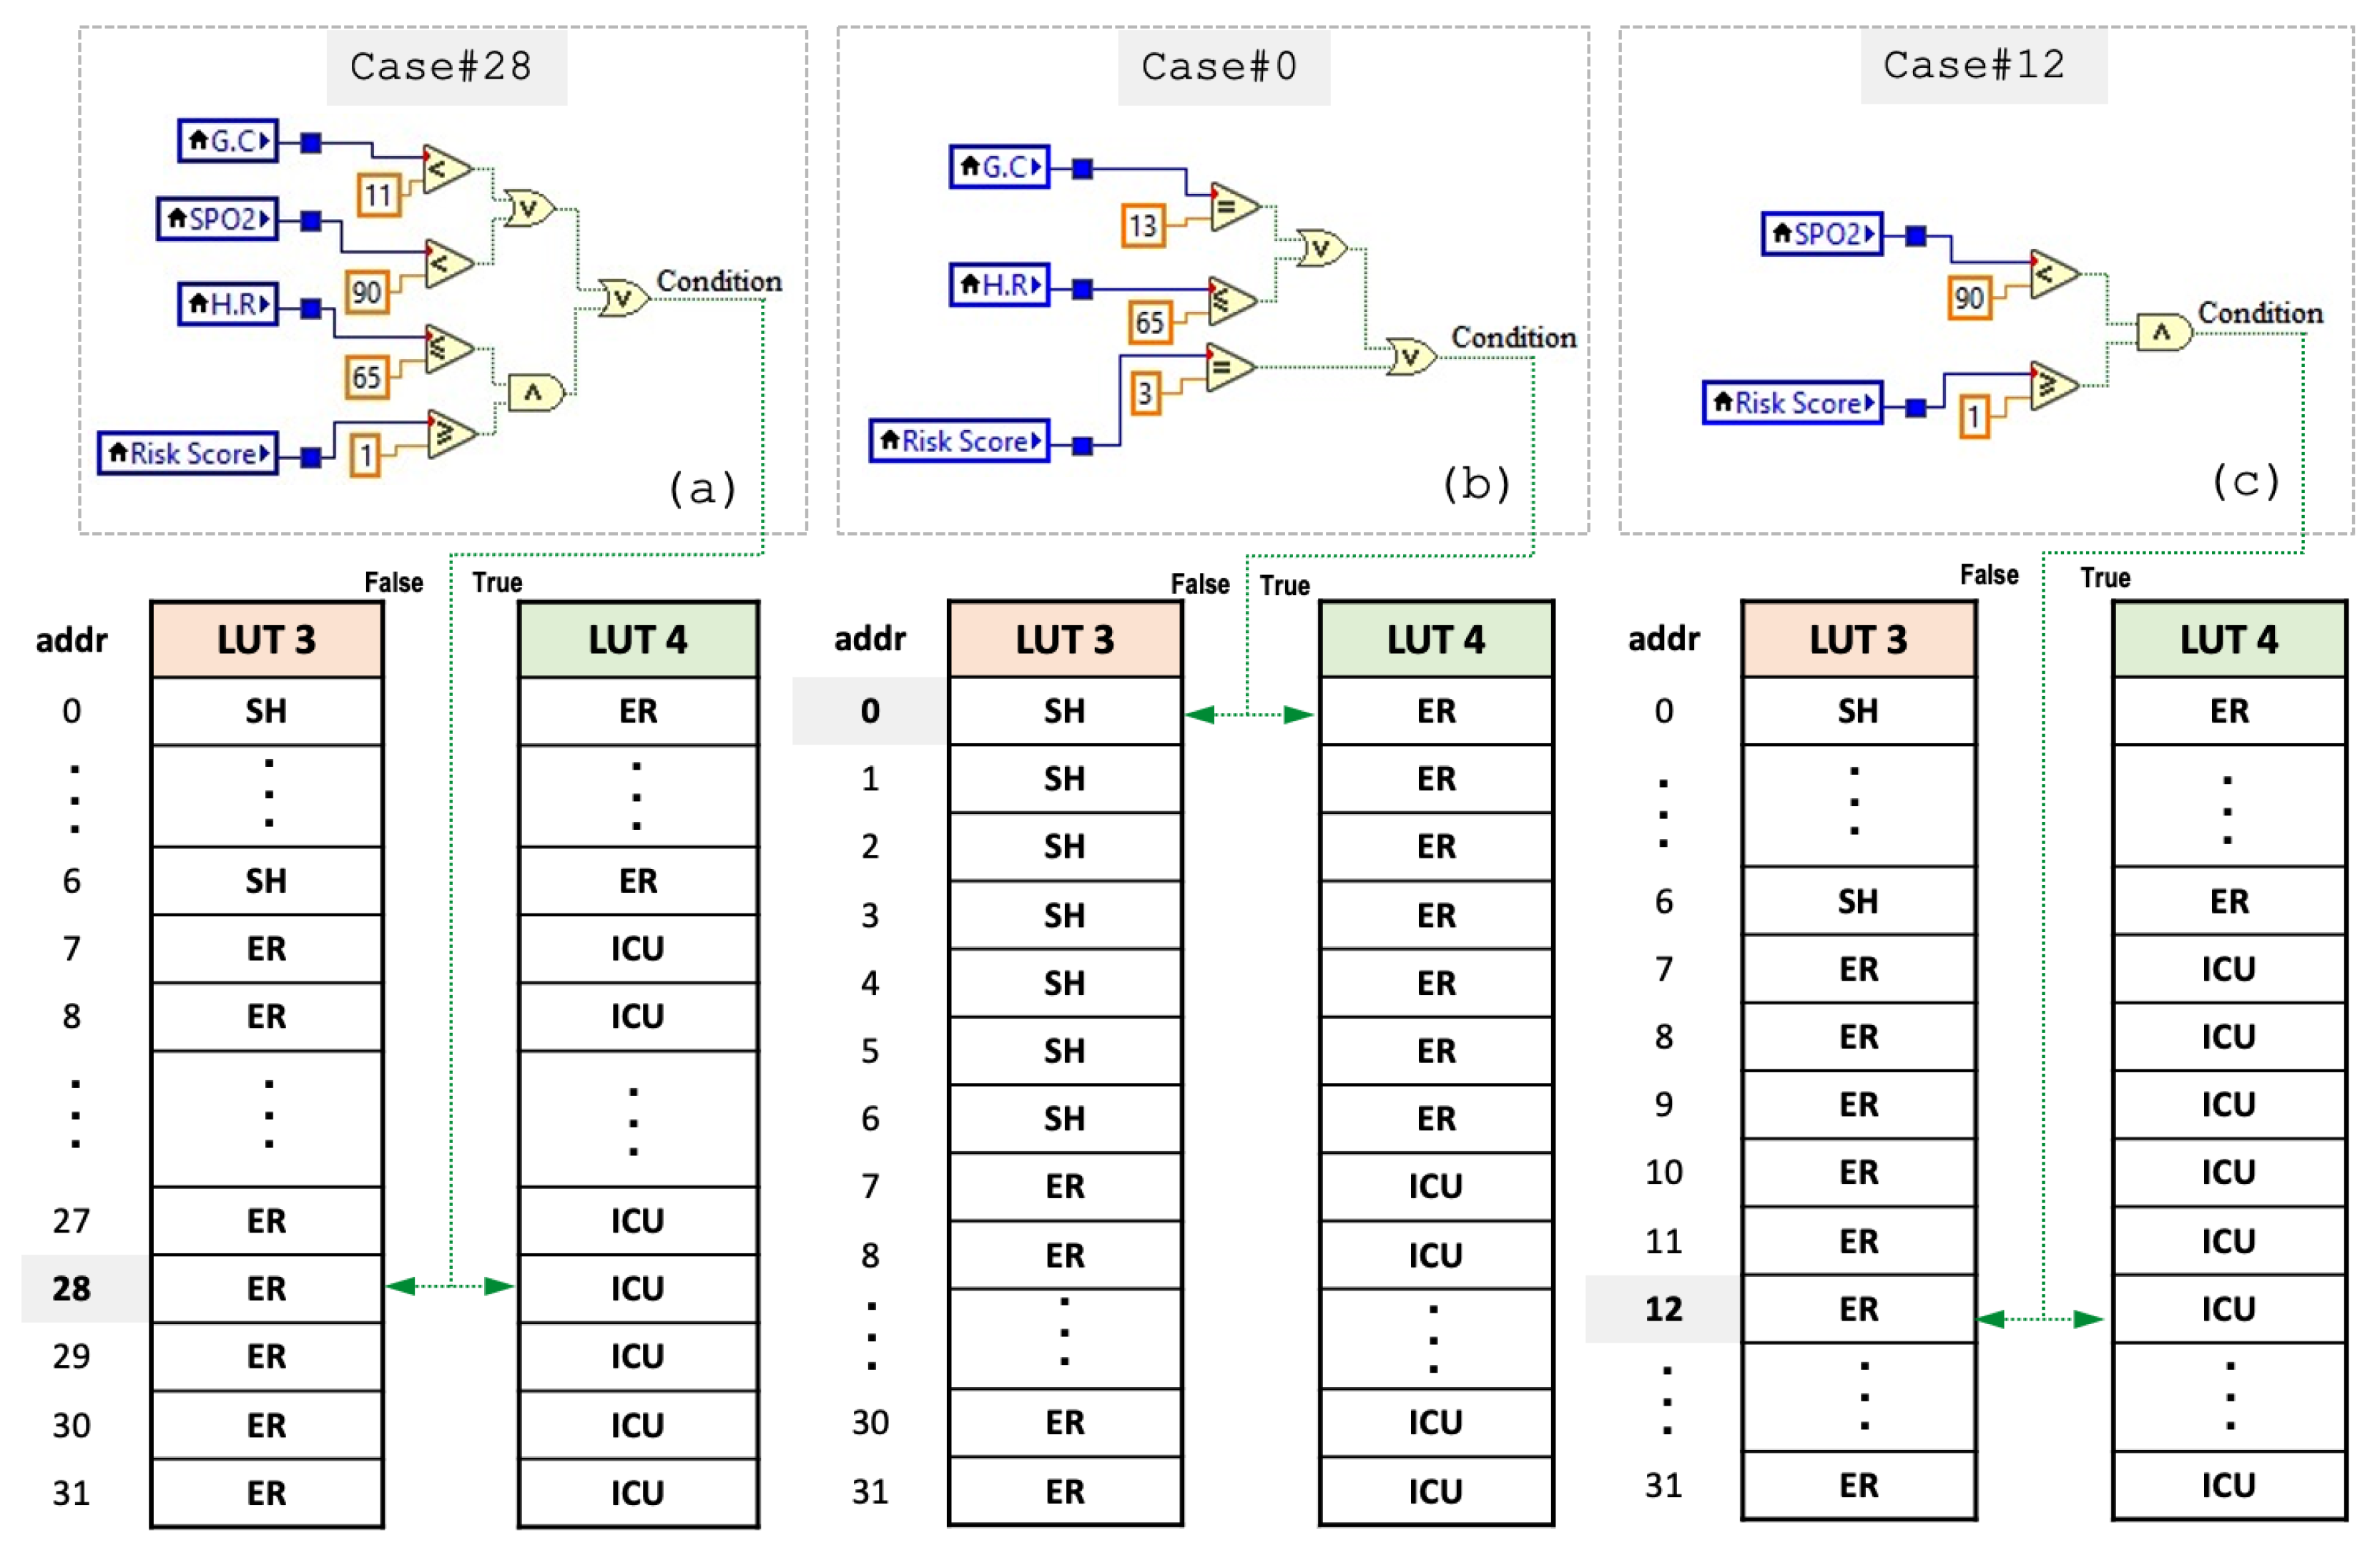
Person1: the values for R S and V S are first calculated based on the risk factors. As listed in Table 5, the patient suffers only chest pain from the risk factors, so RS = 2, while VS = 28 because the patient has GC, SPO2, and BP lower or higher than that set of the threshold; therefore, the bit value of these vital signs becomes ‘1’ (refer to Algorithm 1 for the equations that determine the threshold values of these signs). The values of HR and RR are within the continuous range for normal operations of vital signs, and thus they are both set to ‘0’. Putting it all together, ( b 4 b 3 b 2 b 1 b 0 ), it becomes (111002), which is equivalent to 28 in decimals, where the GC represents the MSB and RR represents LSB. The value of VS is then fed to the case structure to select the suitable statement, stable, non-critical, and critical. As seen in Figure 6a, the selected case is Case#28, so the status is either non-critical (emergency room) or critical (ICU). This can be determined based on both the value of the VS and the condition (false/true) of the selected case since they will then be used as the address and read enable (RE) to read one of the statuses stored in LUT3 when the condition is false or LUT4 when the condition is true (see Table 6). It is worth mentioning that each condition has two equivalent statuses. One is when the condition is false and stored in LUT3 at the location indexed by VS, while the others for the true condition are stored at the identical location in LUT4. Since the condition is true (see Figure 6a, row1 of Table 5 and Table 6), the predicted status is read from LUT4 and the model has classified it as critical, and thus both the actual and predicted status are the same. Note that Figure 7 illustrates the programming of Case#0 (default); however, there exist an additional 31 cases that are selected by the vital score.
Person2: the model first calculates the risk score and vital score, which are RS = 2 and VS = 0. The patient has chest pain, and thus CP = 1, while VS = 0 since all selected vital signs are normal. Thus, the proposed encoding-based model will forward this to Case#0. As can be found from Figure 6b, the condition is false because the RS is not equal to 3 and also none of the two inputs of the first OR gate is true. Hence, because the condition is false, then the status stored at location 0 is read from LUT3, which is stable. Notice that LUT3 and LUT4 store two states of status for each condition. This is due to the status of a patient rarely being a combination of stable or unstable critical at the same time; instead the possible combinations are (stable or unstable non-critical) and (unstable non-critical or unstable critical). This is mainly attributed to the state transition of a patient’s condition at any moment commonly moving from stable to unstable non-critical as it has to go through the state transition diagram, as illustrated in Figure 1, where the dashed line indicates the condition rarely happens.
Person3: the calculated values are RS = 1 and VS = 12, and thus Case#12 is selected and is depicted in Figure 6c. As can be seen, both comparisons must be true to drive the output condition to be true. Therefore, the condition is false and the status is classified according to the state stored in LUT3. From Figure 6, it can be noticed that the risk factor score has been involved in the processing of all case structures as a second factor. This is due to the fact that the medical information of a cardiac patient is correlated and dealing with it in a general processing method can lead to misclassifying the required medical therapy. Therefore, RS is encoded in all case statements to assist in breaking down the correlation, thereby increasing the correct prediction and thus improving the model’s overall accuracy. Notice that the considered observations (patients 1,2, and 3) in the case study are new data samples and the proposed approach did not see these samples in the training and testing, which confirms the model’s self-learning ability to provide correct predictions for unseen data samples.
Consequently, the proposed model can help medical doctors to be more confident about the decisions they make to provide exact medical therapy for cardiac patients. As depicted in Figure 1, earlier precise decision-making would strongly assist in preventing further complications that might lead to mortality. Furthermore, the proposed monitoring system can be applied to deliver seamless cardiac patient observation. For example, the status of a patient may move from unstable non-critical to unstable critical, and therefore, quick medical therapy becomes urgent to return the patient’s status to uncritical and then stable. Hence, approaches that deliver reliable and timely decision-making have been sought to accurately handle heart problems.

5. Experimental Setup and Results Evaluation

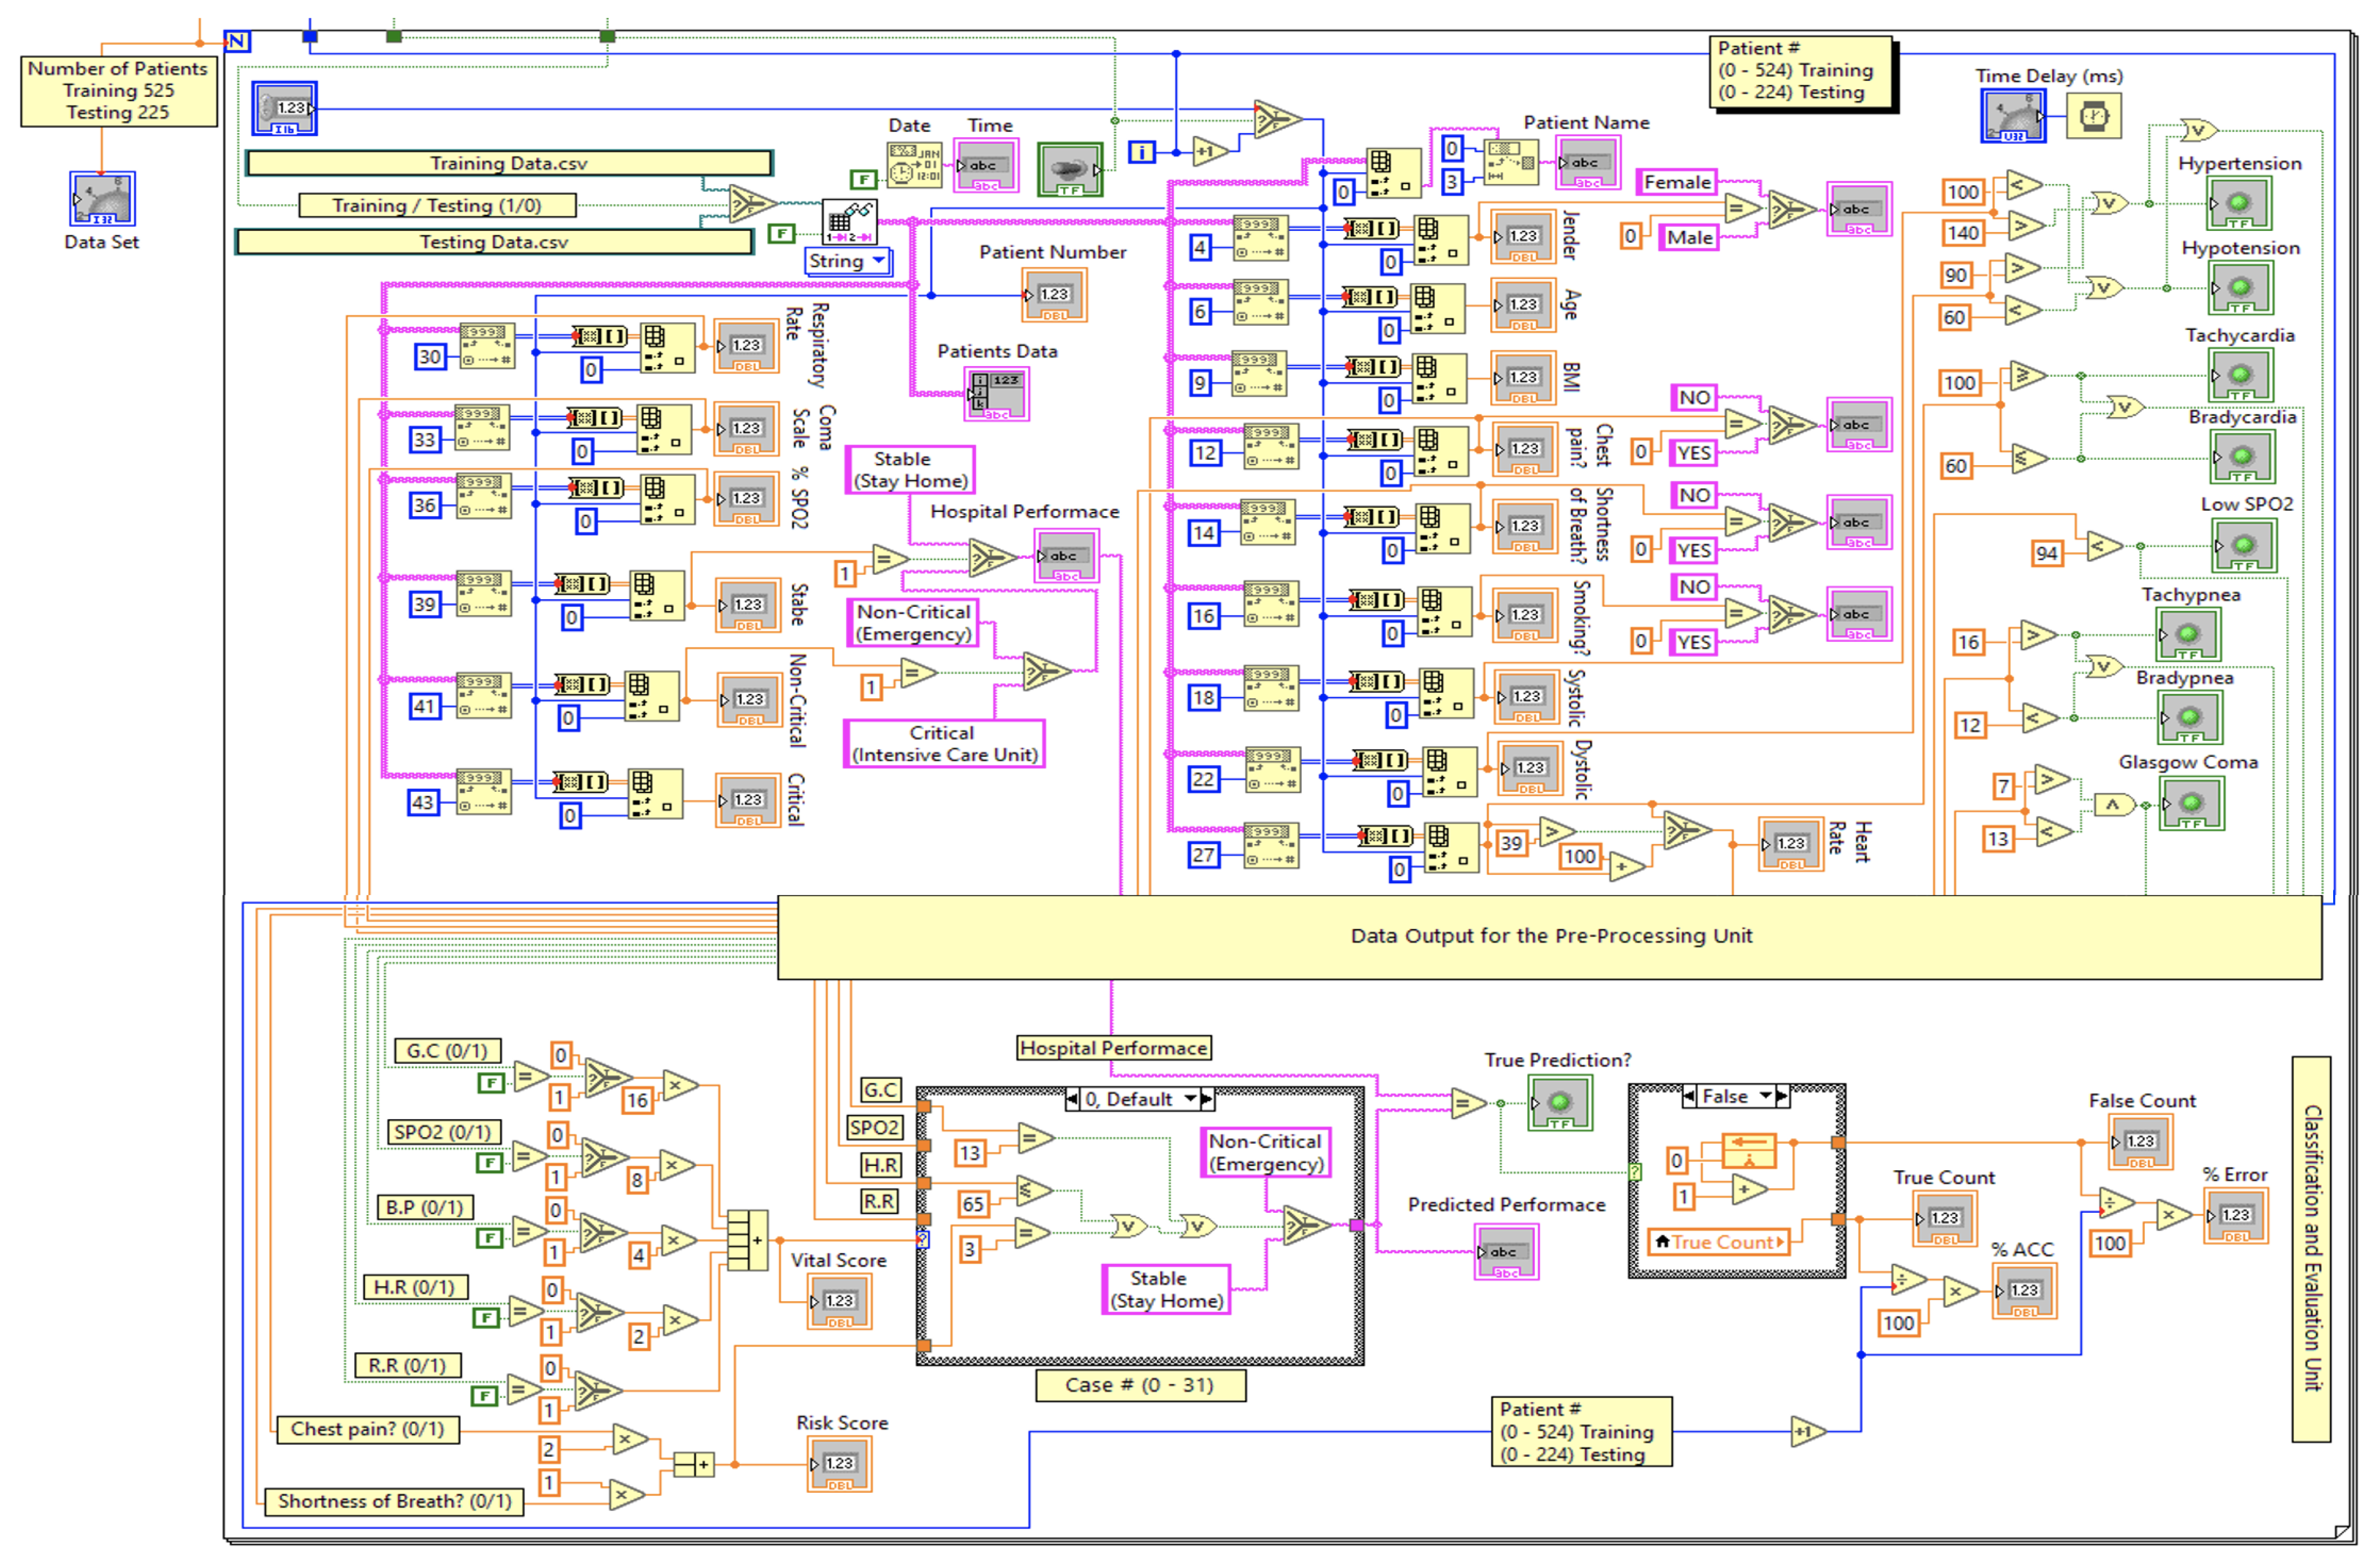
To build the ANN model, MATLAB R2022b is used, whereas the encoding-based model is constructed in LabVIEW 2017 since it provides a real-time and user-friendly GUI for monitoring. Additionally, the LabVIEW environment contains a comprehensive set of tools utilized for acquiring, analyzing, storing, and displaying data from real-time applications. Figure 7 depicts the main part of the designed graphical programming block diagram for the proposed encoding-based machine learning model. As can be seen, every feature is considered either as a nominal or continuous value. Then these values become encoded and compared to several threshold values to classify three classes of status and compute the accuracy accordingly.
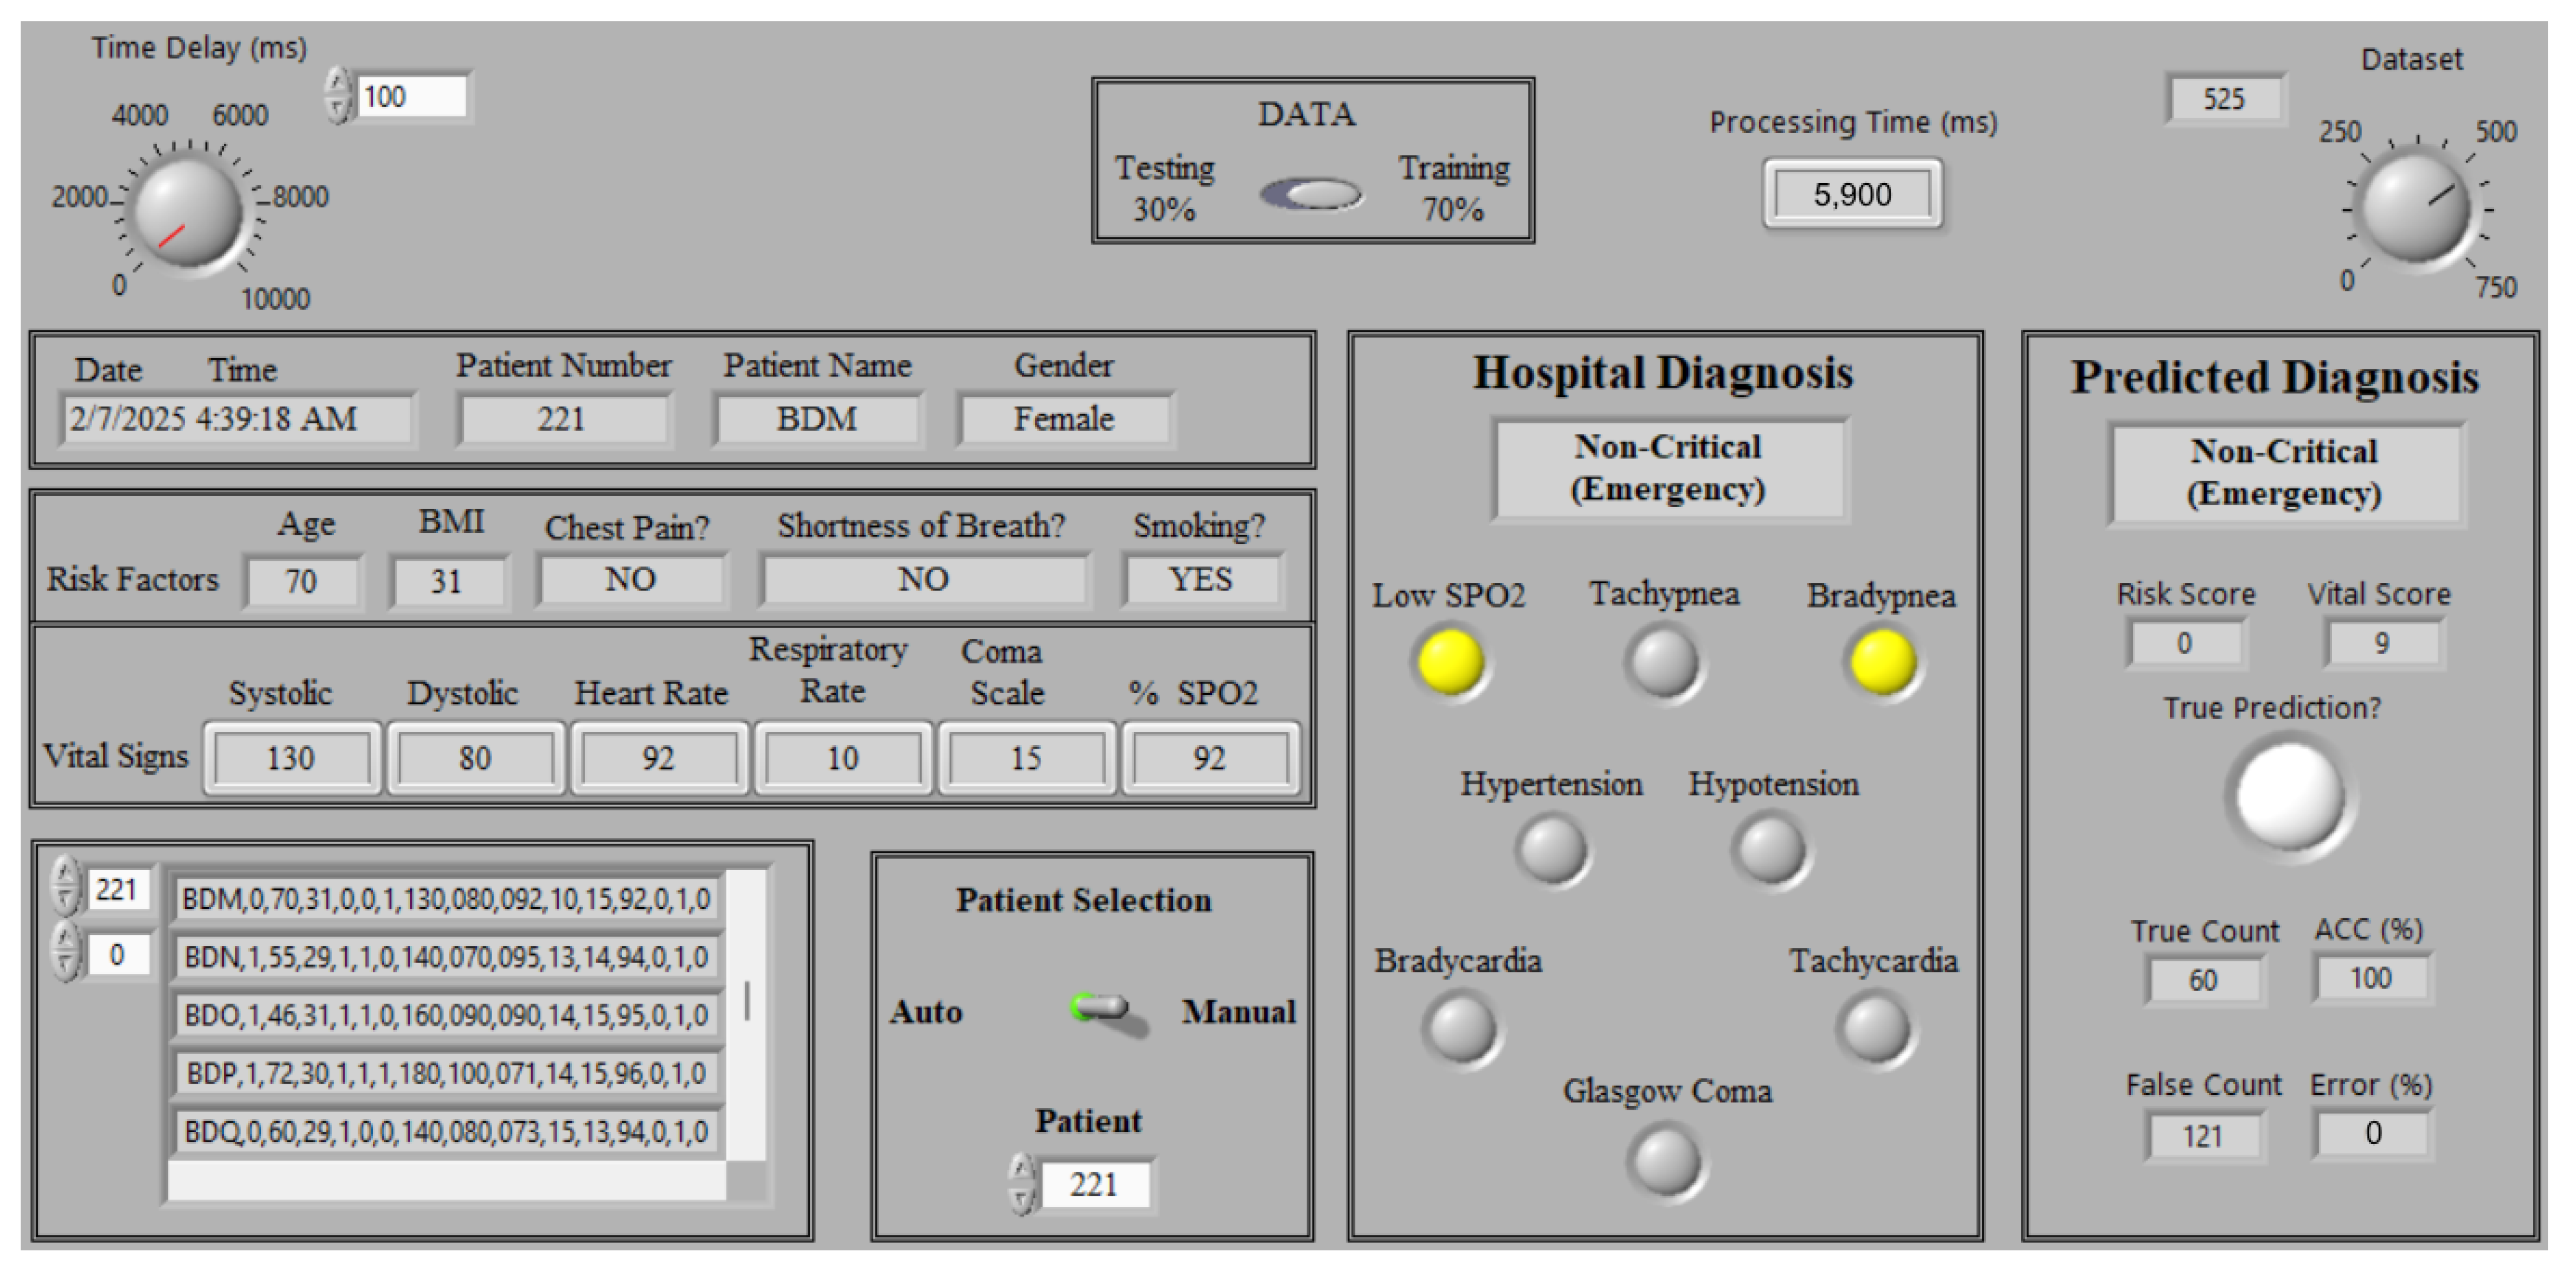
To evaluate the performance of the proposed model, the dataset is divided into two groups, training and testing, with 70 % of the data used for training and the remaining 30 % utilized for testing (225 patients). Then, K distinct learning trials were executed by partitioning the data into K groups using the K-fold cross-validation, where K is set to 10 ( 10 % of the testing data) in each testing cycle, resulting in the formation of 10 groups. Then, we run the presented encoding-based model and evaluate its accuracy. Figure 8 displays the testing window that shows the validation process of the encoding-based model. Clearly, it can be seen that both the actual (hospital) and predicted labels provide the same status, which indicates that the status of patient 136 (out of 225 for testing data) is unstable non-critical and the patient should be taken to the emergency room.

5.1. Performance Evaluation

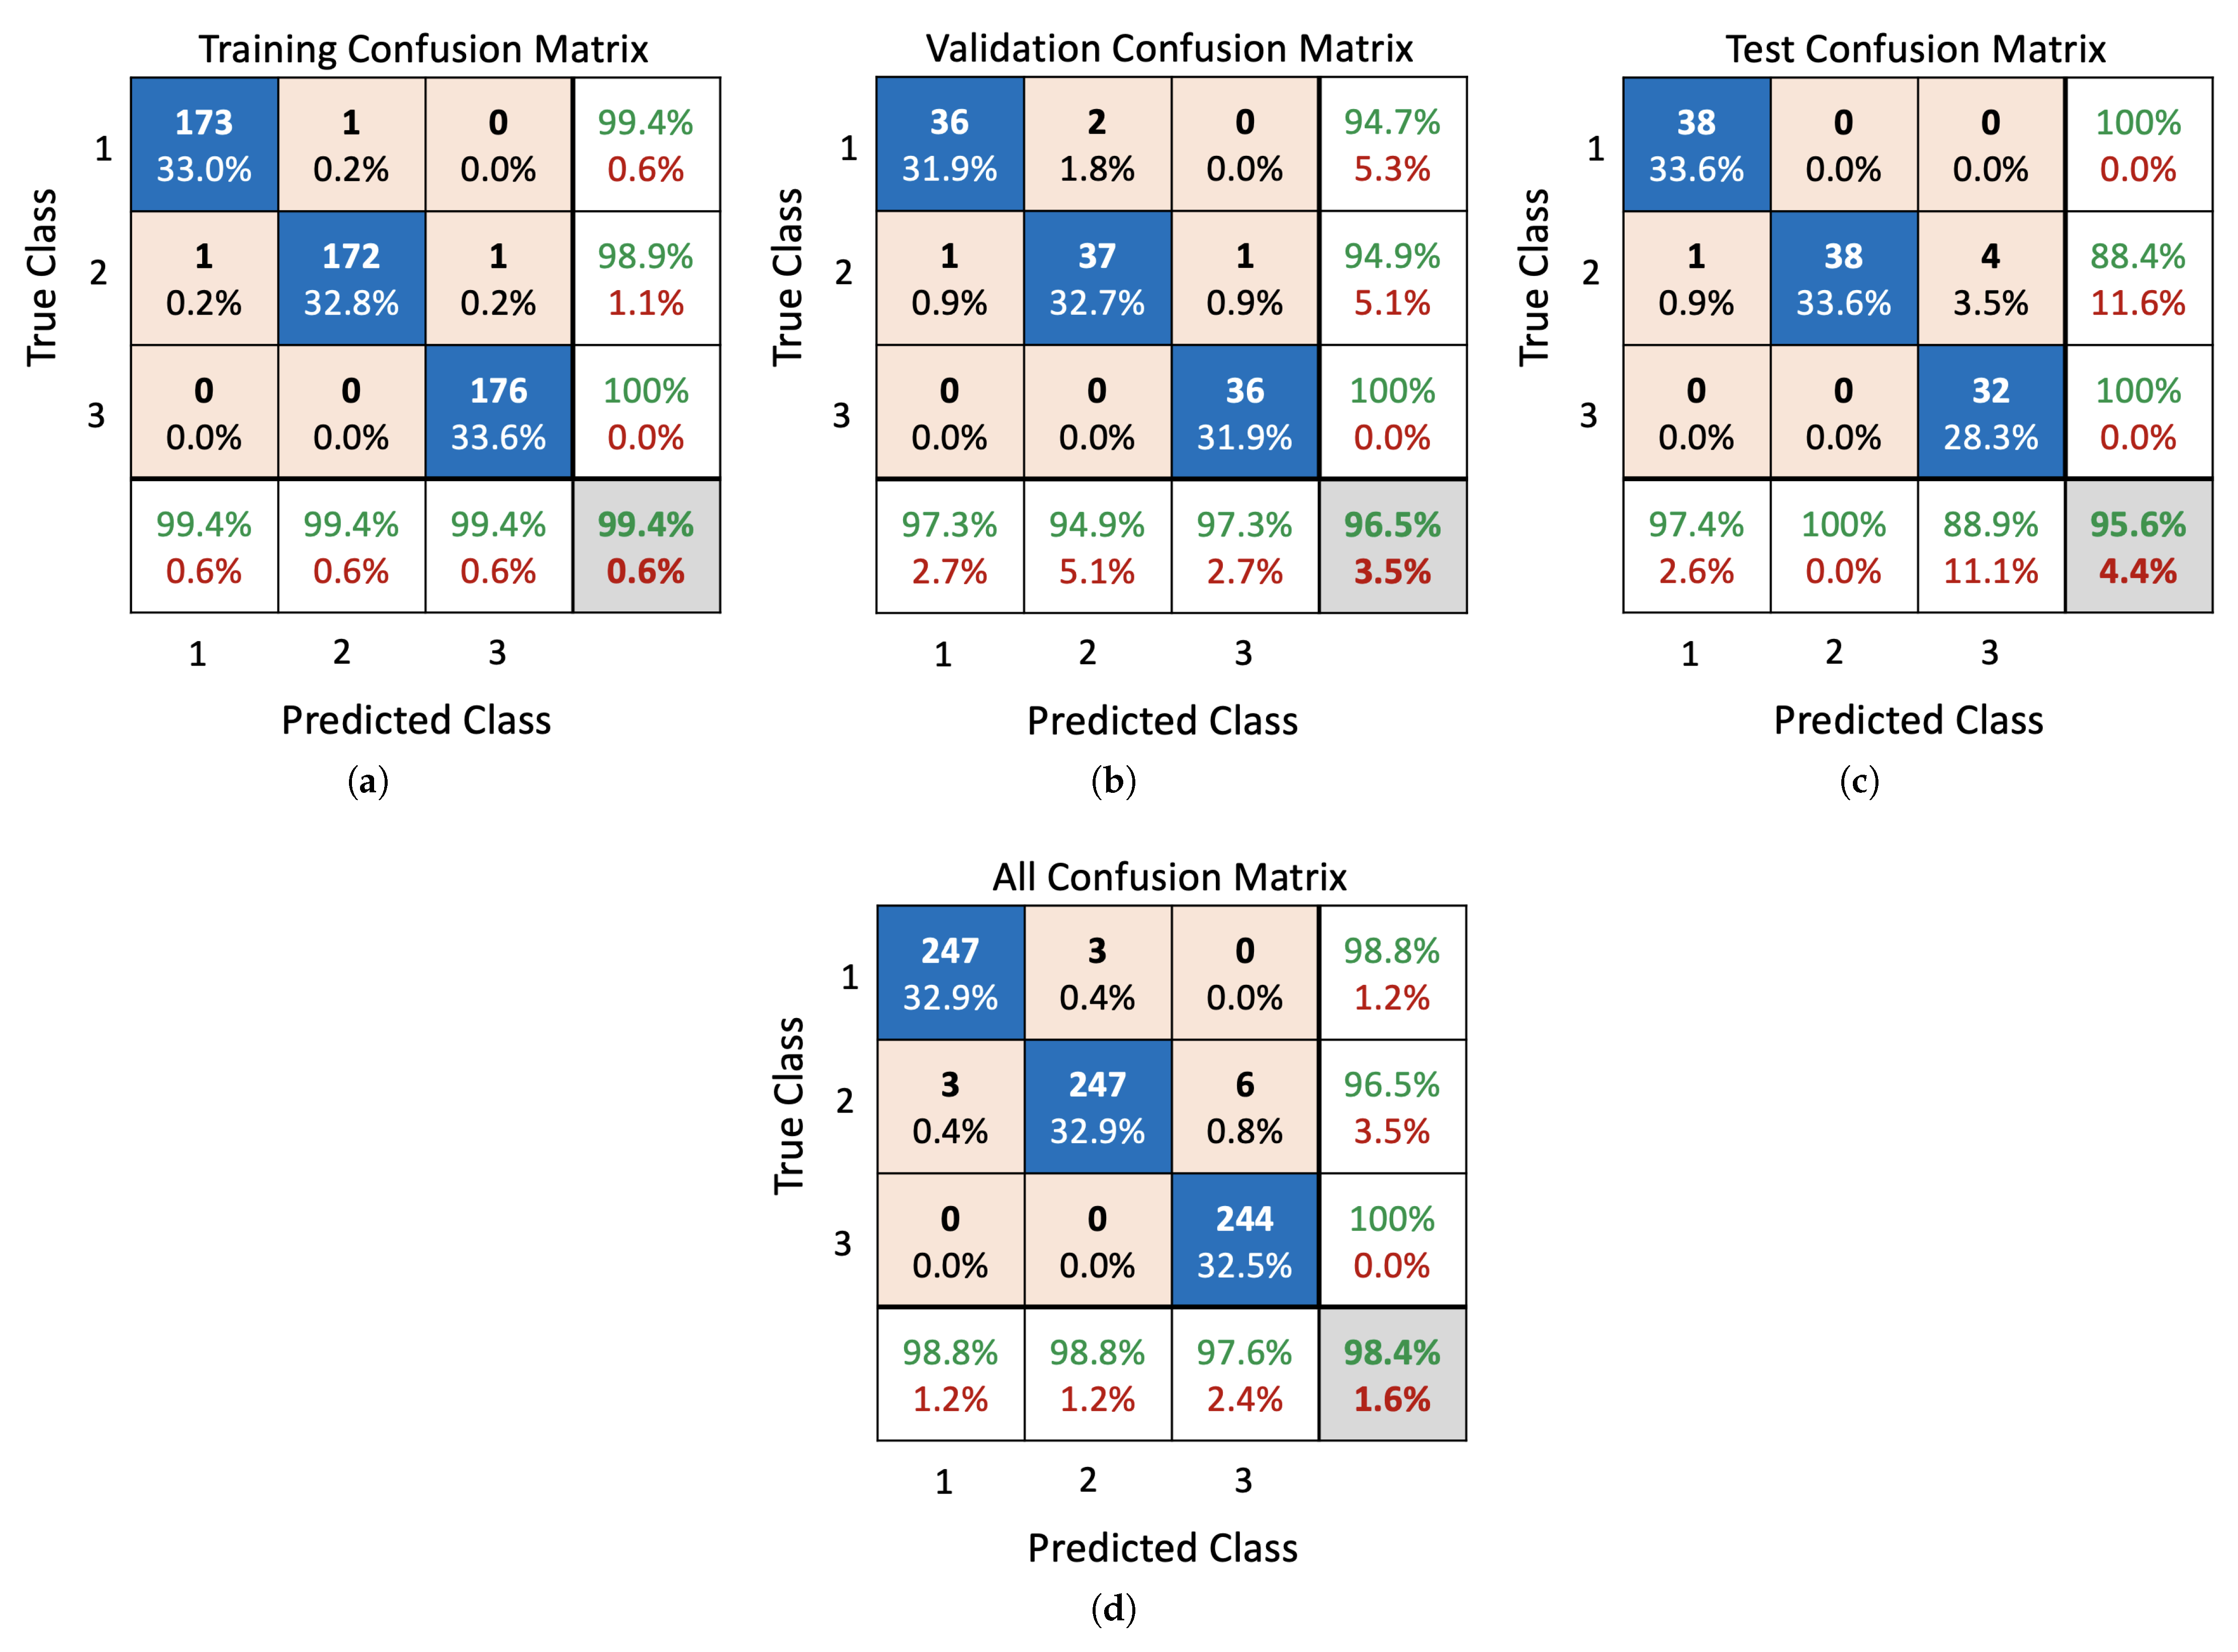
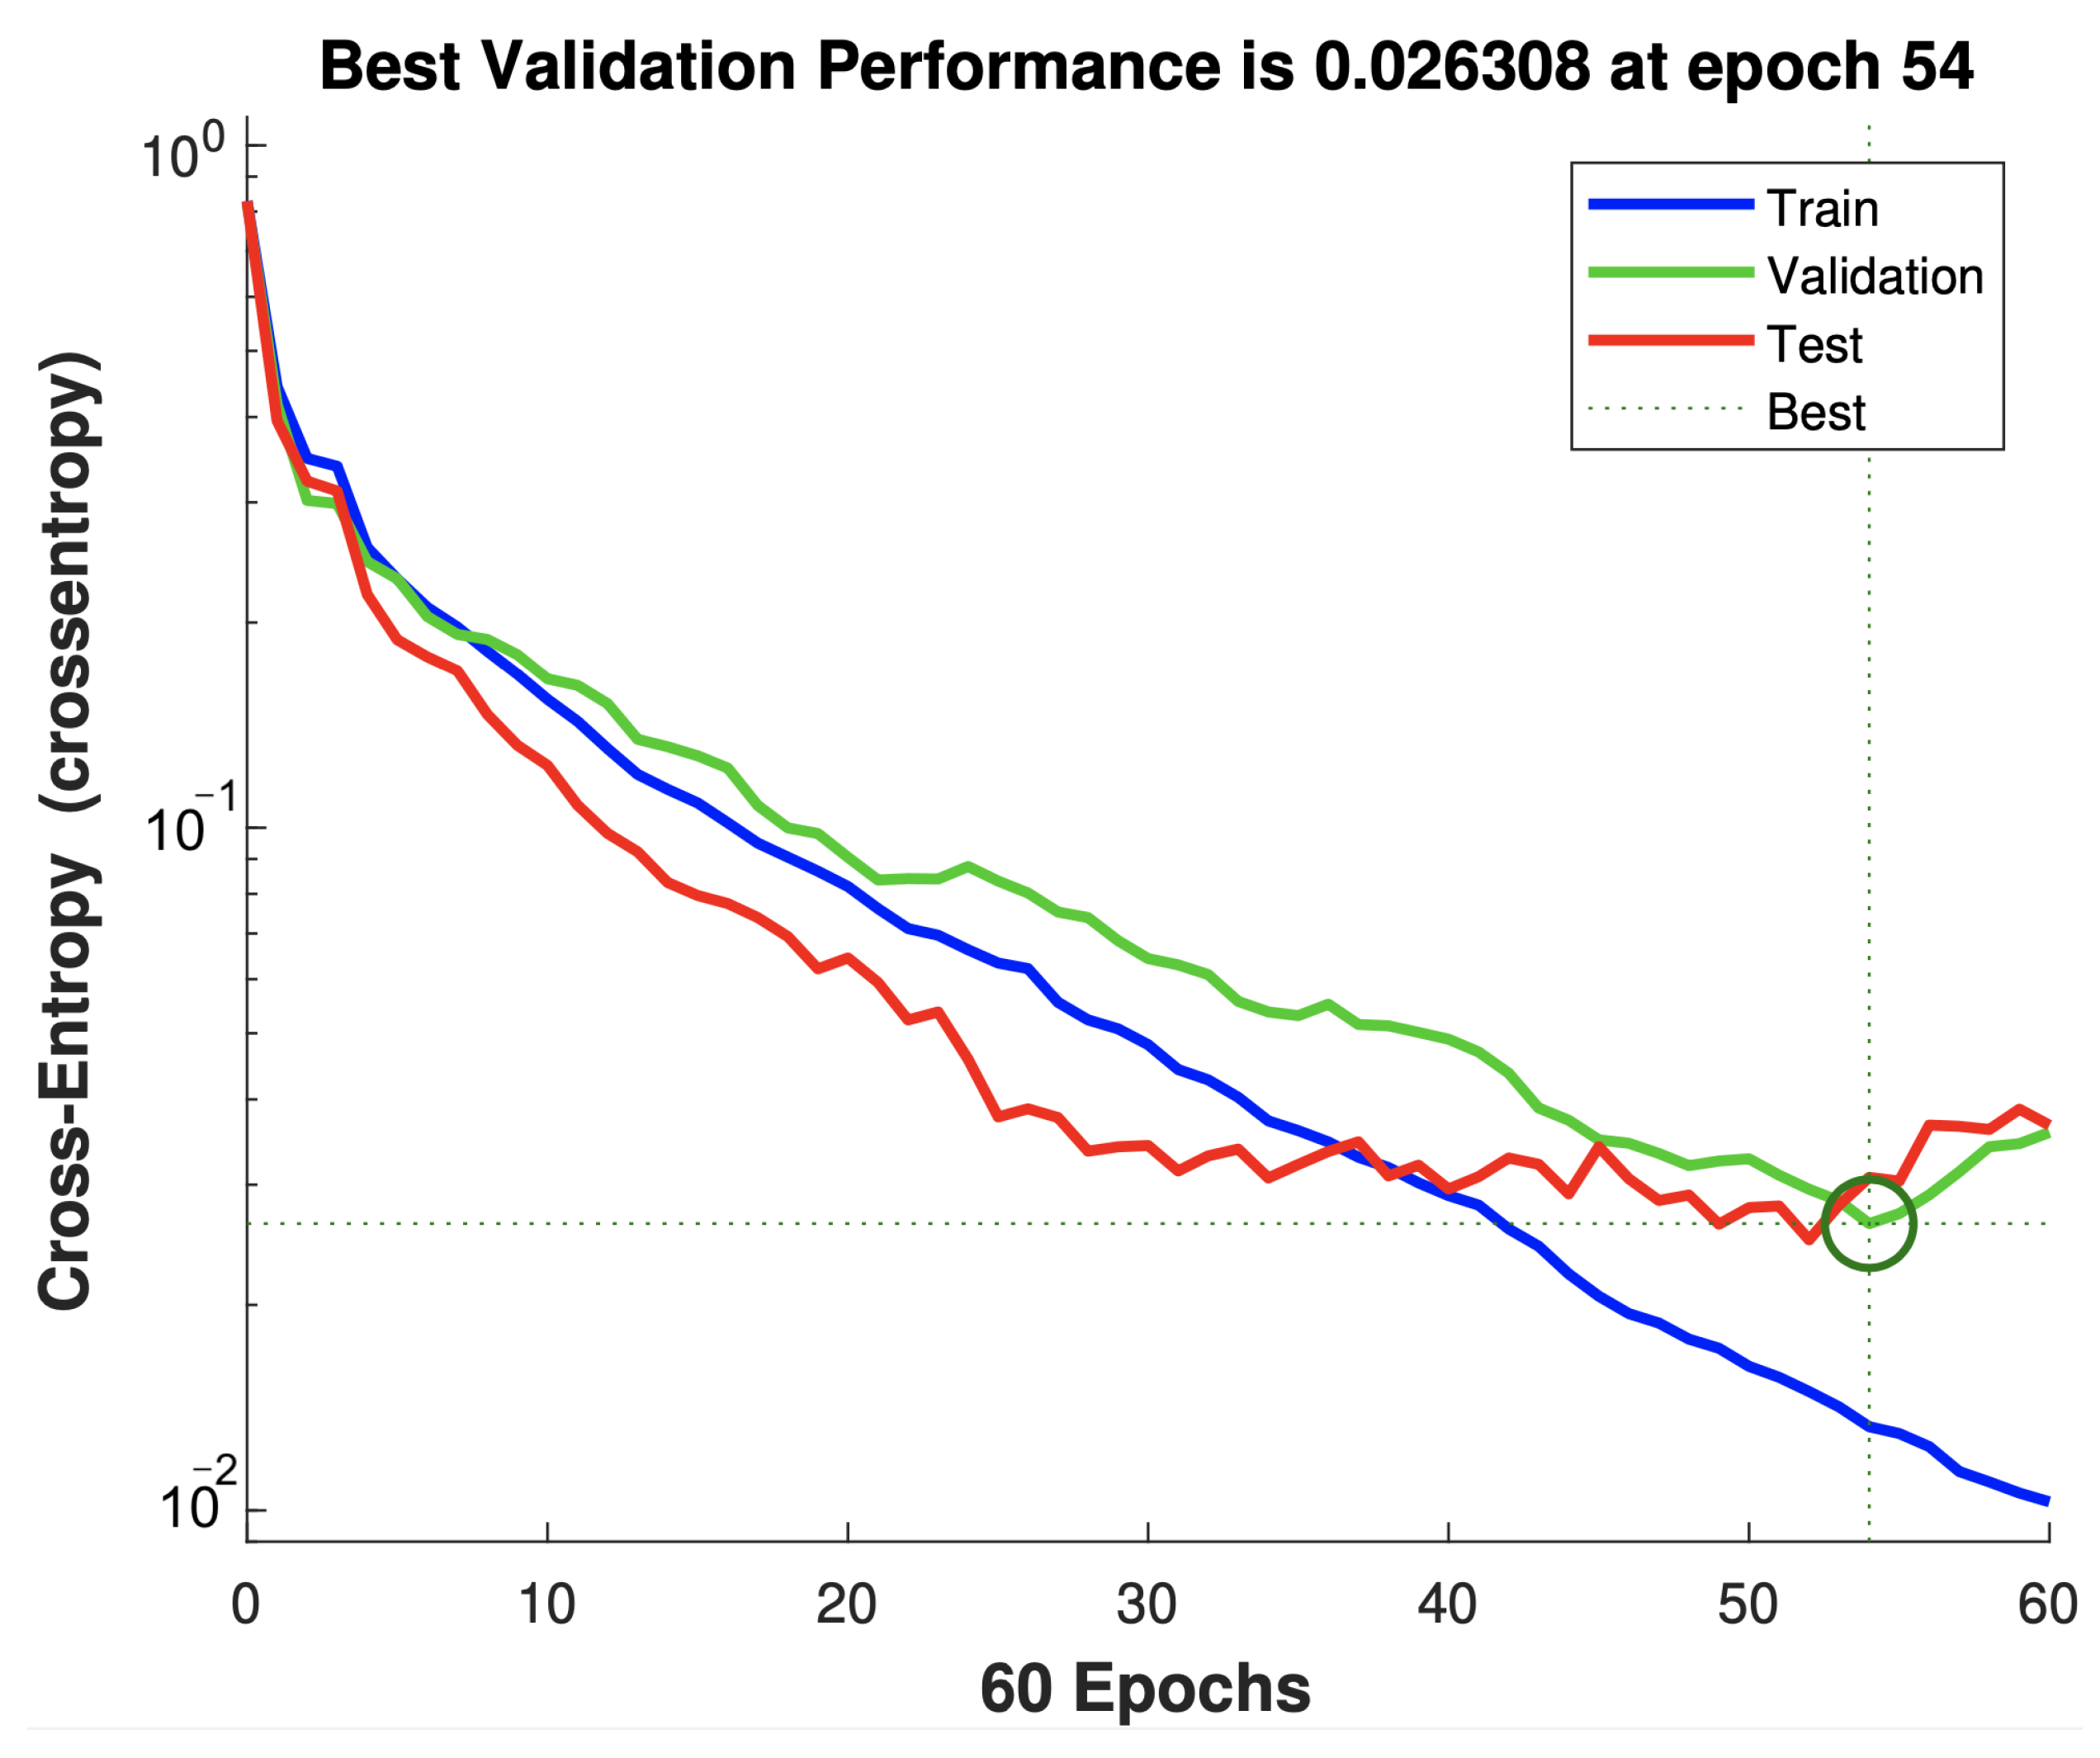
Here, we evaluate the performance of the proposed ANN and encoding-based model by comparing the obtained accuracy of each one with that of various algorithms including Fine Tree, Boosted Trees, Linear Discriminant, Naive Bayes, SVM, and KNN. As listed in Table 7, the proposed encoding-based model realizes the highest level of prediction accuracy ( 98.8 % ) with a misclassification rate of 1.2 % . The developed ANN model also provides a competitive accuracy; however, it incurs 37 neurons in the hidden layer to build a suitable structure. It can be seen that both the Gaussian Naive Bayes and the Quadratic SVM also achieve the third and fifth prediction accuracy ( 94.8 % and 96 % , respectively). To further evaluate the performance of the SVM algorithm, Naive Bayes classifier, proposed ANN, and encoding-based models in more detail, a confusion matrix is drawn. The confusion matrix is used to evaluate the effectiveness of classification models by categorizing data into various classes of true/false and positive and negative rates. Figure 9 depicts the confusion matrix of the presented ANN model. It can be noticed that the confusion happens between the first and second class (stay home and emergency room) and the second and third class (emergency room and ICU). This is because there are some correlated signs attributed to different classes and differentiating them requires more intensive computations by stacking more hidden layers. From Figure 10, it can be seen that the best validation performance (0.0263) was achieved at epoch 54, while the set goal was 0.01. This confirms that the model is capable of providing an accuracy of 97.37 % for the validation subset of data, but it utilizes a considerable number of neurons in the hidden layer (37 neurons).
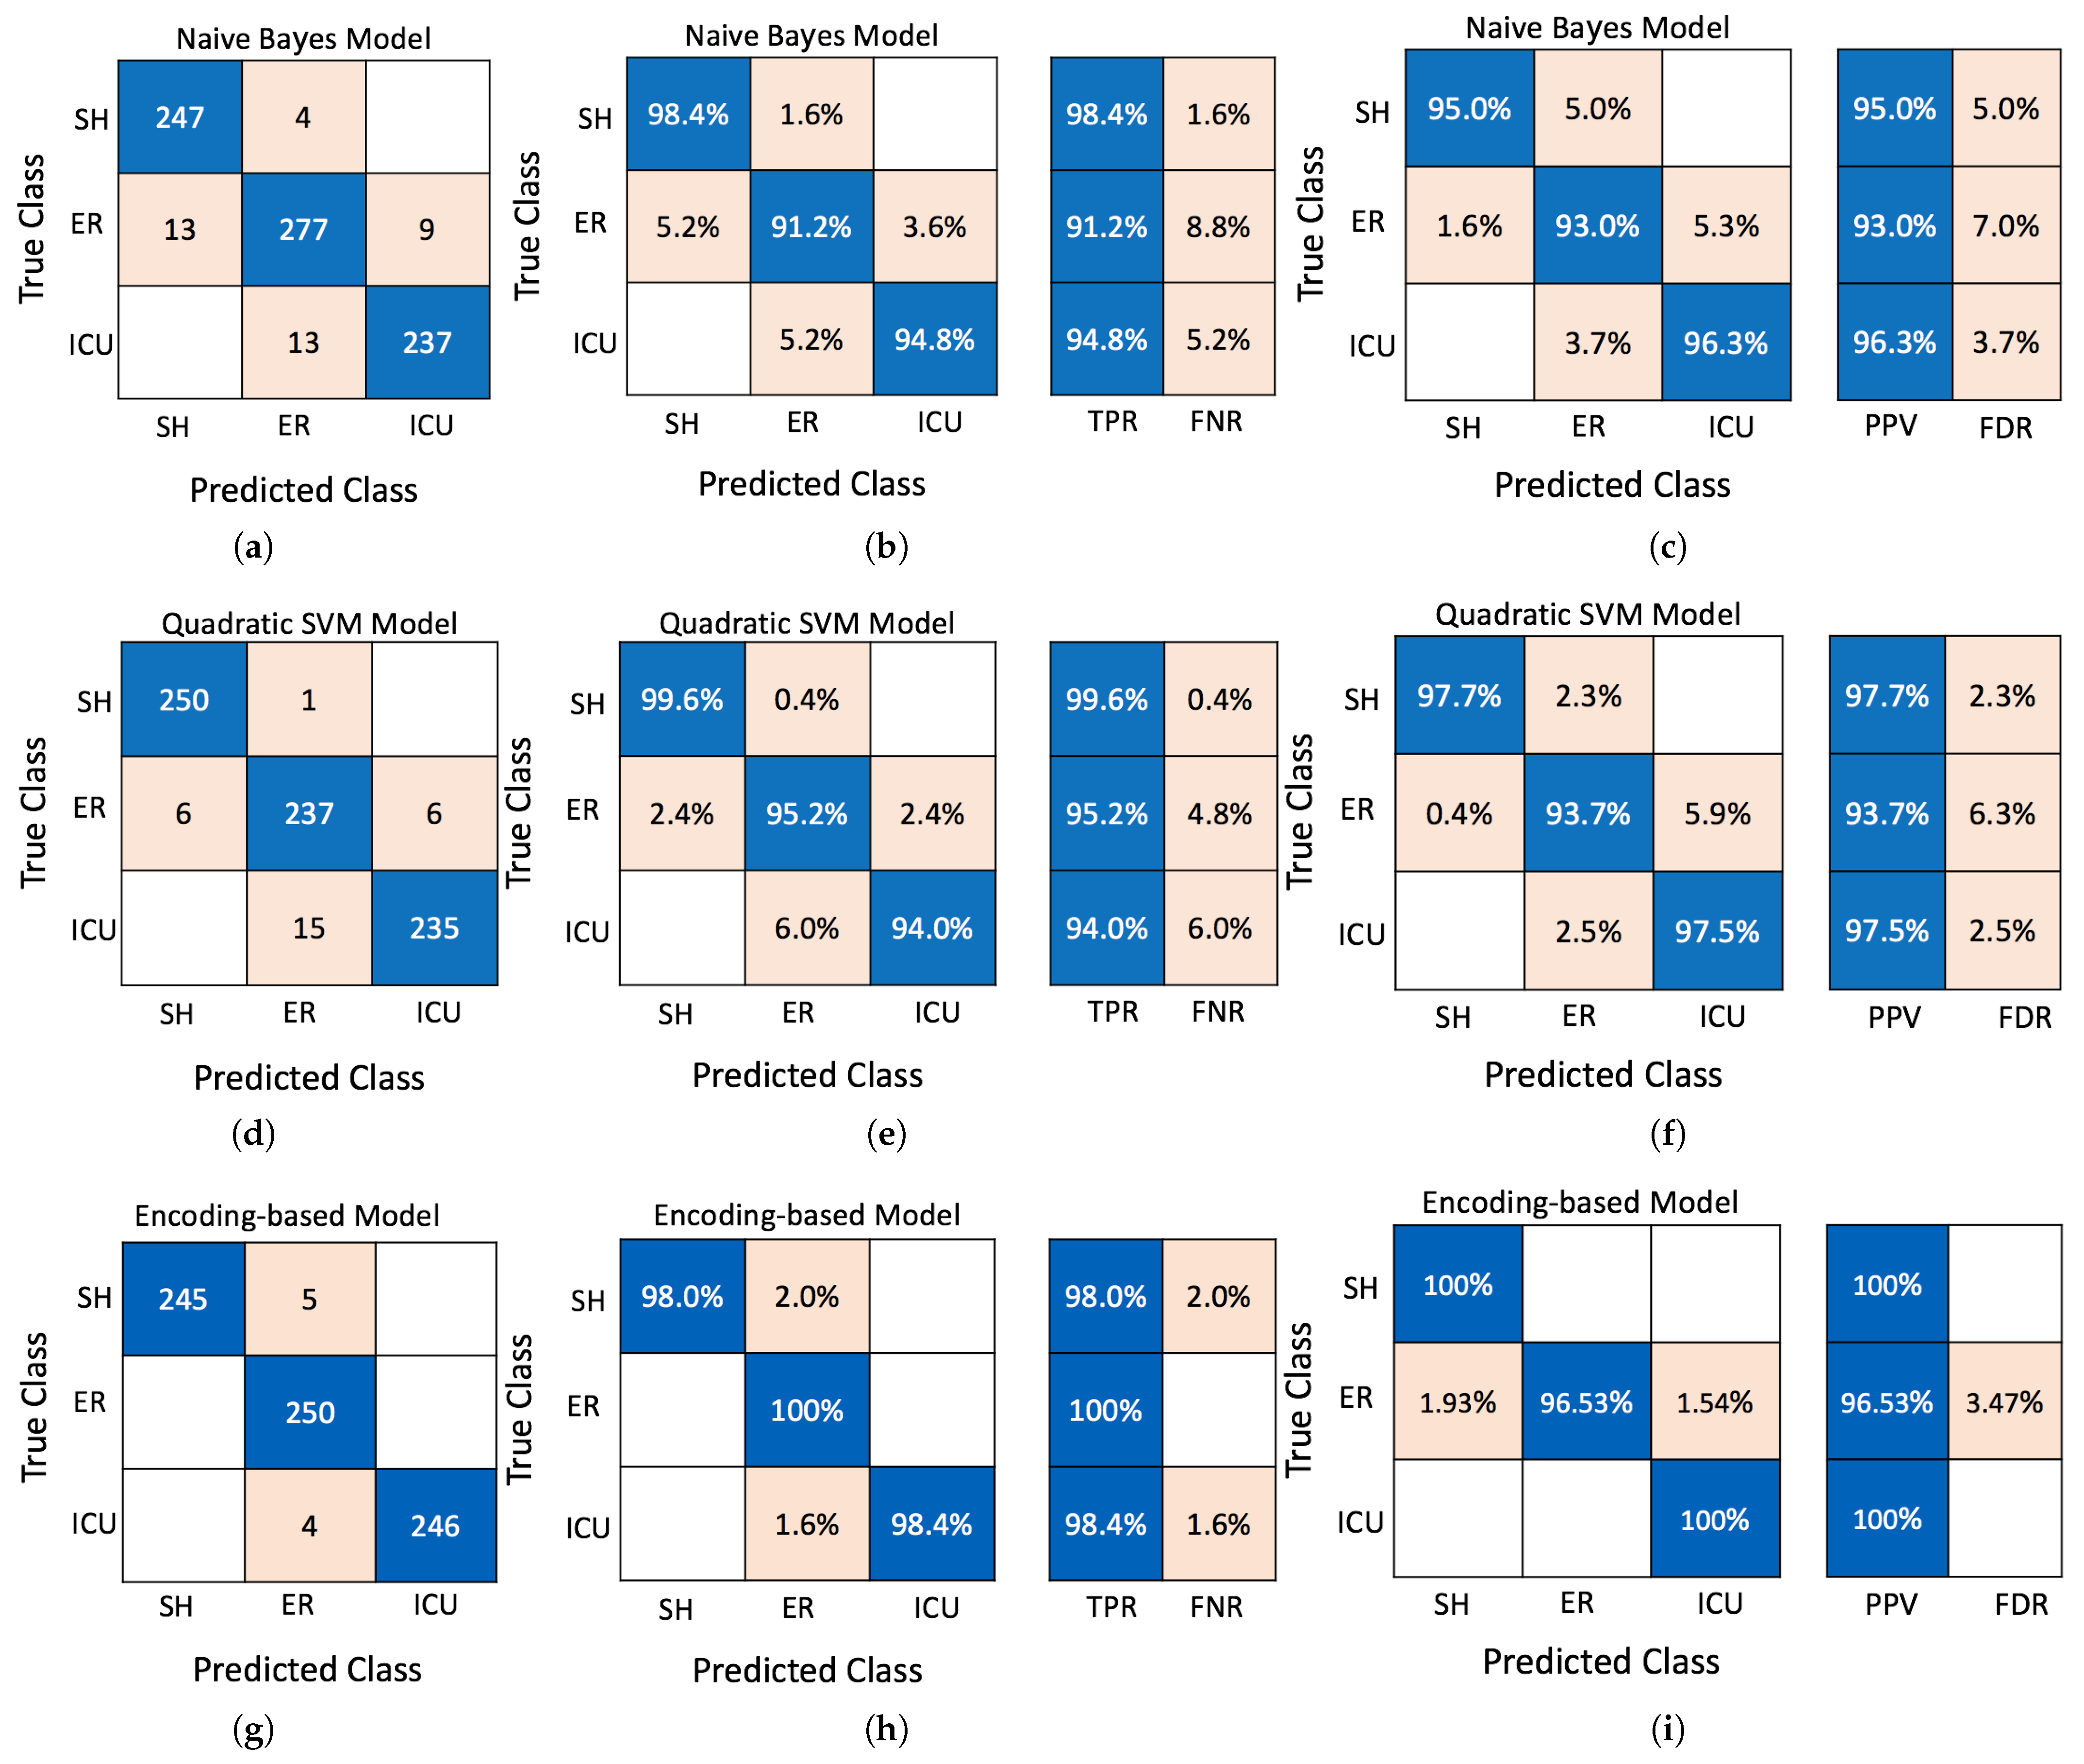
On the other hand, Figure 11 illustrates the confusion matrix of the Naive Bayes, Quadratic SVM, and proposed encoding-based algorithms. The encoding-based model achieves the lowest confusion between SH and ER and ER and ICU as it realizes the highest Positive Predictive Values (PPVs) and imposes the lowest False Discovery Rates (FDRs). Furthermore, the probability of the evaluated models, SVM, and Naive Bayes classifier is used to identify the status by computing the likelihood of each risk factor and then evaluating the prediction performance using precision, sensitivity, and F1-score as evaluation metrics. As listed in Table 8, the encoding model provides the highest prediction accuracy for all evaluation metrics. This can be explained as follows: the preprocessing of the proposed model concentrates on identifying the most crucial features to calculate RS and VS, then addressing them to specific lookup tables (LUTs). Therefore, unlike the probabilistic approaches, the prediction for the encoding-based method is performed based on a more mature analysis than the process of conventional ML approaches.
As can be observed in Table 9, the presented model achieves excellent accuracy in each iteration, realizing 100 % accuracy in six groups. The overall accuracy after K iterations of cross-validation for the testing data is 98.18 % . K-fold cross-validation has also been performed on all 750 records of the dataset, and the proposed encoding-based model delivers slightly higher accuracy ( 98.8 % ) since, in this case, each fold contains more data samples so it can learn better. The minimum and maximum accuracy for the proposed model are 97.3 % and 100 % , respectively. This demonstrates that the proposed model can perform very well even when the dataset contains hundreds of samples (less than 1k, as in this scholarly research study) or when there are some underrepresented data samples. Furthermore, the two-stage encoding technique for breaking down the correlation among a patient’s data, which involves calculating RS and VS, allows code refactoring through coding the extended comparisons with fewer lines of instructions.

5.2. Status Monitoring

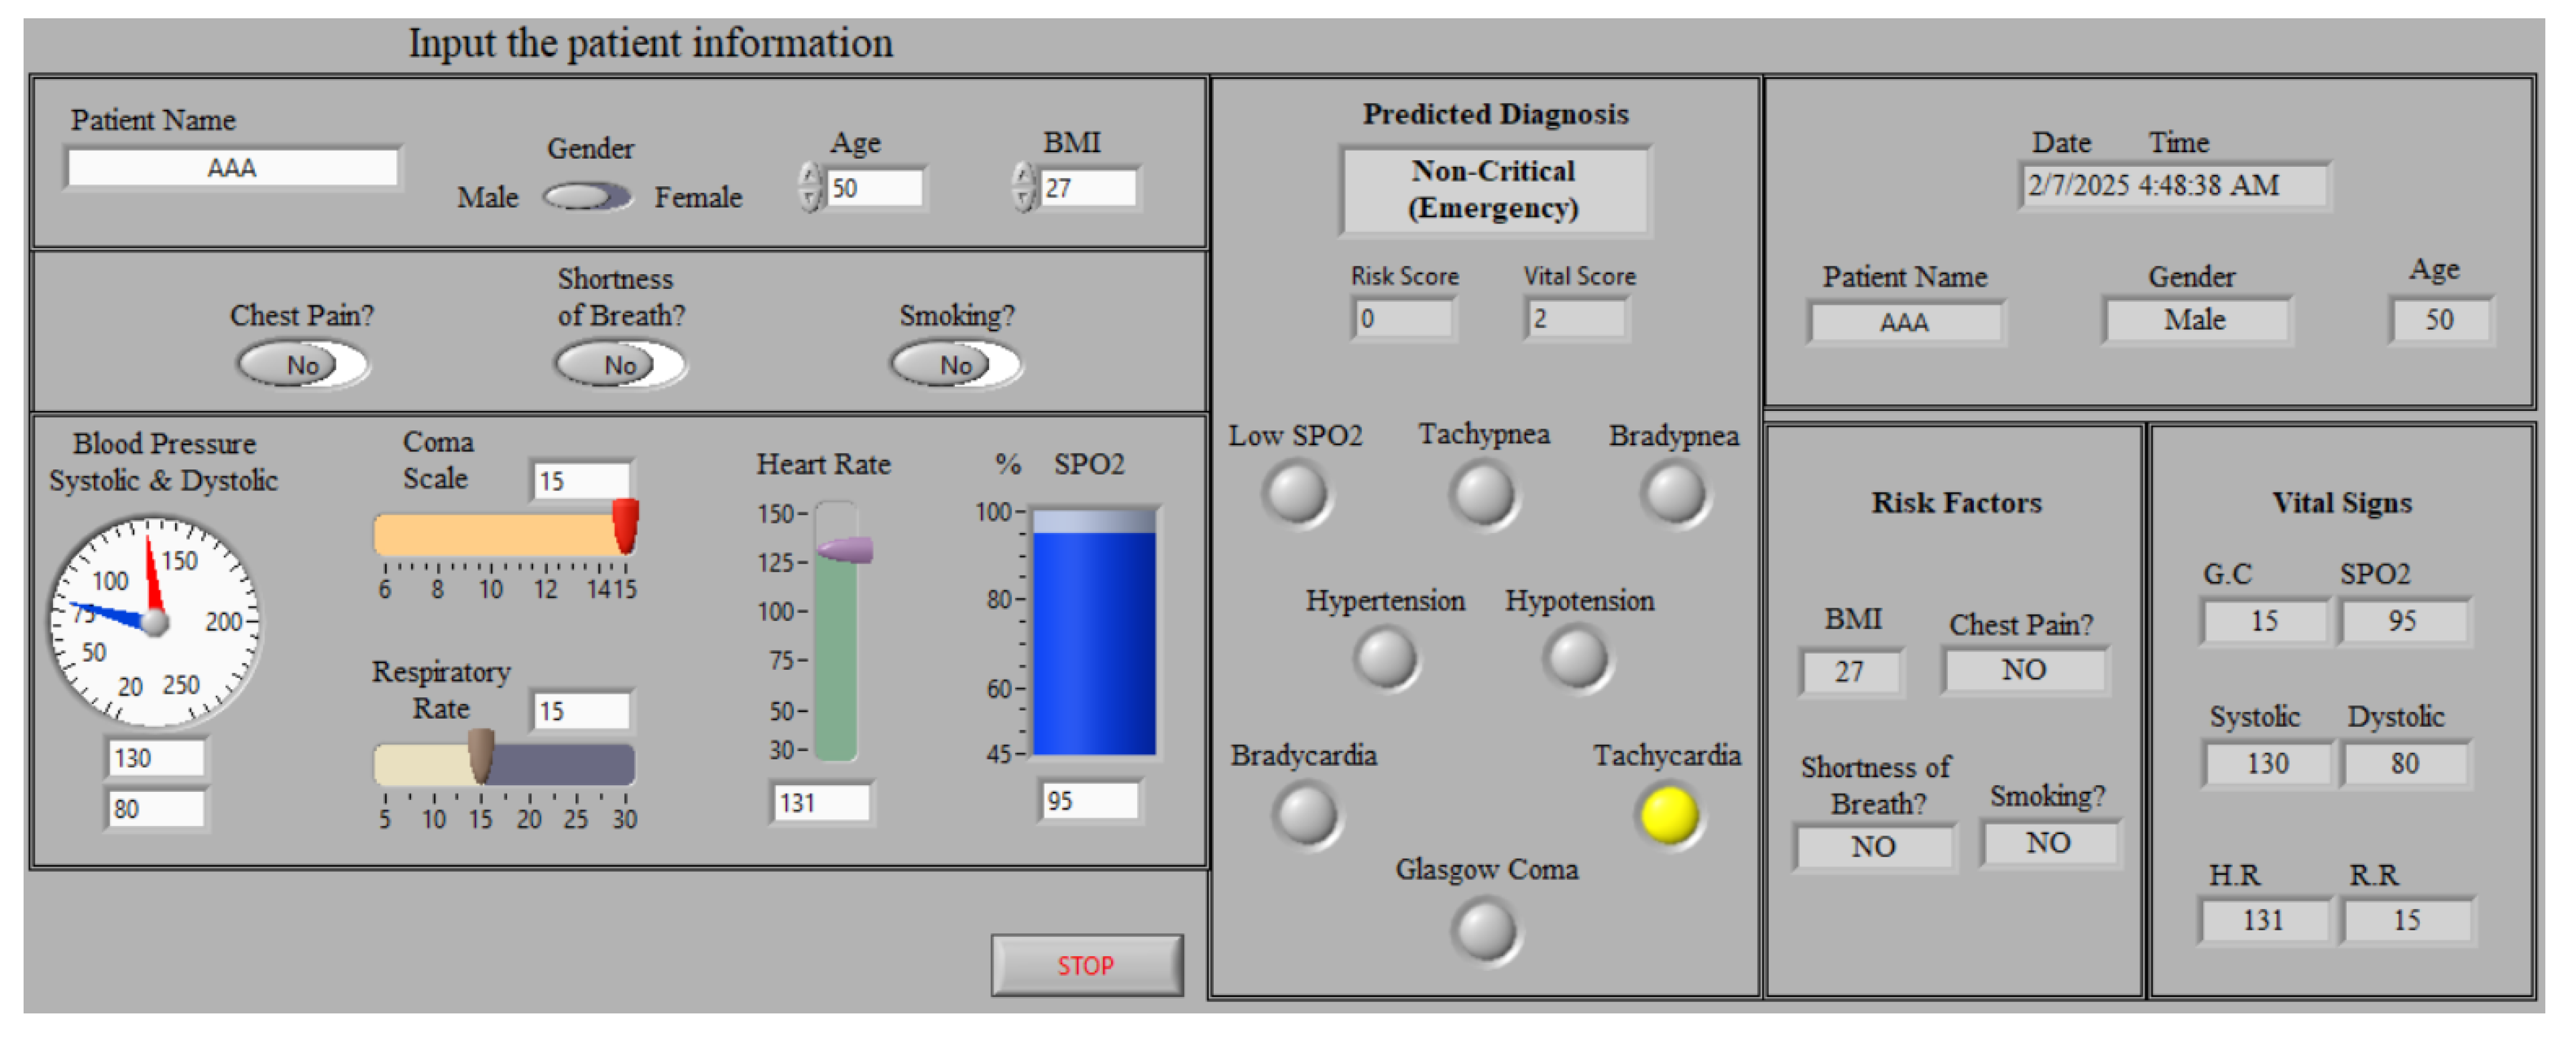
To provide medical doctors with a user-friendly GUI, the LabVIEW webserver is used to share the designed front panel. As can be seen in Figure 12, medical doctors can easily track the status of their cardiac patients by analyzing the indicated processed data (information) in the front panel of the GUI. The proposed healthcare monitoring system can be particularly helpful for cardiac patients who are required to consult with their doctor for follow-up to prevent developing more risk factors from emerging. Additionally, it would work well to reduce the expenses of visiting a healthcare facility or remaining in a hospital for an extended period of time. For instance, if a patient has angina pectoris, she/he should receive immediate treatment to prevent the emergence of risk factors that may lead to myocardial infarction [40]. Consequently, the developed monitoring system can be used to reduce care costs while maintaining cardiac patients’ health and providing them with more confidence and securing their health status. Therefore, this would highly assist in improving the overall performance of the healthcare system by delivering intelligent and dependable decision-making techniques.
On the other hand, the designed GUI prioritizes simplicity and clarity to ensure usability, particularly for monitoring cardiac patients. It is tailored to display critical patient information effectively while supporting multiple-patient monitoring. Additionally, all displayed information is automatically stored in an Excel sheet on the server computer, providing a robust solution for maintaining patient records and enabling further analysis.

6. Conclusions

This study presents an encoding-based machine learning approach to analyze the risk factors associated with cardiac patients, thereby identifying their health status. We introduce a LabVIEW-based remote monitoring and classification system strategy for addressing the healthcare delivery challenges of cardiac patients. The developed monitoring system utilizes a novel encoding-based ML technique to enhance the prediction outcomes for cardiac patients. Thus, leveraging the encoding technique for heart health status classification achieves an impressive predictive outcome of 98.8 % . Additionally, two stages of encoding were exploited to perform code refactoring, which allows for the use of a lower instruction count in the coding of extended comparisons. Furthermore, since the platform is based on LabVIEW, the system can easily be shared over the Internet with the relevant healthcare facilities for remote monitoring. Meanwhile, it offers a favorable decrease in the number of attached instruments, which is considered a burden that makes the daily life of patients more difficult. Thus, the presented approach for health status prediction can be an alternative low-cost monitoring system. It helps to bring mobility for cardiac patients at a lower expense and reduces diagnostic errors by consistently analyzing data patterns, achieving a low false prediction rate ( 1.2 % ).

Author Contributions

Conceptualization, F.S.A. and S.R.A.; methodology, F.S.A.; software, S.R.A.; validation, F.S.A. and S.R.A.; formal analysis, F.S.A.; investigation, F.S.A.; resources, S.R.A.; data curation, S.R.A.; writing—original draft preparation, S.R.A.; writing—review and editing, F.S.A.; visualization, S.R.A.; supervision, F.S.A.; project administration, F.S.A.; funding acquisition, S.R.A. and F.S.A. All authors have read and agreed to the published version of the manuscript.

Funding

This research received no external funding.

Data Availability Statement

The dataset will be available on GitHub upon request.

Conflicts of Interest

The authors declare no conflicts of interest.

References

  1. Ayon, S.I.; Islam, M.M.; Hossain, M.R. Coronary artery heart disease prediction: A comparative study of computational intelligence techniques. IETE J. Res. 2022, 68, 2488–2507. [Google Scholar] [CrossRef]
  2. Rashme, T.Y.; Islam, L.; Jahan, S.; Prova, A.A. Early prediction of cardiovascular diseases using feature selection and machine learning techniques. In Proceedings of the 2021 6th International Conference on Communication and Electronics Systems (ICCES), Coimbatre, India, 8–10 July 2021; pp. 1554–1559. [Google Scholar]
  3. Yew, H.T.; Ng, M.F.; Ping, S.Z.; Chung, S.K.; Chekima, A.; Dargham, J.A. IoT based real-time remote patient monitoring system. In Proceedings of the 2020 16th IEEE International Colloquium on Signal Processing & Its Applications (CSPA), Langkawi, Malaysia, 28–29 February 2020; pp. 176–179. [Google Scholar]
  4. Chen, X.; Xie, J.; Fang, Z.; Xia, S. Low power electrocardiography and impedance cardiography detection system based on LabVIEW and bluetooth low energy. In Proceedings of the 2015 IET International Conference on Biomedical Image and Signal Processing (ICBISP 2015), Beijing, China, 19 November 2015; pp. 1–4. [Google Scholar]
  5. Khan, M.U.; Aziz, S.; Iqtidar, K.; Zaher, G.F.; Alghamdi, S.; Gull, M. A two-stage classification model integrating feature fusion forcoronary artery disease detection and classification. Multimed. Tools Appl. 2022, 81, 13661–13690. [Google Scholar] [CrossRef]
  6. Speier, W.; Dzubur, E.; Zide, M.; Shufelt, C.; Joung, S.; Van Eyk, J.E.; Bairey Merz, C.N.; Lopez, M.; Spiegel, B.; Arnold, C. Evaluating utility and compliance in a patient-based ehealth study using continuoustime heart rate and activity trackers. J. Am. Med. Informat. Associat. 2018, 25, 1386–1391. [Google Scholar] [CrossRef] [PubMed]
  7. Pecchia, L.; Melillo, P.; Bracale, M. Remote health monitoring of heart failure with data mining via CART method on HRV features. IEEE Trans. Biomed. Eng. 2011, 58, 800–804. [Google Scholar] [CrossRef]
  8. Chandralekha, M.; Shenbagavadivu, N. Data analytics for risk of hospitalization of cardiac patients. IETE J. Res. 2021, 69, 3193–3202. [Google Scholar] [CrossRef]
  9. Ghosh, P.; Azam, S.; Jonkman, M.; Karim, A.; Shamrat, F.M.; Ignatious, E.; Shultana, S.; Beeravolu, A.R.; De Boer, F. Efficient prediction of cardiovascular disease using machine learning algorithms with relief and LASSO feature selection techniques. IEEE Access 2021, 9, 19304–19326. [Google Scholar] [CrossRef]
  10. Rahman, M.Z.; Akbar, M.A.; Leiva, V.; Tahir, A.; Riaz, M.T.; Martin-Barreiro, C. An intelligent health monitoring anddiagnosis system based on the internet of things and fuzzy logicfor cardiac arrhythmia COVID-19 patients. Comput. Biol. Med. 2023, 145, 106583. [Google Scholar]
  11. Ong, M.K.; Romano, P.S.; Edgington, S.; Aronow, H.U.; Auerbach, A.D.; Black, J.T.; De Marco, T.; Escarce, J.J.; Evangelista, L.S.; Hanna, B.; et al. Effectiveness of remote patient monitoring after discharge of hospitalized patients with heart failure: The better effectiveness after transition–heart failure (BEAT-HF) randomized clinical trial. JAMA Intern. Med. 2016, 176, 310–318. [Google Scholar] [CrossRef]
  12. Kondaka, L.S.; Thenmozhi, M.; Vijayakumar, K.; Kohli, R. Anintensive healthcare monitoring paradigm by using IoT based machinelearning strategies. Multimed. Tools Appl. 2021, 81, 36891–36905. [Google Scholar] [CrossRef]
  13. Stuart, H.R.; Ian, D.P.; Strachan, M.W.; Hobson, R.P. Davidson’s Principles and Practice of Medicine, 23rd ed.; Elsevier Health Sciences: Amsterdam, The Netherlands, 2018. [Google Scholar]
  14. Naraei, P.; Abhari, A.; Sadeghian, A. Application of multilayer perceptron neural networks and support vector machines in classification of healthcare data. In Proceedings of the 2016 Future Technologies Conference (FTC), San Francisco, CA, USA, 6–7 December 2016; pp. 848–852. [Google Scholar]
  15. Haq, A.U.; Li, J.; Memon, M.H.; Memon, M.H.; Khan, J.; Marium, S.M. Heart disease prediction system using model of machine learning and sequential backward selection algorithm for features selection. In Proceedings of the 2019 IEEE 5th International Conference for Convergence in Technology (I2CT), Bombay, India, 29–31 March 2019; pp. 1–4. [Google Scholar]
  16. Sahoo, S.; Bisoy, S.K.; Mallick, P.K. Cardiac Disease Detection Using Machine Learning Algorithms: A Review. In Proceedings of the 2024 International Conference on Advancements in Smart, Secure and Intelligent Computing (ASSIC), Bhubaneswar, India, 27–29 January 2024; pp. 1–5. [Google Scholar]
  17. Ullah, T.; Ullah, S.; Ullah, K.; Ishaq, M.; Khan, A.; Ghadi, Y.; Algarni, A. Machine Learning-Based Cardiovascular Disease Detection Using Optimal Feature Selection. IEEE Access 2024, 12, 16431–16446. [Google Scholar] [CrossRef]
  18. Yuvaraj, R.; Chadha, S.; Prince, A.A.; Murugappan, M.; Islam, M.S.B.; Sumon, M.S.I.; Chowdhury, M.E.H. A Machine Learning Framework for Classroom EEG Recording Classification: Unveiling Learning-Style Patterns. Algorithms 2024, 17, 503. [Google Scholar] [CrossRef]
  19. Machado, R.; Dodhy, R.S.; Sehgal, A.; Rattigan, K.; Lalwani, A.; Waynforth, D. A Machine Learning Approach to Identifying Risk Factors for Long COVID-19. Algorithms 2024, 17, 485. [Google Scholar] [CrossRef]
  20. Senthil, P.S.; Kumaragurubaran, T.; Vijay, S.R.; Vigneshwaran, R. Predictive Modelling of Critical Vital Signs in ICU Patients by Machine Learning: An Early Warning System for Improved Patient Outcomes. In Proceedings of the 2024 3rd International Conference for Innovation in Technology (INOCON), Bangalore, India, 1–3 May 2024. [Google Scholar]
  21. Ali, G.; Abdullah Al-Kafi, G.M.; Faiza, J.T.; Hoque, M.I.; Suha, S.A. Revolutionizing Intensive Care: A Machine Learning Based Approach for ICU Patients’ In-Hospital Mortality Prediction. In Proceedings of the 2024 6th International Conference on Electrical Engineering and Information & Communication Technology (ICEEICT), Dhaka, Bangladesh, 2–4 May 2024; pp. 711–716. [Google Scholar]
  22. Tan, E.T.; Halim, Z.A. Health care monitoring system and analytics based on internet of things framework. IETE J. Res. 2019, 65, 653–660. [Google Scholar] [CrossRef]
  23. Naik, K.T.; Garg, B. A Machine Learning Model for Disease Prediction and Remote Patient Monitoring. In Proceedings of the 4th International Conference on Information Management & Machine Intelligence (ICIMMI ’22), Jaipur, India, 23–24 December 2022; Association for Computing Machinery: New York, NY, USA Article 7. ; pp. 1–5. [Google Scholar]
  24. Dalal, K.R. Analysing the implementation of machine learning in healthcare. In Proceedings of the 2020 International Conference on Electronics and Sustainable Communication Systems (ICESC), Coimbatore, India, 2–4 July 2020; pp. 133–137. [Google Scholar]
  25. Meng, Y.; Speier, W.; Shufelt, C.; Joung, S.; Van Eyk, J.E.; Merz, C.N.; Lopez, M.; Spiegel, B.; Arnold, C.W. A machine learning approach to classifying self-reported health status in a cohort of patients with heart disease using activity tracker data. IEEE J. Biomed. Health Inf. 2020, 24, 878–884. [Google Scholar] [CrossRef]
  26. Piri, S.; Delen, D.; Liu, T.; Zolbanin, H.M. A data analytics approach to building a clinical decision support system for diabetic retinopathy: Developing and deploying a model ensemble. Decis. Support Syst. 2017, 101, 12–27. [Google Scholar] [CrossRef]
  27. Schouten, P. Big data in health care: Solving provider revenue leakage with advanced analytics. Healthc. Financ. Manag. 2013, 67, 40–43. [Google Scholar]
  28. Patil, M.; Lobo, V.B.; Puranik, P.; Pawaskar, A.; Pai, A.; Mishra, R. A proposed model for lifestyle disease prediction using support vector machine. In Proceedings of the 2018 9th International Conference on Computing, Communication and Networking Technologies (ICCCNT), Bengaluru, India, 10–12 July 2018; pp. 1–6. [Google Scholar]
  29. Katarya, R.; Srinivas, P. Predicting heart disease at early stages using machine learning: A survey. In Proceedings of the 2020 International Conference on Electronics and Sustainable Communication Systems (ICESC), Coimbatore, India, 2–4 July 2020; pp. 302–305. [Google Scholar]
  30. Kaur, P.; Kumar, R.; Kumar, M. A healthcare monitoring systemusing random forest and internet of things (IoT). Multimed. Tools Appl. 2019, 78, 19905–19916. [Google Scholar] [CrossRef]
  31. Sabarmathi, G.; Chinnaiyan, R. Reliable machine learning approach to predict patient satisfaction for optimal decision making and quality health care. In Proceedings of the 2019 International Conference on Communication and Electronics Systems (ICCES), Coimbatore, India, 17–19 July 2019; pp. 1489–1493. [Google Scholar]
  32. Graham, B.; Bond, R.; Quinn, M.; Mulvenna, M. Using data mining to predict hospital admissions from the emergency department. IEEE Access 2018, 6, 10458–10469. [Google Scholar] [CrossRef]
  33. Paudel, N.; Neupane, R.C. A general architecture for a real-time monitoring system based on the internet of things. In Proceedings of the 2019 3rd International Symposium on Computer Science and Intelligent Control, ser. ISCSIC, Amsterdam, The Netherlands, 25–27 September 2019; Association for Computing Machinery: New York, NY, USA, 2019. [Google Scholar]
  34. Dinesh, K.G.; Arumugaraj, K.; Santhosh, K.D.; Mareeswari, V. Prediction of cardiovascular disease using machine learning algorithms. In Proceedings of the 2018 International Conference on Current Trends towards Converging Technologies (ICCTCT), Coimbatore, India, 1–3 March 2018; pp. 1–7. [Google Scholar]
  35. Sujatha, P.; Mahalakshmi, K. Performance evaluation of supervised machine learning algorithms in prediction of heart disease. In Proceedings of the 2020 IEEE International Conference for Innovation in Technology (INOCON), Bangluru, India, 6–8 November 2020; pp. 1–7. [Google Scholar]
  36. Manikandan, M.; Vijayakumar, P. Improving the performance of classifiers by ensemble techniques for the premature finding of unusual birth outcomes from cardiotocography. IETE J. Res. 2020, 69, 1734–1744. [Google Scholar] [CrossRef]
  37. Qadri, A.M.; Raza, A.; Munir, K.; Almutairi, M.S. Effective Feature Engineering Technique for Heart Disease Prediction With Machine Learning. IEEE Access 2023, 11, 56214–56224. [Google Scholar] [CrossRef]
  38. Ardabili, S.Z.; Bahmani, S.; Lahijan, L.Z.; Khaleghi, N.; Sheykhivand, S.; Danishvar, S. A Novel Approach for Automatic Detection of Driver FatigueUsing EEG Signals Based on Graph Convolutional Networks. Algorithms 2024, 24, 364. [Google Scholar]
  39. Mohajelin, F.; Sheykhivand, S.; Shabani, A.; Danishvar, M.; Danishvar, S.; Lahijan, L.Z. Automatic Recognition of Multiple Emotional Classes fromEEG Signals through the Use of Graph Theory andConvolutional Neural Networks. Algorithms 2024, 24, 5883. [Google Scholar]
  40. Innes, J.A.; Dover, A.R.; Fairhurst, K. Macleod’s Clinical Examination, 14th ed.; Elsevier: Amsterdam, The Netherlands, 2018. [Google Scholar]
  41. Bishop, C.M. Pattern Recognition and Machine Learning; Springer Publishing Company: Cambridge, UK, 2006. [Google Scholar]
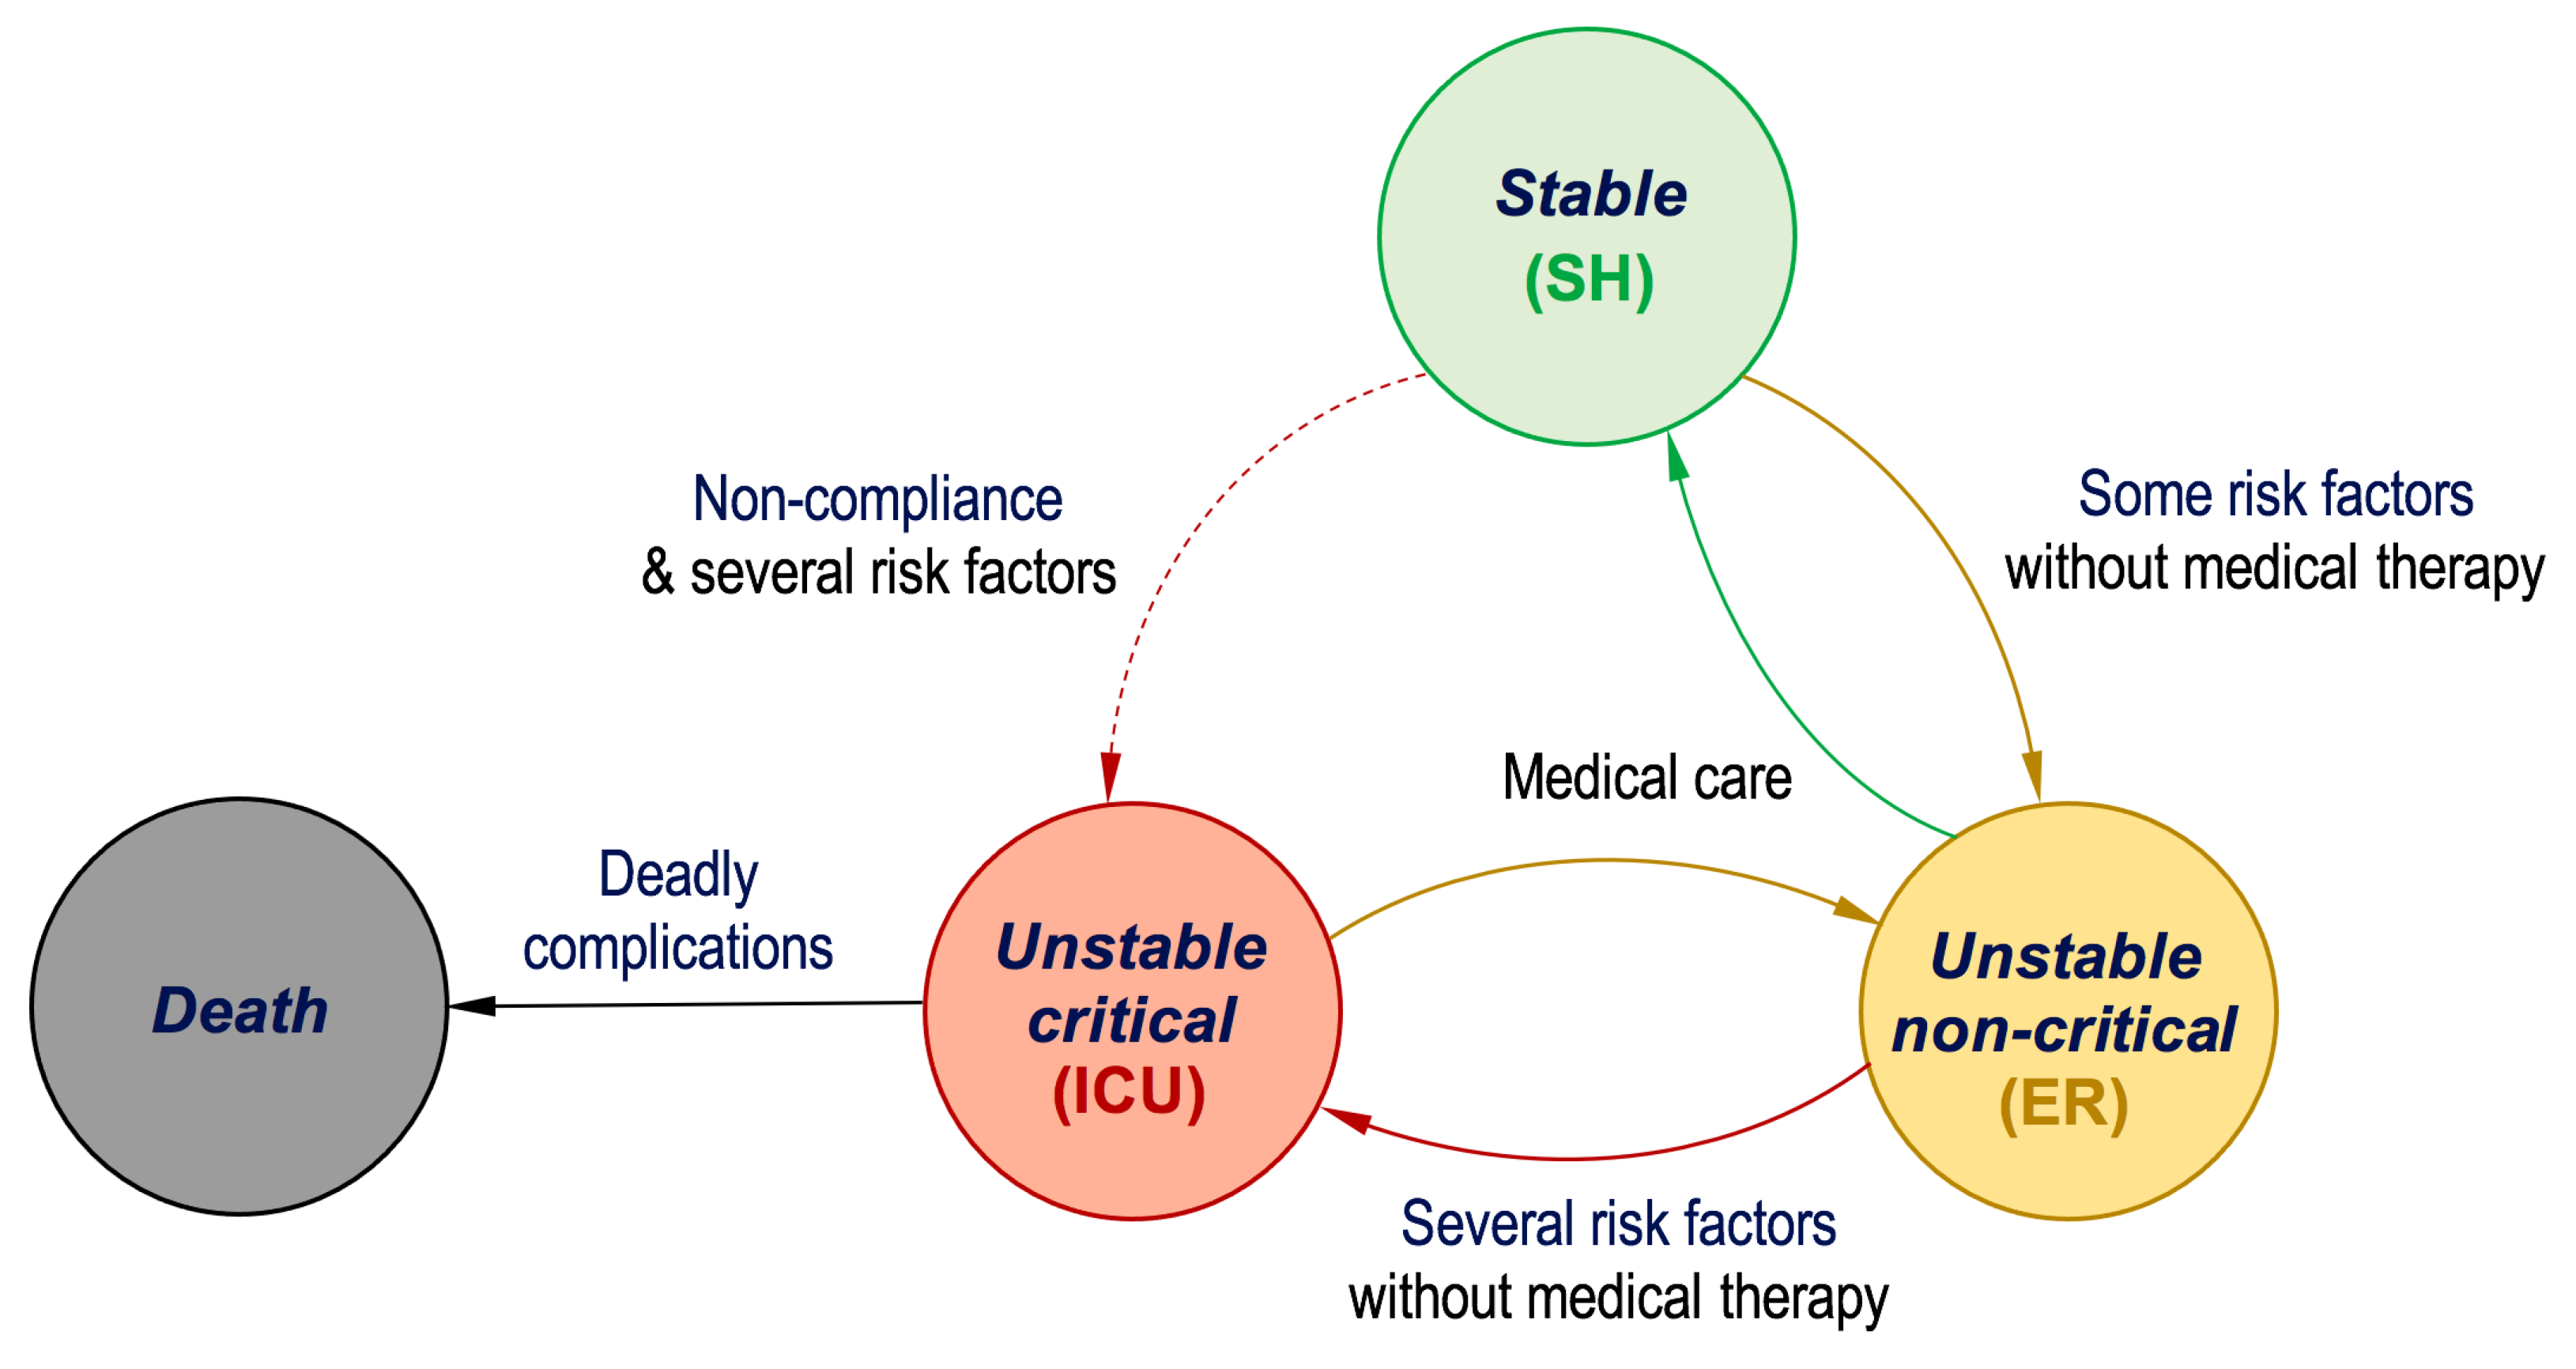
Figure 1. State transition diagram for the cardiac patient’s status condition.
Algorithms 18 00094 g001
Figure 2. The structure of the developed ANN classifier.
Algorithms 18 00094 g002
Figure 3. Accuracy vs. number of neurons in the hidden layer of the developed ANN model structure.
Algorithms 18 00094 g003
Figure 4. Applying the PCA algorithm for dimensional reduction, (a) variance level for PCA components, (b) components stability.
Algorithms 18 00094 g004
Figure 5. The proposed encoding-based machine learning model.
Algorithms 18 00094 g005
Figure 6. Required case statements for the case study: (a) equivalent case structure for patient1, (b) equivalent case structure for patient2, (c) equivalent case structure for patient3.
Algorithms 18 00094 g006
Figure 7. Main part of the LabVIEW block diagram for the proposed encoding-based model.
Algorithms 18 00094 g007
Figure 8. The LabVIEW front panel testing window of the proposed encoding-based model. Note that the yellow indicators signify the "ON" state for the corresponding risk factor.
Algorithms 18 00094 g008
Figure 9. Confusion matrix of the developed ANN classifier: (a) training results, (b) validation results, (c) test results, (d) model’s overall performance evaluation.
Algorithms 18 00094 g009
Figure 10. Performance validation of the developed ANN model. Note that the green circle indicates the best performance intersection of validation and testing.
Algorithms 18 00094 g010
Figure 11. Confusion matrix: (a) number of observations of Naive Bayes, (b) evaluation of True Positive Rate (TPR) and False Negative Rate (FNR) of Naive Bayes, (c) evaluation of PPV and FDR of Naive Bayes, (d) number of observations of Quadratic SVM, (e) evaluation of TPR and FNR of Quadratic SVM, (f) evaluation of PPV and FDR of Quadratic SVM, (g) number of observations of the proposed encoding-based model, (h) evaluation of TPR and FNR of proposed encoding-based model, (i) evaluation of PPV and FDR of the encoding-based model.
Algorithms 18 00094 g011
Figure 12. Designed monitoring window (GUI) for LabVIEW webserver. Note that the yellow indicators signify the “ON” state for the corresponding risk factor.
Algorithms 18 00094 g012
Table 1. A cardiac patient’s risk factors (features), health status, and required therapy.
Risk Factors and Extracted Features
Medical History Medical Examination
FeaturesTypeFeaturesType
AgeContinuousHeart RateContinuous
Body Mass
Index (BMI)
ContinuousRespiratory RateContinuous
Chest Pain
(CP)
Nominal (0 → NO; 1 → YES)SPO2Continuous
Shortness of
Breath (SoB)
Nominal (0 → NO; 1 → YES)Blood PressureContinuous
SmokingNominal (0 → NO; 1 → YES)Glasgow Coma ScaleContinuous
Possible Labels and Required Medical Therapy
Health Status (Labels)Medical Therapy
StableStay Home (SH)
Unstable Non-criticalEmergency Room (ER)
Unstable CriticalIntensive Care Unit (ICU)
Table 2. The required sensors and input data categories for practical cardiac system realization.
FactorsApplicable Sensors
Gender, Age, and SmokingUser Interface (input)
Body Mass Index (BMI)Weight Sensor (e.g., load cell),
Height Sensor (e.g., ultrasonic/infrared)
Chest PainUser Interface (input)
Shortness of BreathPiezoelectric Belt or Pulse Oximeter
Blood Pressure (Systolic and Diastolic)Blood Pressure Monitor
(Oscillo-metric)
Heart RateHeart Rate Sensor
(e.g., photoplethysmography)
Respiratory RateRespiration Sensor
(e.g., chest belt or nasal airflow sensor)
Glasgow Coma ScaleClinician Assessment
(e.g., EEG optionally for brain activity)
SPO2Pulse Oximeter
Table 3. Statistical summary of the collected dataset for cardiac patients.
FactorsMin.Max.Mean
( x ¯ )
Std. Dev.
( S )
Gender01 0.627 0.484
Age2387 54.159 12.267
BMI2235 28.86 2.375
Chest pain01 0.665 0.472
Shortness of breath01 0.536 0.5
Smoking01 0.541 0.499
Systolic50200 133.33 32.421
Diastolic50130 80.536 18.821
Heart rate45140 87.181 17.2
Respiratory rate1022 14.231 2.808
Glasgow coma scale815 13.067 1.926
SPO25298 91.752 6.01
Class021 0.817
Table 4. Risk factor score.
Risk Factors
Risk Score (RS) Chest Pain? Shortness of Breath?
000
101
210
311
Table 5. Case study: patients’ medical information for model testing.
#NameCPSoBSys.Dia.HRRRGCSPO2
(%)
Actual
Status
1Person1YESNO905093121087Critical
2Person2YESNO1008083131497Stable
3Person3NOYES1507095131592Non-critical
Table 6. Encoding of conditions to enable either LUT3 or LUT4 for decision-making and classification.
Switch Case (VS)Condition?
Vital Score Case # False (LUT3) True (LUT4)
0Case 0Stable (SH)Non-Critical (EM)
1Case 1Stable (SH)Non-Critical (EM)
2Case 2Stable (EH)Non-Critical (EM)
3,4Case 3,4Stable (SH)Non-Critical (EM)
5Case 5Stable (SH)Non-Critical (EM)
6Case 6Stable (SH)Non-Critical (EM)
7Case 7Non-Critical (ER)Critical (ICU)
8Case 8Non-Critical (ER)Critical (ICU)
9Case 9Non-Critical (ER)Critical (ICU)
10Case 10Non-Critical (ER)Critical (ICU)
11Case 11Non-Critical (ER)Critical (ICU)
12Case 12Non-Critical (ER)Critical (ICU)
13Case 13Non-Critical (ER)Critical (ICU)
14Case 14Non-Critical (ER)Critical (ICU)
15Case 15Non-Critical (ER)Critical (ICU)
16,17Case 16,17Non-Critical (ER)Critical (ICU)
18,19Case 18,19Non-Critical (ER)Critical (ICU)
20Case 20Non-Critical (ER)Critical (ICU)
21Case 21Non-Critical (ER)Critical (ICU)
22Case 22Non-Critical (ER)Critical (ICU)
23Case 23Non-Critical (ER)Critical (ICU)
24Case 24Non-Critical (ER)Critical (ICU)
25Case 25Non-Critical (ER)Critical (ICU)
26Case 26Non-Critical (ER)Critical (ICU)
27Case 27Non-Critical (ER)Critical (ICU)
28Case 28Non-Critical (ER)Critical (ICU)
29Case 29Non-Critical (ER)Critical (ICU)
30Case 30Non-Critical (ER)Critical (ICU)
31Case 31Non-Critical (ER)Critical (ICU)
Table 7. Accuracy of the proposed approaches compared to that of different ML-based multi-class classification algorithms.
ML-Based AlgorithmAccuracy
(%)
Failure Prediction
Rate (%)
Decision Tree (DT) 92.8 7.2
Medium Tree 93.2 6.8
XGBoost 94.1 5.9
RUSBoosted Trees928
Linear Discriminant 83.7 16.3
Gaussian Naive Bayes 94.8 5.2
Kernel Naive Bayes 92.8 7.2
Linear SVM 87.7 12.3
Quadratic SVM964
Medium Gaussian SVM 95.9 4.1
Fine KNN9010
Medium KNN 85.1 14.9
Weighted KNN 89.6 10.4
Developed ANN Model 98.4 1.6
Proposed Encoding-based Model 98.8 1.2
Table 8. The classification performance of proposed and the employed competitive models.
ModelPrecision
(%)
Sensitivity
(%)
F1-Score
(%)
Gaussian Naive Bayes 96.6 91 93.7
Quadratic SVM 96.8 95.2 95.8
Developed ANN 98.2 9697
Proposed Encoding-based Model 98.2 98.2 98.3
Table 9. Accuracy evaluation of the proposed ML encoding model using ( 10 % ) K-fold cross validation.
Testing Dataset (30%)All Dataset (100%)
KRangeAccuracyRangeAccuracy
K11 → 22 100 % 1 → 75 97.3 %
K223 → 45 95.45 % 76 → 150 100 %
K346 → 68 100 % 151 → 225 97.3 %
K469 → 91 95.45 % 226 → 300 100 %
K592 → 114 100 % 301 → 375 100 %
K6115 → 137 100 % 376 → 450 98.67 %
K7138 → 160 95.45 % 451 → 525 97.3 %
K8161 → 183 100 % 526 → 600 100 %
K9184 → 206 95.45 % 601 → 675 98.67 %
K10207 → 225 100 % 676 → 750 98.67 %
AVE 98.18 % AVE 98.8 %
Disclaimer/Publisher’s Note: The statements, opinions and data contained in all publications are solely those of the individual author(s) and contributor(s) and not of MDPI and/or the editor(s). MDPI and/or the editor(s) disclaim responsibility for any injury to people or property resulting from any ideas, methods, instructions or products referred to in the content.