Evaluating LDA and PLS-DA Algorithms for Food Authentication: A Chemometric Perspective
Abstract
1. Introduction
2. Materials and Methods
2.1. Samples Origin, Data Collection, and Analysis
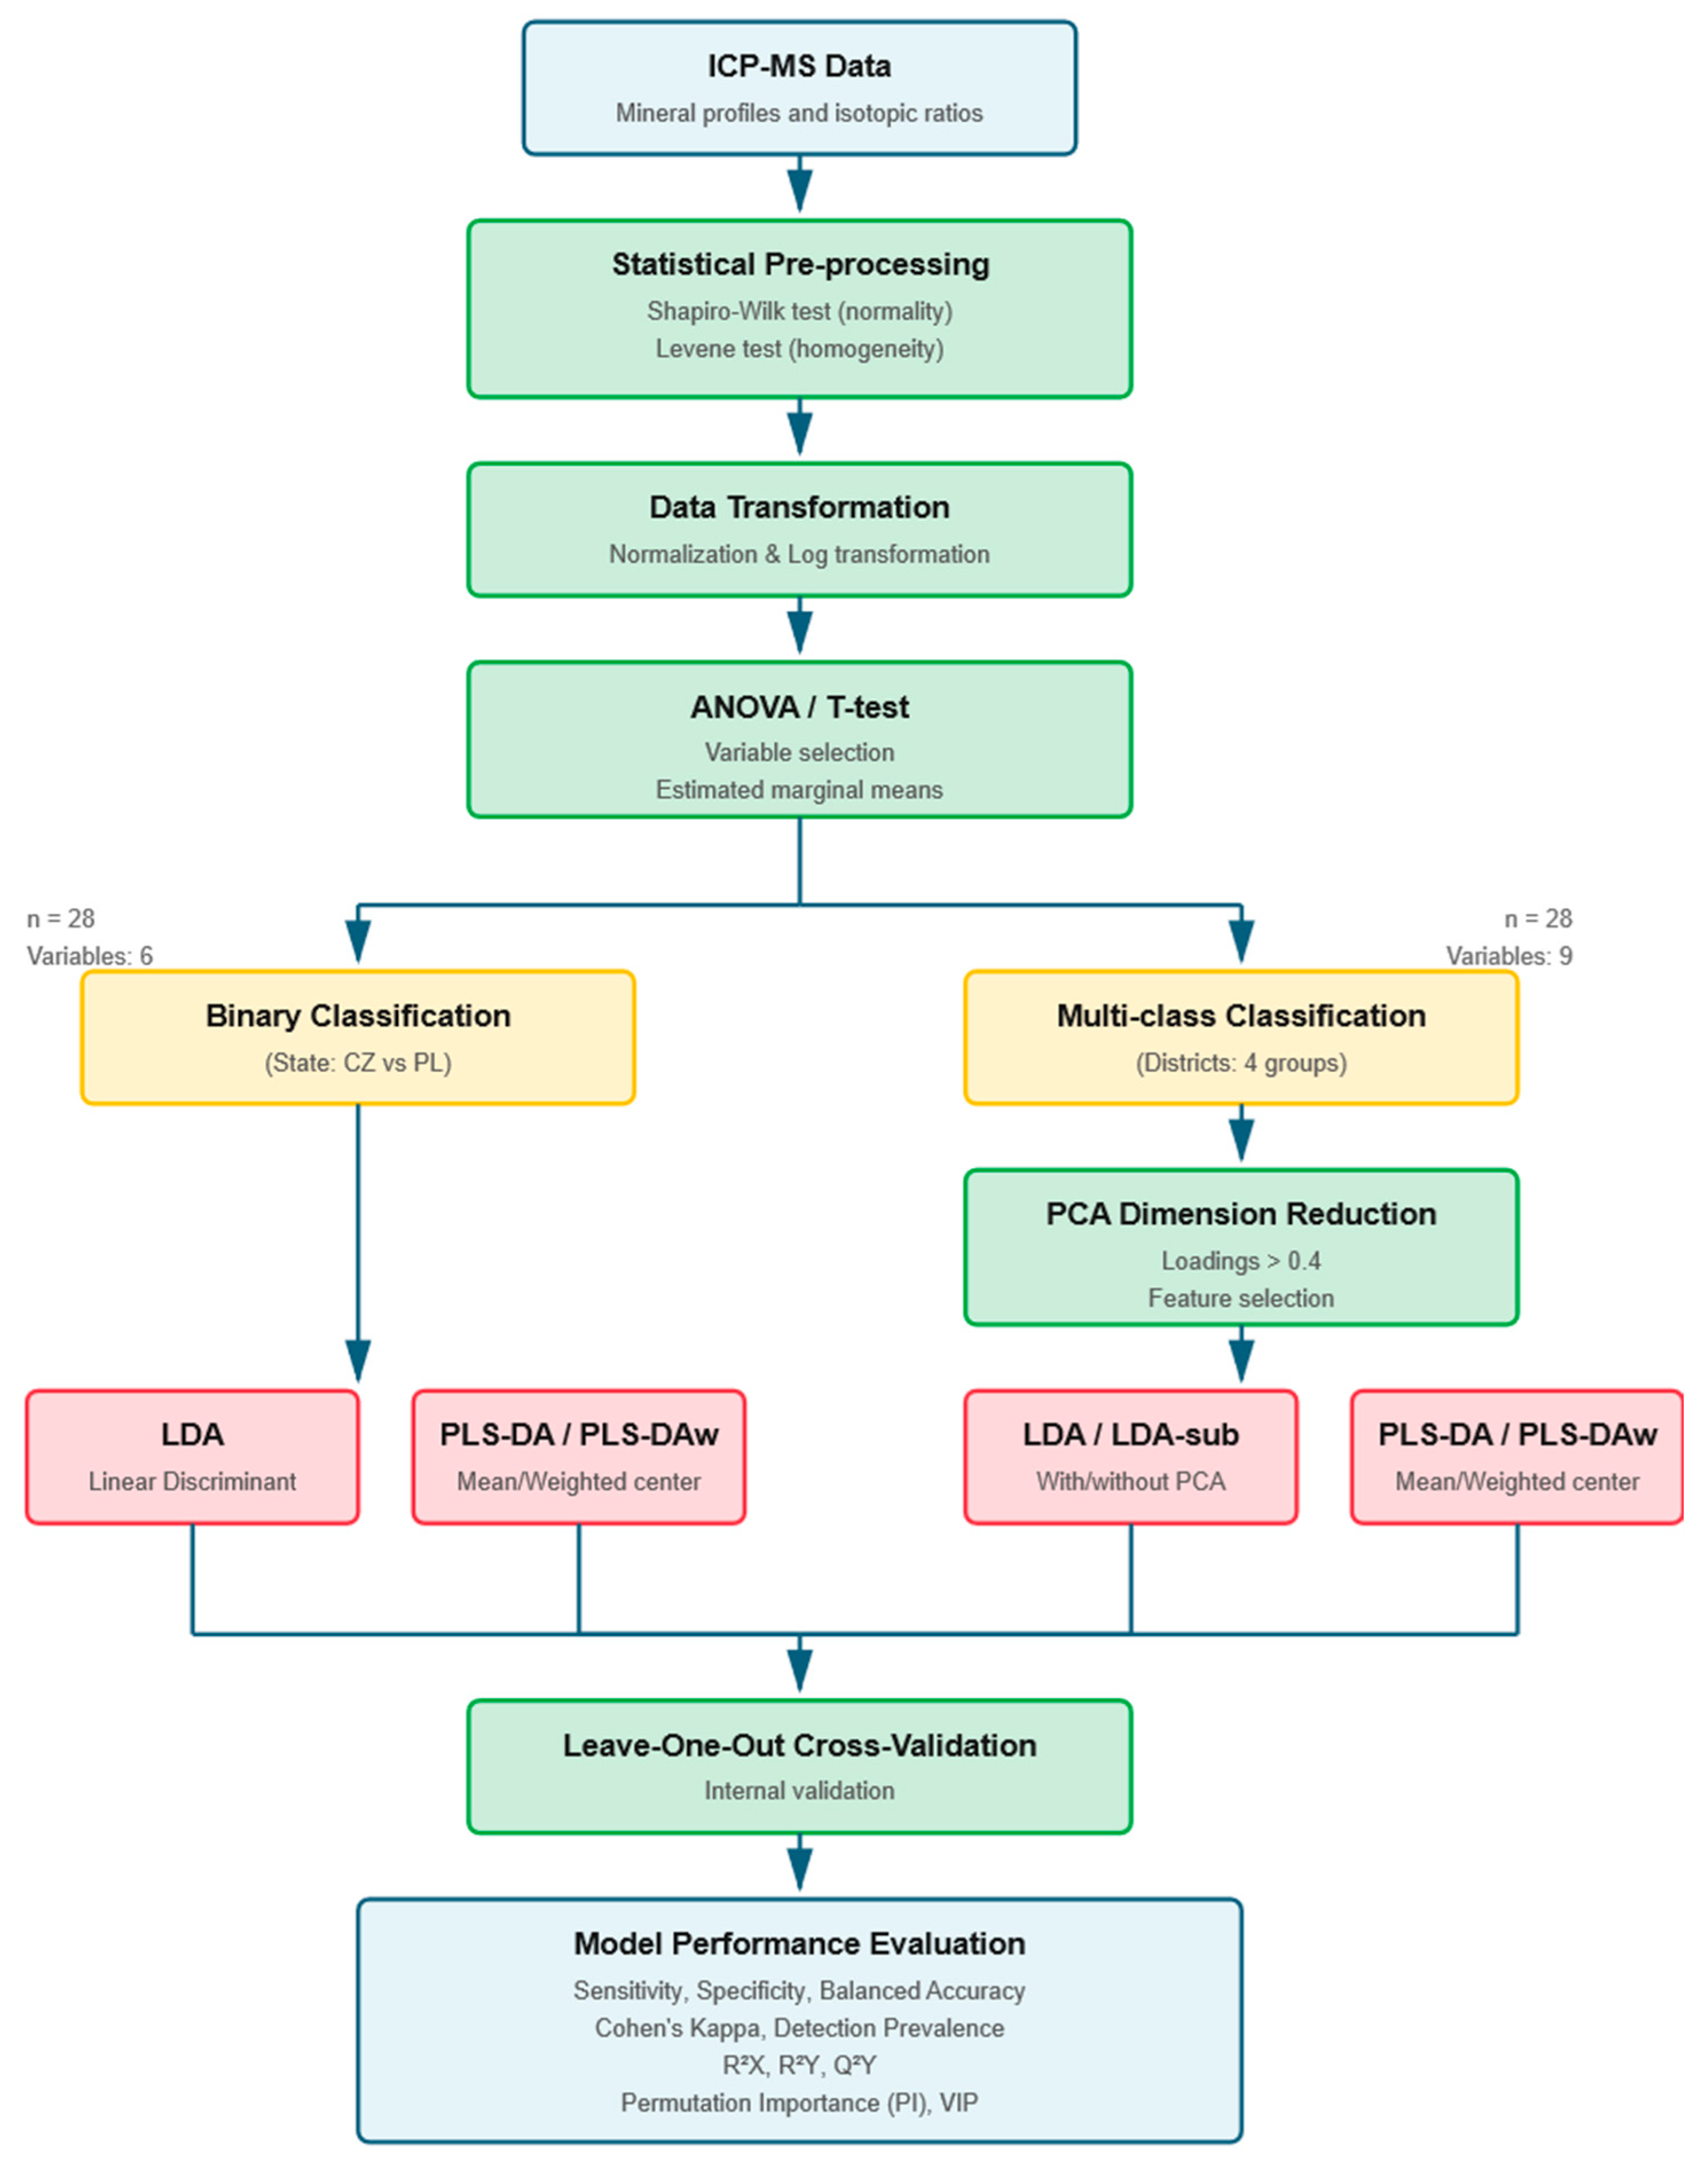
2.2. Mathematical and Statistical Approach
3. Results and Discussion
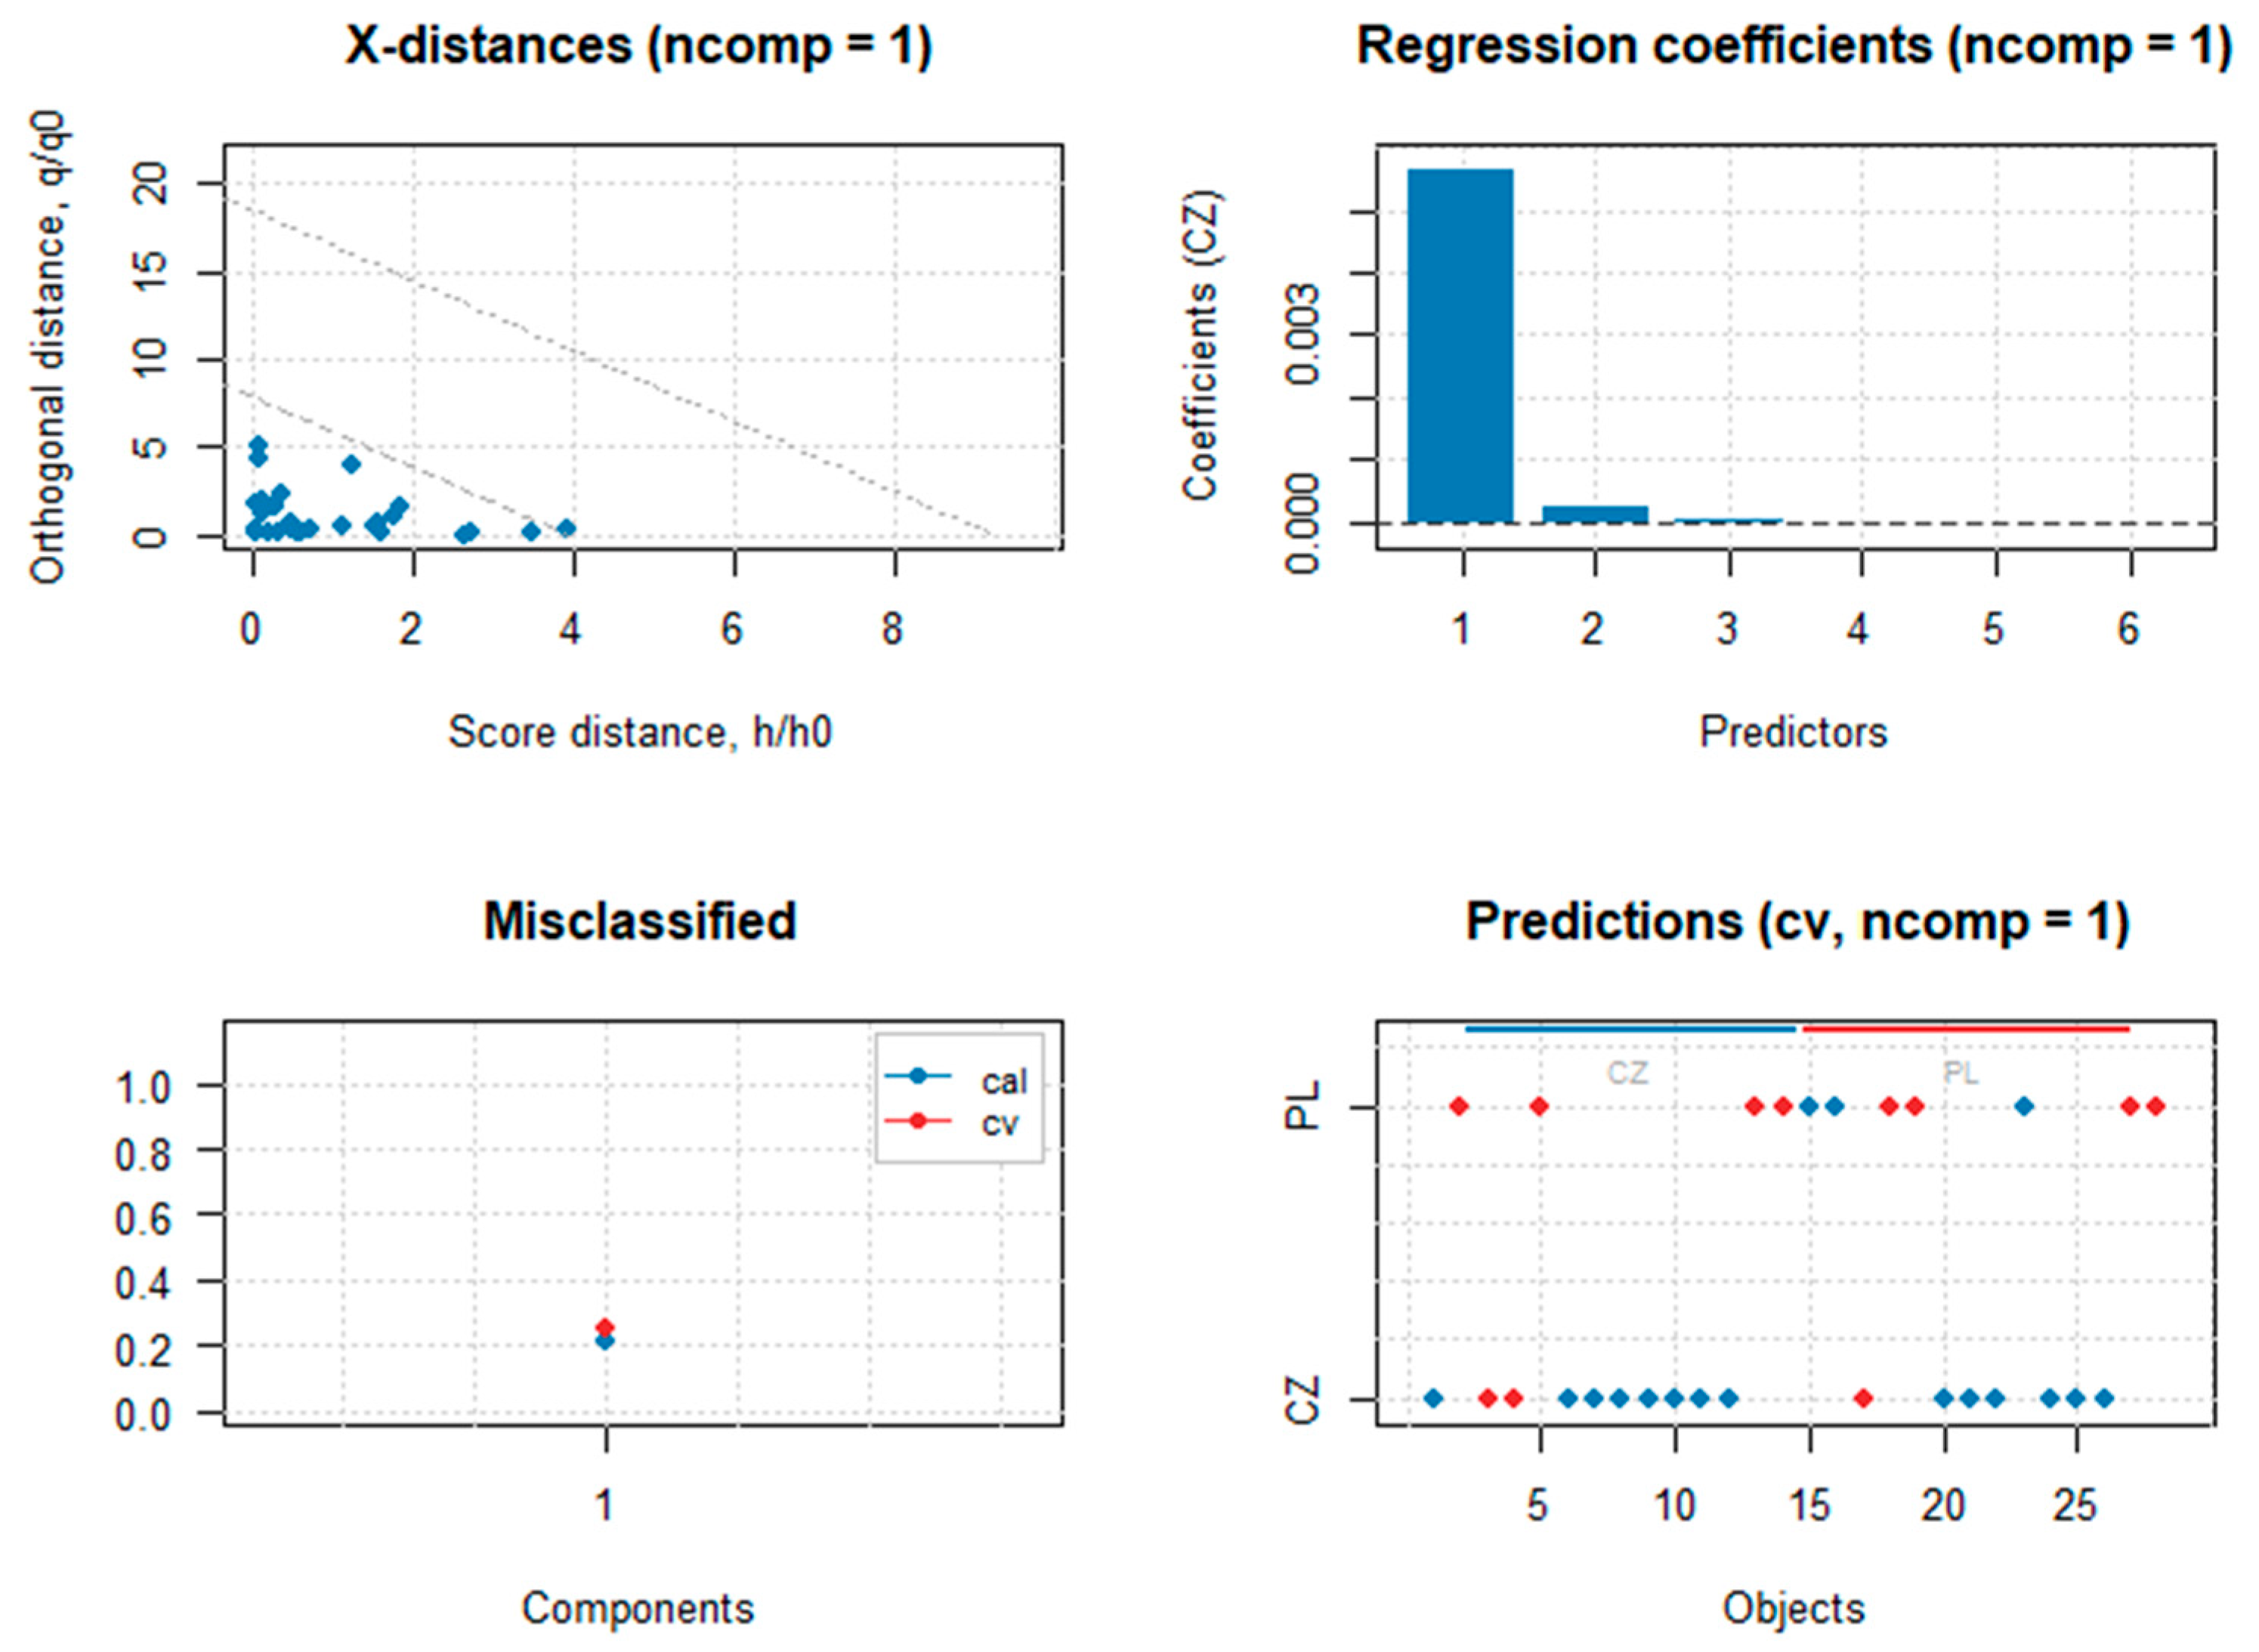
3.1. Classification Between Two Groups with Unequal Sample Size
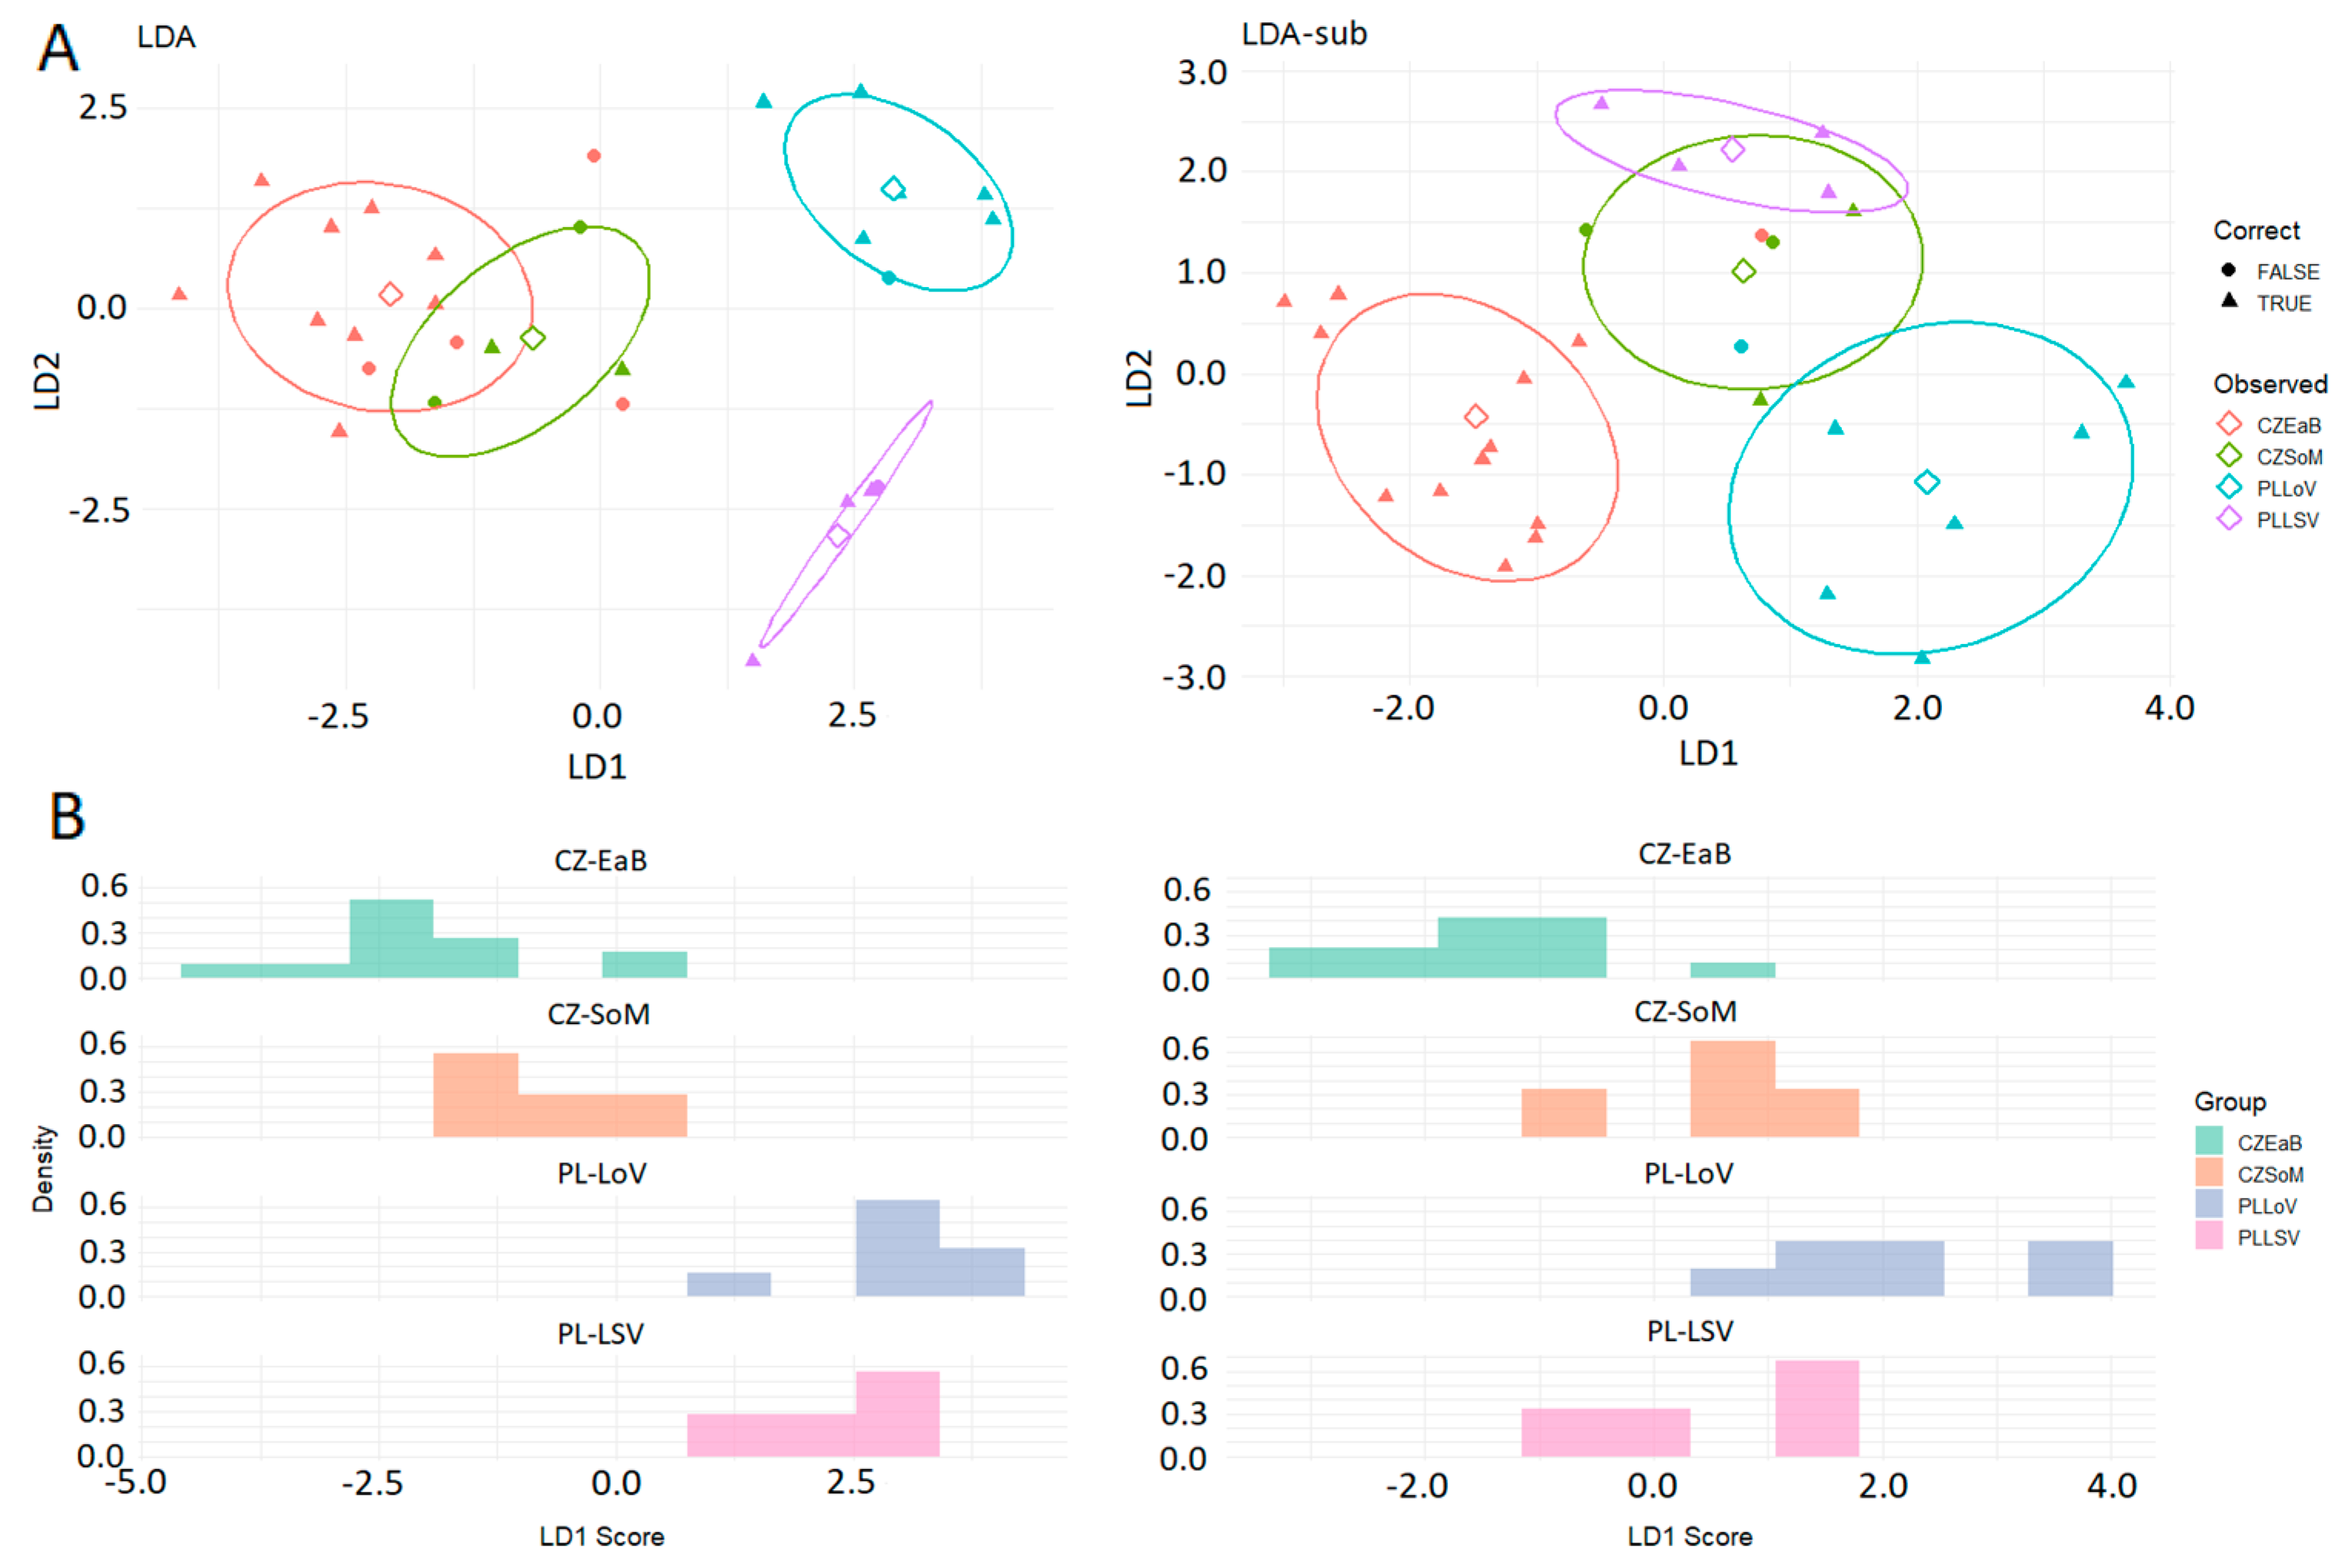
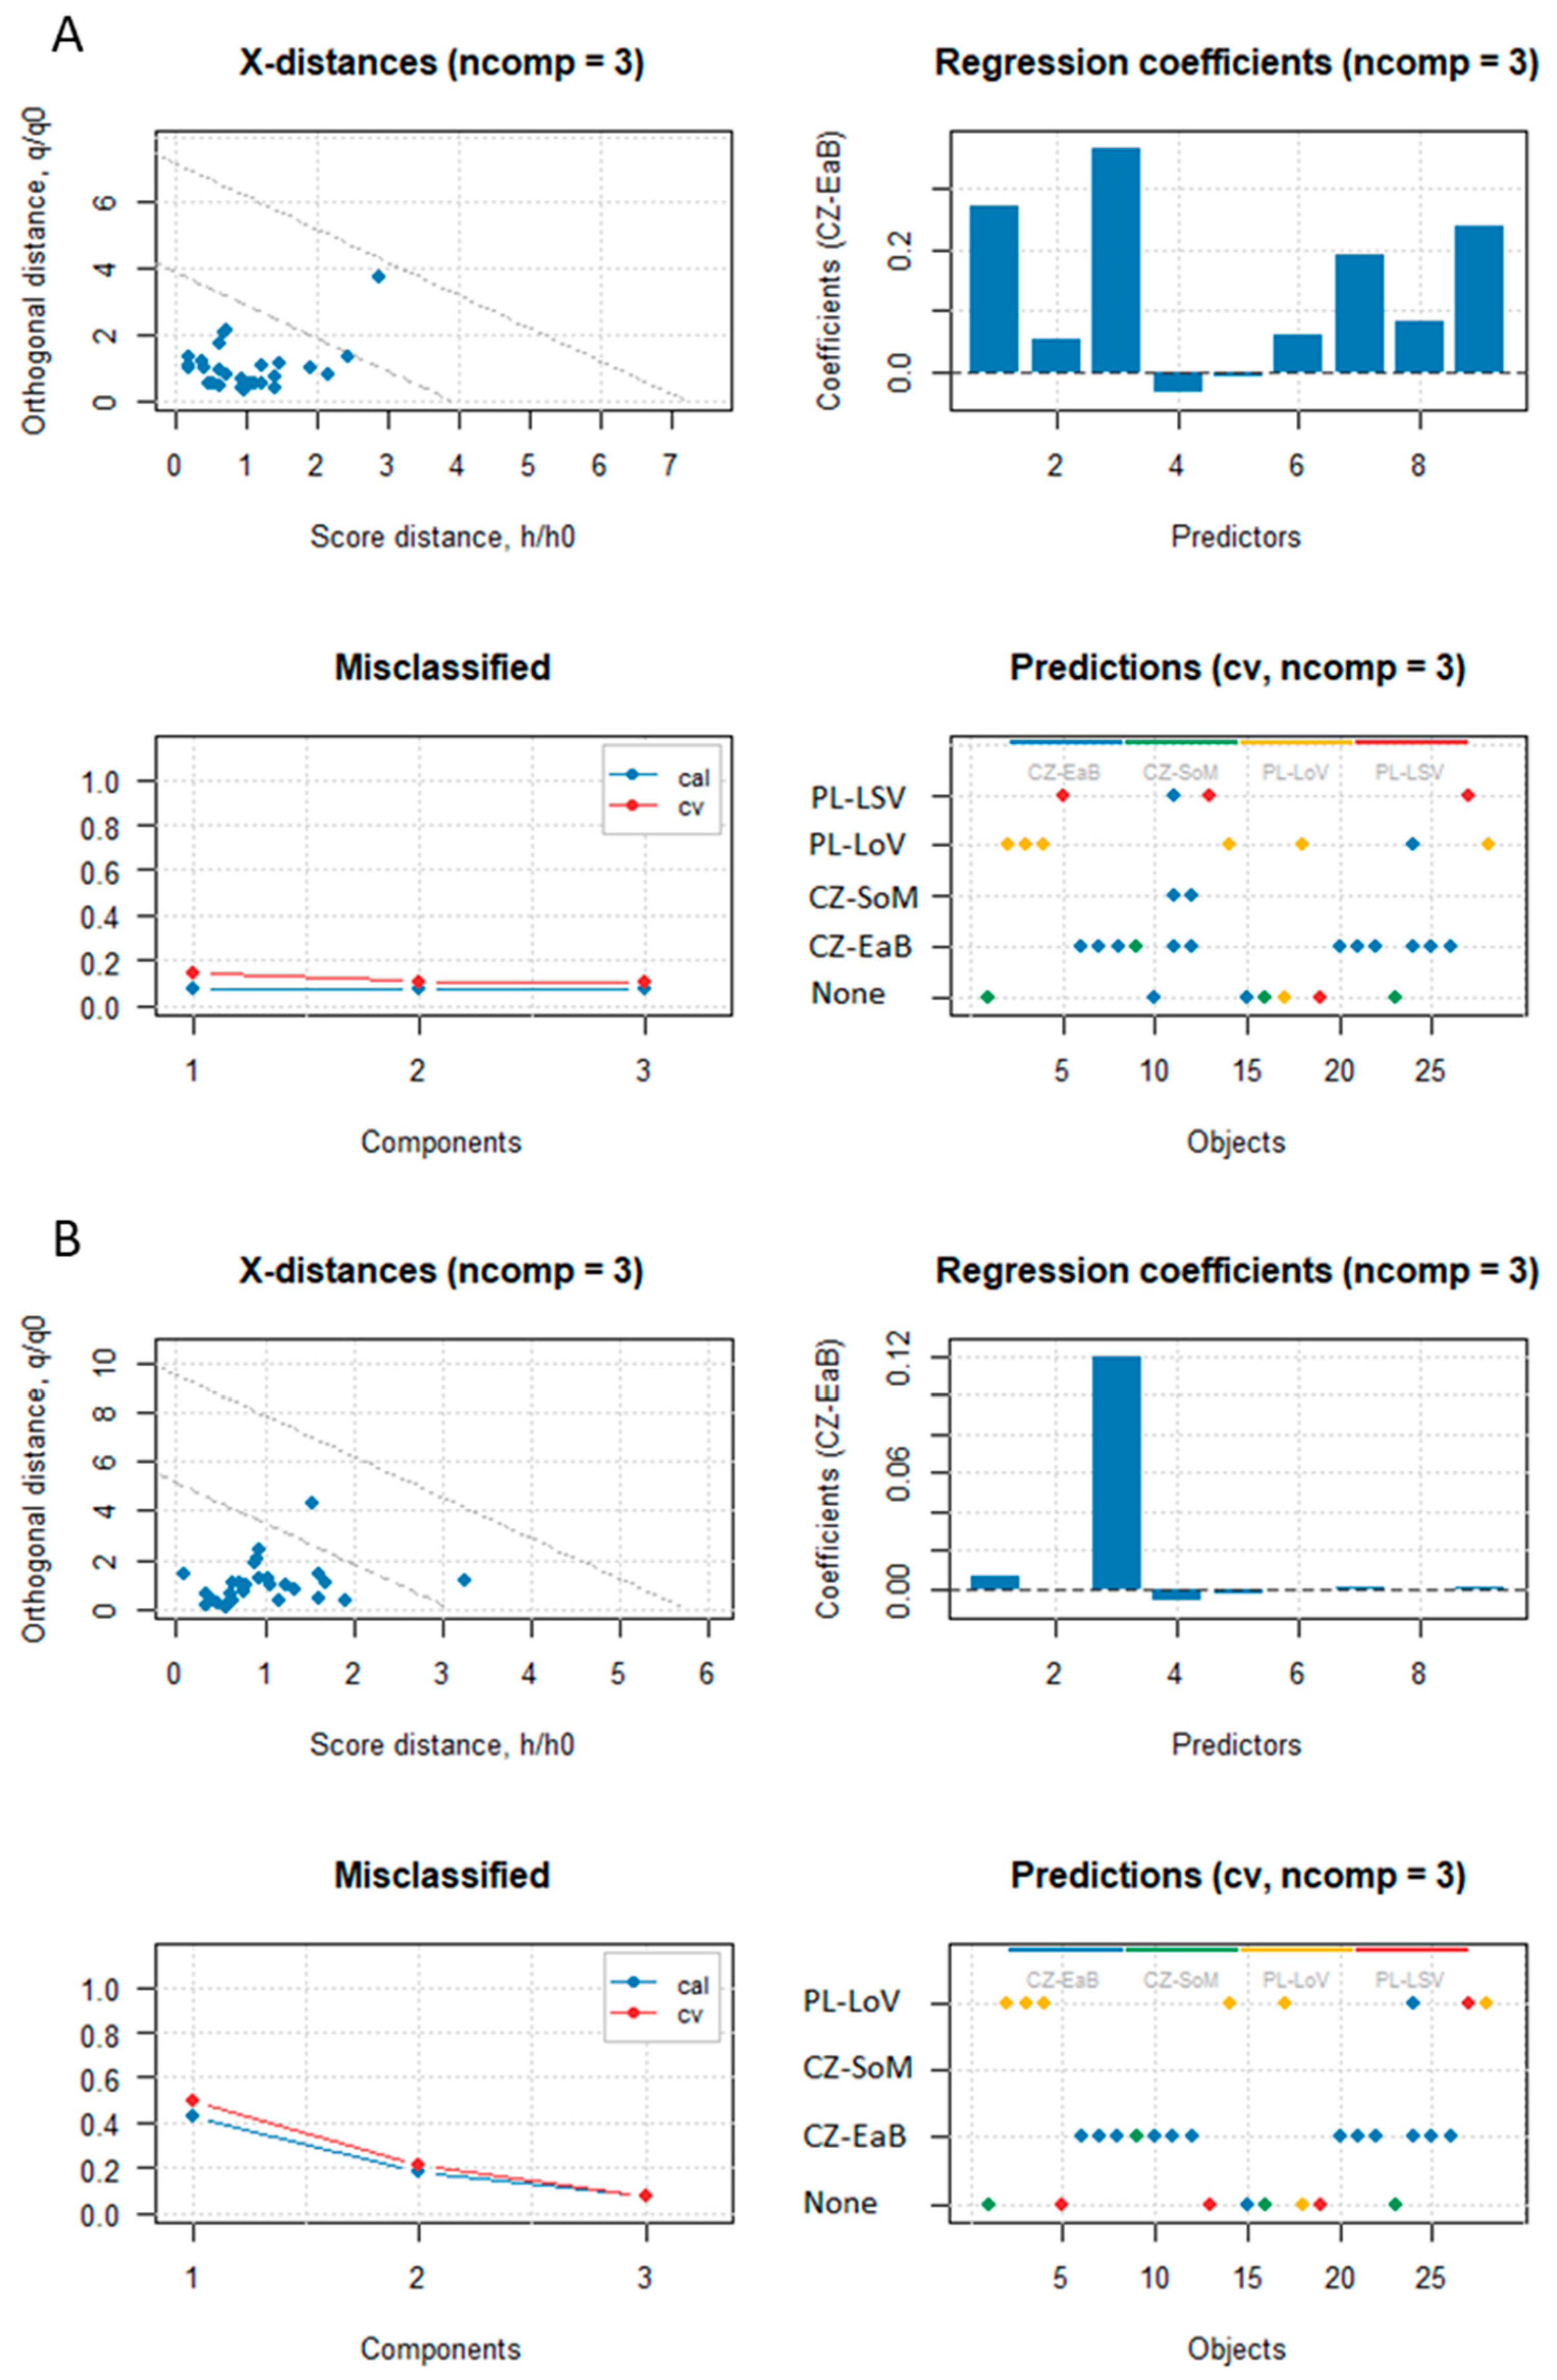
3.2. Classification Between Multiple Groups with Unequal Sample Size
4. Conclusions
Author Contributions
Funding
Data Availability Statement
Acknowledgments
Conflicts of Interest
Appendix A
| P | K | B | Mn | Cu | Co | As | Mo | B1011 | Lokalita | State |
|---|---|---|---|---|---|---|---|---|---|---|
| 567.0225 | 7314.243 | 11.37027 | 3.23651 | 2.49251 | 0.0144 | 0.02632 | 0.07984 | 0.1808 | CZ-SoM | CZ |
| 426.8187 | 7104.698 | 6.07267 | 3.37718 | 1.88254 | 0.01174 | 0.02128 | 0.06024 | 0.182 | PL-LoV | PL |
| 562.5194 | 8042.671 | 7.85781 | 3.71458 | 2.0386 | 0.00792 | 0.02388 | 0.06335 | 0.2015 | PL-LoV | PL |
| 613.122 | 7923.64 | 7.94541 | 3.80785 | 1.20859 | 0.008 | 0.01941 | 0.05944 | 0.1843 | PL-LoV | PL |
| 436.1235 | 5554.112 | 14.09681 | 1.29352 | 1.33092 | 0.0042 | 0.01874 | 0.03412 | 0.1823 | PL-LSV | PL |
| 587.9115 | 6395.028 | 17.67048 | 2.99726 | 1.56571 | 0.01569 | 0.036 | 0.07072 | 0.183 | CZ-EaB | CZ |
| 714.3354 | 7889.28 | 15.20656 | 3.59287 | 2.43352 | 0.00517 | 0.02239 | 0.05968 | 0.2009 | CZ-EaB | CZ |
| 636.3113 | 7306.948 | 16.11135 | 2.85219 | 1.6998 | 0.00442 | 0.02032 | 0.08737 | 0.227 | CZ-EaB | CZ |
| 548.2005 | 6330.344 | 13.25736 | 2.04612 | 2.19365 | 0.01164 | 0.01859 | 0.07436 | 0.221 | CZ-SoM | CZ |
| 608.8251 | 6790.088 | 12.48865 | 2.23684 | 1.86887 | 0.00272 | 0.01615 | 0.08425 | 0.213 | CZ-EaB | CZ |
| 585.5438 | 6148.056 | 18.94618 | 1.99178 | 1.53278 | 0.10202 | 0.04584 | 0.04594 | 0.223 | CZ-EaB | CZ |
| 711.8621 | 7864.707 | 15.59141 | 1.94846 | 2.28718 | 0.00718 | 0.02792 | 0.12621 | 0.2096 | CZ-EaB | CZ |
| 455.9913 | 6325.899 | 8.57509 | 1.66962 | 1.37818 | 0.00814 | 0.0238 | 0.04176 | 0.1915 | PL-LSV | PL |
| 662.5235 | 8427.586 | 6.94006 | 3.02136 | 1.12805 | 0.00587 | 0.01988 | 0.05041 | 0.1893 | PL-LoV | PL |
| 491.0273 | 6271.046 | 10.18624 | 2.00048 | 1.68266 | 0.00973 | 0.02858 | 0.08359 | 0.1806 | CZ-EaB | CZ |
| 489.6918 | 6059.492 | 8.82746 | 2.5081 | 2.77163 | 0.02482 | 0.0358 | 0.08239 | 0.1815 | CZ-SoM | CZ |
| 513.3892 | 8958.226 | 12.6508 | 2.94644 | 2.08915 | 0.00445 | 0.0252 | 0.03932 | 0.2021 | PL-LoV | PL |
| 484.8152 | 7188.742 | 11.54541 | 3.04117 | 1.17256 | 0.00815 | 0.01851 | 0.07094 | 0.1832 | PL-LoV | PL |
| 438.4806 | 6240.847 | 13.66747 | 1.94896 | 1.74549 | 0.03717 | 0.01727 | 0.04603 | 0.1827 | PL-LSV | PL |
| 530.8746 | 6736.301 | 20.83543 | 3.99958 | 1.55271 | 0.01467 | 0.03368 | 0.03377 | 0.1905 | CZ-EaB | CZ |
| 734.9667 | 8666.111 | 16.4817 | 3.13925 | 2.58911 | 0.00449 | 0.02459 | 0.04035 | 0.2008 | CZ-EaB | CZ |
| 575.3769 | 7191.591 | 22.13832 | 2.60921 | 2.19807 | 0.00334 | 0.02027 | 0.04312 | 0.224 | CZ-EaB | CZ |
| 484.9251 | 6108.117 | 10.51293 | 2.17031 | 1.81553 | 0.00801 | 0.01767 | 0.08446 | 0.2 | CZ-SoM | CZ |
| 677.7126 | 9169.346 | 13.53965 | 2.82348 | 1.43075 | 0.0051 | 0.0233 | 0.07631 | 0.228 | CZ-EaB | CZ |
| 606.8075 | 7597.724 | 18.65838 | 3.01845 | 1.26688 | 0.02409 | 0.04233 | 0.08146 | 0.225 | CZ-EaB | CZ |
| 630.3262 | 6904.64 | 13.23887 | 2.14149 | 1.49926 | 0.00523 | 0.03132 | 0.09543 | 0.1966 | CZ-EaB | CZ |
| 365.9668 | 6396.275 | 11.96465 | 1.98325 | 1.57732 | 0.00757 | 0.02434 | 0.04111 | 0.193 | PL-LSV | PL |
| 429.3323 | 7065.08 | 6.89563 | 3.16038 | 1.01286 | 0.00776 | 0.02552 | 0.04801 | 0.1903 | PL-LoV | PL |
References
- Kelly, S.; Heaton, K.; Hoogewerff, J. Tracing the Geographical Origin of Food: The Application of Multi-Element and Multi-Isotope Analysis. Trends Food Sci. Technol. 2005, 16, 555–567. [Google Scholar] [CrossRef]
- Dasenaki, M.E.; Thomaidis, N.S. Quality and Authenticity Control of Fruit Juices—A Review. Molecules 2019, 24, 1014. [Google Scholar] [CrossRef]
- Nguyen, Q.T.; Nguyen, T.T.; Le, V.N.; Nguyen, N.T.; Truong, N.M.; Hoang, M.T.; Pham, T.P.T.; Bui, Q.M. Towards a Standardized Approach for the Geographical Traceability of Plant Foods Using Inductively Coupled Plasma Mass Spectrometry (ICP-MS) and Principal Component Analysis (PCA). Foods 2023, 12, 1848. [Google Scholar] [CrossRef]
- Rajapaksha, D.; Waduge, V.; Padilla-Alvarez, R.; Kalpage, M.; Rathnayake, R.M.N.P.; Migliori, A.; Frew, R.; Abeysinghe, S.; Abrahim, A.; Amarakoon, T. XRF to support food traceability studies: Classification of Sri Lankan tea based on their region of origin. X-Ray Spectrom. 2017, 46, 220–224. [Google Scholar] [CrossRef]
- Obeidat, S.M.; Hammoudeh, A.Y.; Alomary, A.A. Application of FTIR Spectroscopy for Assessment of Green Coffee Beans According to Their Origin. J. Appl. Spectrosc. 2018, 84, 1051–1055. [Google Scholar] [CrossRef]
- Lim, C.M.; Carey, M.; Williams, P.N.; Koidis, A. Rapid classification of commercial teas according to their origin and type using elemental content with X-ray fluorescence (XRF) spectroscopy. Curr. Res. Food Sci. 2021, 4, 45–52. [Google Scholar] [CrossRef]
- Mazarakioti, E.C.; Karavoltsos, S.; Sakellari, A.; Kourou, M.; Sakellari, A.; Dassenakis, E. Inductively Coupled Plasma–Mass Spectrometry (ICP-MS), a Useful Tool in Authenticity of Agricultural Products’ and Foods’ Origin. Foods 2022, 11, 3705. [Google Scholar] [CrossRef]
- Mo, R.; Zheng, Y.; Ni, Z.; Shen, D.; Liu, Y. The Phytochemical Components of Walnuts and Their Application for Geographical Origin Based on Chemical Markers. Food Qual. Saf. 2022, 6, fyac052. [Google Scholar] [CrossRef]
- Elefante, A.; Giglio, M.; Mongelli, L.; Bux, A.; Zifarelli, A.; Menduni, G.; Patimisco, P.; Caratti, A.; Cagliero, C.; Liberto, E.; et al. Spectroscopic Study of Volatile Organic Compounds for the Assessment of Coffee Authenticity. Molecules 2025, 30, 3487. [Google Scholar] [CrossRef]
- Krška, B.; Mészáros, M.; Bílek, T.; Vávra, A.; Náměstek, J.; Sedlák, J. Analysis of Mineral Composition and Isotope Ratio as Part of Chemical Profiles of Apples for Their Authentication. Agronomy 2024, 14, 2703. [Google Scholar] [CrossRef]
- Francini, A.; Fidalgo-Illesca, C.; Raffaelli, A.; Sebastiani, L. Phenolics and Mineral Elements Composition in Underutilized Apple Varieties. Horticulturae 2022, 8, 40. [Google Scholar] [CrossRef]
- Müller, M.-S.; Oest, M.; Scheffler, S.; Horns, A.L.; Paasch, N.; Bachmann, R.; Fischer, M. Food Authentication Goes Green: Method Optimization for Origin Discrimination of Apples Using Apple Juice and ICP-MS. Foods 2024, 13, 3783. [Google Scholar] [CrossRef] [PubMed]
- Fotirić Akšić, M.; Nešović, M.; Ćirić, I.; Tešić, Ž.; Pezo, L.; Tosti, T.; Gašić, U.; Dojčinović, B.; Lončar, B.; Meland, M. Polyphenolics and Chemical Profiles of Domestic Norwegian Apple (Malus × domestica Borkh.) Cultivars. Front. Nutr. 2022, 9, 941487. [Google Scholar] [CrossRef] [PubMed]
- Zhang, J.; Shen, Y.; Ma, N.; Xu, G. Authentication of apples from the Loess Plateau in China based on interannual element fingerprints and multidimensional modelling. Food Chem. 2023, 20, 100948. [Google Scholar] [CrossRef]
- Bechynska, K.; Sedlak, J.; Uttl, L.; Kosek, V.; Vackova, P.; Kocourek, V.; Hajslova, J. Metabolomics on Apple (Malus domestica) Cuticle—Search for Authenticity Markers. Foods 2024, 13, 1308. [Google Scholar] [CrossRef]
- Ballabio, C.; Lugato, E.; Fernández-Ugalde, O.; Orgiazzi, A.; Jones, A.; Borrelli, P.; Montanarella, L.; Panagos, P. Mapping LUCAS Topsoil Chemical Properties at European Scale Using Gaussian Process Regression. Geoderma 2019, 355, 113912. [Google Scholar] [CrossRef]
- Wang, F.; Wu, X.; Ding, Y.; Liu, X.; Wang, X.; Gao, Y.; Tian, J.; Li, X. Study of the Effects of Spraying Non-Bagging Film Agent on the Contents of Mineral Elements and Flavonoid Metabolites in Apples. Horticulturae 2024, 10, 198. [Google Scholar] [CrossRef]
- Mandache, M.B.; Cosmulescu, S. Mineral Content of Apple, Sour Cherry and Peach Pomace and the Impact of Their Application on Bakery Products. Foods 2025, 14, 3146. [Google Scholar] [CrossRef]
- Jolliffe, I.T.; Cadima, J. Principal component analysis: A review and recent developments. Philos. Trans. R. Soc. A Math. Phys. Eng. Sci. 2016, 374, 20150202. [Google Scholar] [CrossRef]
- Truzzi, E.; Marchetti, L.; Piazza, D.V.; Bertelli, D. Multivariate Statistical Models for the Authentication of Traditional Balsamic Vinegar of Modena and Balsamic Vinegar of Modena on 1H-NMR Data: Comparison of Targeted and Untargeted Approaches. Foods 2023, 12, 1467. [Google Scholar] [CrossRef]
- Sotiropoulou, N.S.; Xagoraris, M.; Revelou, P.K.; Kaparakou, E.; Kanakis, C.; Pappas, C.; Tarantilis, P. The Use of SPME-GC-MS IR and Raman Techniques for Botanical and Geographical Authentication and Detection of Adulteration of Honey. Foods 2021, 10, 1671. [Google Scholar] [CrossRef] [PubMed]
- Karadžić Banjac, M.; Kovačević, S.; Podunavac-Kuzmanović, S. Ongoing Multivariate Chemometric Approaches in Bioactive Compounds and Functional Properties of Foods—A Systematic Review. Processes 2024, 12, 583. [Google Scholar] [CrossRef]
- Li, W.; Zhao, C.; Zhang, Y.; Wang, X.; Chen, Y.; Liu, D. Hyperspectral Imaging for Foreign Matter Detection in Foods: Combining PCA and LDA Models. Foods 2025, 14, 3026. [Google Scholar] [CrossRef]
- McLachlan, G.J. Discriminant Analysis and Statistical Pattern Recognition; Wiley: Hoboken, NJ, USA, 2004. [Google Scholar]
- Hou, Z.; Jin, Y.; Gu, Z.; Zhang, R.; Su, Z.; Liu, S. 1H NMR Spectroscopy Combined with Machine-Learning Algorithm for Origin Recognition of Chinese Famous Green Tea Longjing Tea. Foods 2024, 13, 2702. [Google Scholar] [CrossRef]
- Varrà, M.O.; Ghidini, S.; Husáková, L.; Ianieri, A.; Zanardi, E. Advances in Troubleshooting Fish and Seafood Authentication by Inorganic Elemental Composition. Foods 2021, 10, 270. [Google Scholar] [CrossRef] [PubMed]
- Barker, W.; Rayens, W. Partial least squares for discrimination. J. Chemom. 2003, 17, 166–173. [Google Scholar] [CrossRef]
- Hamid, H.; Zainon, F.; Yong, T.P. Performance analysis: An integration of principal component analysis and linear discriminant analysis for a very large number of measured variables. Res. J. Appl. Sci. 2016, 11, 1422–1426. [Google Scholar]
- Barbosa, S.; Saurina, J.; Puignou, L.; Núñez, O. Classification and Authentication of Paprika by UHPLC-HRMS Fingerprinting and Multivariate Calibration Methods (PCA and PLS-DA). Foods 2020, 9, 486. [Google Scholar] [CrossRef]
- Zhang, H.; Wu, L.; Li, D.; Li, J.; Wang, C.; Chen, J. Characterization and Discrimination of Apples by Flash GC E-Nose. Foods 2022, 11, 1631. [Google Scholar]
- Breiman, L. Random Forests. Mach. Learn. 2001, 45, 5–32. [Google Scholar] [CrossRef]
- Friedman, J.H. Greedy Function Approximation: A Gradient Boosting Machine. Ann. Stat. 2001, 29, 1189–1232. [Google Scholar] [CrossRef]
- Kim, J.-H. Estimating classification error rate: Repeated cross-validation, repeated hold-out and bootstrap. Comput. Stat. Data Anal. 2009, 53, 3735–3745. [Google Scholar] [CrossRef]
- Papadopoulou, O.S.; Pappa, E.C.; Goliopoulos, A.; Lioliou, A.; Kontakos, S.; Papadopoulou, S.K. Chemometric Classification of Feta Cheese Authenticity via ATR-FTIR Spectroscopy. Appl. Sci. 2023, 15, 8272. [Google Scholar] [CrossRef]
- Lytovchenko, A.; Stepanova, N.; Shapoval, O.; Skoryk, M.; Korchynska, L.; Ostapchuk, A.; Hovorun, D. Authentication of Laying Hen Housing Systems Based on Egg Yolk Using 1H NMR Spectroscopy and Machine Learning. Foods 2025, 13, 1098. [Google Scholar] [CrossRef]
- Brereton, R.G. Consequences of sample size, variable selection, and model validation and optimisation, for predicting classification ability from analytical data. Trends Anal. Chem. 2006, 25, 11. [Google Scholar] [CrossRef]
- Brereton, R.G.; Lloyd, G.R. Partial least squares discriminant analysis: Taking the magic away. J. Chemom. 2014, 28, 213–225. [Google Scholar] [CrossRef]
- Hoyle, C.H. Automatic PCA Dimension Selection for High Dimensional Data and Small Sample Sizes. J. Mach. Learn. Res. 2008, 9, 2733–2759. Available online: https://www.jmlr.org/papers/volume9/hoyle08a/hoyle08a.pdf (accessed on 10 September 2025).
- Rashid, N.A.; Hussain, W.S.E.C.; Ahmad, A.R.; Abdullah, F.N. Performance of Classification Analysis: A Comparative Study between PLS-DA and Integrating PCA+LDA. Math. Stat. 2019, 7, 24–28. [Google Scholar] [CrossRef]
- Zbíral, J. Analýza Rostlinného Materiálu: Jednotné Pracovní Postupy, 3rd ed.; ÚKZÚZ: Brno, Czech Republic, 2014. [Google Scholar]
- Lenth, R. emmeans: Estimated Marginal Means, aka Least-Squares Means; R package version 1.10.6. 2024. Available online: https://CRAN.R-project.org/package=emmeans (accessed on 9 October 2025).
- Thevenot, E.A.; Roux, A.; Xu, Y.; Ezan, E.; Junot, C. Analysis of the Human Adult Urinary Metabolome Variations with Age, Body Mass Index and Gender by Implementing a Comprehensive Workflow for Univariate and OPLS Statistical Analyses. J. Proteome Res. 2015, 14, 3322–3335. [Google Scholar] [CrossRef] [PubMed]
- Kucheryavskiy, S. mdatools—R Package for Chemometrics. Chemom. Intell. Lab. Syst. 2020, 198, 103937. [Google Scholar] [CrossRef]
- Liland, K.; Mevik, B.; Wehrens, R. pls: Partial Least Squares and Principal Component Regression; R Package Version 2.8-5. 2024. Available online: https://CRAN.R-project.org/package=pls (accessed on 9 October 2025).
- Kuhn, M. Building Predictive Models in R Using the caret Package. J. Stat. Softw. 2008, 28, 1–26. [Google Scholar] [CrossRef]
- Gamer, M.; Lemon, J. irr: Various Coefficients of Interrater Reliability and Agreement; R Package Version 0.84.1. 2019. Available online: https://CRAN.R-project.org/package=irr (accessed on 9 October 2025).
- Venables, W.N.; Ripley, B.D. Modern Applied Statistics with S, 4th ed.; Springer: New York, NY, USA, 2002; ISBN 0-387-95457-0. [Google Scholar]
- Wickham, H. ggplot2: Elegant Graphics for Data Analysis; Springer: New York, NY, USA, 2016. [Google Scholar]
- Ahmad, N.A. Numerically stable locality-preserving partial least squares discriminant analysis for efficient dimensionality reduction and classification of high-dimensional data. Heliyon 2024, 10, e26157. [Google Scholar] [CrossRef] [PubMed]
- Hastie, T.; Friedman, J.; Tibshirani, R. The Elements of Statistical Learning-Data Mining, Inference, and Prediction, 1st ed.; Springer Nature: New York, NY, USA, 2001; ISBN 978-0-387-21606-5. [Google Scholar]


| LDA | LDAsub | PLS-DA | PLS-DAw | |
|---|---|---|---|---|
| Sensitivity | 0.941 | 1.000 | 0.824 | 0.824 |
| Specificity | 1.000 | 1.000 | 0.636 | 0.636 |
| Bal. accuracy | 0.971 | 1.000 | 0.701 | 0.701 |
| Detec. prevalence | 0.571 | 0.607 | 0.500 | 0.500 |
| p-value/pR2Y/pQ2Y | <0.001 | <0.001 | 0.167 | 0.167 |
| Kappa | 0.926 | 1.000 | 0.401 | 0.401 |
| Variable | LDA Model | Variable | PLS-DA Model | |||
|---|---|---|---|---|---|---|
| PI Median | IQR | VIP Median | IQR | Freq_VIP | ||
| P | 0.1429 | 0.0714 | B | 1.3924 | 0.1292 | 1.00 |
| Mo | 0.0714 | 0.0714 | P | 1.2111 | 0.1909 | 1.00 |
| B | 0.0358 | 0.0357 | 10B/11B | 1.1026 | 0.1106 | 0.80 |
| Cu | 0.0357 | 0.0357 | Mo | 1.0675 | 0.2703 | 1.00 |
| As | 0.0357 | 0.0357 | Cu | 1.0601 | 0.1296 | 0.60 |
| 10B/11B | 0.0357 | 0.0357 | As | 0.9666 | 0.0523 | 0.20 |
| Model | Districts | Sensitivity | Specificity | Detec. Prevalence | Bal. Accuracy | p-Value | Kappa |
|---|---|---|---|---|---|---|---|
| LDA | CZ-EaB | 0.692 | 0.867 | 0.393 | 0.780 | 0.007 | 0.592 |
| CZ-SoM | 0.500 | 0.917 | 0.143 | 0.708 | |||
| PL-LoV | 0.857 | 0.905 | 0.286 | 0.881 | |||
| PL-LSV | 0.750 | 0.917 | 0.179 | 0.833 | |||
| LDA-sub | CZ-EaB | 0.923 | 0.933 | 0.464 | 0.928 | <0.001 | 0.791 |
| CZ-SoM | 0.500 | 0.958 | 0.107 | 0.729 | |||
| PL-LoV | 0.857 | 1.000 | 0.214 | 0.929 | |||
| PL-LSV | 1.000 | 0.917 | 0.214 | 0.958 | |||
| PLS-DA | CZ-EaB | 0.893 | 0.933 | 0.392 | 0.913 | <0.001 | 0.895 |
| CZ-SoM | 0.786 | 0.917 | 0.000 | 0.851 | |||
| PL-LoV | 0.929 | 0.952 | 0.214 | 0.941 | |||
| PL-LSV | 0.929 | 0.958 | 0.107 | 0.944 | |||
| PLS-DAw | CZ-EaB | 0.923 | 0.933 | 0.429 | 0.929 | 0.041 | 0.780 |
| CZ-SoM | 0.000 | 1.000 | 0.000 | 0.857 | |||
| PL-LoV | 0.857 | 0.905 | 0.214 | 0.893 | |||
| PL-LSV | 0.000 | 1.000 | 0.000 | 0.857 |
| Variable | LDA Model | Variable | PLS-DA Model | |||
|---|---|---|---|---|---|---|
| PI Median | IQR | VIP Median | IQR | Freq_VIP | ||
| K | 6.0892 | 7.5709 | B | 1.3453 | 0.1112 | 0.95 |
| P | 5.1379 | 6.3081 | Mn | 1.2393 | 0.1251 | 1.00 |
| Mn | 4.7401 | 4.1554 | P | 1.2372 | 0.1049 | 0.96 |
| Co | 4.5024 | 8.0422 | K | 1.1443 | 0.1239 | 0.01 |
| B | 4.1656 | 4.4187 | 10B/11B | 0.9528 | 0.1403 | 1.00 |
| Mo | 4.0034 | 4.1890 | As | 0.7732 | 0.1695 | 0.03 |
| As | 3.5151 | 4.4595 | Mo | 0.7715 | 0.2022 | 0.02 |
| Cu | 3.4724 | 3.2303 | Cu | 0.6587 | 0.2722 | 0.02 |
| 10B/11B | 3.4369 | 4.1250 | Co | 0.3743 | 0.1184 | 0.32 |
Disclaimer/Publisher’s Note: The statements, opinions and data contained in all publications are solely those of the individual author(s) and contributor(s) and not of MDPI and/or the editor(s). MDPI and/or the editor(s) disclaim responsibility for any injury to people or property resulting from any ideas, methods, instructions or products referred to in the content. |
© 2025 by the authors. Licensee MDPI, Basel, Switzerland. This article is an open access article distributed under the terms and conditions of the Creative Commons Attribution (CC BY) license (https://creativecommons.org/licenses/by/4.0/).
Share and Cite
Mészáros, M.; Sedlák, J.; Bílek, T.; Vávra, A. Evaluating LDA and PLS-DA Algorithms for Food Authentication: A Chemometric Perspective. Algorithms 2025, 18, 733. https://doi.org/10.3390/a18120733
Mészáros M, Sedlák J, Bílek T, Vávra A. Evaluating LDA and PLS-DA Algorithms for Food Authentication: A Chemometric Perspective. Algorithms. 2025; 18(12):733. https://doi.org/10.3390/a18120733
Chicago/Turabian StyleMészáros, Martin, Jiří Sedlák, Tomáš Bílek, and Aleš Vávra. 2025. "Evaluating LDA and PLS-DA Algorithms for Food Authentication: A Chemometric Perspective" Algorithms 18, no. 12: 733. https://doi.org/10.3390/a18120733
APA StyleMészáros, M., Sedlák, J., Bílek, T., & Vávra, A. (2025). Evaluating LDA and PLS-DA Algorithms for Food Authentication: A Chemometric Perspective. Algorithms, 18(12), 733. https://doi.org/10.3390/a18120733


