Article

Interpretable Machine Learning for Coronary Artery Disease Risk Stratification: A SHAP-Based Analysis

by
Nurdaulet Tasmurzayev
1,
Zhanel Baigarayeva
1,2,*,
Bibars Amangeldy
1,
Baglan Imanbek
1,*,
Shugyla Kurmanbek
1,2,
Gulmira Dikhanbayeva
3 and
Gulshat Amirkhanova
1
1
Faculty of Information Technologies and Artificial Intelligence, Al-Farabi Kazakh National University, Almaty 050040, Kazakhstan
2
LLP Kazakhstan R&D Solutions Co., Ltd., Almaty 050056, Kazakhstan
3
Faculty of Postgraduate Higher Medical Education, Akhmet Yasawi University, Shymkent 161200, Kazakhstan
*
Authors to whom correspondence should be addressed.
Algorithms 2025, 18(11), 697; https://doi.org/10.3390/a18110697
Submission received: 24 September 2025 / Revised: 30 October 2025 / Accepted: 31 October 2025 / Published: 3 November 2025

Abstract

Coronary artery disease (CAD) is a leading cause of global mortality, demanding accurate and early risk assessment. While machine learning models offer strong predictive power, their clinical adoption is often hindered by a lack of transparency and reliability. This study aimed to develop and rigorously evaluate a calibrated, interpretable machine learning framework for CAD prediction using 56 routinely collected clinical and demographic variables from the Z-Alizadeh Sani dataset (n = 303). A systematic protocol involving comprehensive preprocessing, class rebalancing using SMOTE, and grid-search hyperparameter tuning was applied to five distinct classifiers. The XGBoost model demonstrated the highest predictive performance, achieving an accuracy of 0.9011, an F1 score of 0.8163, and an Area Under the Receiver Operating Characteristic Curve (AUC) of 0.92. Post hoc interpretability analysis using SHAP (Shapley Additive Explanations) identified HTN, valvular heart disease (VHD), and diabetes mellitus (DM) as the most significant predictors of CAD. Furthermore, calibration analysis confirmed that the mode’s probability estimates are reliable for clinical risk stratification. This work presents a robust framework that combines high predictive accuracy with clinical interpretability, offering a promising tool for early CAD screening and decision support.

1. Introduction

Ischemic heart disease (IHD) is one of the most prevalent cardiovascular diseases worldwide, affecting an estimated 5–8% of the adult population [1,2,3]. In the United States, the prevalence among adults is approximately 7.1%, while in Europe it is around 5.1%. Large-scale studies confirm that IHD affects millions of people [2,3]. Moreover, variations in data collection and diagnosis lead to substantial discrepancies in reported rates, underscoring the need for standardized approaches like those used in Global Burden of Disease (GBD) studies [4,5]. The global burden of the disease remains particularly high in low- and middle-income countries, where limited resources, shifting risk profiles, and population growth exacerbate the situation and contribute to an increase in the absolute number of IHD cases [3].
Such widespread prevalence dictates the need for a deep understanding of the factors contributing to the development and progression of this multifactorial disease, which is based on both physiological and psychological triggers. One of the key independent risk factors is hypertension, which provokes atherosclerotic changes through vascular remodeling, endothelial dysfunction, and increased arterial stiffness [6]. Components of metabolic syndrome—including obesity, insulin resistance, and diabetes mellitus—also make a significant contribution, accelerating atherogenesis through dyslipidemia and damage to vessel walls by advanced glycation end products [7].
In addition to classic metabolic factors, psychological stress, depression, and anxiety are recognized as independent risk factors [8]. They influence the development of IHD both physiologically, by causing dysregulation of the autonomic nervous system and increasing levels of inflammatory markers and stress hormones, and behaviorally, by promoting harmful habits such as smoking, poor diet, and low physical activity. A frequent and formidable consequence of IHD is congestive heart failure (CHF), which serves as both an outcome of the disease and a factor that exacerbates its course. Patients with IHD and concomitant heart failure have significantly higher mortality rates, underscoring the importance of early detection and prevention of disease progression [9]. For accurate diagnosis and risk stratification, quantitative assessment of IHD is crucial, for which coronary computed tomography angiography (CCTA) is actively used. Modern approaches are shifting from simple qualitative descriptions (the presence or absence of plaques) to standardized quantitative methods such as CAD-RADS 2.0, which allow for a more precise evaluation of stenosis severity and the identification of vulnerable plaques prone to rupture [4].
Despite an understanding of individual risk factors, existing IHD prediction models, such as the Framingham Risk Score, have significant limitations. Their main drawback is an oversimplified approach: they consider risk factors in an isolated and additive manner, ignoring complex nonlinear interactions and synergistic effects between them. For example, they cannot fully assess how diabetes and hypertension influence each other to increase overall risk. This reduces the accuracy of prognoses for patients with multiple comorbidities.
Research using the Z-Alizadeh Sani dataset began with the application of traditional statistical learning and classical machine learning algorithms but quickly evolved toward more complex hybrid and ensemble approaches, all driven by a primary focus on maximizing predictive accuracy. Early works laid the foundation: for example, Hu et al. used a statistical finite mixture model for clustering, achieving an accuracy of 81.84% [9], while Kemal Akyol focused on hyperparameter optimization for SVMs, reaching 87.10% [5,10]. Even early neural network models, such as the one by Ali and Bukhari, were aimed at this goal, albeit with a moderate result of 76.92% [5].
This emphasis on accuracy intensified with the emergence of hybrid methods that combined the strengths of multiple algorithms. Such approaches proved particularly valuable for handling complex clinical data, with researchers like Nasarian et al. achieving 92.58% accuracy by combining feature selection with XGBoost [9,11], and Dekamin and Sheibatolhamdi reporting an impressive 95.83% with a model unifying Naïve Bayes, decision trees, and KNN [12]. Further complexity was introduced through methods like Particle Swarm Optimization (PSO) combined with neural networks [13] and genetic algorithms to optimize network architectures [13,14]. The culmination of this trend was the development of comprehensive decision support systems like DMHZ and C-CADZ, which integrate multiple stages to achieve superior diagnostic results [11,13].
However, this evolution from simple models to complex hybrid systems led to a critical, shared problem: a decrease in interpretability. As the models became more performant, their internal decision-making logic increasingly resembled a ‘black box‘, making them difficult for clinicians to scrutinize and trust. A study by Sayadi et al. [15], using the same dataset, perfectly illustrates this trade-off. While they achieved a high accuracy of 95.45% with Logistic Regression and SVM models through focused feature selection, their approach also resulted in a “black box,” failing to provide deep clinical interpretability or assess the reliability of its probability estimates. This demonstrates that while the field successfully demonstrated the potential of AI for CAD diagnosis [10,12,16], the focus on predictive accuracy alone, without a framework for calibration and explanation, limits the applicability of such models in real-world clinical decision-making.
In light of these limitations, the goal of this research is to build a more accurate predictive model that also accounts for the complex interplay between key risk factors (including diabetes, hypertension, smoking, obesity, etc.). The novelty of this work lies in its comprehensive and clinically oriented approach, which addresses these common gaps. We present a unified methodological protocol: an end-to-end pipeline that systematically integrates multi-stage preprocessing, mitigation of class imbalance with SMOTE, and rigorous hyperparameter tuning. Moving beyond reporting simple accuracy, this work conducts a combined evaluation of both discrimination (ROC-AUC) and calibration, ensuring that the model is not only accurate but also trustworthy for clinical risk stratification. Finally, we directly address the “black box” limitation by employing SHAP to provide transparent, feature-level insights, enhancing clinical interpretability and trust in real-world applications.

2. Materials and Methods

2.1. Dataset Source

The dataset employed in this study is the Z-Alizadeh Sani dataset, which is publicly available on the UCI Machine Learning Repository. This dataset is widely used in cardiovascular research, particularly for the diagnosis and prediction of CAD. It contains data from 303 patients, collected from real clinical settings, making it a reliable source for medical analysis. Each record includes demographic details, medical history, clinical findings, laboratory findings, imaging outcomes, and the results of coronary angiography [17,18].
The dataset consists of 56 variables that can be grouped into several categories. Demographic and anthropometric features, such as age, sex, height, weight, and body mass index (BMI), are recognized as important contributors to cardiovascular risk. The second category covers risk factors, such as DM, HTN, smoking status (current and former), family history of CAD (FH), obesity, dyslipidemia (DLP), CHF, thyroid disorders, and respiratory conditions. These variables represent major determinants that increase the likelihood of developing CAD.
Clinical signs and symptoms form another important group of features, including blood pressure (BP), pulse rate (PR), edema, weak peripheral pulse, dyspnea, chest pain, and functional class. Electrocardiographic (ECG) and echocardiographic (EchoCG) findings are also included, such as Q wave, ST-segment depression or elevation, T-wave inversion, left ventricular hypertrophy (LVH), left ventricular ejection fraction (EF-TTE), regional wall motion abnormalities (RWMA), and VHD.
Laboratory measurements constitute a substantial portion of the dataset, providing information about fasting blood sugar (FBS), lipid profile (LDL, HDL, triglycerides), hemoglobin (HB), creatinine (CR), blood urea nitrogen (BUN), electrolytes (Na, K), and inflammatory and hematological markers such as ESR, WBC, lymphocytes, neutrophils, and platelets (PLT). These values give a comprehensive view of the patient’s metabolic state and cardiovascular health.
The target variable of the dataset is Cath, which represents the outcome of coronary angiography. Patients are classified into two categories: those with diagnosed CAD and those with normal coronary arteries. Accordingly, the dataset can be used not only for binary classification (presence or absence of CAD) but also for the assessment of disease severity in more detailed analyses.
A structured overview of the dataset variables is provided in Table 1 below:
The main strength of this dataset lies in its comprehensiveness. It spans from basic demographic information to detailed diagnostic test results, providing a rich foundation for building predictive models of CAD. Because the data are derived from actual clinical cases, models trained on this dataset are more likely to reflect practical applicability in real-world medical practice.

2.2. Data Preprocessing

Since the quality of data processing directly affects the performance of machine learning models, special attention was given to the preprocessing stage in this study. The dataset was collected in a real clinical environment and included categorical variables, numerical variables with different scales, and class imbalance. To address these challenges, several systematic steps were applied. The detailed pipeline is shown in Figure 1.
Since there were no missing values in the data, we first started by processing the categorical variables. The dataset included discrete features such as sex (Sex), smoking status, and FH. Since machine learning algorithms cannot directly interpret categorical data, Label Encoding was applied [19], assigning each category a numerical code (e.g., “Male” = 1, “Female” = 0). Label Encoding was employed in this study due to the nature of the categorical variables present in the dataset—specifically, attributes such as sex and smoking status, which are binary or exhibit low cardinality. This encoding approach provides a direct and computationally efficient transformation of categorical data into numerical format [20], thereby preserving model interpretability while minimizing preprocessing complexity. This conversion allowed all categorical variables to be represented in a numerical format suitable for model training.
Feature scaling was then performed to harmonize the different measurement units across the dataset. Age was recorded in years, blood pressure in mmHg, cholesterol levels in mg/dL, and electrolytes in mmol/L. To prevent discrepancies among scales from biasing the model, Z-score normalization was applied [21], defined as:
z = x μ σ
where x is the observed value, μ is the mean, and σ is the standard deviation. This transformation standardized all variables to a distribution with a mean of zero and a standard deviation of one. The objective of applying this transformation is to harmonize the measurement scales of the various features in the dataset, which differ in their units. For machine learning algorithms, especially those sensitive to the magnitude of features, standardization is essential. Without this normalization, features with larger numerical ranges could disproportionately influence the model’s behavior, leading to biased predictions. Therefore, Z-score normalization ensures that each feature contributes equally to the model, facilitating more stable training and preventing certain features from dominating due to their scale [22].
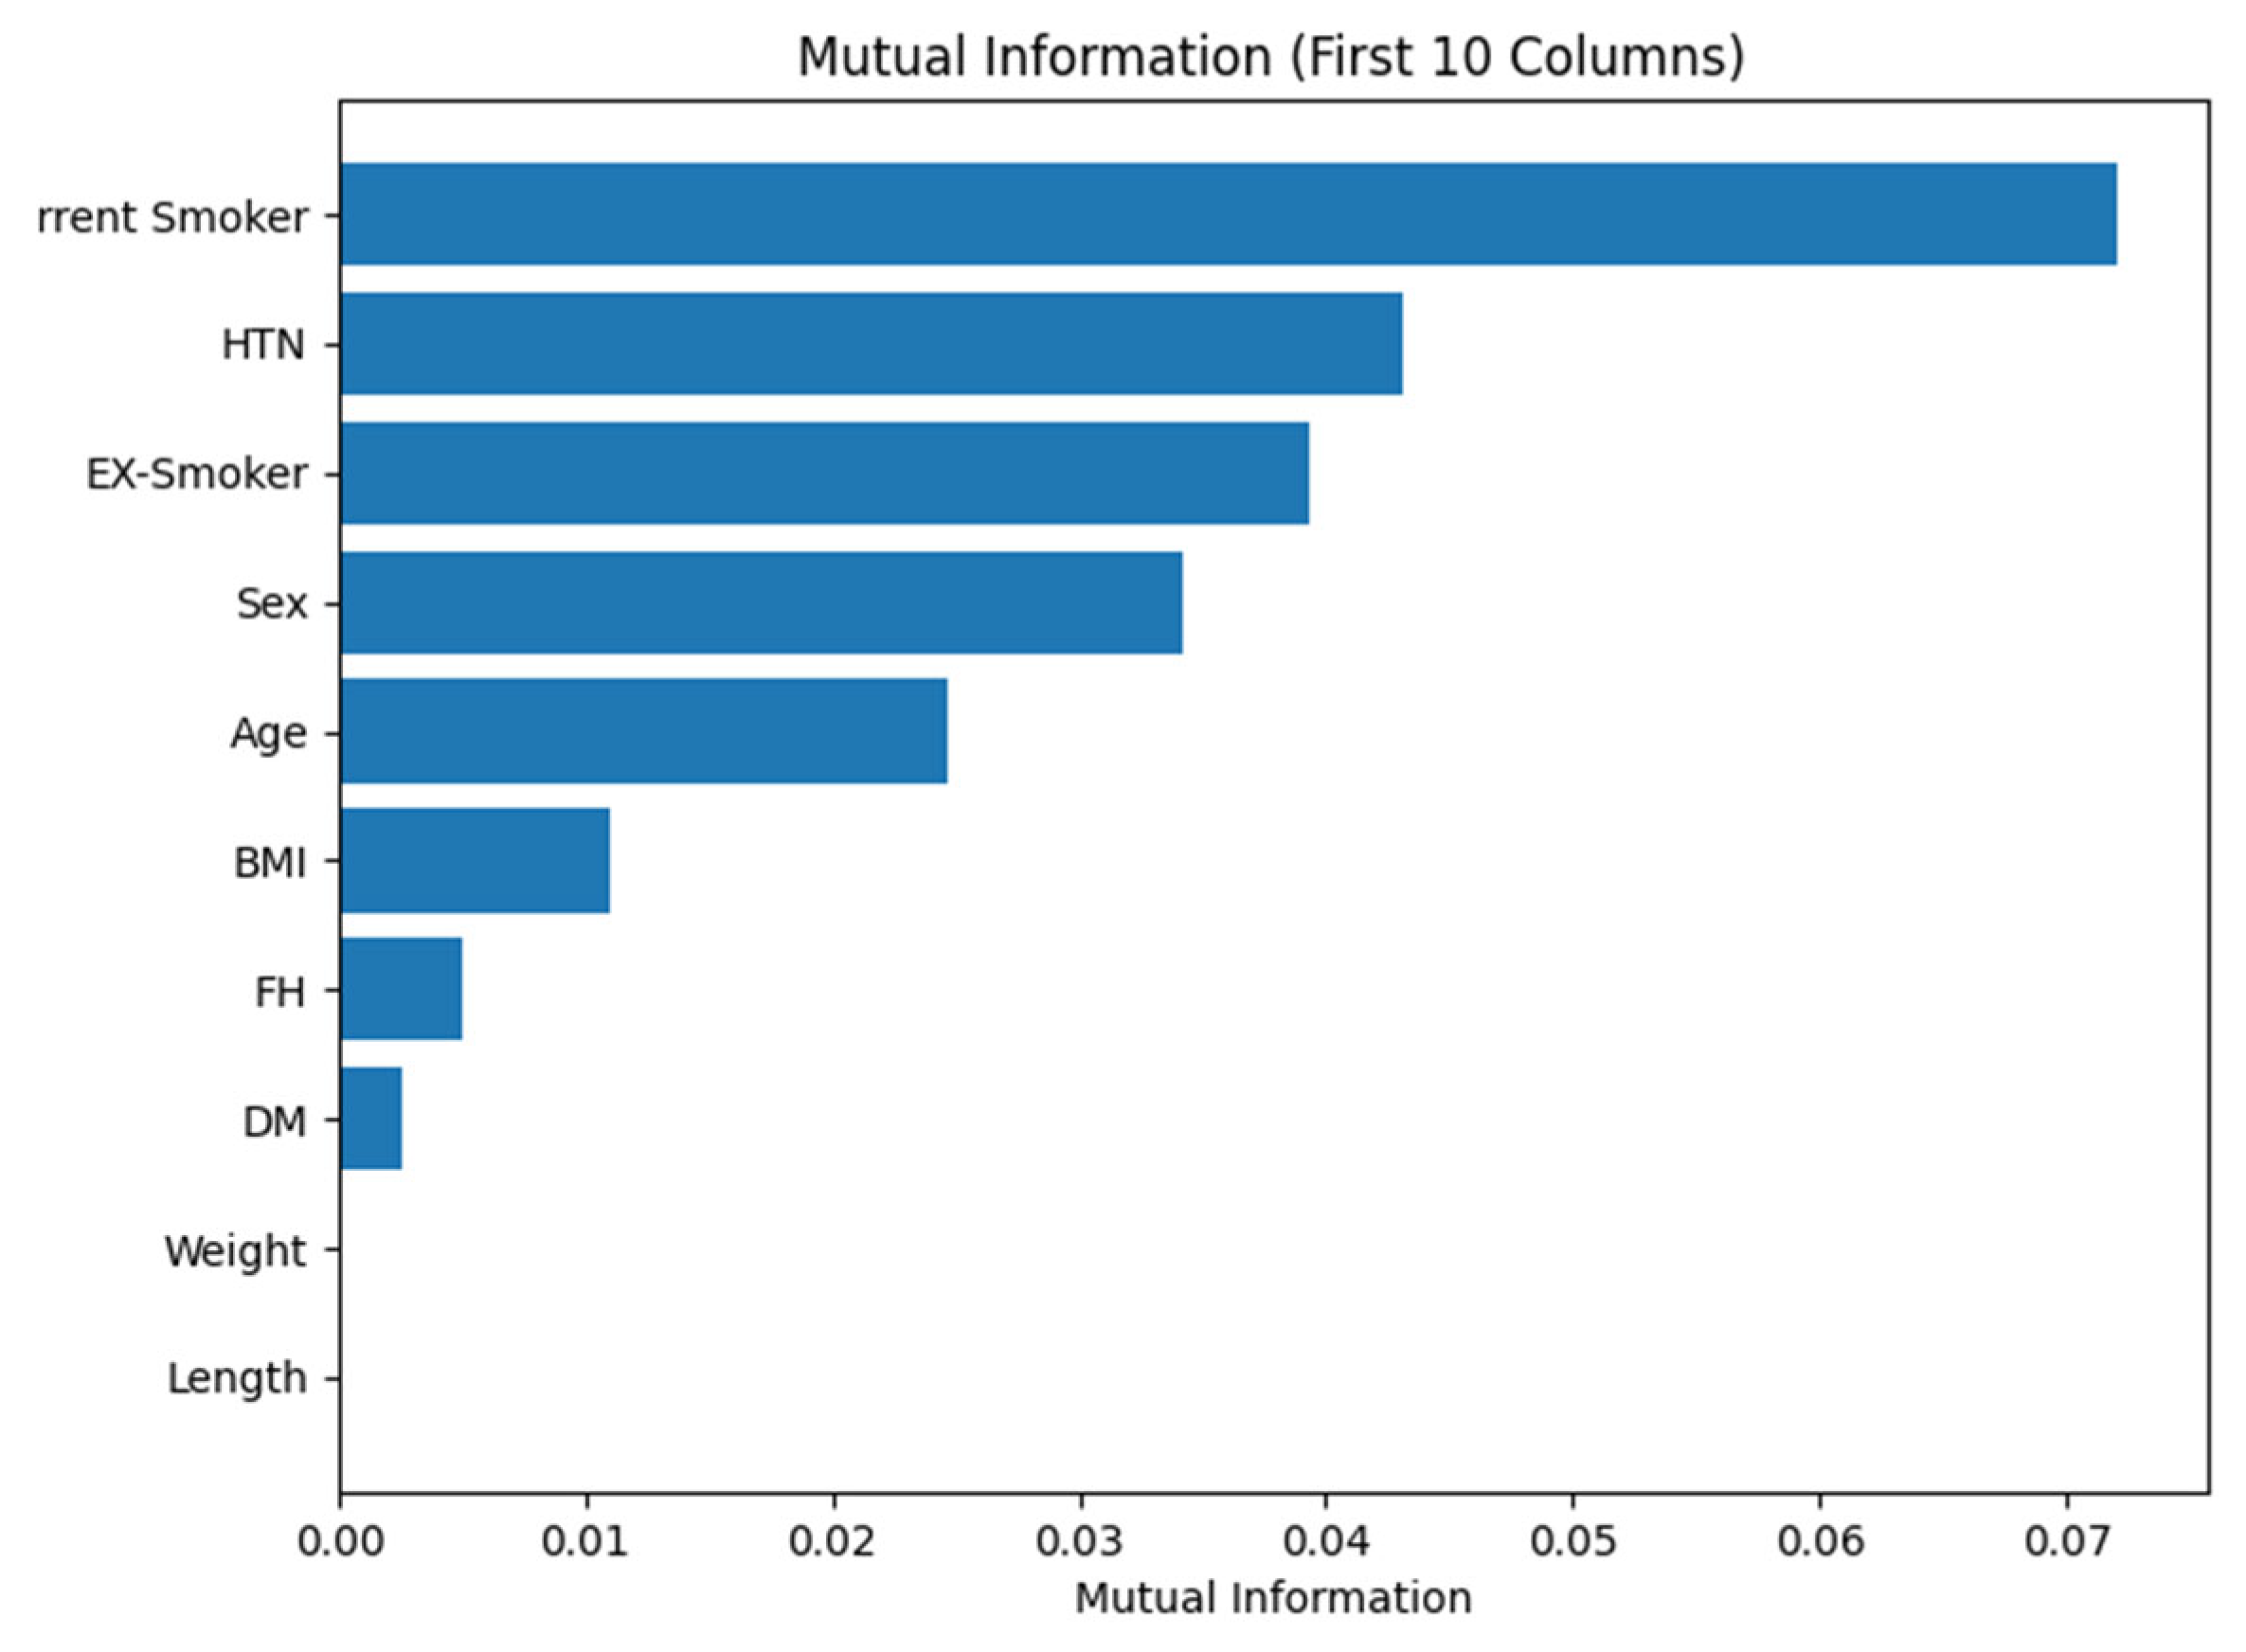
After completing all preprocessing steps, the dataset was prepared for model training. To further understand the relevance of individual features in predicting heart disease, a mutual information (MI) analysis was conducted [23]. The results of MI analysis are shown in Figure 2. MI is a nonlinear measure that quantifies the dependency between each independent variable and the target outcome, allowing the identification of the most informative predictors of CAD.
The results of the MI analysis demonstrated that lifestyle and clinical history factors carried significant predictive value. In particular, current smoking status was identified as the most informative variable, followed by HTN and a history of smoking (Ex-Smoker). Demographic features such as sex and age also showed substantial associations with CAD, highlighting their clinical relevance. On the other hand, factors such as BMI, FH, and DM exhibited comparatively lower contributions, while weight and height provided minimal information.
This analysis provided valuable insights into the feature space by ranking variables according to their information gain, helping ensure that the most impactful predictors were emphasized during model training.
The dataset was then divided into training and testing sets using the train_test_split function, with 70% allocated for training and 30% for testing [24]. This separation allowed for a robust evaluation of the model’s generalization ability.
However, the dataset exhibited class imbalance, with more patients diagnosed with CAD compared to those with normal coronary arteries. This imbalance can negatively affect model performance, as algorithms tend to learn more from the majority class while underrepresenting the minority class. As a result, the overall accuracy may appear high, yet important groups may be misclassified, which is particularly problematic in clinical applications.
To address this, the Synthetic Minority Oversampling Technique (SMOTE) was employed for training data [25]. Unlike simple duplication, SMOTE generates synthetic samples for the minority class by identifying k-nearest neighbors and creating new samples along the feature space between them. This approach balanced the dataset while preserving the internal structure of the minority class.
Both SMOTE and ADASYN are data augmentation techniques, but they differ in how they generate synthetic samples. SMOTE creates synthetic data uniformly for all minority class samples, aiming to balance the data in a simple and effective manner, especially for clinical datasets. ADASYN, on the other hand, focuses on generating synthetic samples near the decision boundary, creating more data in areas that are harder to classify. This method may be more effective in highly imbalanced datasets, but the simplicity and widespread application of SMOTE made it the method of choice for this study [26].
As a result, the model learned from both classes more effectively, reducing false positives and false negatives. This was particularly important in the medical context, where missing a true case (false negative) or assigning an incorrect diagnosis (false positive) can have serious consequences for patients. The use of SMOTE improved both the fairness and the practical applicability of the models.
Altogether, these preprocessing steps enhanced data quality and prepared the dataset for machine learning analysis. This ensured that subsequent results were both reliable and clinically relevant.

2.3. Machine Learning Classification

In this study, several machine learning algorithms were applied to predict the presence of CAD. The selected models included LGBMClassifier [19], ExtraTreesClassifier [21], Random Forest [23], Support Vector Machine (SVM) [24], and XGBoost [25]. These classifiers encompass a wide range of methodological paradigms: gradient boosting frameworks, ensemble bagging approaches, kernel-based techniques, and advanced boosting algorithms. Such diversity provided a robust basis for evaluating predictive performance across both complex nonlinear learners and comparatively simpler architectures, ensuring a comprehensive assessment of their clinical applicability.
The algorithms were chosen for their proven ability to handle the complexities of medical data, including high dimensionality, nonlinearity, and noise. Below, each method is described along with its mathematical formulation and clinical interpretation relevance.
1.
Support Vector Machine (SVM):
The SVM algorithm constructs an optimal separating hyperplane between two classes by maximizing the margin between them.
Given training data ( x i , y i ) with y i 1 , + 1 , the optimization problem is formulated as:
m i n   1 2 ω 2 + C   i = 1 n ξ i
subject to
y i ( ω T ϕ   ( x i ) + b ) 1 ξ i ,   ξ i     0
Here, ( x i ) is a nonlinear mapping to a higher-dimensional space, C is a penalty parameter, and ξ i are slack variables allowing misclassifications.
The resulting decision function is:
f   ( x )   =   s i g n   ( i = 1 n α i ,       y i   K   ( x i ,   x ) + b )
where K   ( x i ,   x )   =   ϕ   ( x i ) T ϕ   ( x ) is the kernel function (e.g., radial basis function, linear, or polynomial).
SVM is particularly effective for complex and nonlinear decision boundaries in biomedical datasets, ensuring robust separation of CAD and non-CAD cases even with overlapping features.
2.
Random Forest (RF):
Random Forest is an ensemble of T decision trees, each trained on a random subset of samples and features. The final prediction is determined by majority voting:
y ^ =   m o d e   h i ( x ) T t = 1
Each decision tree recursively partitions the data by selecting the feature and split point that minimize impurity, measured by either the Gini index or entropy:
G i n i   =   1     k = 1 K p 2 k ,   E n t r o p y   =     k = 1 K p k l o g p k
where p k is the proportion of class k samples in a node.
By averaging across many decorrelated trees, Random Forest reduces variance, prevents overfitting, and enhances model stability—key properties for reliable clinical decision support.
3.
Extra Trees Classifier (Extremely Randomized Trees):
The Extra Trees Classifier operates similarly to Random Forest but introduces additional randomness to reduce overfitting and variance.
For each node split, it randomly selects both the feature and the threshold rather than searching for the optimal one.
Formally, the best random split θ * is found as:
θ * =   a r g min θ Θ rand I   ( D ,   θ )  
where I   ( D ,   θ )   represents the impurity after split θ .
This randomization increases bias slightly but significantly improves generalization, which is particularly beneficial when working with small clinical datasets like the Z-Alizadeh Sani dataset.
4.
Light Gradient Boosting Machine (LightGBM):
LightGBM is a gradient boosting algorithm that builds an additive model of decision trees to minimize a differentiable loss function.
At each boosting iteration t, a new tree f t = ( x ) is added to the existing model:
y i ^ ( t ) =   y i ^ ( t 1 ) + η f t ( x i )
where η is the learning rate controlling step size.
The optimization objective is defined as:
L ( t ) =   i = 1 n L ( y i , y i ^ ( t 1 ) + f t ( x i ) ) + Ω ( f t )
where Ω ( f t ) penalizes tree complexity.
Unlike conventional gradient boosting, LightGBM employs a leaf-wise growth strategy: at each step, it expands the leaf that achieves the maximum reduction in loss.
This allows the algorithm to converge faster and achieve higher accuracy, while efficiently handling categorical and numerical clinical variables.
5.
Extreme Gradient Boosting (XGBoost)
XGBoost is an advanced gradient boosting method that uses both first- and second-order derivatives for optimization and includes strong regularization.
The model represents the prediction as a sum of regression trees:
y i ^ = k = 1 K f k ( x i ) ,   f k F
The objective function combines the training loss and a regularization term:
L = i = 1 n l ( y i , y i ^ ) +   k = 1 K Ω ( f k )
where
Ω ( f k ) = γ T + 1 2   λ ω 2  
To efficiently approximate the loss, XGBoost applies a second-order Taylor expansion:
L t   i = 1 n g i f i x i + 1 2 h i f 2 t ( x i ) + Ω ( f t )
where
g i = l ( y i , y i ^ ( t 1 ) ) y i ^ ( t 1 )
is the gradient, and
h i = 2 l ( y i , y i ^ ( t 1 ) ) ( y i ^ ( t 1 ) ) 2
is the Hessian.
This second-order optimization provides faster convergence and greater stability than standard gradient boosting.
The built-in regularization ( λ ,   γ ) prevents overfitting and ensures smooth decision boundaries, making XGBoost highly suitable for tabular clinical data.
To further explore the machine learning classification methods used, the algorithms employed in this study were selected for their capacity to handle the complexities of medical data, including nonlinearity, high-dimensionality, and noisy features. Specifically, the XGBoost algorithm was chosen for its gradient boosting framework, which effectively captures intricate feature interactions and improves performance by iteratively correcting errors made by previous trees [27]. This ensemble technique, which constructs decision trees sequentially, is particularly adept at dealing with structured, tabular datasets [28], such as those used in clinical applications. Similarly, Random Forest and Extra Trees, both ensemble methods that use decision trees, were incorporated to reduce the risk of overfitting by averaging predictions from multiple trees built on random subsets of data [20,29]. These models enhance the robustness of the overall classification by mitigating the effects of outliers and noisy data.
Additionally, LightGBM, a gradient boosting method, was used for its fast training capabilities and ability to handle categorical features. Its leaf-wise growth strategy optimizes the tree-building process, allowing it to handle more complex data structures with greater speed [30]. SVM was also included, providing an alternative method based on finding the optimal hyperplane to separate classes in high-dimensional space [31]. SVM is particularly useful for capturing complex decision boundaries in data with high feature interaction, making it valuable for predicting diseases like CAD, where relationships between variables may not be linear.
These models were evaluated through a series of numerical simulations that included standard performance metrics such as accuracy, precision, recall, F1 score, and ROC-AUC. Hyperparameter tuning was performed using GridSearchCV with cross-validation to ensure that the optimal parameters were selected for each model, mitigating the risk of overfitting and enhancing the generalizability of the results. This approach allowed for a thorough comparison of the algorithms’ strengths and weaknesses, ensuring that the most clinically applicable model was identified for predicting CAD.
While deep learning models have demonstrated notable success in a variety of domains, we intentionally chose to focus on classical machine learning algorithms in this study. One of the primary reasons for this decision lies in the size and dimensionality of the dataset. The Z-Alizadeh Sani dataset consists of 303 patient records and 56 variables, which is relatively modest compared to the large-scale datasets typically required for deep learning models [32]. These models are known for their data-hungry nature, often requiring thousands of samples to effectively learn patterns without overfitting. Given the limited size of the dataset, deep learning approaches would likely suffer from overfitting and fail to generalize well.
To optimize hyperparameters and minimize the risk of overfitting, GridSearchCV with 3-fold cross-validation was applied [33]. This approach systematically tested different parameter combinations and selected the best configuration. Cross-validation across multiple data folds enhanced the generalizability of the models and ensured more stable performance outcomes.
The effectiveness of each model was assessed using standard metrics widely applied in medical classification tasks [34]:
Accuracy: the proportion of all correctly classified cases.
A c c u r a c y = T P + T N T P + T N + F P + F N
Precision: the proportion of positive predictions that are true positives.
P r e c i s i o n = T P T P + F N
Recall (Sensitivity): the ability of the model to correctly identify actual positive cases.
R e c a l l = T P T P + F N
F1 Score: the harmonic mean of precision and recall, balancing both metrics.
F 1 = 2 × P r e c i s i o n × R e c a l l P r e c i s i o n   ±   R e c a l l
where
TP (True Positive)—correctly identifying a patient with CAD; TN (True Negative)—correctly identifying a patient without CAD; FP (False Positive)—incorrectly classifying a healthy patient as having CAD; FN (False Negative)—failing to detect CAD in a patient who actually has it.
The combination of these metrics provides not only an overall measure of correctness but also a clinically meaningful evaluation of model performance. In CAD diagnosis, higher recall is particularly important to avoid missing true cases, while higher precision reduces the risk of false diagnoses. The F1 Score ensures a balanced view by combining both aspects, which is essential in medical decision-making.
Model performance was further evaluated using Receiver Operating Characteristic (ROC) curves and the corresponding Area Under the Curve (AUC) values [35]. The ROC-AUC framework allowed assessment of the balance between sensitivity and specificity across different thresholds. Higher AUC values indicated stronger discriminative ability, while values near 0.5 reflected performance close to random chance. This ensured that the models were not judged on a single threshold but on their overall capacity to distinguish CAD from non-CAD cases.
To complement this, calibration plots were generated to examine the agreement between predicted probabilities and actual outcomes [36]. A well-calibrated model produces probability estimates that correspond to observed event frequencies—for instance, a predicted 70% risk should translate into approximately 70% observed cases. Calibration is particularly important in clinical settings, where probability estimates inform risk stratification and treatment planning. A model with strong discrimination but poor calibration may overestimate or underestimate patient risk, potentially leading to inappropriate clinical decisions.
Interpretability was further enhanced through SHAP (SHapley Additive exPlanations) analysis, which is grounded in cooperative game theory. SHAP values assign additive contributions of each feature to the model’s output, providing a unified, theoretically consistent explanation for how individual features affect predictions [37].
Formally, for a given predictive model f(x) and an input vector x   =   x 1 ,   x 2 ,   ,   x M   consisting of M features, SHAP decomposes the model output into the sum of feature contributions as follows:
f ( x )   = ϕ 0 +   j = 1 M ϕ j
where
ϕ 0 = E f ( x ) is the expected value of the model prediction over all samples (baseline prediction), ϕ j is the Shapley value, representing the marginal contribution of feature j to the final prediction.
Each Shapley value ϕ j is computed by averaging the change in the model output when feature j is added to every possible subset S of other features:
ϕ j = S F \ j S ! M S 1 ! M ! f S j ( x S j     f S ( x S ) )
where
F denotes the set of all features, S is a subset of features not containing j, f S ( x S ) is the model prediction using only features in S.
Intuitively, SHAP computes how much adding a feature j improves the prediction compared to when it is excluded, averaged over all possible feature coalitions. This guarantees additivity, consistency, and fairness—key properties that make SHAP theoretically robust for interpretability in clinical models.
In tree-based learners such as Random Forest and XGBoost, the TreeSHAP algorithm is employed for efficient computation of exact Shapley values in polynomial time.
For these models, the SHAP value for feature j can be expressed as:
ϕ j = t = 1 T l ϵ L t ω t ,   l ( x j )   ω ( r e f ) t , l T
where T is the total number of trees, L t is the set of leaves in tree t, and ω t ,   l ( x j )   denotes the contribution of feature j to the leaf output. This formulation enables SHAP to provide exact, fast, and scalable explanations for ensemble models.
SHAP offers two complementary interpretability levels:
Global interpretability is achieved by aggregating the absolute SHAP values ϕ j   across all samples to determine the most influential predictors and assess their overall importance in the model. Local interpretability, in turn, is obtained by analyzing individual SHAP values ϕ j for a specific patient, explaining how each variable—such as hypertension, cholesterol, or diabetes—affects that patient’s personalized risk of developing coronary artery disease.
By integrating ROC-AUC, calibration analysis, and SHAP interpretation, the evaluation combined discrimination, reliability of probability estimates, and clinical transparency. This multidimensional framework strengthened both the diagnostic value and the applicability of the machine learning models in CAD prediction.

3. Results and Discussion

3.1. Results of Machine Learning Models

Five different machine learning models were compared for predicting CAD. The performance of each model was evaluated using four key metrics: Accuracy, which reflects the proportion of correctly classified cases; precision, which measures the proportion of positive predictions that are true positives; Recall (Sensitivity), which indicates the ability to correctly identify patients with CAD; and the F1 Score, which balances precision and recall [38]. These metrics provide a comprehensive assessment of how reliable and clinically applicable the models are in medical classification.
As shown in the Table 2, all models achieved satisfactory results, but each demonstrated its own strengths and limitations. XGBoost delivered the best overall performance, with the highest accuracy (0.9011) and F1 score (0.8163). Its recall of 0.8000 also indicated a strong capability in correctly identifying patients with CAD. Clinically, this is critical, as timely and accurate detection is essential for effective decision-making [39,40].
Random Forest ranked second in accuracy (0.8901). It achieved the highest precision (0.8947) among all models, indicating a lower rate of false positives. However, its recall (0.6800) was comparatively low, suggesting a risk of missing some true cases of CAD. This means that while Random Forest was effective in reducing misdiagnoses, it might overlook certain patients with the disease.
LGBMClassifier showed balanced results, with an accuracy of 0.8791, a recall of 0.7600, and an F1 score of 0.7755. Compared with Random Forest, it demonstrated higher sensitivity, but overall performance remained below that of XGBoost. Although computationally efficient, its clinical accuracy was moderate.
ExtraTreesClassifier and SVM produced similar outcomes, each with an accuracy of 0.8681 and F1 scores of 0.7500. While these models demonstrated a reasonable level of reliability, their diagnostic power was clearly lower than that of the more advanced methods, particularly XGBoost and Random Forest.
XGBoost proved to be the most effective model in predicting CAD, combining high accuracy, balanced sensitivity, and precision, and a strong F1 score. Its robust and consistent performance highlights its suitability as the best predictive tool among the evaluated methods. Furthermore, the model’s ability to maintain high recall while also minimizing false positives demonstrates its clinical relevance, ensuring that patients at risk are correctly identified without leading to unnecessary overdiagnosis. These strengths make XGBoost particularly valuable in real-world healthcare settings, where both diagnostic accuracy and reliability are critical for guiding timely interventions and improving patient outcomes. To assess the robustness of the model, synthetic noise was added to the dataset. The performance showed a slight decline, particularly in precision and recall, but the XGBoost model remained the most stable, highlighting its ability to maintain high accuracy even in noisy conditions.
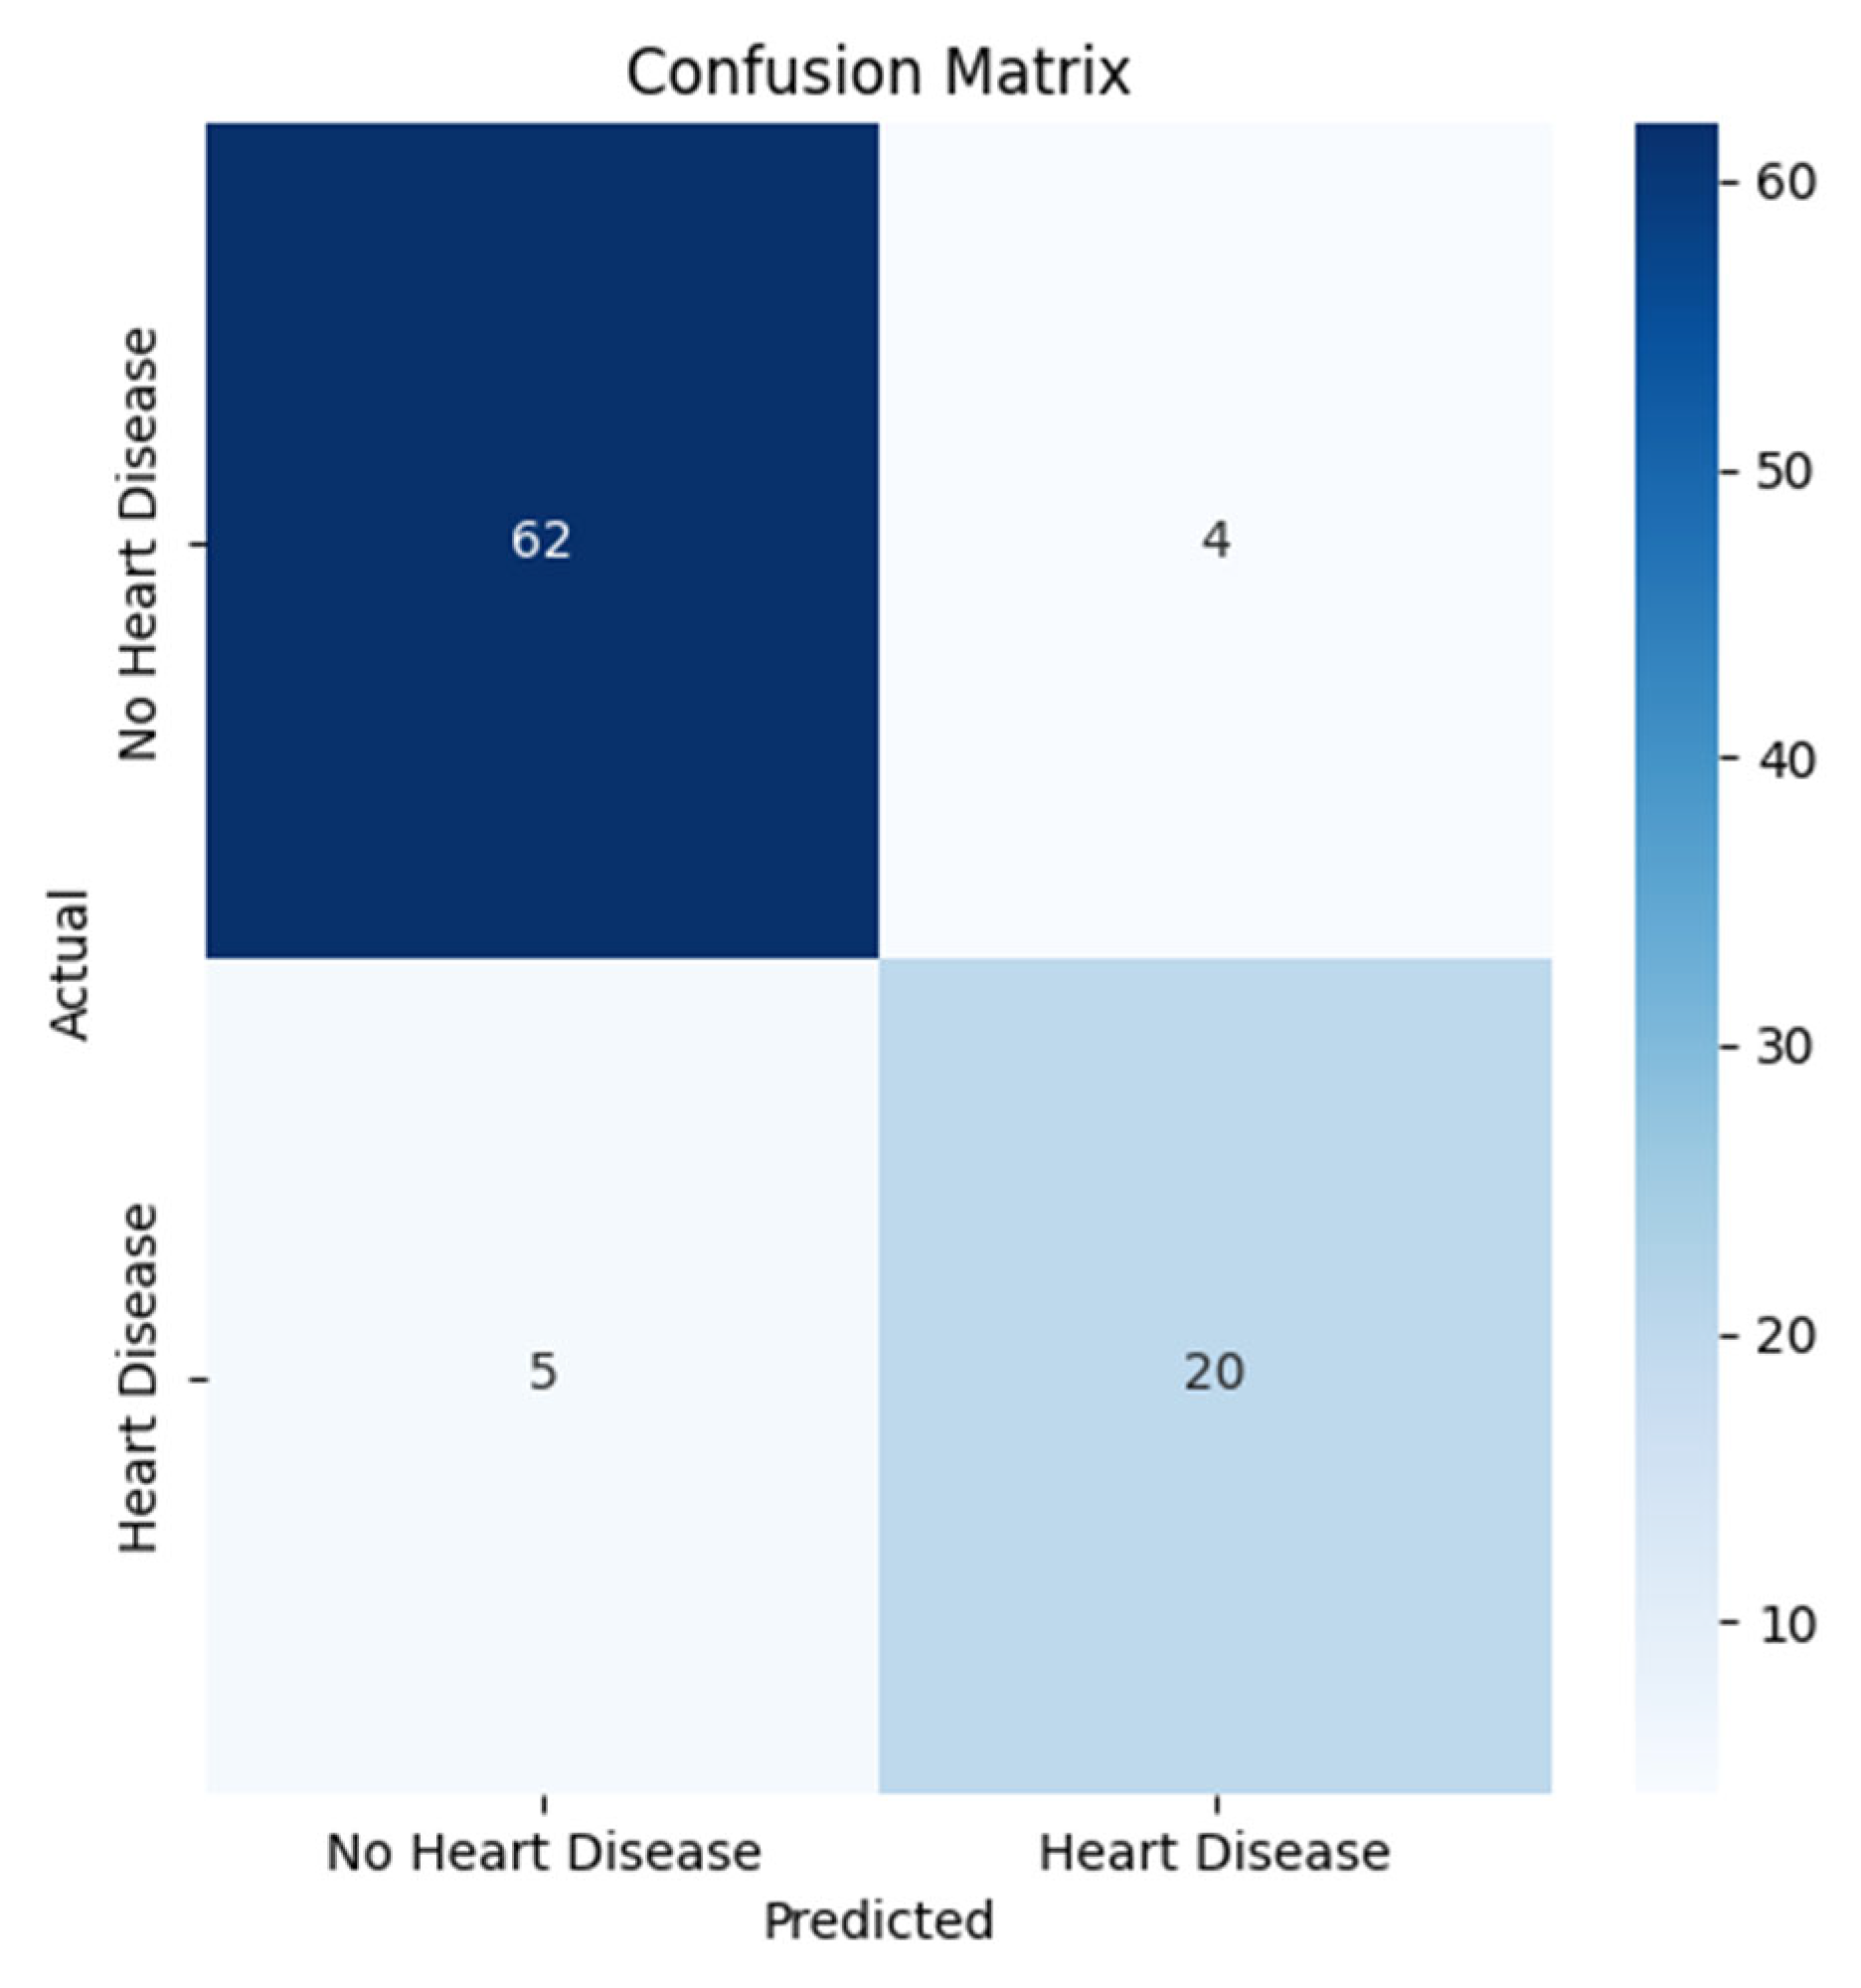
The confusion matrix, in Figure 3, provides a clear overview of the model’s diagnostic capability by comparing predicted outcomes with actual clinical data. The results show that the model correctly identified 62 patients without CAD and produced only 4 false-positive predictions. Among patients with CAD, 20 were accurately classified, while 5 were misclassified as healthy. These findings indicate that the model achieves a high level of accuracy and precision. However, the presence of false negatives demonstrates that a small proportion of patients with CAD might remain undetected. Clinically, this is highly significant, since missing true cases of CAD may delay timely treatment and increase adverse outcomes [41,42]. Thus, while the model demonstrates strong diagnostic reliability, further optimization is required to improve sensitivity.
The SHAP evaluation, in Figure 4, identified the most influential clinical factors contributing to CAD predictions. HTN emerged as the most impactful variable, consistent with clinical knowledge that elevated blood pressure significantly increases vascular strain and accelerates atherosclerosis. VHD was the second most important contributor, highlighting the role of structural cardiac abnormalities in predisposing patients to CAD. Diabetes mellitus ranked third, reflecting its well-established link to adverse cardiovascular outcomes, including dysregulated lipid metabolism and endothelial dysfunction [43]. Smoking status also contributed to CAD risk, though its effect size was comparatively smaller. Obesity appeared as a contributing factor but with the least relative influence, which aligns with evidence that higher adiposity increases overall CVD risk [44].
These findings directly address the research question by confirming that among medical history and risk factors, hypertension, valvular heart disease, and diabetes mellitus exert the strongest influence on CAD development, while smoking and obesity provide additional but less dominant contributions.
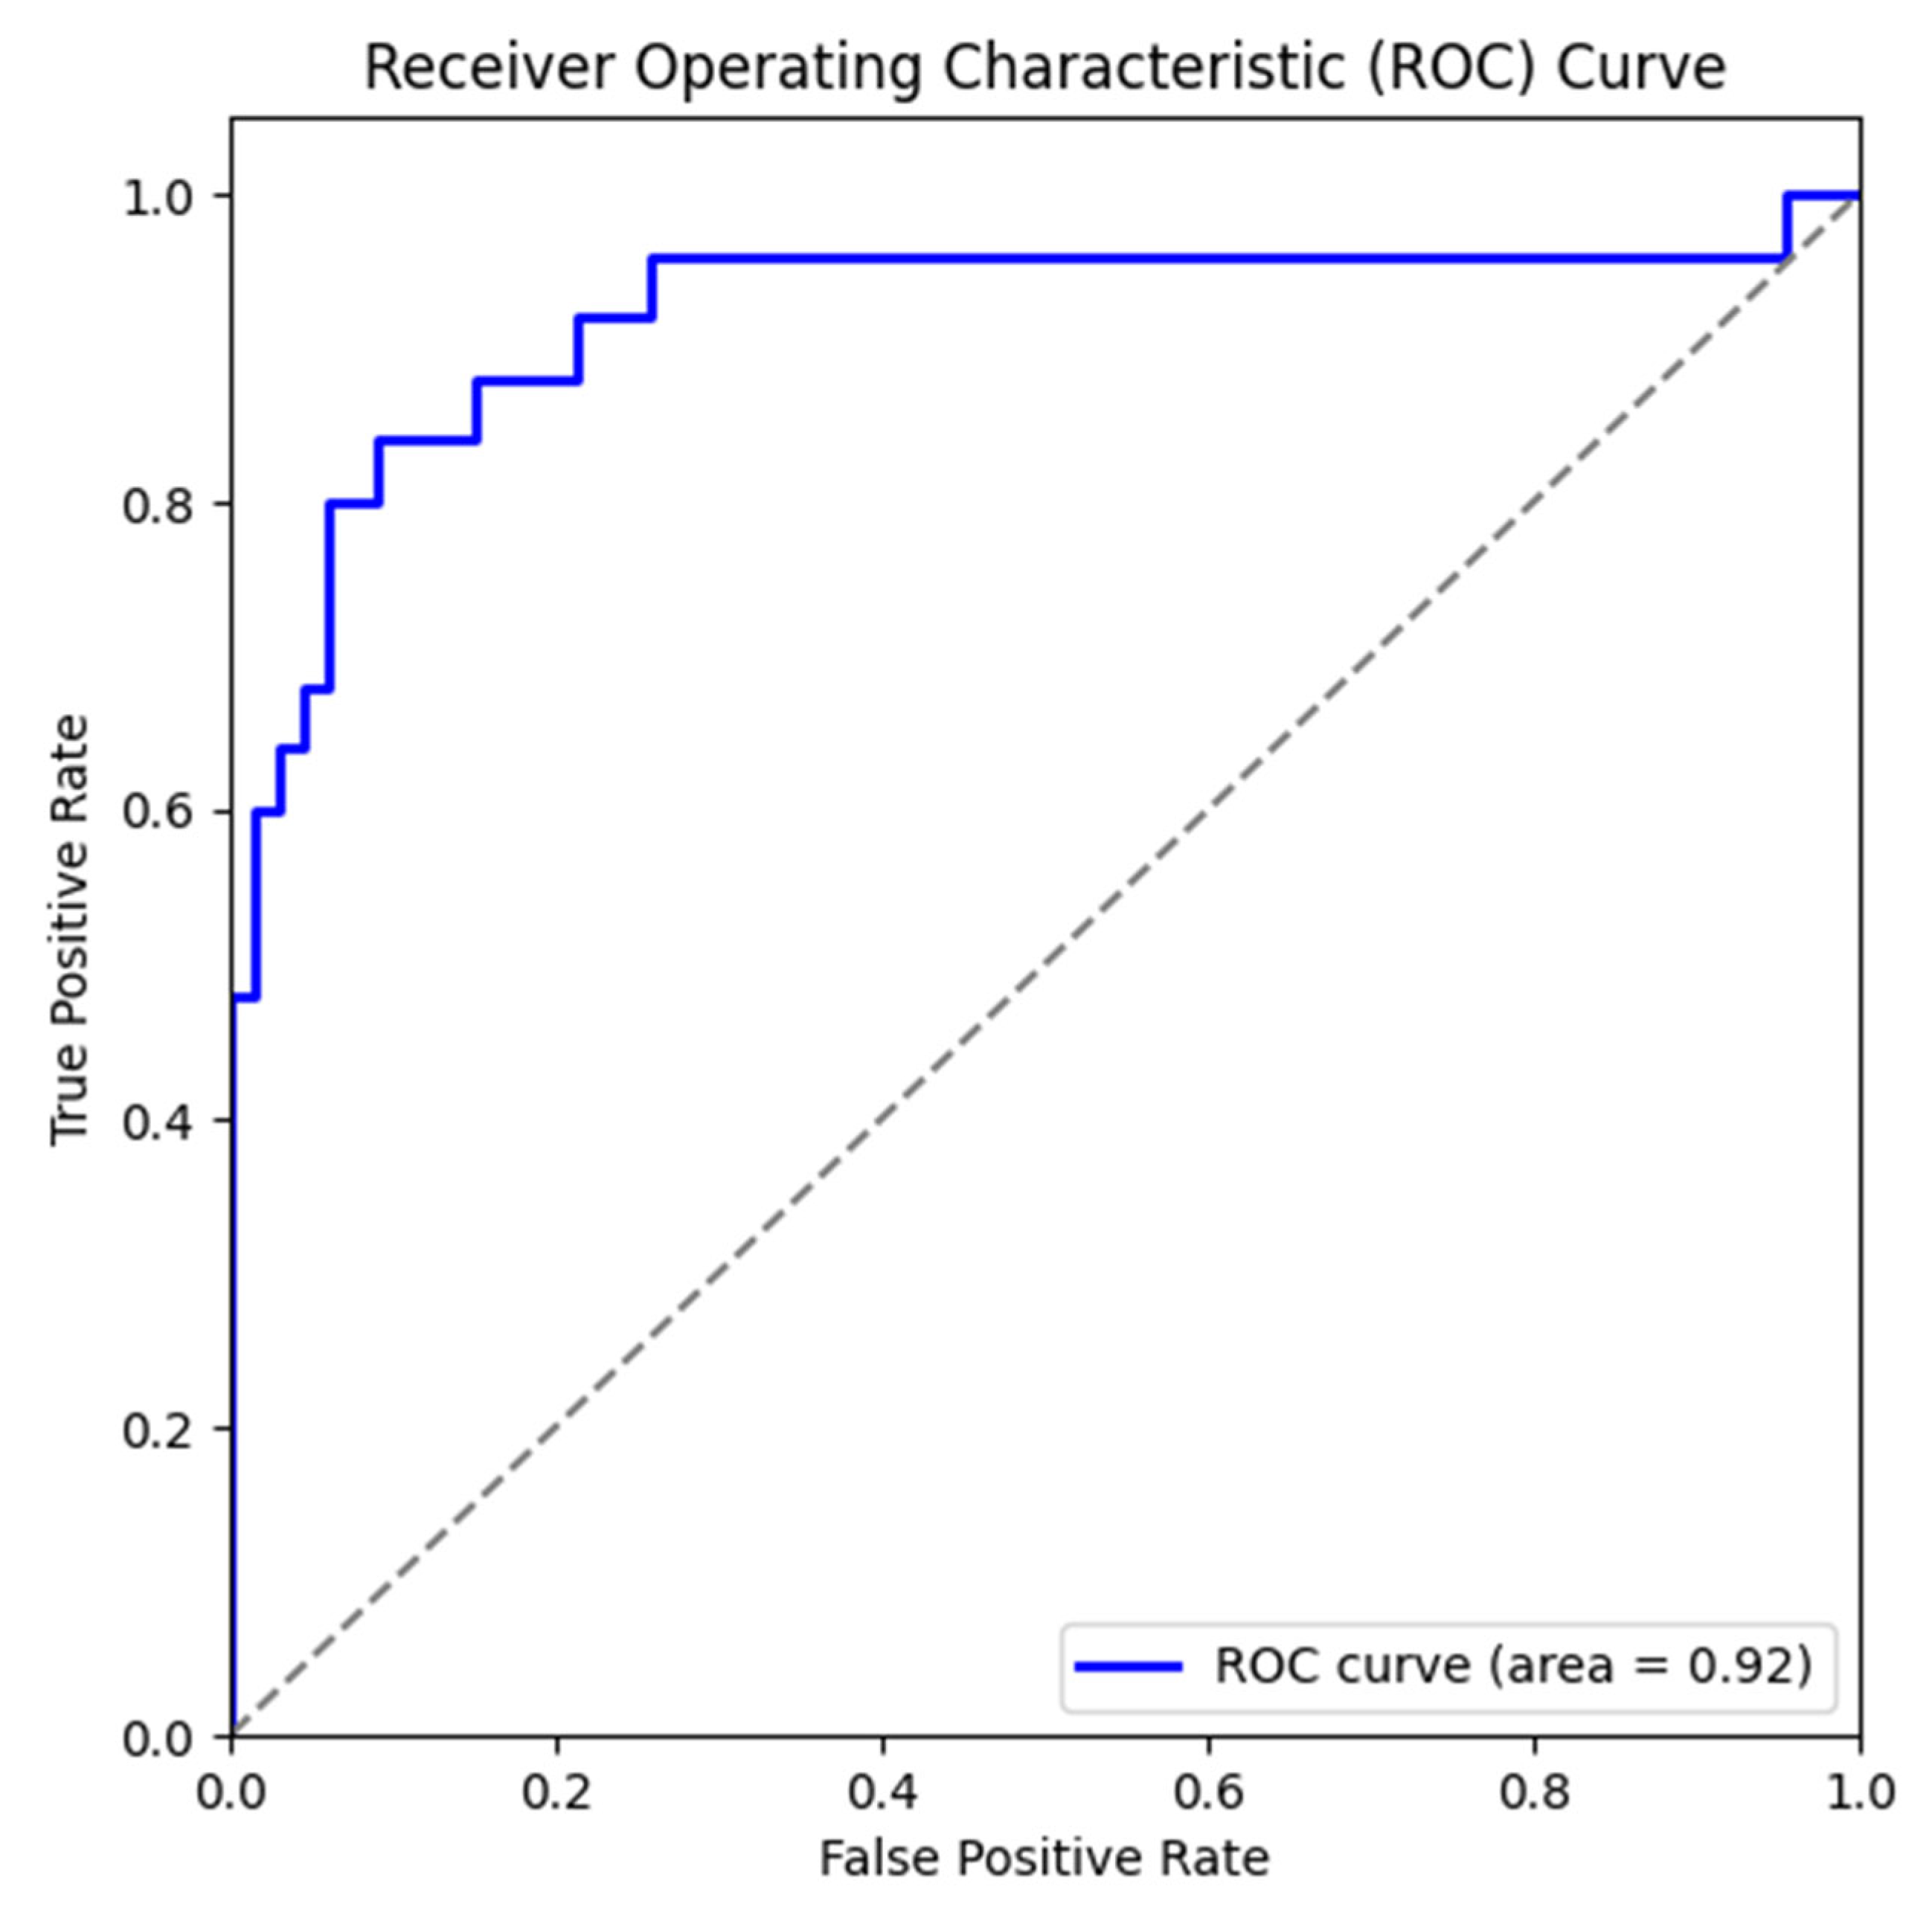
The ROC curve, in Figure 5, illustrates the model’s ability to distinguish between CAD and non-CAD cases across different decision thresholds. The area under the curve (AUC) reached 0.92, indicating excellent discriminative performance. This high AUC value reflects the model’s robustness in clinical classification tasks, ensuring that it can maintain reliability even when applied in varied diagnostic settings. From a medical perspective, such a result demonstrates the potential of the model as a supportive tool for early detection and decision-making in clinical practice.
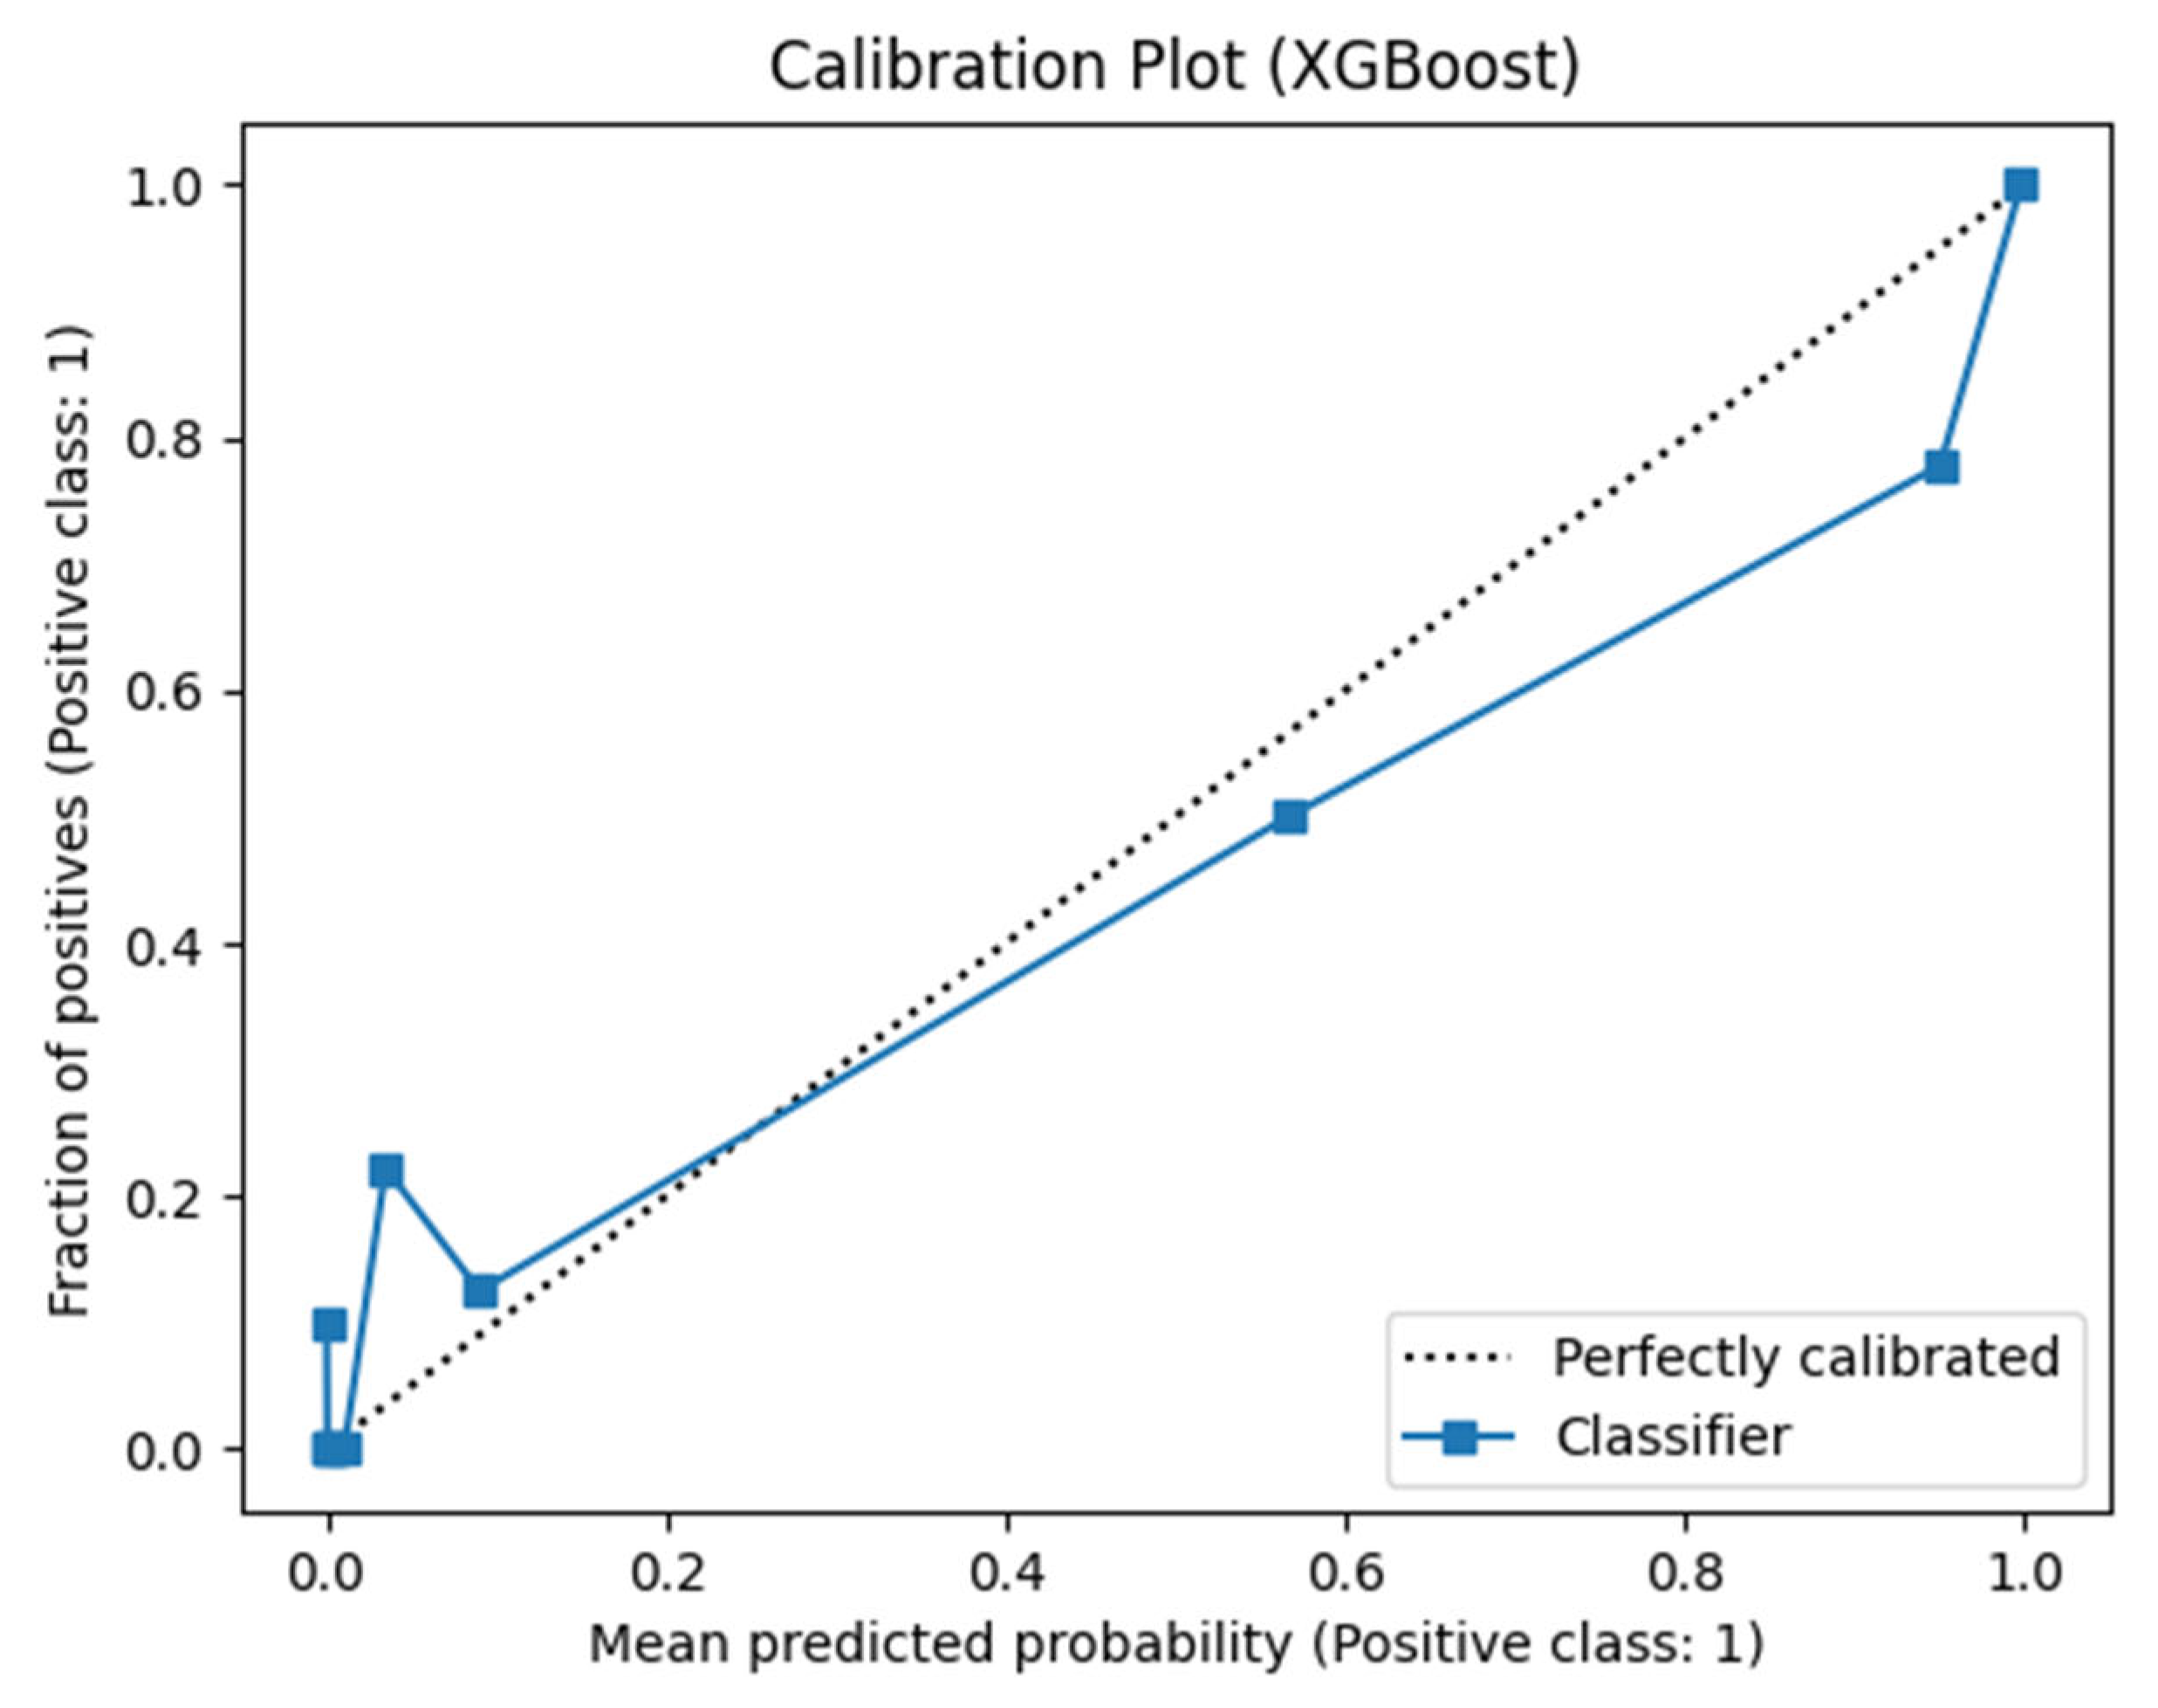
The calibration plot, in Figure 6, further assessed the reliability of the model’s probability estimates. Calibration is particularly important in medical research, as predictive models should not only classify patients correctly but also provide probability outputs that closely reflect the true risk of disease [45]. In the context of CAD, incorporating medical history and major risk factors (DM, HTN, smoking, obesity, CRF, CVA, airway diseases, thyroid disorders, CHF, DLP, and VHD) into a well-calibrated model ensures that predicted probabilities can serve as clinically trustworthy indicators for decision-making.
As shown in Figure 6, the calibration curve compares the predicted probabilities (x-axis) with the observed frequency of positive cases (y-axis). The dashed line represents perfect calibration, while the solid blue line corresponds to the model’s performance. The results indicate that the XGBoost model is generally well calibrated. Minor deviations are observed in the lower probability range (0–0.2), suggesting that some low-risk profiles may not be fully captured. However, in the mid-to-high probability intervals (0.4–1.0), the model’s predictions align closely with actual outcomes. This demonstrates that the main clinical risk factors are effectively represented, and the probability estimates can be considered reliable for supporting CAD risk stratification.
The combined evaluation demonstrates that the model performs effectively in predicting CAD. The confusion matrix shows strong precision with a limited number of false positives, while SHAP analysis highlights the dominant role of hypertension, valvular heart disease, and diabetes mellitus as key predictors. The ROC-AUC value of 0.92 demonstrates the model’s strong diagnostic capacity, and when considered together with the Calibration plot, the reliability and accuracy of the predictions become even more evident. These outcomes provide evidence that medical history and major risk factors are critical in shaping the likelihood of CAD, and that the model captures these relationships with clinically meaningful accuracy.
This study compared several machine learning models for the prediction of CAD and comprehensively evaluated their diagnostic performance. All models achieved satisfactory outcomes, though each exhibited distinct strengths and limitations. XGBoost achieved the highest accuracy (0.9011) and F1 score (0.8163), along with a recall of 0.8000, confirming its strong ability to correctly identify CAD cases. Random Forest achieved the highest precision (0.8947), reducing false positives, but its lower recall (0.6800) raises concern about missed diagnoses. Other models, including LGBMClassifier, ExtraTreesClassifier, and SVM, showed balanced but comparatively lower performance.
From a clinical perspective, model discrimination alone is insufficient. Although ROC-AUC for XGBoost was strong (≈0.92), reliable probability calibration is equally critical. Our calibration curve was closely aligned with the ideal diagonal, particularly in the mid- and high-probability ranges (0.4–0.6 and 0.8–1.0). This indicates that XGBoost not only distinguishes well between CAD and non-CAD patients but also provides trustworthy probability estimates that can stratify patients into low-, moderate-, and high-risk groups. Clinically, well-calibrated predictions enhance decision-making, as probabilities above 0.8 were consistently associated with a very high likelihood of CAD, making the model suitable for targeted screening and preventive interventions.
As shown in Figure 7, the SHAP summary plot demonstrates that higher values of HTN, VHD, and DM shift the prediction strongly toward CAD, while smoking status and obesity also contribute positively to the model output. The color gradient indicates feature values, with red (high values) exerting a greater positive impact, and blue (low values) often associated with lower risk. This visualization confirms that the model relies on clinically meaningful risk factors rather than spurious correlations.
Interpretability analysis using SHAP and Mutual Information (MI) further reinforced these findings. HTN, VHD, and DM emerged as the most influential predictors, while MI highlighted smoking status (current and former) alongside HTN as highly significant variables. These results align with established cardiovascular evidence: hypertension and diabetes are major drivers of atherosclerosis and central targets in prevention strategies [40,44]. Dyslipidemia remains a key modifiable factor, and guidelines consistently emphasize lowering LDL-C to reduce CAD risk [46].
The importance of smoking status in our model mirrors epidemiological evidence. Active smoking strongly elevates CAD risk, while former smokers also carry long-term residual risk. Light ex-smokers may approach the risk level of never-smokers within a decade, but heavy smokers often require more than 25 years for risk convergence. Importantly, early cessation provides rapid mortality benefits [47,48]. In our SHAP analysis, both current and former smoking categories showed a clear positive effect on CAD risk, consistent with these clinical realities.
Chronic kidney disease (CKD/CRF) was also an important predictor. Patients with impaired renal function experience accelerated vascular calcification, systemic inflammation, and endothelial dysfunction, all of which significantly elevate CAD risk. This aligns with evidence that CKD patients have a disproportionately high burden of CAD-related morbidity and mortality [49].
Airway diseases, particularly COPD, showed a notable contribution in the model. COPD affects approximately 12% of ischemic heart disease populations and is associated with increased in-hospital and long-term mortality [50]. Subclinical left ventricular dysfunction is also common in COPD, which helps explain the strong SHAP contribution of airway disease features [51]. Evidence for asthma was less consistent, with some studies showing elevated cardiovascular risk and others reporting weaker associations, suggesting that phenotype, age, and inflammatory burden may determine the relationship [52,53].
VHD, especially degenerative aortic stenosis, frequently coexists with CAD due to shared atherosclerotic mechanisms. Its strong predictive value in our model, therefore, reflects true clinical overlap rather than a population-specific artifact [54].
Obesity (BMI/WHR) also contributed significantly, consistent with umbrella reviews and Mendelian randomization studies that confirm obesity as a causal factor for CAD. Its effect is mediated largely through hypertension, diabetes, and lipid abnormalities [42,55]. Thyroid disorders, including subclinical hypo- and hyperthyroidism, can increase CAD risk via lipid metabolism and hemodynamic changes and were positively weighted in the SHAP analysis [56,57]. Heart failure, which often coexists with CAD, further accelerates progression and worsens outcomes; contemporary guidelines recommend integrated risk-reduction strategies in this population [58].
When compared with classical models such as Framingham and SCORE, our findings were consistent in identifying HTN, DM, smoking, age, and sex as primary risk factors. However, the strong influence of VHD and former smoking status suggests potential population-specific effects, highlighting the need to account for regional and demographic characteristics in predictive modeling.

3.2. Discussion

The findings of this study demonstrated that medical history and major risk factors play a significant role in influencing the likelihood of developing CAD. Factors such as DM, HTN, smoking (current or former), obesity, chronic renal failure (CRF), cerebrovascular accidents (CVA), airway diseases, thyroid disorders, CHF, DLP, and VHD all contributed substantially to the predictive models. SHAP analyses revealed that boosting methods such as XGBoost and LightGBM effectively captured nonlinear interactions among these risk factors, for instance, the combined effect of age and blood pressure (Age×BP) or fasting blood sugar and body mass index (FBS×BMI) on CAD likelihood. Random Forest and ExtraTrees models, in turn, consistently identified these predictors through ensemble voting mechanisms, thereby providing robustness and reducing false positives. The SVM model, supported by KernelSHAP explanations, offered detailed patient-level insights by highlighting which specific factors most strongly influenced CAD risk for individual cases. Collectively, all models complemented one another, unveiling the multifaceted associations between medical history, major risk factors, and the probability of CAD from different analytical perspectives.
The major strength of this study lies in combining comparative model evaluation with interpretability methods (SHAP and MI), linking predictive signals to well-established medical knowledge. This approach reduces the “black box” nature of machine learning and enhances clinical trust in model outputs. MI and SHAP are both widely used techniques for assessing feature importance, yet they fundamentally differ in their approaches and interpretability. MI is a statistical measure that quantifies the dependency between two variables by assessing the amount of information shared between them [59]. It is a model-agnostic measure that captures the overall association between a feature and the target variable, capturing both linear and nonlinear relationships [60]. However, MI does not account for interactions between features or the specific context in which they contribute to the model’s output. It provides a broad overview of feature relevance but lacks the granularity required for detailed model interpretation. In contrast, SHAP is rooted in cooperative game theory, where the contribution of each feature to the model’s prediction is assessed based on its marginal impact, considering the context of other features [61]. SHAP provides both global and local interpretability [38,39], allowing for the identification of overall influential features across the dataset as well as the explanation of individual predictions.
The study acknowledges several important limitations that should be considered when interpreting its findings. The dataset used, the Z-Alizadeh Sani dataset, contains data from 303 patients, which may limit the generalizability of the results. A smaller sample size can introduce variability in model performance, potentially affecting the robustness and reliability of the conclusions. Additionally, the study lacks external validation, as the model was evaluated solely on internal data. Without validation on independent datasets or diverse clinical populations, it is uncertain how well the model would perform across different healthcare settings, limiting its broader applicability. Furthermore, there is a potential for selection bias in the dataset, which may not fully represent the larger population of CAD patients. Variations in demographic characteristics, comorbidities, and the inclusion/exclusion criteria could influence the study’s outcomes, reducing the model’s ability to generalize across various patient groups. These limitations underscore the need for further research, including validation with larger, more diverse datasets, to ensure that the model’s predictions are robust, reliable, and applicable to a wide range of clinical scenarios.
The stability of the model was also tested by perturbing feature values and introducing noise to the dataset. Despite slight fluctuations in performance, the XGBoost model demonstrated its robustness and ability to maintain reliable predictions in clinical settings.
In summary, XGBoost proved to be the most effective model for CAD prediction, combining high accuracy, balanced sensitivity, and precision, and robust probability calibration. Its ability to highlight modifiable factors such as HTN, DM, DLP, smoking, CKD, airway diseases, thyroid disorders, VHD, and CHF provides actionable targets for preventive strategies. With further validation and expansion to include genetic and lifestyle data, XGBoost has strong potential for clinical integration in early screening and risk stratification programs.

4. Conclusions

This study provided a detailed evaluation of the probabilistic prediction of CAD using routinely available clinical and demographic information, addressing the need for early and reliable identification of patients at elevated risk. A systematic methodological pipeline was implemented, consisting of rigorous preprocessing of categorical data, normalization, class rebalancing with SMOTE, and grid-based hyperparameter optimization. Among the tested algorithms, XGBoost demonstrated the strongest overall performance, achieving an accuracy of 0.9011, an F1 score of 0.8163, recall of 0.8000, and ROC-AUC of 0.92. Calibration analysis confirmed that probability estimates were reliable, particularly in the mid-to-high ranges, ensuring clinical trustworthiness. Post hoc interpretability with SHAP highlighted hypertension, valvular heart disease, and diabetes mellitus as dominant predictors, while smoking, obesity, dyslipidemia, chronic renal failure, airway diseases, thyroid disorders, cerebrovascular accidents, and congestive heart failure also contributed meaningfully to CAD probability. These results emphasize the multifactorial nature of cardiovascular risk and demonstrates that a calibrated and interpretable machine learning framework can serve as an effective bridge between statistical prediction and clinical applicability.
The clinical implications are significant. Conventional scoring systems often rely on limited subsets of variables and rarely undergo calibration assessment, which can lead to inaccurate risk estimation across different populations. The presented framework integrates both classical cardiovascular risk factors and comorbid conditions into a single calibrated predictive model, producing results that are accurate, interpretable, and clinically relevant. Probabilistic outputs allow for early risk stratification, informed preventive counseling, triage, and justification of referrals for advanced diagnostic procedures. The inclusion of explainability techniques such as SHAP reduces the “black box” perception of machine learning, offering transparency at both the global and individual levels. This facilitates trust among clinicians, supports patient-centered communication, and enables personalized care strategies that align with established medical evidence.
Future directions should focus on expanding the framework to larger and more diverse multicenter cohorts, performing temporal validation to ensure long-term stability, and conducting external real-world testing across different healthcare environments. Integration with electronic health records would enable seamless application in clinical workflows, while subgroup analysis could reveal fairness concerns and guide targeted recalibration. Site-specific adjustments and cost-sensitive optimization of thresholds may further enhance clinical impact and economic feasibility. Combining probabilistic outputs with decision curve analysis could quantify the net benefit for patient routing and treatment planning, strengthening the case for clinical deployment. Taken together, the methodological rigor, interpretability, and clinical orientation of this approach provide a strong foundation for decision support systems capable of improving patient outcomes, supporting preventive strategies, and optimizing resource allocation in healthcare.

Author Contributions

Conceptualization: N.T., Z.B., B.A., B.I. and G.D.; methodology: N.T., Z.B., B.A., B.I., S.K. and G.D.; software: N.T., Z.B., B.A., S.K. and G.A.; validation: N.T., B.A., B.I. and G.A.; formal analysis: B.I., Z.B., S.K. and G.D.; investigation: N.T., Z.B., B.A., S.K. and G.A.; resources: B.I., Z.B., S.K., G.D. and G.A.; data curation: N.T., Z.B., B.A., G.D. and G.A.; writing—original draft preparation: N.T., Z.B., B.A. and S.K.; writing—review and editing: B.I., G.D. and G.A.; visualization: N.T., B.A., B.I., Z.B. and S.K.; supervision: N.T., Z.B. and B.A.; project administration: B.I., G.D. and G.A.; funding acquisition: G.A. All authors have read and agreed to the published version of the manuscript.

Funding

This research was funded by the Science Committee of the Ministry of Science and Higher Education of the Republic of Kazakhstan (Grant No. AP23488586).

Data Availability Statement

Data are contained within the article.

Conflicts of Interest

Authors Zhanel Baigarayeva and Shugyla Kurmanbek were employed by the company LLP Kazakhstan R&D Solutions Co., Ltd. The remaining authors declare that the research was conducted in the absence of any commercial or financial relationships that could be construed as a potential conflict of interest.

Abbreviations

The following abbreviations are used in this manuscript:
CADCoronary Artery Disease
MLMachine Learning
DLDeep Learning
GBGradient Boosting
RFRandom Forest
SVMSupport Vector Machine
LRLogistic Regression
DTDecision Tree
KNNK-Nearest Neighbors
ANNArtificial Neural Network
ROCReceiver Operating Characteristic
AUCArea Under the Curve

References

  1. Di Lenarda, F.; Balestrucci, A.; Terzi, R.; Lopes, P.; Ciliberti, G.; Marchetti, D.; Schillaci, M.; Doldi, M.; Melotti, E.; Ratti, A.; et al. Coronary Artery Disease, Family History, and Screening Perspectives: An Up-to-Date Review. J. Clin. Med. 2024, 13, 5833. [Google Scholar] [CrossRef]
  2. Kodeboina, M.; Piayda, K.; Jenniskens, I.; Vyas, P.; Chen, S.; Pesigan, R.J.; Ferko, N.; Patel, B.P.; Dobrin, A.; Habib, J.; et al. Challenges and Burdens in the Coronary Artery Disease Care Pathway for Patients Undergoing Percutaneous Coronary Intervention: A Contemporary Narrative Review. Int. J. Environ. Res. Public Health 2023, 20, 5633. [Google Scholar] [CrossRef] [PubMed]
  3. Ralapanawa, U.; Sivakanesan, R. Epidemiology and the Magnitude of Coronary Artery Disease and Acute Coronary Syndrome: A Narrative Review. J. Epidemiol. Glob. Health 2021, 11, 169–177. [Google Scholar] [CrossRef] [PubMed]
  4. Li, Z.; Lin, L.; Wu, H.; Yan, L.; Wang, H.; Yang, H.; Li, H. Global, Regional, and National Death, and Disability-Adjusted Life-Years (DALYs) for Cardiovascular Disease in 2017 and Trends and Risk Analysis from 1990 to 2017 Using the Global Burden of Disease Study and Implications for Prevention. Front. Public Health 2021, 9, 559751. [Google Scholar] [CrossRef]
  5. Olawade, D.B.; Soladoye, A.A.; Omodunbi, B.A.; Aderinto, N.; Adeyanju, I.A. Comparative analysis of machine learning models for coronary artery disease prediction with optimized feature selection. Int. J. Cardiol. 2022, 436, 133443. [Google Scholar] [CrossRef]
  6. Petersen-Uribe, Á.; Kremser, M.; Rohlfing, A.-K.; Castor, T.; Kolb, K.; Dicenta, V.; Emschermann, F.; Li, B.; Borst, O.; Rath, D.; et al. Platelet-Derived PCSK9 Is Associated with LDL Metabolism and Modulates Atherothrombotic Mechanisms in Coronary Artery Disease. Int. J. Mol. Sci. 2021, 22, 11179. [Google Scholar] [CrossRef]
  7. Kandasamy, G.; Subramani, T.; Almanasef, M.; Orayj, K.; Shorog, E.; Alshahrani, A.M.; Alanazi, T.S.; Majeed, A. Exploring Factors Affecting Health-Related Quality of Life in Coronary Artery Disease Patients. Medicina 2025, 61, 824. [Google Scholar] [CrossRef]
  8. Vasić, A.; Vasiljević, Z.; Mickovski-Katalina, N.; Mandić-Rajčević, S.; Soldatović, I. Temporal Trends in Acute Coronary Syndrome Mortality in Serbia in 2005–2019: An Age–Period–Cohort Analysis Using Data from the Serbian Acute Coronary Syndrome Registry (RAACS). Int. J. Environ. Res. Public Health 2022, 19, 14457. [Google Scholar] [CrossRef]
  9. Bauersachs, R.; Zeymer, U.; Brière, J.B.; Marre, C.; Bowrin, K.; Huelsebeck, M. Burden of Coronary Artery Disease and Peripheral Artery Disease: A Literature Review. Cardiovasc. Ther. 2019, 2019, 8295054. [Google Scholar] [CrossRef]
  10. Nasarian, E.; Sharifrazi, D.; Mohsenirad, S.; Tsui, K.; Alizadehsani, R. AI Framework for Early Diagnosis of Coronary Artery Disease: An Integration of Borderline SMOTE, Autoencoders and Convolutional Neural Networks Approach. arXiv 2023, arXiv:2308.15339. [Google Scholar] [CrossRef]
  11. Gupta, A.; Arora, H.S.; Kumar, R.; Raman, B. DMHZ: A Decision Support System Based on Machine Computational Design for Heart Disease Diagnosis Using Z-Alizadeh Sani Dataset. In Proceedings of the 2021 International Conference on Information Networking (ICOIN), Jeju Island, Republic of Korea, 13–16 January 2021; pp. 818–823. [Google Scholar] [CrossRef]
  12. Alizadehsani, R.; Roshanzamir, M.; Abdar, M.; Beykikhoshk, A.; Zangooei, M.H.; Khosravi, A.; Nahavandi, S.; Tan, R.S.; Acharya, U.R. Model Uncertainty Quantification for Diagnosis of Each Main Coronary Artery Stenosis. Soft Comput. 2020, 24, 10149–10160. [Google Scholar] [CrossRef]
  13. Gupta, A.; Kumar, R.; Arora, H.S.; Sharma, A.; Al-Turjman, F.; Altrjman, C. C-CADZ: Computational Intelligence System for Coronary Artery Disease Detection Using Z-Alizadeh Sani Dataset. Appl. Intell. 2022, 52, 2436–2464. [Google Scholar] [CrossRef]
  14. Joloudari, J.H.; Azizi, F.; Nematollahi, M.A.; Alizadehsani, R.; Hassannataj, E.; Mosavi, A. GSVMA: A Genetic-Support Vector Machine-Anova Method for CAD Diagnosis Based on Z-Alizadeh Sani Dataset. Front. Cardiovasc. Med. 2021, 8, 760178. [Google Scholar] [CrossRef]
  15. Sayadi, M.; Varadarajan, V.; Sadoughi, F.; Chopannejad, S.; Langarizadeh, M. A Machine Learning Model for Detection of Coronary Artery Disease Using Noninvasive Clinical Parameters. Life 2022, 12, 1933. [Google Scholar] [CrossRef]
  16. Apostolopoulos, I.D. Investigating the Synthetic Minority Class Oversampling Technique (SMOTE) on an Imbalanced Cardiovascular Disease (CVD) Dataset. Int. J. Eng. Appl. Sci. Technol. 2020, 4, 431–434. [Google Scholar] [CrossRef]
  17. Darba, S.; Safaei, N.; Mahboub-Ahari, A.; Nosratnejad, S.; Alizadeh, G.; Ameri, H.; Yousefi, M. Direct and Indirect Costs Associated with Coronary Artery (Heart) Disease in Tabriz, Iran. Risk Manag. Healthc. Policy 2020, 13, 969–978. [Google Scholar] [CrossRef] [PubMed]
  18. Alizadehsani, R.; Roshanzamir, M.; Sani, Z. Z-Alizadeh Sani [Dataset]. UCI Machine Learning Repository. 2013. Available online: https://doi.org/10.24432/C5Q31T (accessed on 30 October 2025). [CrossRef]
  19. Bolikulov, F.; Nasimov, R.; Rashidov, A.; Akhmedov, F.; Cho, Y.-I. Effective Methods of Categorical Data Encoding for Artificial Intelligence Algorithms. Mathematics 2024, 12, 2553. [Google Scholar] [CrossRef]
  20. Kayhan, E.C.; Ekmekcioğlu, Ö. Coupling Different Machine Learning and Meta-Heuristic Optimization Techniques to Generate the Snow Avalanche Susceptibility Map in the French Alps. Water 2024, 16, 3247. [Google Scholar] [CrossRef]
  21. Demircioğlu, A. The Effect of Feature Normalization Methods in Radiomics. Insights Imaging 2024, 15, 2. [Google Scholar] [CrossRef]
  22. Mora-de-León, L.P.; Solís-Martín, D.; Galán-Páez, J.; Borrego-Díaz, J. Text-Conditioned Diffusion-Based Synthetic Data Generation for Turbine Engine Sensor Analysis and RUL Estimation. Machines 2025, 13, 374. [Google Scholar] [CrossRef]
  23. Mohtasham, F.; Pourhoseingholi, M.; Hashemi Nazari, S.S.; Kavousi, K.; Zali, M.R. Comparative Analysis of Feature Selection Techniques for COVID-19 Dataset. Sci. Rep. 2024, 14, 18627. [Google Scholar] [CrossRef]
  24. Singh, V.; Pencina, M.; Einstein, A.J.; Liang, J.X.; Berman, D.S.; Slomka, P. Impact of Train/Test Sample Regimen on Performance Estimate Stability of Machine Learning in Cardiovascular Imaging. Sci. Rep. 2021, 11, 14490. [Google Scholar] [CrossRef] [PubMed]
  25. Salmi, M.; Atif, D.; Oliva, D.; Abraham, A.; Ventura, S. Handling Imbalanced Medical Datasets: Review of a Decade of Research. Artif. Intell. Rev. 2024, 57, 273. [Google Scholar] [CrossRef]
  26. Alharbi, F. A Comparative Study of SMOTE and ADASYN for Multiclass Classification of IoT Anomalies. ResearchGate 2023, 17, 15–24. Available online: https://www.researchgate.net/publication/392309026_A_comparative_study_of_SMOTE_and_ADASYN_for_multiclass_classification_of_IoT_anomalies (accessed on 12 September 2025). [CrossRef]
  27. Imani, M.; Beikmohammadi, A.; Arabnia, H.R. Comprehensive Analysis of Random Forest and XGBoost Performance with SMOTE, ADASYN, and GNUS Under Varying Imbalance Levels. Technologies 2025, 13, 88. [Google Scholar] [CrossRef]
  28. Yan, L.; Xu, Y. XGBoost-Enhanced Graph Neural Networks: A New Architecture for Heterogeneous Tabular Data. Appl. Sci. 2024, 14, 5826. [Google Scholar] [CrossRef]
  29. Luo, G.; Arshad, M.A.; Luo, G. Decision Trees for Strategic Choice of Augmenting Management Intuition with Machine Learning. Symmetry 2025, 17, 976. [Google Scholar] [CrossRef]
  30. Zhou, J.; Tong, X.; Bai, S.; Zhou, J. A LightGBM-Based Power Grid Frequency Prediction Method with Dynamic Significance–Correlation Feature Weighting. Energies 2025, 18, 3308. [Google Scholar] [CrossRef]
  31. Chang, Y.-J.; Lin, Y.-L.; Pai, P.-F. Support Vector Machines with Hyperparameter Optimization Frameworks for Classifying Mobile Phone Prices in Multi-Class. Electronics 2025, 14, 2173. [Google Scholar] [CrossRef]
  32. Taherdoost, H. Deep Learning and Neural Networks: Decision-Making Implications. Symmetry 2023, 15, 1723. [Google Scholar] [CrossRef]
  33. Bradshaw, T.J.; Huemann, Z.; Hu, J.; Rahmim, A. A Guide to Cross-Validation for Artificial Intelligence in Medical Imaging. Radiol. Artif. Intell. 2023, 5, e220232. [Google Scholar] [CrossRef]
  34. van Smeden, M.; Heinze, G.; Van Calster, B.; Asselbergs, F.W.; Vardas, P.E.; Bruining, N.; de Jaegere, P.; Moore, J.H.; Denaxas, S.; Boulesteix, A.L.; et al. Critical Appraisal of Artificial Intelligence-Based Prediction Models for Cardiovascular Disease. Eur. Heart J. 2022, 43, 2921–2930. [Google Scholar] [CrossRef]
  35. Nahm, F.S. Receiver Operating Characteristic Curve: Overview and Practical Use for Clinicians. Korean J. Anesthesiol. 2022, 75, 25–36. [Google Scholar] [CrossRef]
  36. Huang, Y.; Li, W.; Macheret, F.; Gabriel, R.A.; Ohno-Machado, L. A Tutorial on Calibration Measurements and Calibration Models for Clinical Prediction Models. J. Am. Med. Inform. Assoc. 2020, 27, 621–633. [Google Scholar] [CrossRef]
  37. Lundberg, S.M.; Erion, G.; Chen, H.; DeGrave, A.; Prutkin, J.M.; Nair, B.; Katz, R.; Himmelfarb, J.; Bansal, N. From Local Explanations to Global Understanding with Explainable AI for Trees. Nat. Mach. Intell. 2020, 2, 56–67. [Google Scholar] [CrossRef] [PubMed]
  38. Hicks, S.A.; Strümke, I.; Thambawita, V.; Hammou, M.; Riegler, M.A.; Halvorsen, P.; Parasa, S. On Evaluation Metrics for Medical Applications of Artificial Intelligence. Sci. Rep. 2022, 12, 5979. [Google Scholar] [CrossRef]
  39. Lawton, J.; Tamis-Holland, J.; Bangalore, S.; Bates, E.R.; Beckie, T.M.; Bischoff, J.M.; Bittl, J.A.; Cohen, M.G.; DiMaio, J.M.; Don, C.W.; et al. 2021 ACC/AHA/SCAI Guideline for Coronary Artery Revascularization: A Report of the American College of Cardiology/American Heart Association Joint Committee on Clinical Practice Guidelines. J. Am. Coll. Cardiol. 2022, 79, e21–e129. [Google Scholar] [CrossRef] [PubMed]
  40. Visseren, F.L.J.; Mach, F.; Smulders, Y.M.; Carballo, D.; Koskinas, K.C.; Bäck, M.; Benetos, A.; Biffi, A.; Boavida, J.-M.; Capodanno, D.; et al. 2021 ESC Guidelines on Cardiovascular Disease Prevention in Clinical Practice. Eur. Heart J. 2021, 42, 3227–3337. [Google Scholar] [CrossRef] [PubMed]
  41. American Diabetes Association Professional Practice Committee. 10. Cardiovascular Disease and Risk Management: Standards of Medical Care in Diabetes–2022. Diabetes Care 2022, 45 (Suppl. S1), S144–S174. [Google Scholar] [CrossRef]
  42. Kim, M.S.; Kim, W.J.; Khera, A.V.; Yon, D.K.; Lee, S.W.; Shin, J.I.; Won, H.H. Association between Adiposity and Cardiovascular Outcomes: An Umbrella Review and Meta-Analysis of Observational and Mendelian Randomization Studies. Eur. Heart J. 2021, 42, 3388–3403. [Google Scholar] [CrossRef] [PubMed]
  43. Riley, R.D.; Collins, G.S.; Debray, T.P.A.; Dhiman, P.; Ma, J.; Schlussel, M.M.; Archer, L.; Van Calster, B.; Harrell, F.E.; Martin, G.P.; et al. Evaluation of Clinical Prediction Models (Part 2): How to Undertake and Report External Validation. BMJ 2024, 384, e074819. [Google Scholar] [CrossRef]
  44. Joseph, J.J.; Deedwania, P.; Acharya, T.; Aguilar, D.; Bhatt, D.L.; Chyun, D.A.; Di Palo, K.E.; Golden, S.H.; Sperling, L.S. Comprehensive Management of Cardiovascular Risk Factors for Adults with Type 2 Diabetes: A Scientific Statement from the American Heart Association. Circulation 2022, 145, e722–e759. [Google Scholar] [CrossRef]
  45. Virani, S.S.; Newby, L.K.; Arnold, S.V.; Bittner, V.; Brewer, L.C.; Demeter, S.H.; Dixon, D.L.; Fearon, W.F.; Hess, B.; Johnson, H.M.; et al. 2023 AHA/ACC/ACCP/ASPC/NLA/PCNA Guideline for the Management of Patients with Chronic Coronary Disease. Circulation 2023, 148, e9–e119. [Google Scholar] [CrossRef]
  46. Mach, F.; Baigent, C.; Catapano, A.L.; Koskinas, K.C.; Casula, M.; Badimon, L.; Chapman, M.J.; De Backer, G.G.; Delgado, V.; Ference, B.A.; et al. 2019 ESC/EAS Guidelines for the Management of Dyslipidaemias: Lipid Modification to Reduce Cardiovascular Risk. Eur. Heart J. 2020, 41, 111–188. [Google Scholar] [CrossRef] [PubMed]
  47. Cho, J.H.; Shin, S.Y.; Kim, H.; Kim, M.; Byeon, K.; Jung, M.; Kang, K.-W.; Lee, W.-S.; Kim, S.-W.; Lip, G.Y.H. Smoking Cessation and Incident Cardiovascular Disease. JAMA Netw. Open 2024, 7, e2442639. [Google Scholar] [CrossRef] [PubMed]
  48. Cho, E.R.; Brill, I.K.; Gram, I.T.; Brown, P.E.; Jha, P. Smoking Cessation and Short- and Longer-Term Mortality. NEJM Evid. 2024, 3, 3. [Google Scholar] [CrossRef] [PubMed]
  49. Losin, I.; Zick, Y.; Peled, Y.; Arbel, Y. The Treatment of Coronary Artery Disease in Patients with Chronic Kidney Disease: Gaps, Challenges and Solutions. Kidney Dis. 2023, 9, 423–436. [Google Scholar] [CrossRef]
  50. Meng, K.; Zhang, X.; Liu, W.; Xu, Z.; Xie, B.; Dai, H. Prevalence and Impact of COPD in Ischemic Heart Disease: A Systematic Review and Meta-Analysis. Int. J. Chron. Obstruct. Pulmon. Dis. 2024, 19, 2333–2345. [Google Scholar] [CrossRef]
  51. Kibbler, J.; Stefan, M.S.; Thanassoulis, G.; Ripley, D.P.; Bourke, S.C.; Steer, J. Prevalence of Undiagnosed Left Ventricular Systolic Dysfunction in COPD: A Systematic Review and Meta-Analysis. ERJ Open Res. 2023, 9, 00548–2023. [Google Scholar] [CrossRef]
  52. Zhang, B.; Zhu, W.; Wei, Y.; Li, Z.-F.; An, Z.-Y.; Zhang, L.; Wang, J.-Y.; Hao, M.-D.; Jin, Y.-J.; Li, D.; et al. Association between Asthma and All-Cause Mortality and Cardiovascular Disease Morbidity and Mortality: A Meta-Analysis of Cohort Studies. Front. Cardiovasc. Med. 2022, 9, 861798. [Google Scholar] [CrossRef]
  53. Valencia-Hernández, C.A.; Del Greco, M.F.; Sundaram, V.; Portas, L.; Minelli, C.; Bloom, C.I. Asthma and Incident Coronary Heart Disease: An Observational and Mendelian Randomisation Study. Eur. Respir. J. 2023, 62, 2301788. [Google Scholar] [CrossRef] [PubMed]
  54. Tomii, D.; Pilgrim, T.; Borger, M.A.; De Backer, O.; Lanz, J.; Reineke, D.; Siepe, M.; Windecker, S. Aortic Stenosis and Coronary Artery Disease: Decision-Making between Surgical and Transcatheter Management. Circulation 2024, 150, 2046–2069. [Google Scholar] [CrossRef] [PubMed]
  55. Larsson, S.C.; Gill, D. Mendelian Randomization for Cardiovascular Diseases: A Comprehensive Review. Eur. Heart J. 2023, 44, 3278–3291. [Google Scholar] [CrossRef] [PubMed]
  56. Zúñiga, D.; Balasubramanian, S.; Mehmood, K.T.; Al-Baldawi, S.; Salazar, G.Z. Hypothyroidism and Cardiovascular Disease: A Review. Cureus 2024, 16, e52512. [Google Scholar] [CrossRef]
  57. Evron, J.M.; Papaleontiou, M. Decision Making in Subclinical Thyroid Disease. Med. Clin. N. Am. 2021, 105, 1033–1045. [Google Scholar] [CrossRef]
  58. Heidenreich, P.A.; Bozkurt, B.; Aguilar, D.; Allen, L.A.; Byun, J.J.; Colvin, M.M.; Deswal, A.; Drazner, M.H.; Dunlay, S.M.; Evers, L.R.; et al. 2022 AHA/ACC/HFSA Guideline for the Management of Heart Failure. Circulation 2022, 145, e895–e1032. [Google Scholar] [CrossRef]
  59. Papaioannou, N.; Myllis, G.; Tsimpiris, A.; Vrana, V. The Role of Mutual Information Estimator Choice in Feature Selection: An Empirical Study on mRMR. Information 2025, 16, 724. [Google Scholar] [CrossRef]
  60. Ali, I.; Rizvi, S.S.H.; Adil, S.H. Enhancing Software Quality with AI: A Transformer-Based Approach for Code Smell Detection. Appl. Sci. 2025, 15, 4559. [Google Scholar] [CrossRef]
  61. Santos, M.R.; Guedes, A.; Sanchez-Gendriz, I. SHapley Additive exPlanations (SHAP) for Efficient Feature Selection in Rolling Bearing Fault Diagnosis. Mach. Learn. Knowl. Extr. 2024, 6, 316–341. [Google Scholar] [CrossRef]
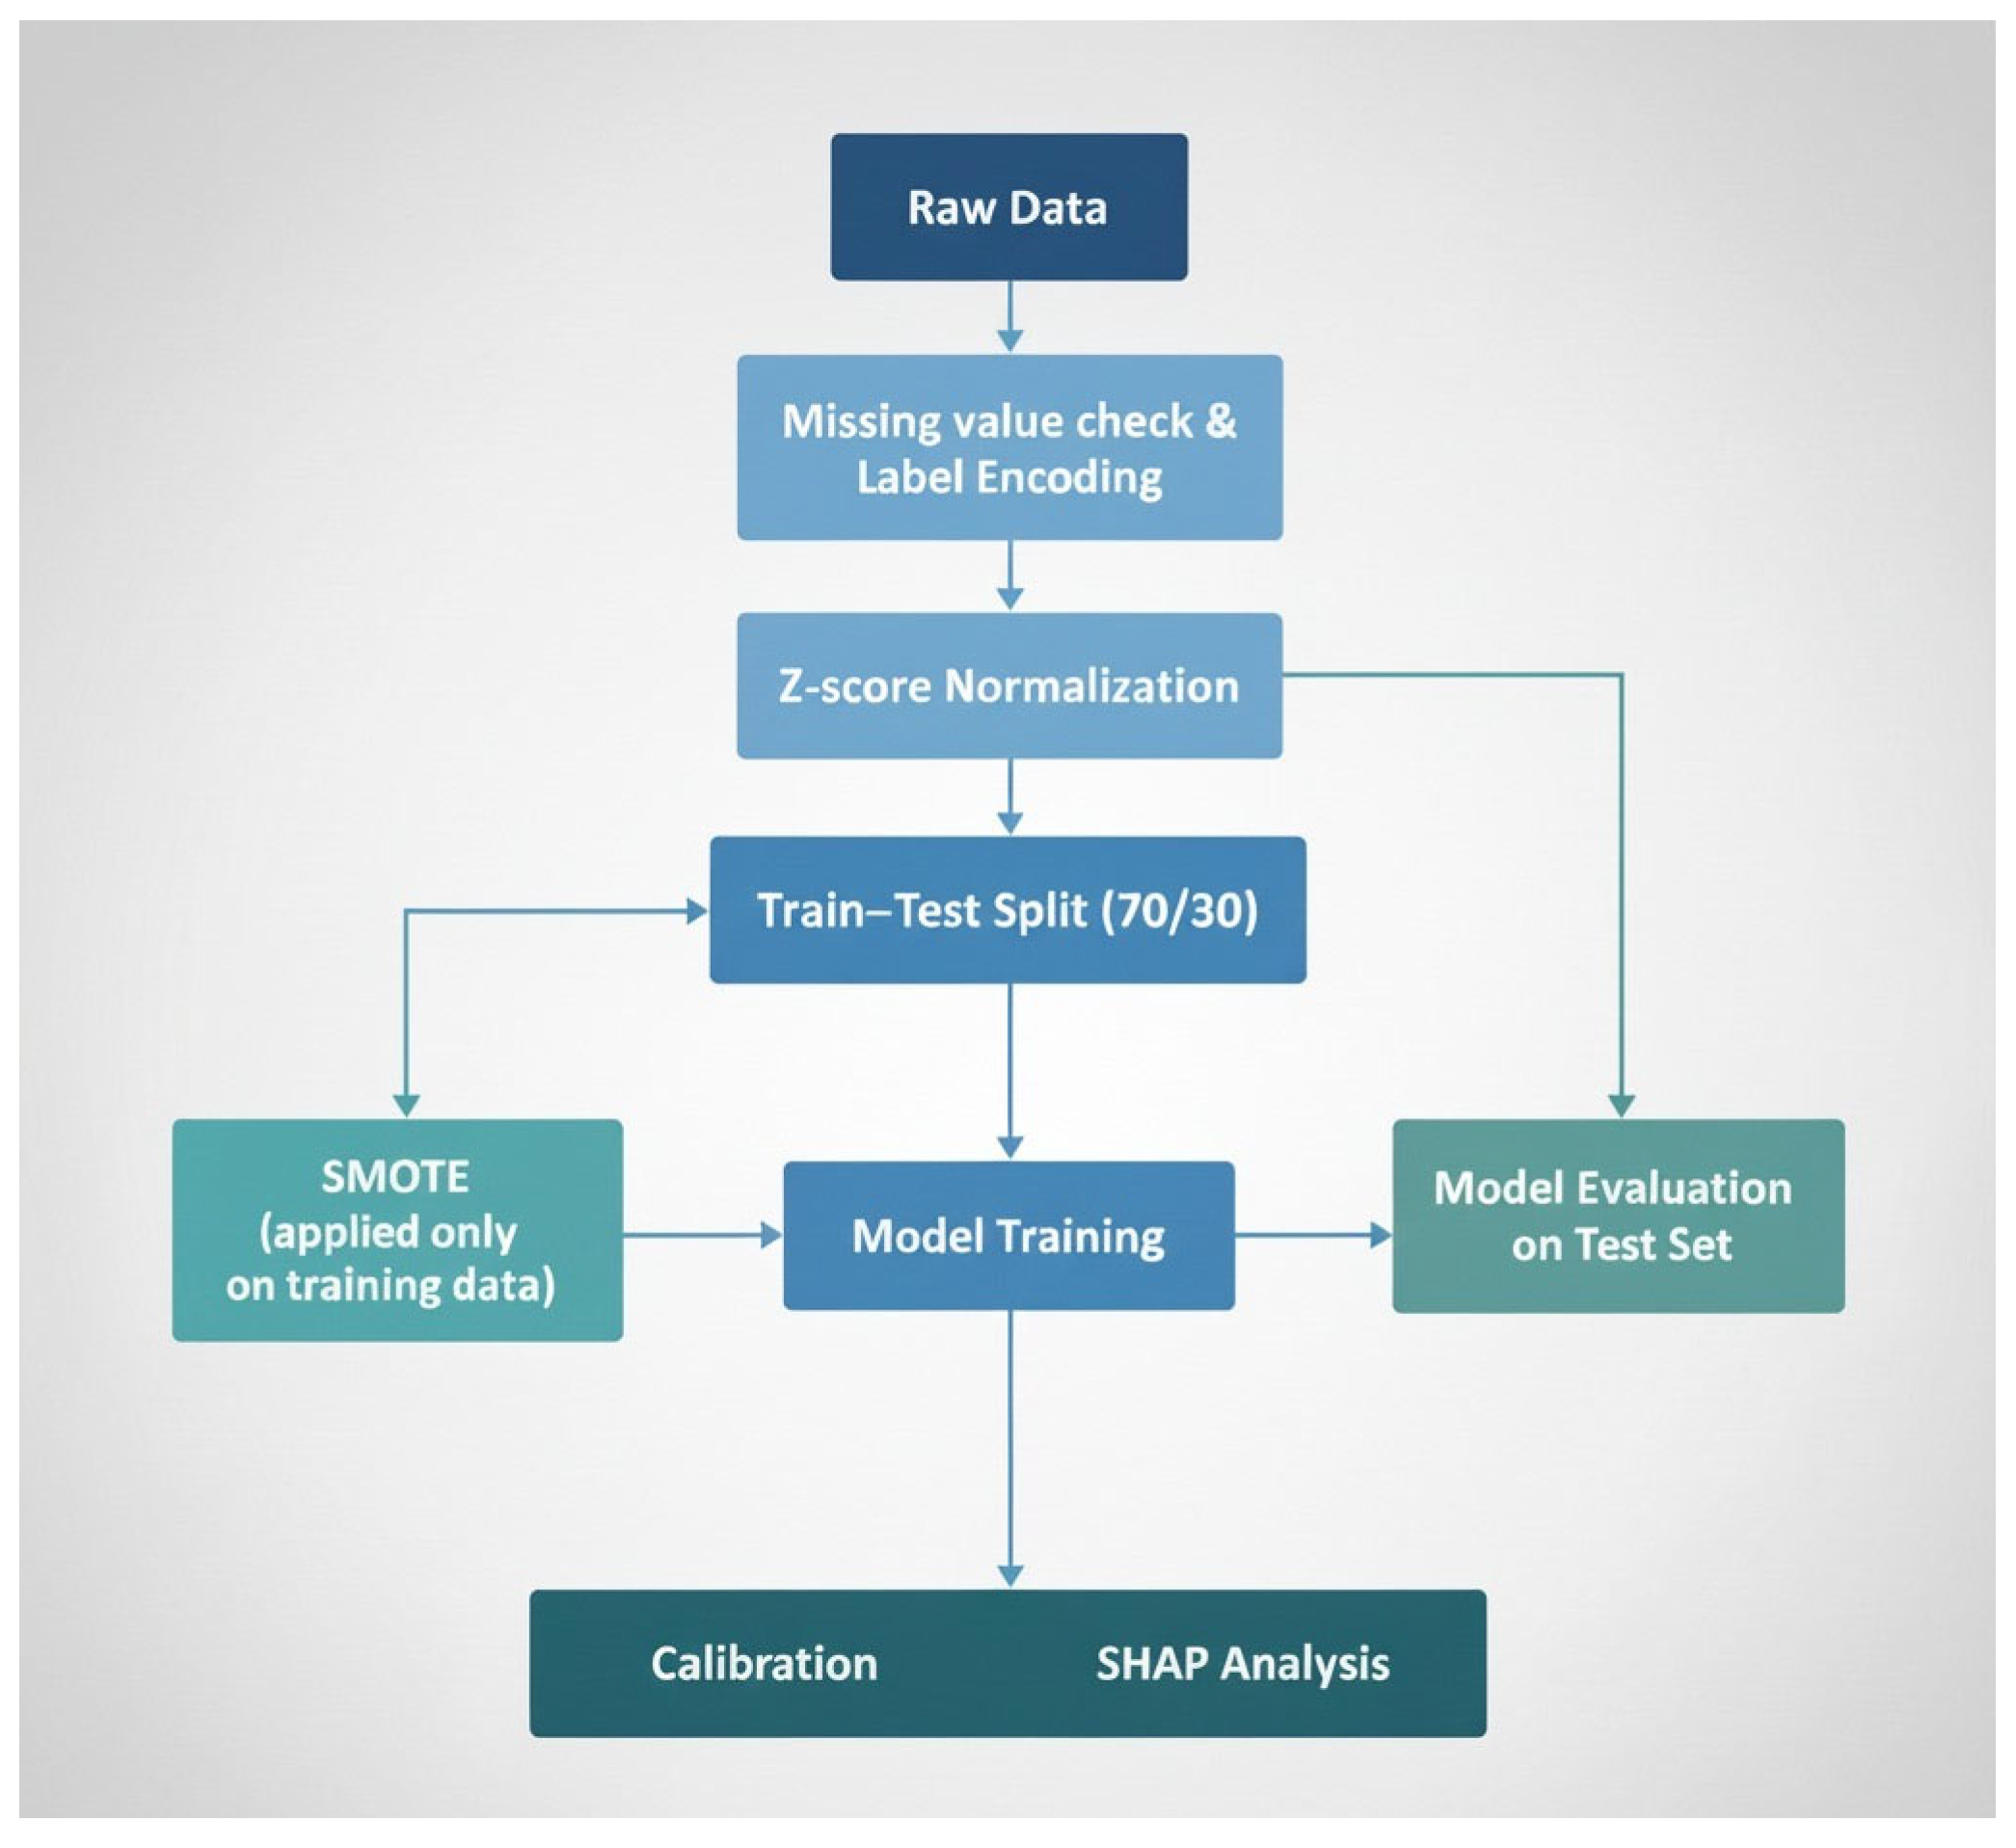
Figure 1. The pipeline of the Model training.
Algorithms 18 00697 g001
Figure 2. Mutual Information.
Algorithms 18 00697 g002
Figure 3. Confusion Matrix.
Algorithms 18 00697 g003
Figure 4. SHAP Feature Importance.
Algorithms 18 00697 g004
Figure 5. ROC Curve.
Algorithms 18 00697 g005
Figure 6. Calibration Plot (XGBoost).
Algorithms 18 00697 g006
Figure 7. SHAP Summary plot.
Algorithms 18 00697 g007
Table 1. Classification of Variables in the Study.
Variable GroupNumber of VariablesType (Numerical/Categorical/Yes-No)ExamplesRepresentation in Study
Demographic5Numerical + CategoricalAge (numerical), Sex (categorical)Continuous/Discrete
Risk Factors10Yes/No (binary)DM, HTN, Smoking, FHBinary (0/1)
Clinical Findings8Numerical + Yes/NoBP (numerical), Dyspnea (Yes/No)Mixed
ECG Variables7Yes/No (binary)Q Wave, ST Elevation, LVHBinary (0/1)
Laboratory15NumericalFBS, LDL, HDL, HB, CRContinuous
Echocardiographic6Numerical + Yes/NoEF-TTE (numerical), VHD (Yes/No)
Table 2. Model Performance Comparison.
ModelAccuracyPrecisionRecallF1_Score
LGBMClassifier0.87910.79170.76000.7755
ExtraTreesClassifier0.86810.78260.72000.7500
RandomForest0.89010.89470.68000.7727
SVM0.86810.78260.72000.7500
XGBoost0.90110.83330.80000.8163
Disclaimer/Publisher’s Note: The statements, opinions and data contained in all publications are solely those of the individual author(s) and contributor(s) and not of MDPI and/or the editor(s). MDPI and/or the editor(s) disclaim responsibility for any injury to people or property resulting from any ideas, methods, instructions or products referred to in the content.