Abstract
One of the main challenges when working with time series captured online using sensors is the appearance of noise or null values, generally caused by sensor failures or temporary disconnections. These errors compromise data reliability and can lead to incorrect decisions. Particularly in the treatment of diabetes mellitus, where medical decisions depend on continuous glucose monitoring (CGM) systems provided by modern sensors, the presence of corrupted data can pose a significant risk to patient health. This work presents an approach that encompasses online detection and imputation of anomalous data using physiological inputs (insulin and carbohydrate intake), which enables decision-making in automatic glucose monitoring systems or for glucose control purposes. Four deep neural network architectures are proposed: CNN-LSTM, GRU, 1D-CNN, and Transformer-LSTM, under a controlled fault injection protocol and compared with the ARIMA model and the Temporal Convolutional Network (TCN). The obtained performance is compared using regression (MAE, RMSE, MARD) and classification (accuracy, precision, recall, F1-score, AUC) metrics. Results show that the CNN-LSTM network is the most effective for fault detection, achieving an F1-score of 0.876 and an accuracy of 0.979. Regarding data imputation, the 1D-CNN network obtained the best performance, with an MAE of 2.96 mg/dL and an RMSE of 3.75 mg/dL. Then, validation on the OhioT1DM dataset, containing real CGM data with natural sensor disconnections, showed that the CNN–LSTM model accurately detected anomalies and reliably imputed missing glucose segments under real-world conditions.
1. Introduction
Type 1 diabetes mellitus (T1DM) is a chronic disease with significant clinical and social implications. Its effective management requires precise and continuous monitoring of blood glucose levels. Continuous glucose monitoring (CGM) systems have therefore become essential tools, providing real-time glucose data every few minutes throughout the day [1]. This high temporal resolution enables a deeper understanding of individual glycemic patterns and supports the development of more personalized and effective treatment strategies [2].
Despite their clinical utility, CGM devices are prone to anomalies such as sensor disconnections, signal noise, or abrupt drops in readings. These issues compromise data quality and may lead to inaccurate therapeutic decisions [3,4]. When missing or corrupted values appear online, immediate imputation becomes critical to ensure reliable operation of glucose control algorithms. However, conventional imputation methods [5,6] cannot update model parameters as new observations are received. Applying these offline approaches after each new reading is computationally costly and impractical. Furthermore, techniques such as expectation–maximization (EM) or multiple imputation by chained equations (MICE) often fail to capture the nonlinear and context-dependent nature of glucose metabolism [3,7]. In contrast, online strategies that incrementally reconstruct missing, false, corrupted or anomalous data can adapt to changing dynamics while reducing computational load.
In time-series analysis, detecting change points is a common goal, as these can indicate sensor faults or abnormal behavior. Identifying when and how these changes occur is crucial for clinical reliability, but missing or corrupted values typically hinder conventional detection algorithms.
To overcome these limitations, real-time fault detection mechanisms are required to identify anomalies, missing samples, or sensor failures as they occur. Prompt detection prevents error propagation and enables robust imputation, replacing corrupted glucose readings with physiologically plausible estimates. This approach enhances both reliability and safety in CGM-based decision-making, particularly for insulin dosing and closed-loop control systems [3,8].
Recent advances in deep learning have shown strong potential in addressing these challenges. Long Short-Term Memory (LSTM) networks can effectively capture temporal dependencies and complex physiological dynamics [2,8]. Other architectures, such as Convolutional Neural Networks (CNNs), excel at extracting spatiotemporal features and identifying subtle variations in glucose behavior [9,10]. Gated recurrent units (GRUs) offer similar capabilities with fewer parameters and faster convergence, making them suitable for real-time imputation in computationally constrained environments [10,11,12]. Meanwhile, hybrid Transformer–LSTM models combine self-attention with recurrence to enhance long-term prediction and interpretability [2]. For instance, Bian et al. [2] demonstrated that a Transformer–LSTM model outperformed standalone LSTM and conventional predictors at multiple forecasting horizons. Similarly, Acuna et al. [13] evaluated several offline imputation and smoothing strategies prior to training, showing that Transformer-based models surpassed XGBoost and 1D-CNNs when applied to the OhioT1DM dataset. These findings, along with other studies such as Shi et al. [14], underscore the adaptability of Transformer hybrids to complex, non-stationary time-series environments.
These advances highlight the growing relevance of deep learning for detecting and imputing missing or anomalous data from CGM systems. Unlike previous studies focused on offline preprocessing, this work emphasizes an online framework capable of detecting and correcting anomalies in real time while leveraging physiological inputs.
In this context, this study proposes a comprehensive framework that integrates real-time fault detection and online imputation of corrupted CGM sensor data using carbohydrate intake and insulin doses as auxiliary inputs. To determine the most effective model, four deep neural network architectures are developed and compared: (1) a hybrid Convolutional Neural Network–Long Short-Term Memory (CNN–LSTM), which exploits spatial–temporal features for improved predictions; (2) a gated recurrent unit (GRU), effective for modeling temporal dependencies with high computational efficiency; (3) a one-dimensional Convolutional Neural Network (1D-CNN), suitable for extracting local features from sequential data; and (4) a hybrid Transformer–LSTM, integrating attention mechanisms with recurrent processing for enhanced long-term glucose prediction.
All models are trained and validated using synthetic data generated from the Sorensen multi-compartment physiological model, which realistically simulates glucose–insulin–carbohydrate dynamics [15]. Their performance is also compared against the classical ARIMA model and the Temporal Convolutional Network (TCN) [16] to provide a broader evaluation of modeling strategies. Finally, to verify generalization under real-world conditions, the best-performing architecture is validated using the publicly available OhioT1DM dataset, which contains real CGM measurements with natural sensor disconnections. The main contribution of this work lies in systematically exploring and comparing multiple neural architectures for sensor fault detection and online glucose imputation, thereby improving CGM data reliability and supporting real-time therapeutic decision-making.
Throughout this paper, the terms fault and anomaly are used interchangeably to refer to deviations or errors detected in glucose data.
2. Materials and Methods
This section describes the materials and methods used in this study. First, we present the physiological basis and structure of the synthetic dataset used to simulate glucose–insulin–carbohydrate dynamics. Then, we outline the experimental design, including data preprocessing, partitioning, and evaluation procedures adopted to assess model performance.
2.1. Dataset Description
Synthetic data were generated to reproduce glucose–insulin dynamics in an adult with T1DM using the compartmental Sorensen physiological model [15]. This model comprises 19 ordinary differential equations (ODEs) representing glucose, insulin, glucagon, and metabolic fluxes across major compartments—liver, kidney, peripheral tissues, and subcutaneous regions—capturing nonlinear physiological interactions described in Appendix A.
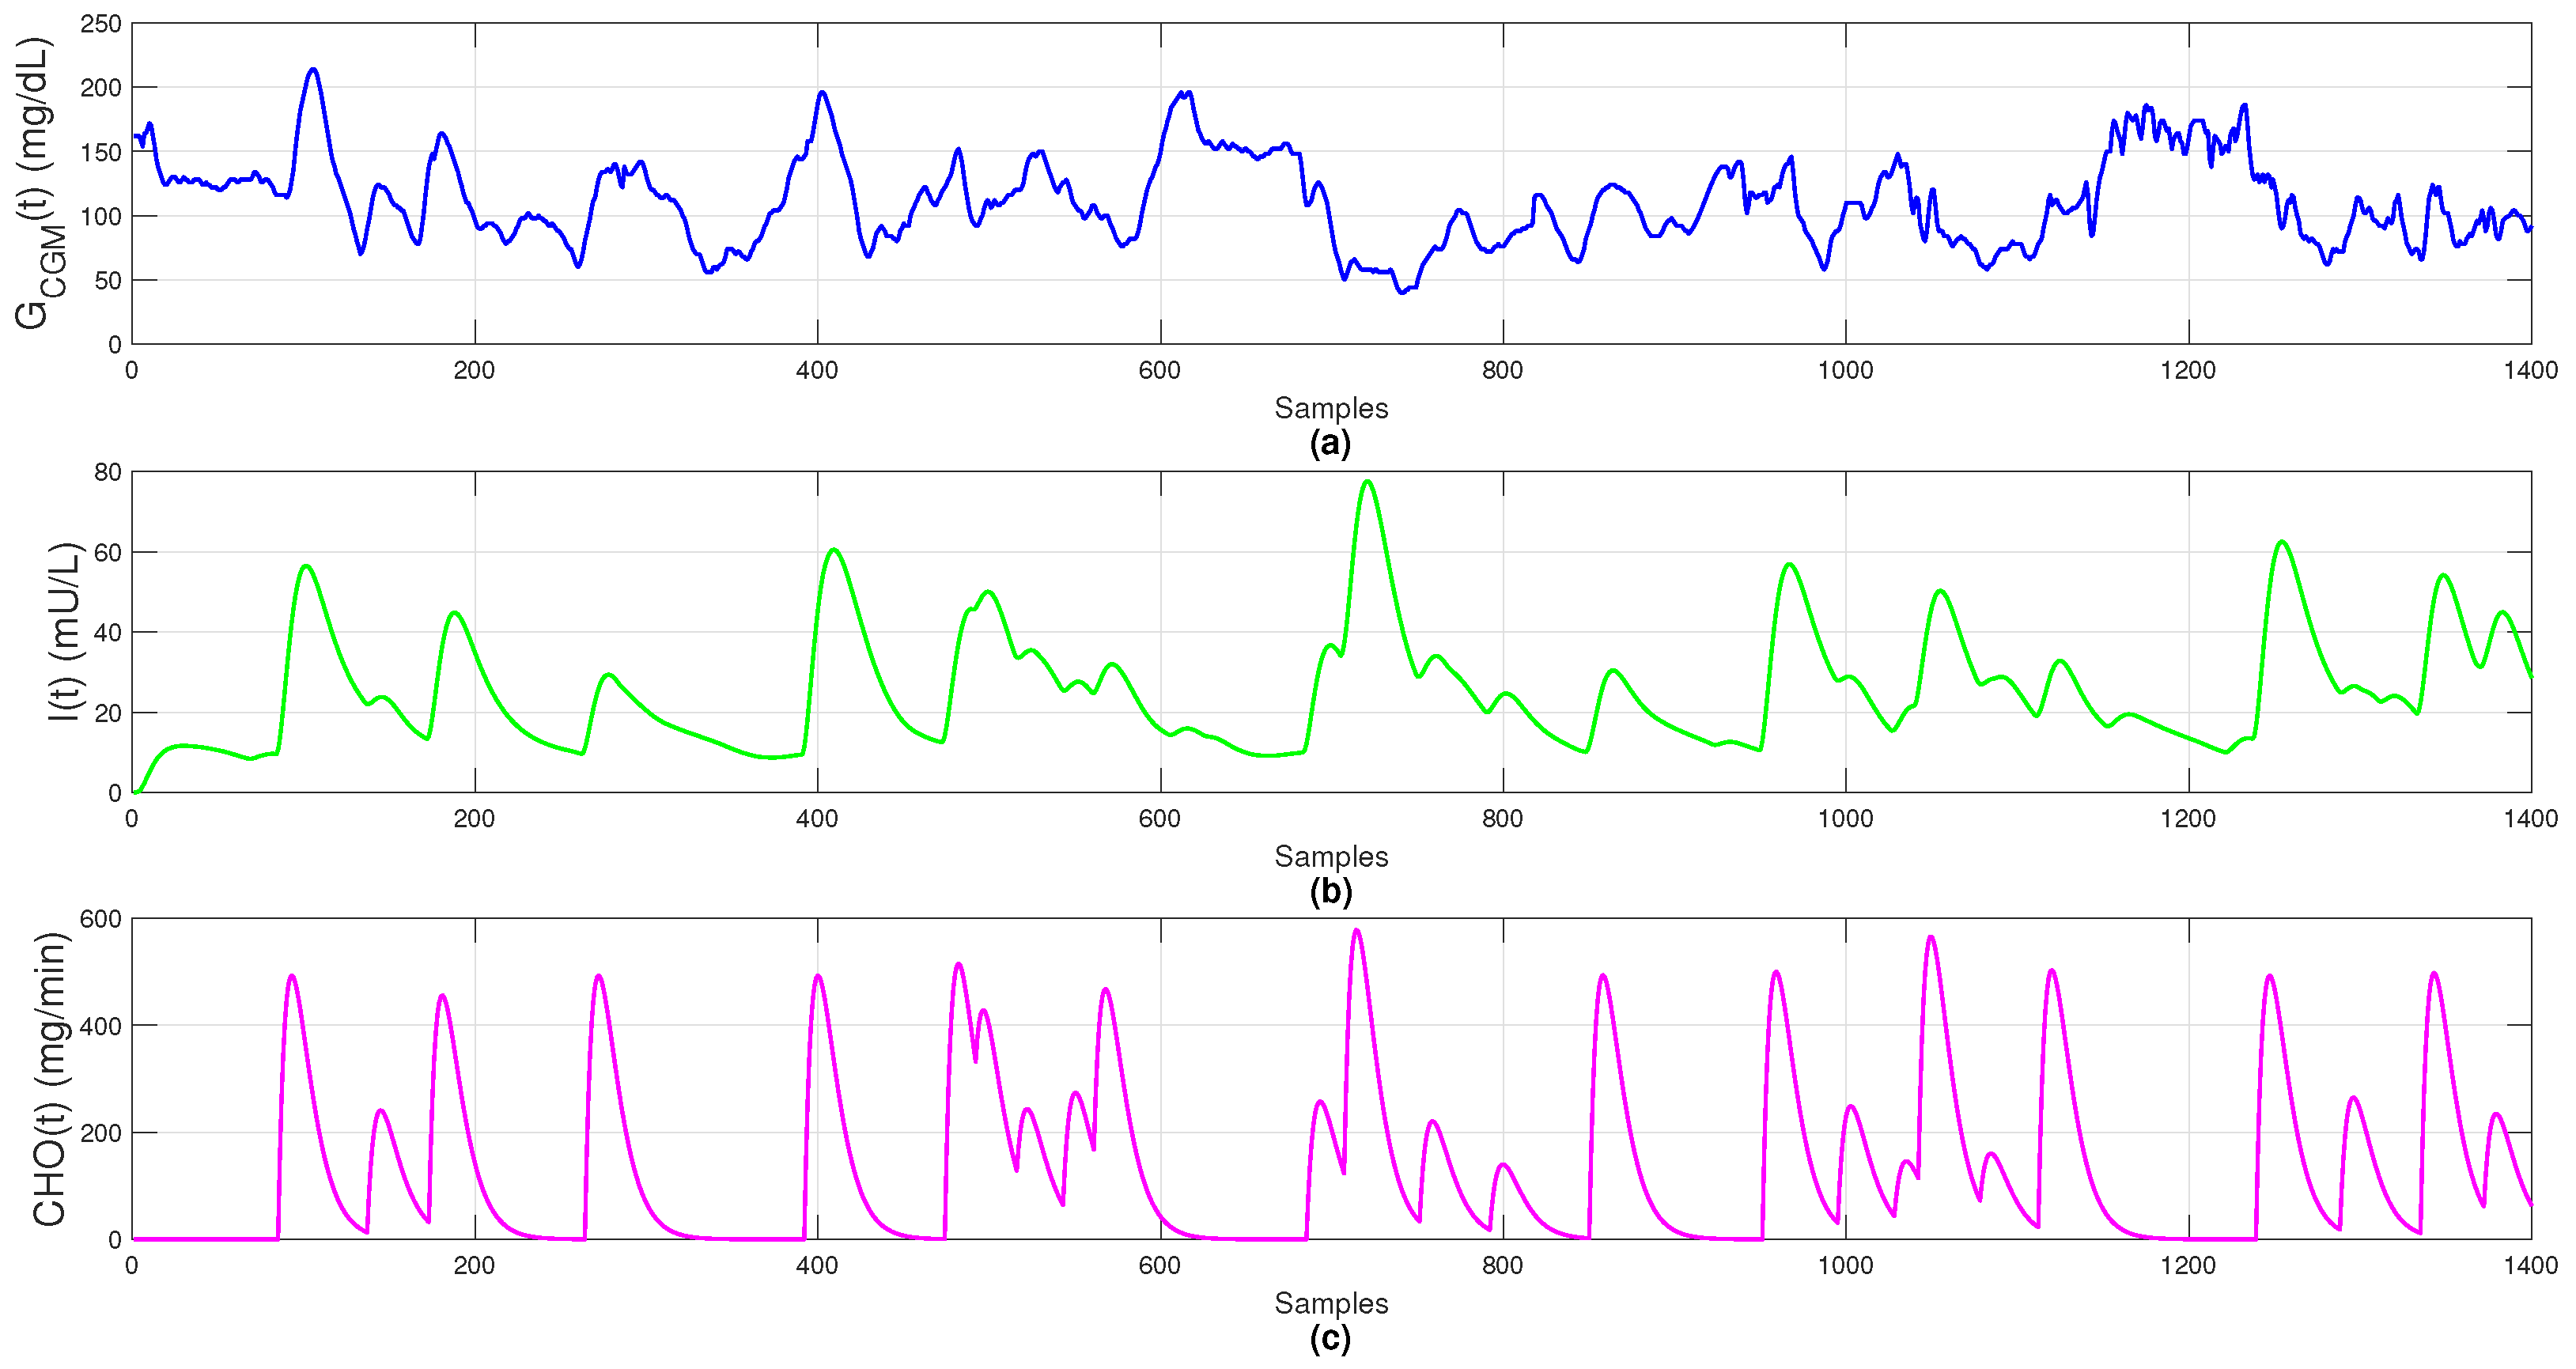
Simulation considered continuous absorption for both insulin and carbohydrates, rather than instantaneous spikes, reflecting realistic biological dynamics. Glucose concentration () represents plasma glucose measured by a CGM sensor (mg/dL); insulin concentration () denotes plasma insulin after basal and bolus administration (mU/L); and carbohydrate intake () models gastrointestinal absorption rates (mg/min).
The dataset includes 1400 observations sampled every 5 min over 5 simulated days, providing sufficient temporal granularity to capture glucose variability, insulin dynamics, and meal absorption, as shown in Figure 1.
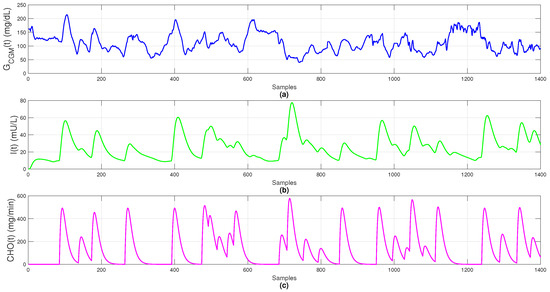
Figure 1.
Simulated data: (a) blood glucose (); (b) plasma insulin (); (c) carbohydrate absorption ().
By incorporating physiological absorption delays and nonlinear metabolic responses, the Sorensen model yields realistic, artifact-free data. It provides a reliable virtual environment for testing fault-detection strategies, control algorithms, and online imputation methods under near-clinical conditions, serving as the foundation for training and comparing both classical and neural models, including the Temporal Convolutional Network (TCN).
Physiological Input Variables
Exogenous insulin lowers plasma glucose with a delayed effect determined by subcutaneous absorption and elimination kinetics, while meals affect glycemia through carbohydrate digestion and intestinal absorption. Hence, including insulin dose and carbohydrate intake as model inputs is physiologically acceptable, and expressing them as absorption profiles aligns inputs with their causal timing, simplifying learning for recurrent models and improving prediction accuracy [17].
Accordingly, our input vector includes insulin and carbohydrate signals as exogenous drivers of glycemia and structures them to reflect delayed physiological responses. This representation allows deep models to learn the true timing of postprandial dynamics [17]. Beyond total carbohydrates, meal composition also influences later phases of the excursion, improving predictions at horizons about 30 to 60 minutes and supporting subject-specific modeling [18].
2.2. Experimental Design
The dataset was split chronologically into 80% for training (1120 samples) and 20% for testing (280 samples). Validation was performed online using the Sorensen model as a virtual patient. This preserves the temporal structure of physiological signals and ensures reproducibility through deterministic partitioning with a fixed random seed.
Since fault detection and imputation are performed online, minimal preprocessing is required. No outlier removal or smoothing was applied; only glucose values below 10 mg/dL were replaced with the latest model prediction to avoid instability during training. This choice follows prior work emphasizing that excessive filtering may remove informative variations crucial for real-time anomaly detection and data reconstruction [19].
Model inputs were prepared using a sliding window of previous glucose readings and a step size of 1, enabling point-by-point prediction. Each input vector includes six historical glucose values, the most recent plasma insulin, and the corresponding carbohydrate absorption, as discussed in Section 4.1. This structure provides both historical and physiological context for accurate predictions.
As statistical baselines, two non-recurrent models were implemented for comparison with deep architectures: an autoregressive integrated moving average (ARIMA) () model and a Temporal Convolutional Network (TCN). ARIMA parameters were selected by minimizing one-step-ahead validation mean squared error (MSE) using a rolling-origin strategy. For the TCN, architecture depth and dilation factors were optimized through grid search to balance accuracy and computational cost. Performance metrics for ARIMA and TCN are included in Results Section for comparison with the proposed architectures.
2.3. Fault-Injection Scenario
To evaluate the system ability to detect anomalous or missing data and perform online imputation, an independent test dataset was generated. This dataset was not used during model training or hyperparameter tuning, ensuring an unbiased assessment of final performance. It consists of 1400 synthetic glucose measurements obtained through simulations of Sorensen physiological model under realistic conditions that include variations in meal patterns and insulin dosing, emulating typical scenarios in individuals with T1DM. Data corruption was then introduced through controlled injection of anomalies and missing segments, reproducing two common failure modes observed in CGM sensors [20].
- (F1)
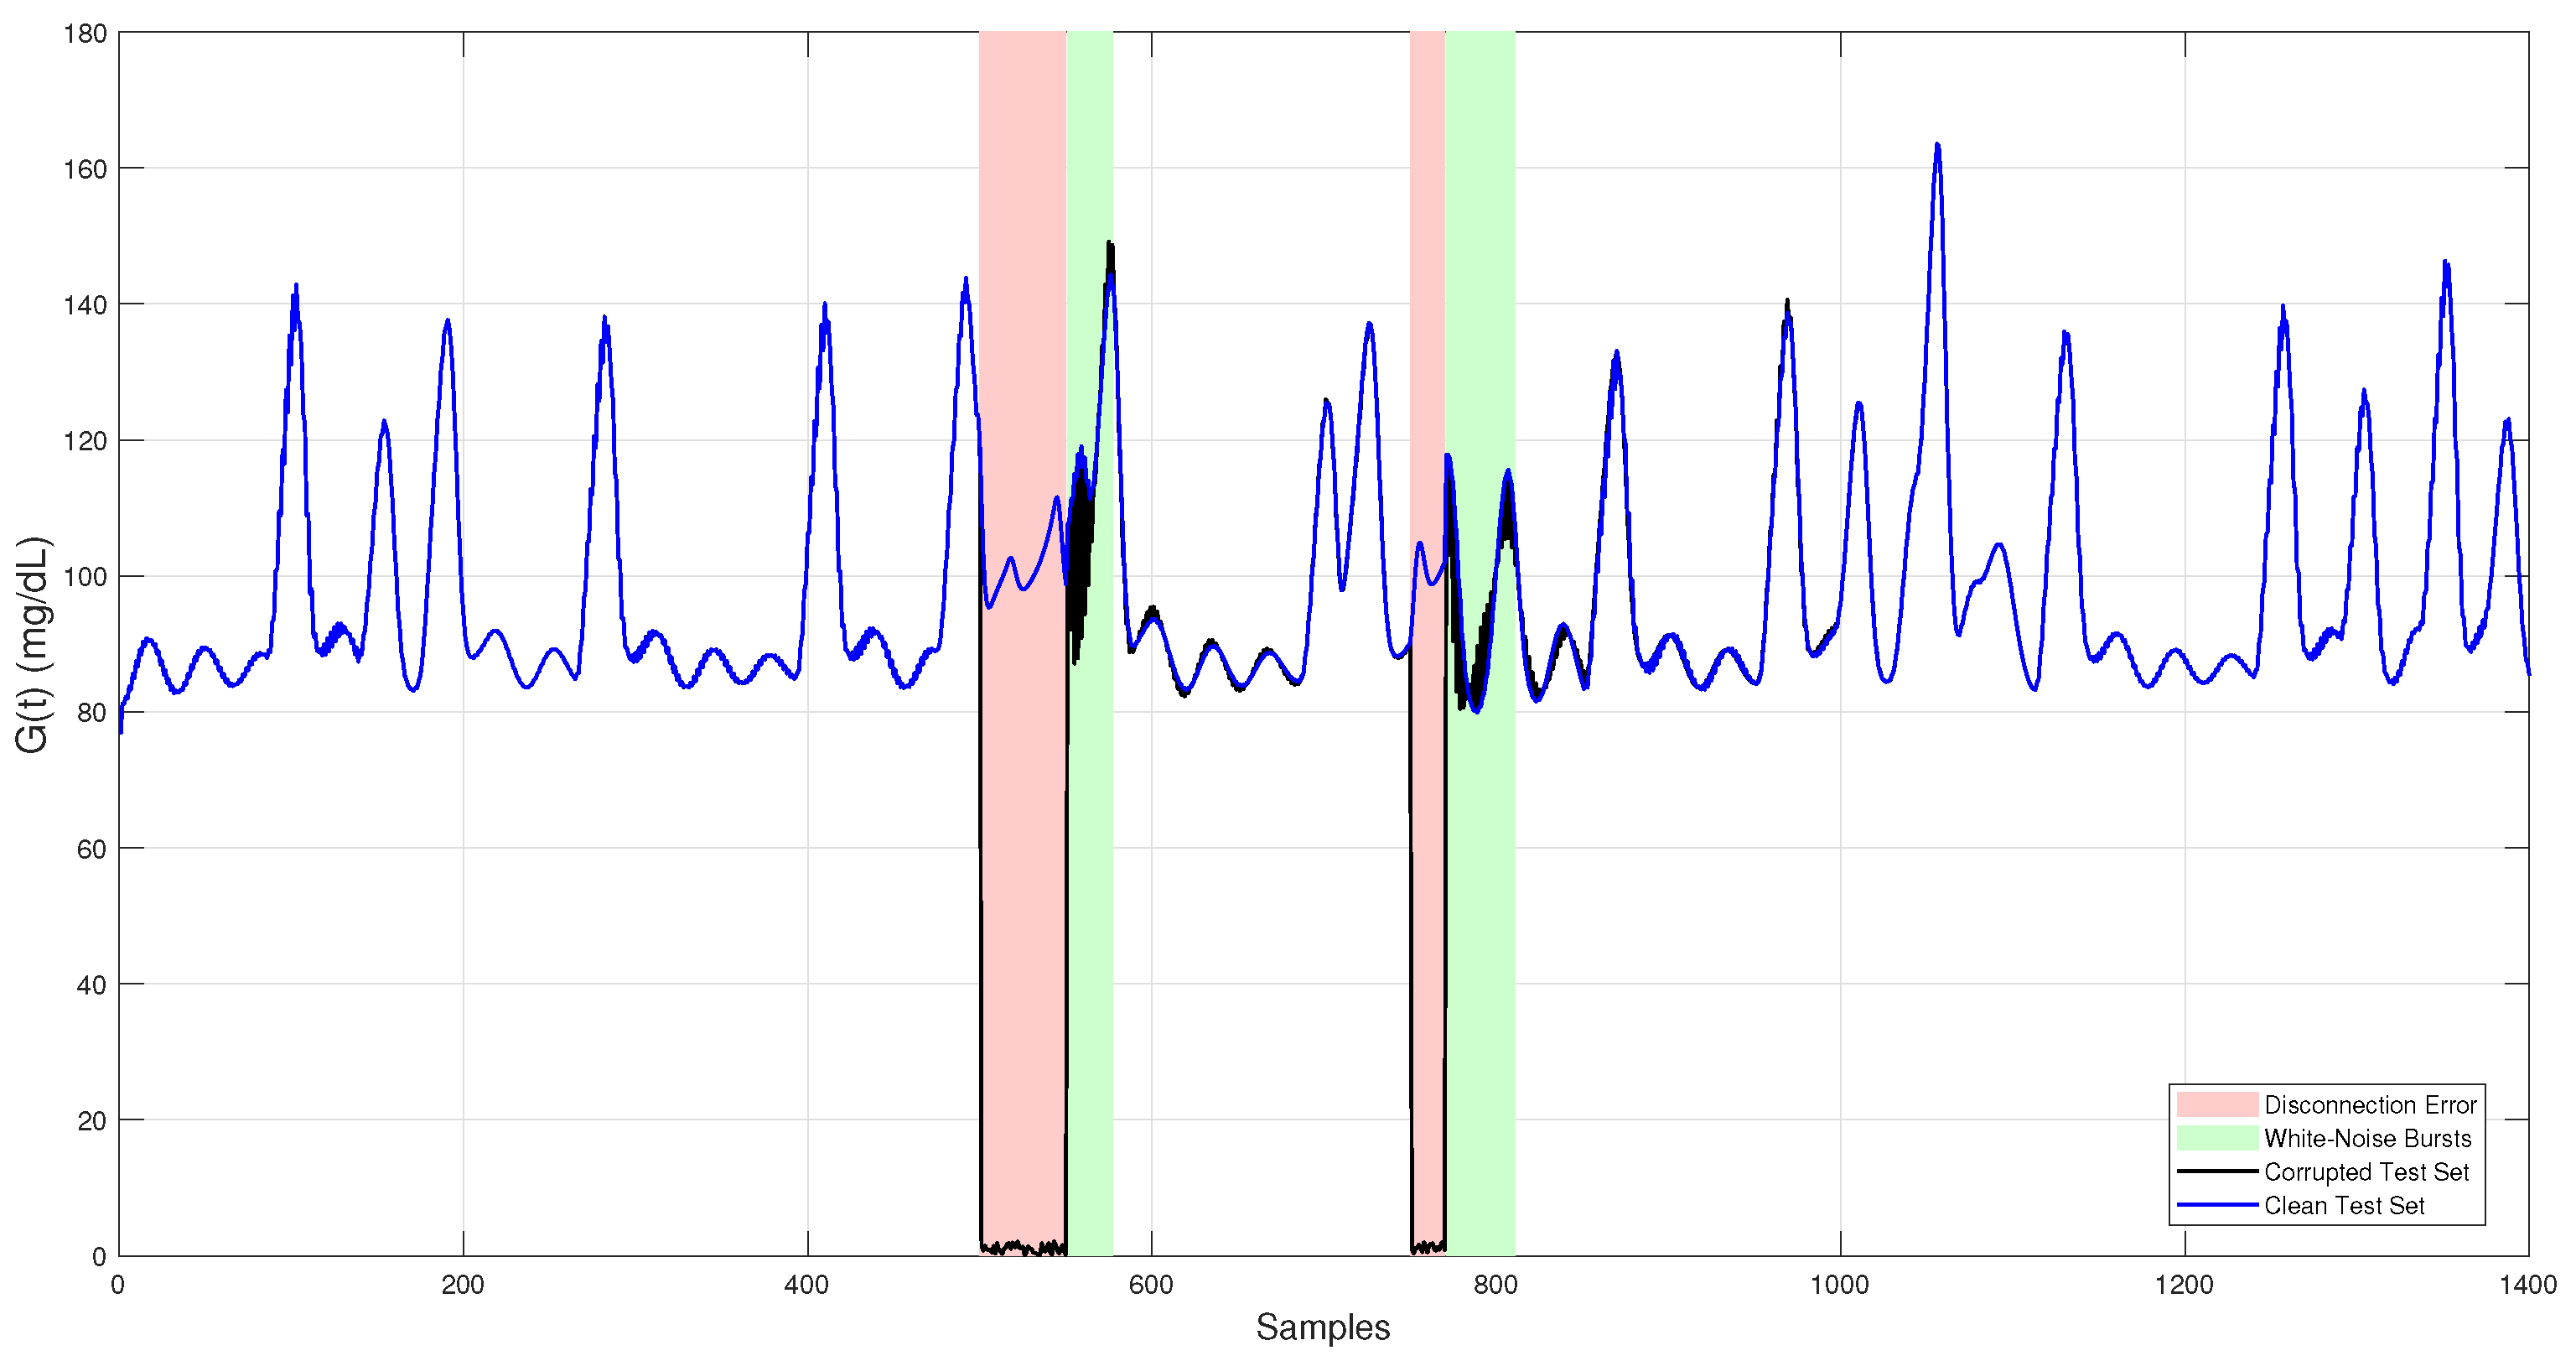
- White noise bursts: These faults appear as abrupt, short-lived fluctuations in the glucose signal caused by electronic or thermal noise, sensor degradation, wiring issues, electromagnetic interference, or slight displacements at the sensor–tissue interface. To reproduce this effect, Gaussian noise with a standard deviation of = 5.6 mg/dL and a maximum amplitude of 30 mg/dL was added to random segments of 20–40 samples, replicating the white noise error.
- (F2)
- Sensor disconnections: These failures manifest as sudden drops in the signal to near-zero or undefined (NaN) values, typically resulting from severe hardware problems such as power loss, partial or complete disconnection, or contact interruption with subcutaneous tissue. To model this scenario, glucose readings were replaced by near-zero values in two segments of 50 and 20 samples, corresponding approximately to 4 and 1.5 h, respectively. This event is categorized as a disconnection error or missing data.
Noise amplitudes ( = 5.6 mg/dL) and disconnection durations (1.5 h and 4 h) represent typical disturbances in commercial CGM devices; also, reported accuracy analyses of the FreeStyle Libre Pro device indicate mean deviations around ±15 mg/dL and transient signal losses lasting up to several hours in clinical settings [21], which are consistent with the magnitudes adopted in this study.
Introducing these faults into the test dataset created realistic conditions for assessing the robustness and accuracy of the proposed fault detection and imputation methods. The final corrupted test set used for evaluation is shown in Figure 2.
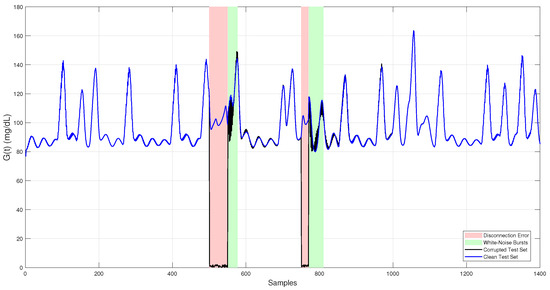
Figure 2.
Simulated CGM glucose trace used as the independent test set. The clean signal (blue) represents physiologically realistic glucose levels generated by the Sorensen model. The corrupted signal (black) includes two fault types: white noise bursts (green-shaded regions) and sensor dropouts (red-shaded regions).
3. Neural Network Models for Data Imputation
In this section, we introduce essential deep learning architectures employed for the online imputation of corrupted data in CGM sensor. Specifically, we discuss LSTM, GRU, 1D-CNNs, and Transformer-based models. For each architecture, we describe its operating principles, core mathematical formulations, and its relevance to real-time CGM data imputation.
3.1. Long Short-Term Memory (LSTM)
LSTM networks are a specialized form of recurrent neural networks (RNNs) designed to capture both short- and long-term temporal dependencies in sequential data. Unlike conventional RNNs, which often suffer from the vanishing gradient problem, LSTMs introduce a memory cell regulated by three gates input, forget, and output that control the flow of information over time. These mechanisms determine which information is retained, updated, or discarded, enabling the network to maintain relevant context across extended sequences [22].
Formally, the operations within an LSTM cell are described by the following equations [20,22]:
Here, is the input vector at time t (glucose, insulin, and meal information), is the previous hidden state, and the previous cell state. and are weight matrices, and the bias vectors for each gate. The logistic activation maps values to [0, 1], controlling gate activation, while provides bounded nonlinear transformations. The forget gate scales the previous memory, the input gate controls how new information is incorporated, and the output gate determines how much of the updated memory contributes to the new hidden state .
These mechanisms allow LSTM networks to retain relevant information across long temporal horizons, which is particularly valuable for modeling nonlinear, time-varying systems such as physiological signals. In this context, LSTMs are especially effective for capturing delayed effects of insulin absorption or prolonged meal digestion, maintaining stability during extended dropouts, an advantage that justifies their higher computational cost.
Moreover, previous studies have shown that using intermediate absorption curves for insulin and carbohydrates simplifies the learning process for recurrent models, improving prediction accuracy by aligning the input representation with the underlying physiological dynamics [17,23].
3.2. Gated Recurrent Units (GRUs)
GRUs are a simplified variant of LSTM networks, designed to reduce computational complexity while maintaining the ability to capture temporal dependencies. They merge the input and forget gates into a single update gate and introduce a reset gate to control the flow of information [11]. This structure reduces the number of parameters and improves computational efficiency.
The operations of a GRU cell are defined as follows [11]:
Here, is the input vector at time t, is the hidden state, and denotes the candidate activation. are input weight matrices, while represent recurrent weights connected to the previous hidden state . The vectors are bias terms. The activation functions and denote the sigmoid and hyperbolic tangent, respectively, and the Hadamard product (⊙) indicates element-wise multiplication.
The update gate determines how much of the previous memory is retained, while the reset gate controls how much past information is ignored when computing the candidate activation . By combining these two mechanisms, GRUs effectively model long-term dependencies with fewer parameters and faster convergence than LSTMs, offering a practical balance between accuracy and efficiency.
In this work, the GRU architecture was implemented as a computationally efficient recurrent alternative for online imputation and fault detection in continuous glucose monitoring (CGM) data. Previous studies have shown that GRUs can achieve lower RMSE and reduced overfitting compared to LSTMs and conventional RNNs [12,22]. Their compact gating mechanism enables stable learning of temporal dependencies in physiological signals such as glucose, insulin, and meal intake, achieving an effective trade-off between predictive accuracy and real-time latency.
3.3. Convolutional Neural Networks (1D-CNN)
Through convolution operations, 1D-CNNs efficiently capture local and temporal patterns in sequential data. They consist of convolutional layers that apply filters (kernels) over sliding windows of input sequences to extract high-level features relevant to prediction tasks [9,24]. Formally, a one-dimensional convolution is defined as
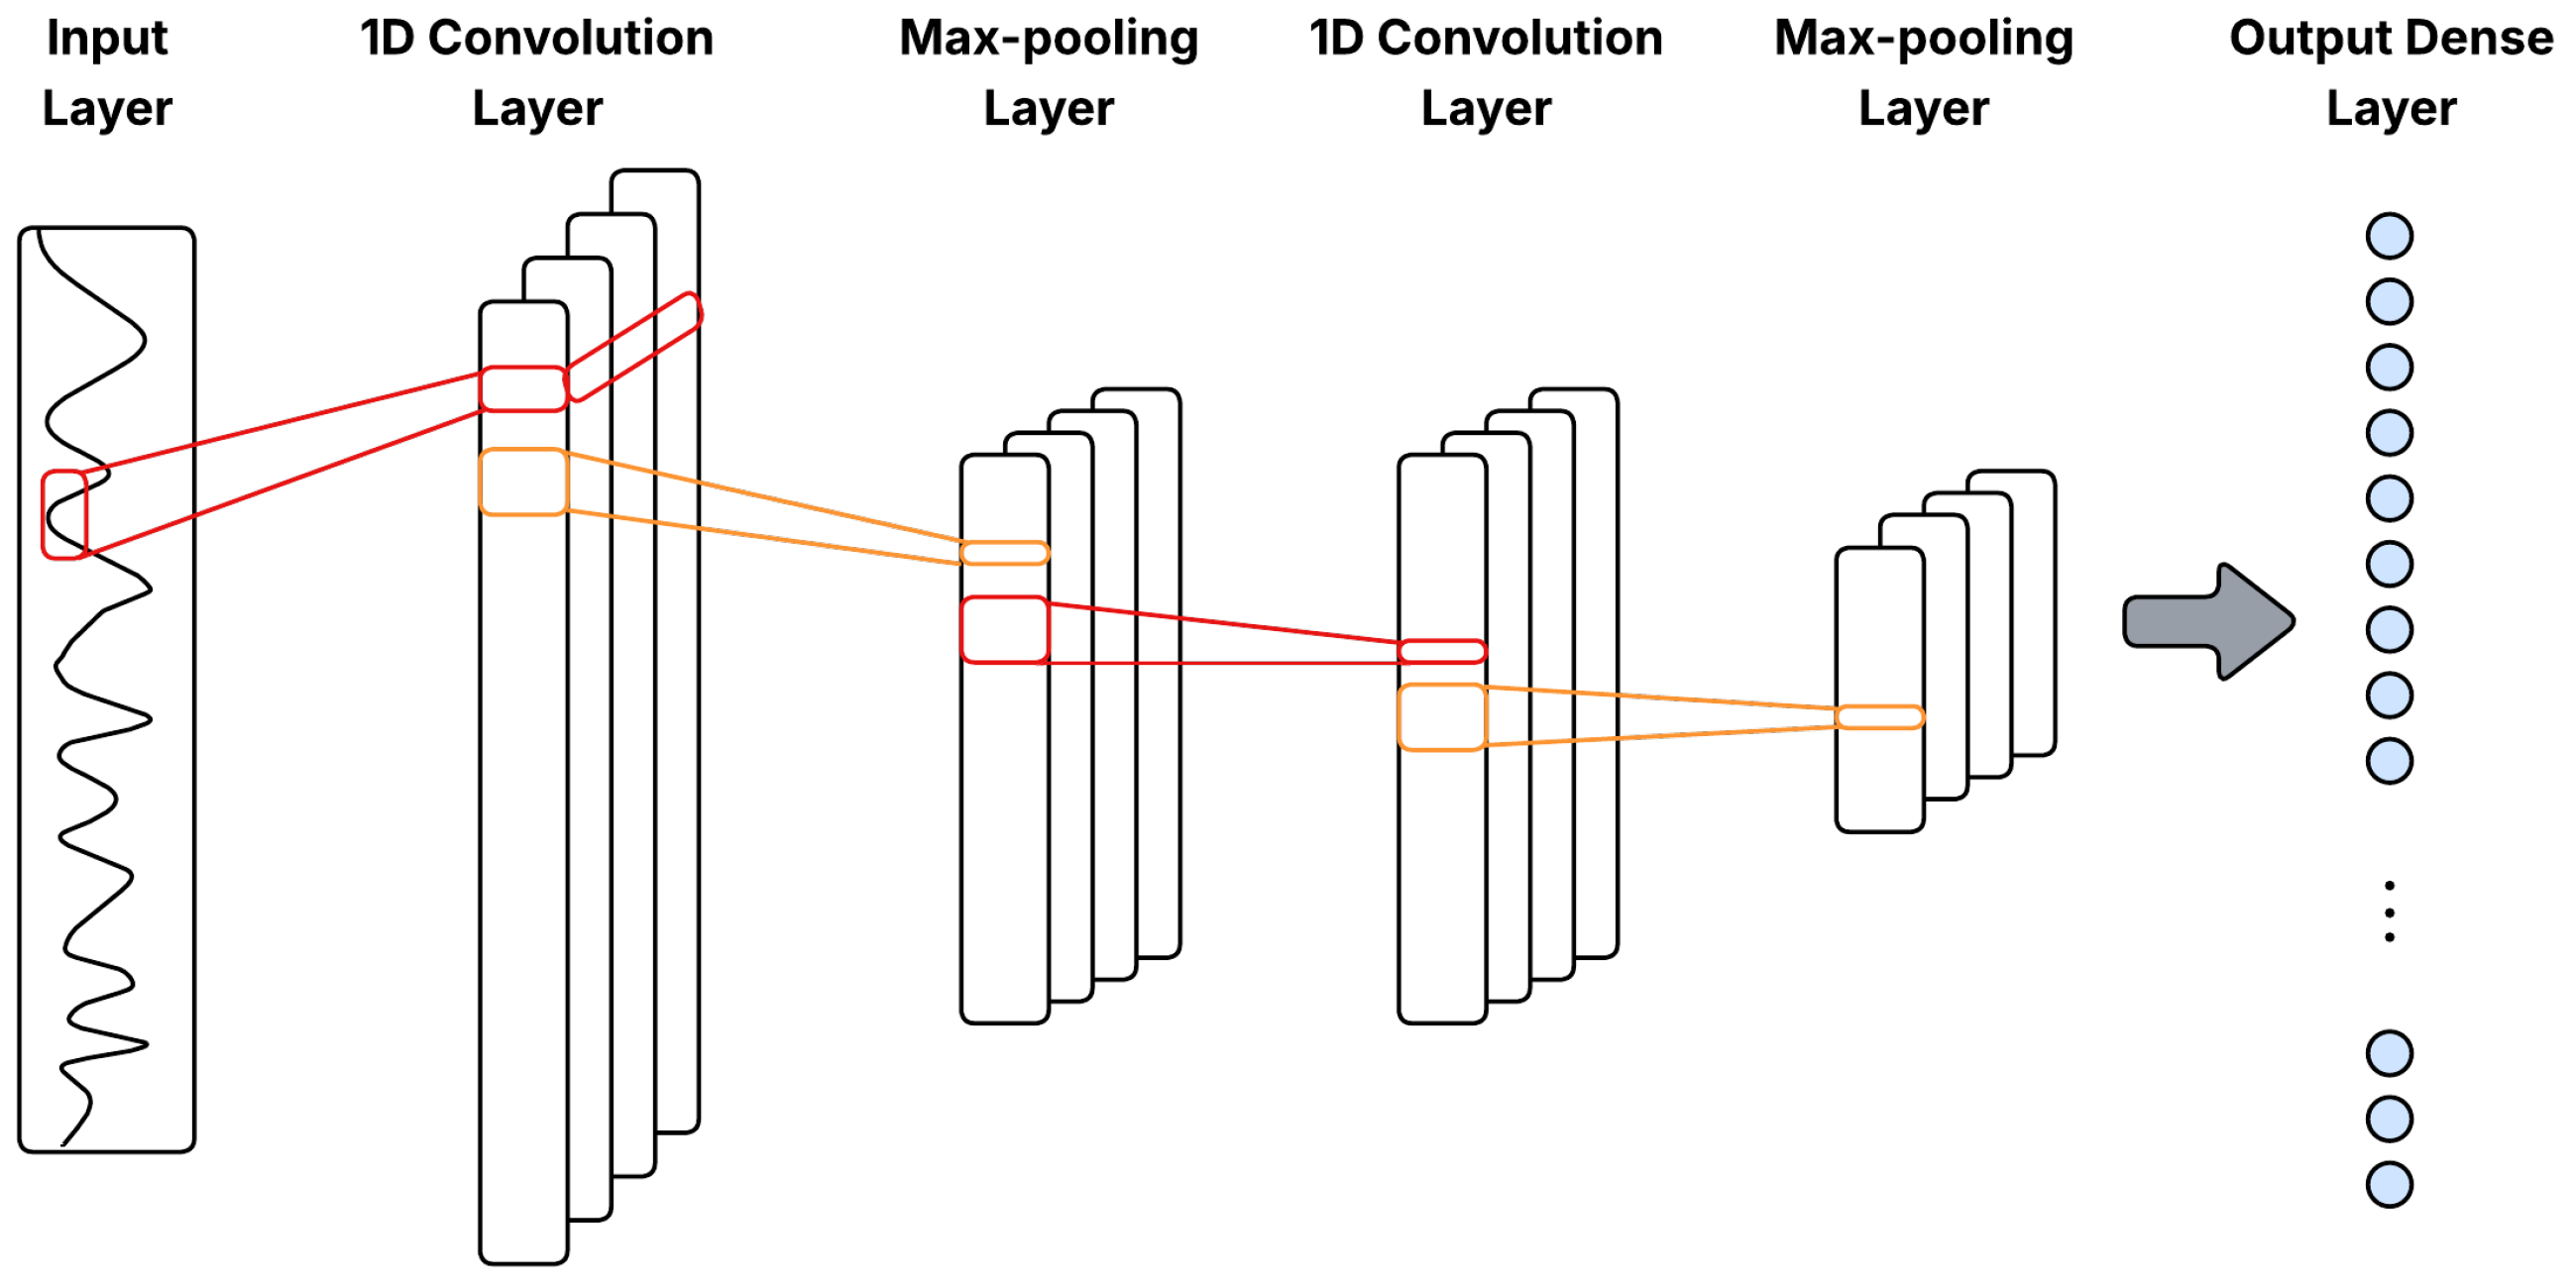
where is the output at position j in layer l, are filter weights, are inputs from the previous layer, is a bias term, k is the kernel size, and is a nonlinear activation function, typically ReLU. Figure 3 illustrates a general 1D-CNN architecture with Conv1D–pooling blocks for multivariate time series.
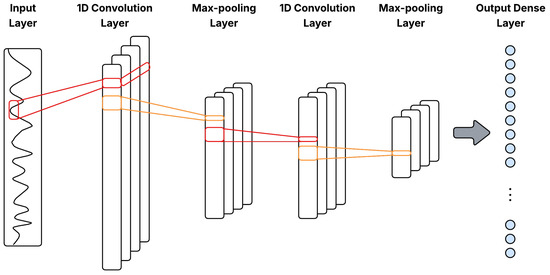
Figure 3.
General 1D-CNN architecture with Conv1D–pooling blocks for multivariate time series.
Pooling layers downsample the feature maps by summarizing small temporal neighborhoods, via max-pooling or average-pooling, so that the representation preserves salient features while reducing resolution. In time-series data, pooling introduces limited translation invariance to small temporal shifts, suppresses high-frequency noise through local aggregation, and decreases the number of activations passed to deeper layers, improving both generalization and computational efficiency [25].
Moreover, 1D-CNNs are robust to noise and effective at recognizing temporal patterns within short data segments, making them particularly suitable for preprocessing noisy or intermittent CGM signals prior to analysis by recurrent or attention-based models [10]. Recent studies have also shown that hybrid models combining CNNs with recurrent layers, such as GRUs, can further enhance blood glucose forecasting accuracy, underscoring their potential for real-time diabetes management applications [10].
3.4. Transformer-Based Models
Transformer-based models have become increasingly popular for time-series prediction due to their ability to model long-range dependencies without recurrence. They rely on a self-attention mechanism that dynamically weighs the relevance of different sequence elements. The core operation is the scaled dot-product attention:
where Q, K, and V are the query, key, and value matrices, and is the key dimension. Multi-head attention extends this mechanism as:
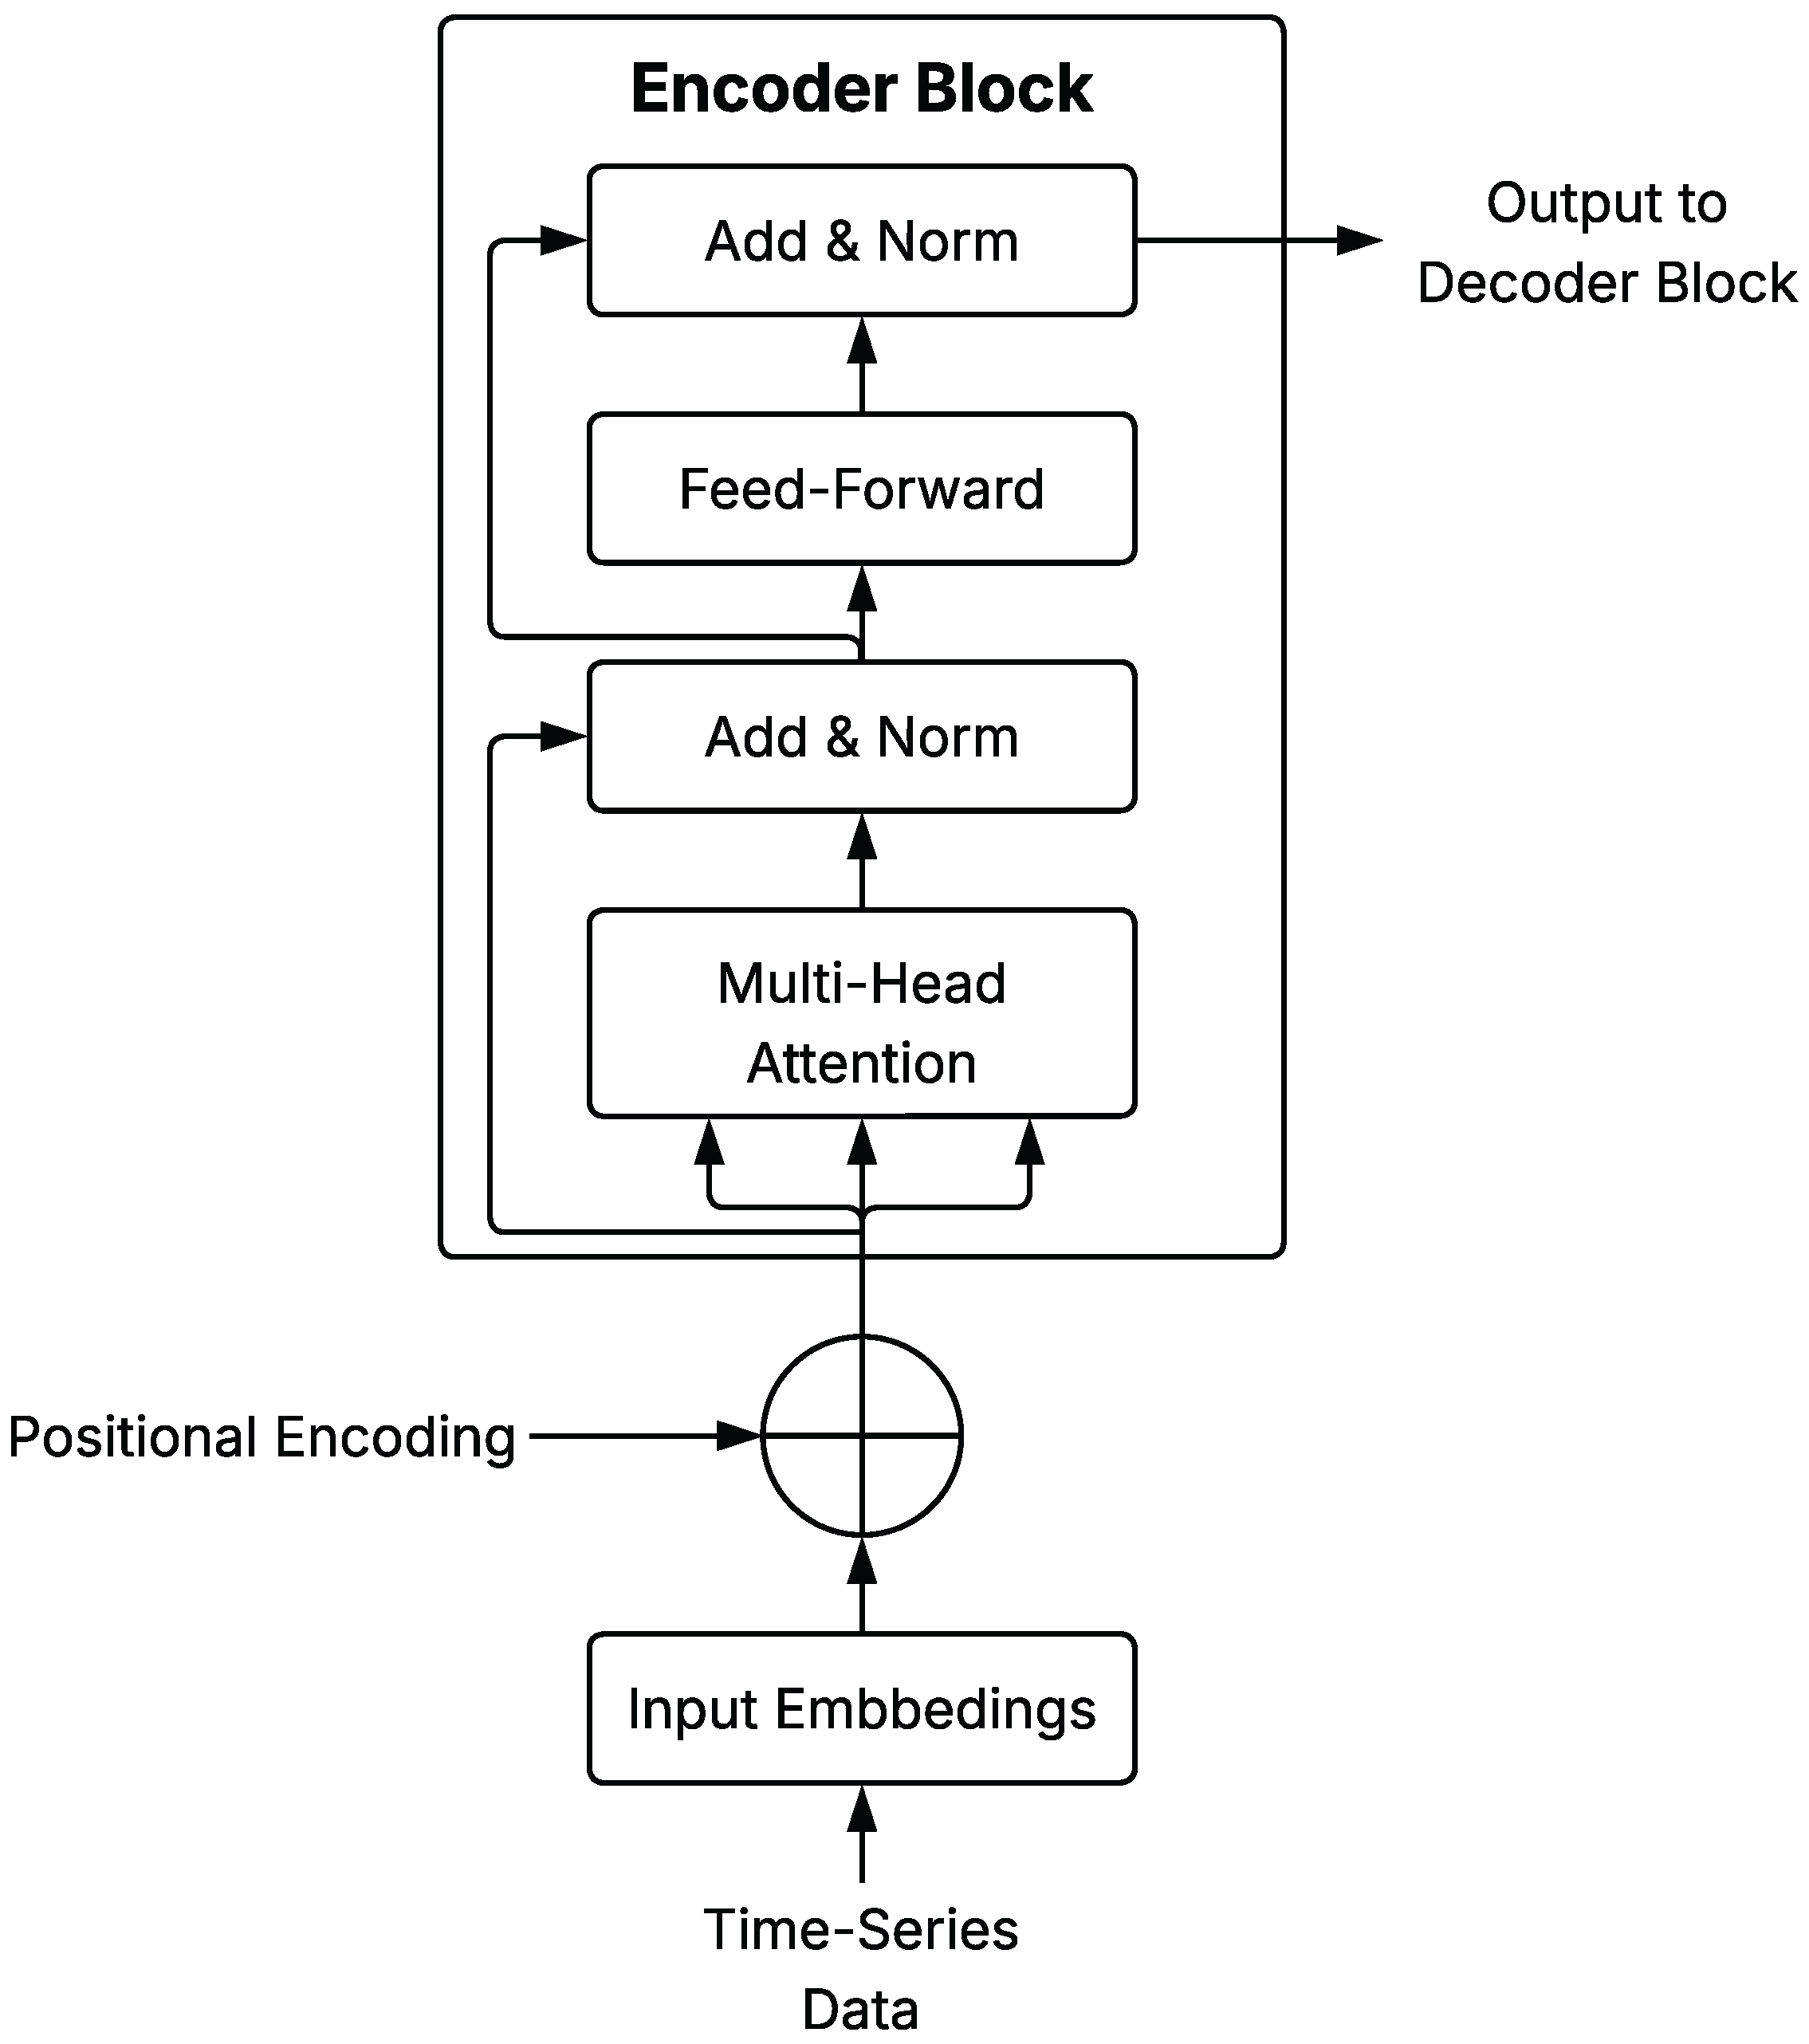
with each head computed from independent linear projections following Equation (4). Positional encodings, either fixed (sinusoidal) or learnable, are added to input embeddings to preserve sequence order.
A schematic representation of a general Transformer Encoder Block is shown in Figure 4, illustrating the core components of the architecture as described in this section.
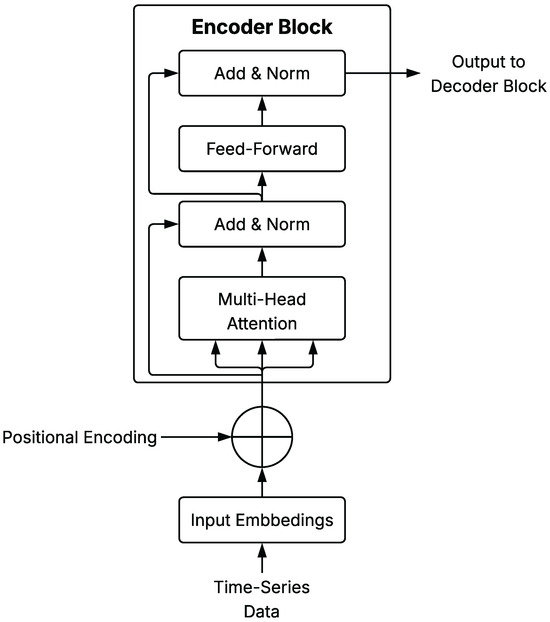
Figure 4.
Schematic diagram of Transformer Encoder Block architecture applied to time series.
Attention layers in Transformers capture long-range dependencies and interactions among elements within the observation window. When combined with recurrent architectures, they jointly model global and sequential structure. Recent advances include hierarchical and cross-scale attention mechanisms, as well as adaptations that improve efficiency for long sequences and small datasets [26].
4. Implementation Details and Fault-Detection Method
This section provides information regarding the practical implementation of the developed neural network models and describes the methods employed for online fault detection and data imputation. Specifically, it addresses model architectures design, including input data preprocessing, structural configurations, and the rationale behind each neural network architecture. Additionally, it covers procedures for model training, validation, and evaluation, as well as criteria and techniques adopted for detecting sensor faults and imputing corrupted glucose sensor readings.
4.1. Model Architectures Design
This subsection summarizes common preprocessing steps and input configuration applied to all neural network models before describing each architecture individually. The proposed approach performs real-time fault detection and imputation by combining neural prediction with threshold-based error assessment. The process is tested in a virtual patient simulated using the Sorensen compartmental model (Appendix A), which generates realistic glucose responses based on carbohydrate intake and insulin dosing. The virtual CGM output may contain noise or artifacts. A neural model receives as input a vector of the six most recent glucose readings, current carbohydrate intake, and insulin dose to predict the next glucose value .
If the absolute error exceeds a predefined threshold, the sample is classified as faulty and replaced by ; otherwise, the original value is retained. This scheme enables online detection and correction of sensor anomalies with minimal preprocessing, increasing robustness to transient noise or signal loss. Figure 5 illustrates the overall workflow, from physiological inputs to real-time fault detection and imputation.

Figure 5.
Schematic of the anomaly and missing-data detection system for glucose imputation using deep learning. It integrates a DNN, sliding window input, residual classifier, and imputation block to enhance robustness against sensor anomalies.
All neural networks use glucose, insulin, and carbohydrate data jointly as input to build the training dataset for prediction and imputation. Temporal dependencies are captured through a sliding window scheme that generates an input vector at each discrete time step. Each vector, or sliding window, consists of eight elements: six recent glucose readings, the current insulin value, and meal intake, providing a compact yet informative representation of recent physiology.
Formally, at each time step k, the input vector is defined as
where represents glucose measurement at time (mg/dL), is insulin concentration (mU/L), and denotes carbohydrate intake (mg/min).
Although feedforward DNNs are not inherently temporal, the sliding-window formulation encodes time dependencies directly in the input vector. In general, the model can be expressed as a nonlinear temporal mapping:
where
aggregates the last d glucose readings together with current insulin and carbohydrate inputs. This ensures that both endogenous dynamics (glucose history) and exogenous physiological drivers (insulin and meal absorption) are captured.
The function , parameterized by weights , represents the general mapping for all network architectures. Recurrent models (LSTM, GRU) maintain a hidden state to model long-term dependencies, convolutional models (1D-CNN) infer local temporal correlations through kernels, and attention-based models (Transformer-LSTM) weight all input elements to capture global interactions.
Input data are organized using a six-step (30 min) history with stride 1, producing a new input–output pair at each time step and ensuring temporal alignment between glucose trends and physiological drivers. When a glucose value within the window is missing or flagged as faulty, it is replaced by the model last valid prediction to preserve continuity during online operation. This design allows point-by-point detection and imputation of glucose levels in real time, maintaining robustness under sensor failures or data gaps.
Table 1 summarizes the architecture and main components of each implemented model.

Table 1.
Summary of neural network architectures for glucose prediction.
4.2. Model Training and Evaluation
To assess the resilience and reliability of the training process, each architecture was trained five times using independent random seeds. Before each run, the random number generator was reinitialized to ensure variability in weight initialization and data shuffling, enabling evaluation of model stability under different initial conditions.
All experiments employed the same configuration settings described in Section 2.2, including the Adam optimizer, early stopping based on validation loss (MSE), and identical batch size, learning rate, and regularization parameters.
For each model, the minimum validation MSE obtained during training was recorded across the five runs. Table 2 summarizes the mean and standard deviation of these values as an aggregate indicator of training stability.

Table 2.
Validation MSE across five training repetitions for each architecture.
The low variance observed across repetitions confirms that training was stable and reproducible regardless of initialization. As shown in Table 2, the GRU-based model achieved the lowest validation MSE and exhibited the least variability, indicating robust convergence. The CNN–LSTM and Transformer–LSTM architectures also yielded competitive results, while the 1D–CNN showed comparatively higher error and variance. Final model comparisons are based on performance over the independent test dataset presented in Section 5.
5. Results
To handle anomalous or missing CGM samples, we adopt an online strategy that (i) detects corrupted measurements and (ii) imputes them in real time to maintain a continuous, reliable signal.
At each time step, the absolute error between the model prediction and the current sensor reading is computed. If the error is below a fixed tolerance of 10 mg/dL, the measurement is accepted as valid; otherwise, it is classified as faulty and replaced with the model prediction. The 10 mg/dL threshold was selected as a conservative and clinically interpretable criterion. Commercial CGM systems are typically required to achieve an accuracy within ±15 mg/dL (for glucose <100 mg/dL) and within ±15% (for glucose ≥100 mg/dL), according to ISO 15197:2013 [27] and follow-up evaluations of devices such as FreeStyle Libre Pro and Dexcom G6 [21]. It should be noted that these devices are mentioned only as reference examples from prior literature, and no specific software version was used or evaluated in this study.
Under the Clarke Error Grid (CEG) analysis [28], deviations within these bounds fall in zone A, corresponding to clinically acceptable measurements. Thus, a 10 mg/dL cutoff ensures that only highly reliable readings are accepted as valid. Although this fixed error represents a larger relative deviation at low glucose values (e.g., 14% at 70 mg/dL) than at high ones (5% at 180 mg/dL), it remains a conservative choice across all ranges.
Corrupted samples were grouped into two failure types and processed according to their magnitude:
- White noise errors (<60 mg/dL):Adaptive smoothing is applied, with weights adjusted to the local variance of residuals, reducing transient noise while preserving trends.
- Disconnection errors (≥60 mg/dL): The corrupted readings are replaced directly by the model prediction and propagated one step ahead, restoring trajectory continuity.
The 60 mg/dL threshold for disconnections was chosen because it exceeds typical CGM noise levels (15 mg/dL) and the ISO 15197:2013 accuracy limits (±15 mg/dL or ±15%).
All neural networks were trained with the Adam optimizer (learning rate 0.001), L2 regularization (), mini-batches of 32 samples, and a maximum of 300 epochs, with early stopping after 30 validation steps without improvement. Gradient clipping and batch reshuffling were applied at each epoch. Five independent runs per model ensured statistical robustness, as discussed in Table 2. All models were evaluated on the independent test set described in Section 2.3.
Anomaly-detection performance was quantified using accuracy, precision, recall, and F1-score. Receiver Operating Characteristic (ROC) curves and area under the curve (AUC) were computed using the absolute prediction error as a continuous score. For online imputation, mean absolute error (MAE), root mean squared error (RMSE), and mean absolute relative difference (MARD) were reported, with MARD computed only for reference glucose values above 20 mg/dL to avoid bias from very low concentrations.
Additionally, the best-performing model was validated using the clinical OhioT1DM dataset to confirm its robustness under real patient conditions.
To further contrast deep learning-based imputation methods, a Temporal Convolutional Network (TCN) architecture was also implemented, following the same online fault detection and imputation procedure. Similarly, the ARIMA model was implemented to address this task.
The following subsections present the quantitative results for online fault detection and data imputation.
5.1. Online Imputation Results
Table 3 summarizes the imputation performance of all evaluated architectures, reporting mean ± standard deviation across five independent runs.

Table 3.
Performance metrics for online imputation (mean ± standard deviation over five runs).
Overall, 1D–CNN achieved the lowest RMSE (3.75 mg/dL) and MARD (0.17%), indicating high relative accuracy and stable behavior across runs. GRU obtained the smallest MAE (2.29 mg/dL), reflecting lower typical errors, while CNN–LSTM remained competitive across all metrics. Transformer–LSTM presented the highest error variability, suggesting greater sensitivity to initialization and corrupted inputs.
For comparison, the ARIMA baseline recorded considerably higher errors (MAE 6.46 mg/dL, RMSE 12.25 mg/dL, MARD 6.7%), confirming the limited ability of linear models to reconstruct nonlinear glucose dynamics. Because ARIMA is deterministic, all repetitions yielded identical results.
The Temporal Convolutional Network (TCN) reached intermediate performance (MAE ≈ 3.94 mg/dL), with stable reconstruction over long missing intervals. Its dilated causal convolutions effectively captured long-term dependencies but provided lower accuracy than CNN–LSTM or 1D–CNN.
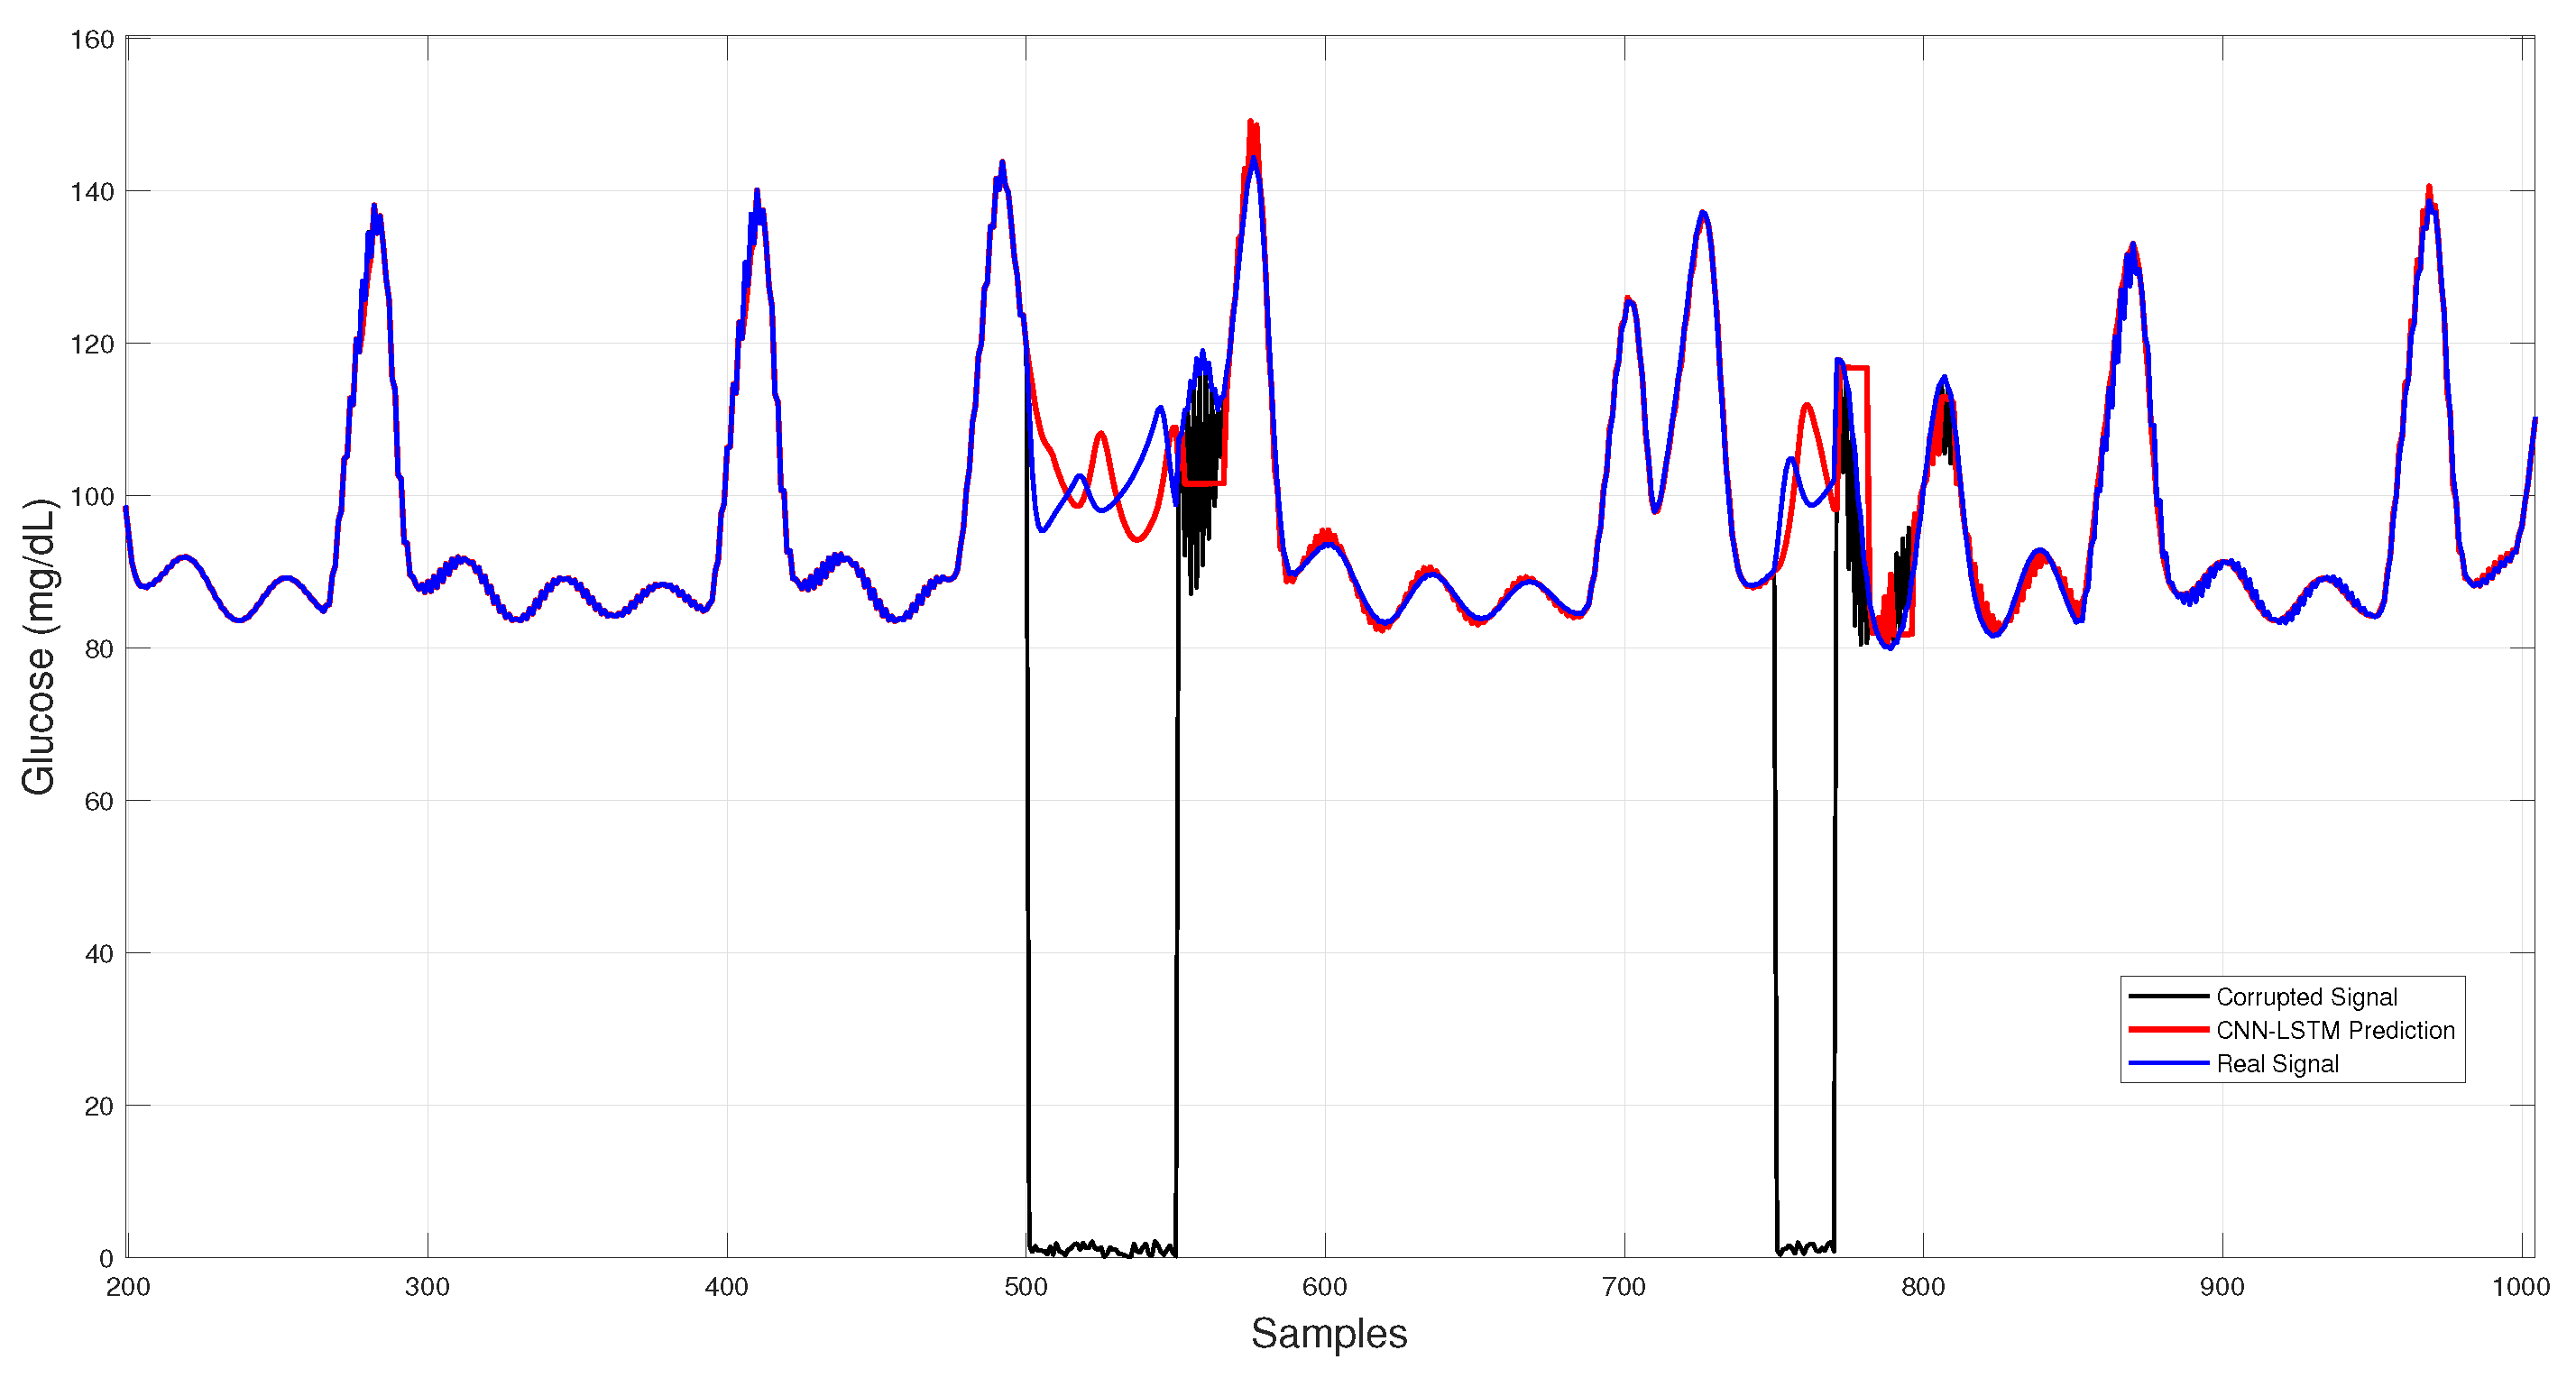
Figure 6 shows the CNN–LSTM results across corrupted intervals, where predictions closely follow the virtual patient trajectory during dropouts and white-noise bursts, maintaining stability under sudden disruptions.
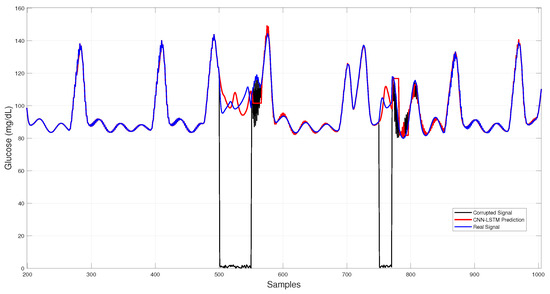
Figure 6.
Hybrid CNN–LSTM glucose imputation over corrupted intervals.
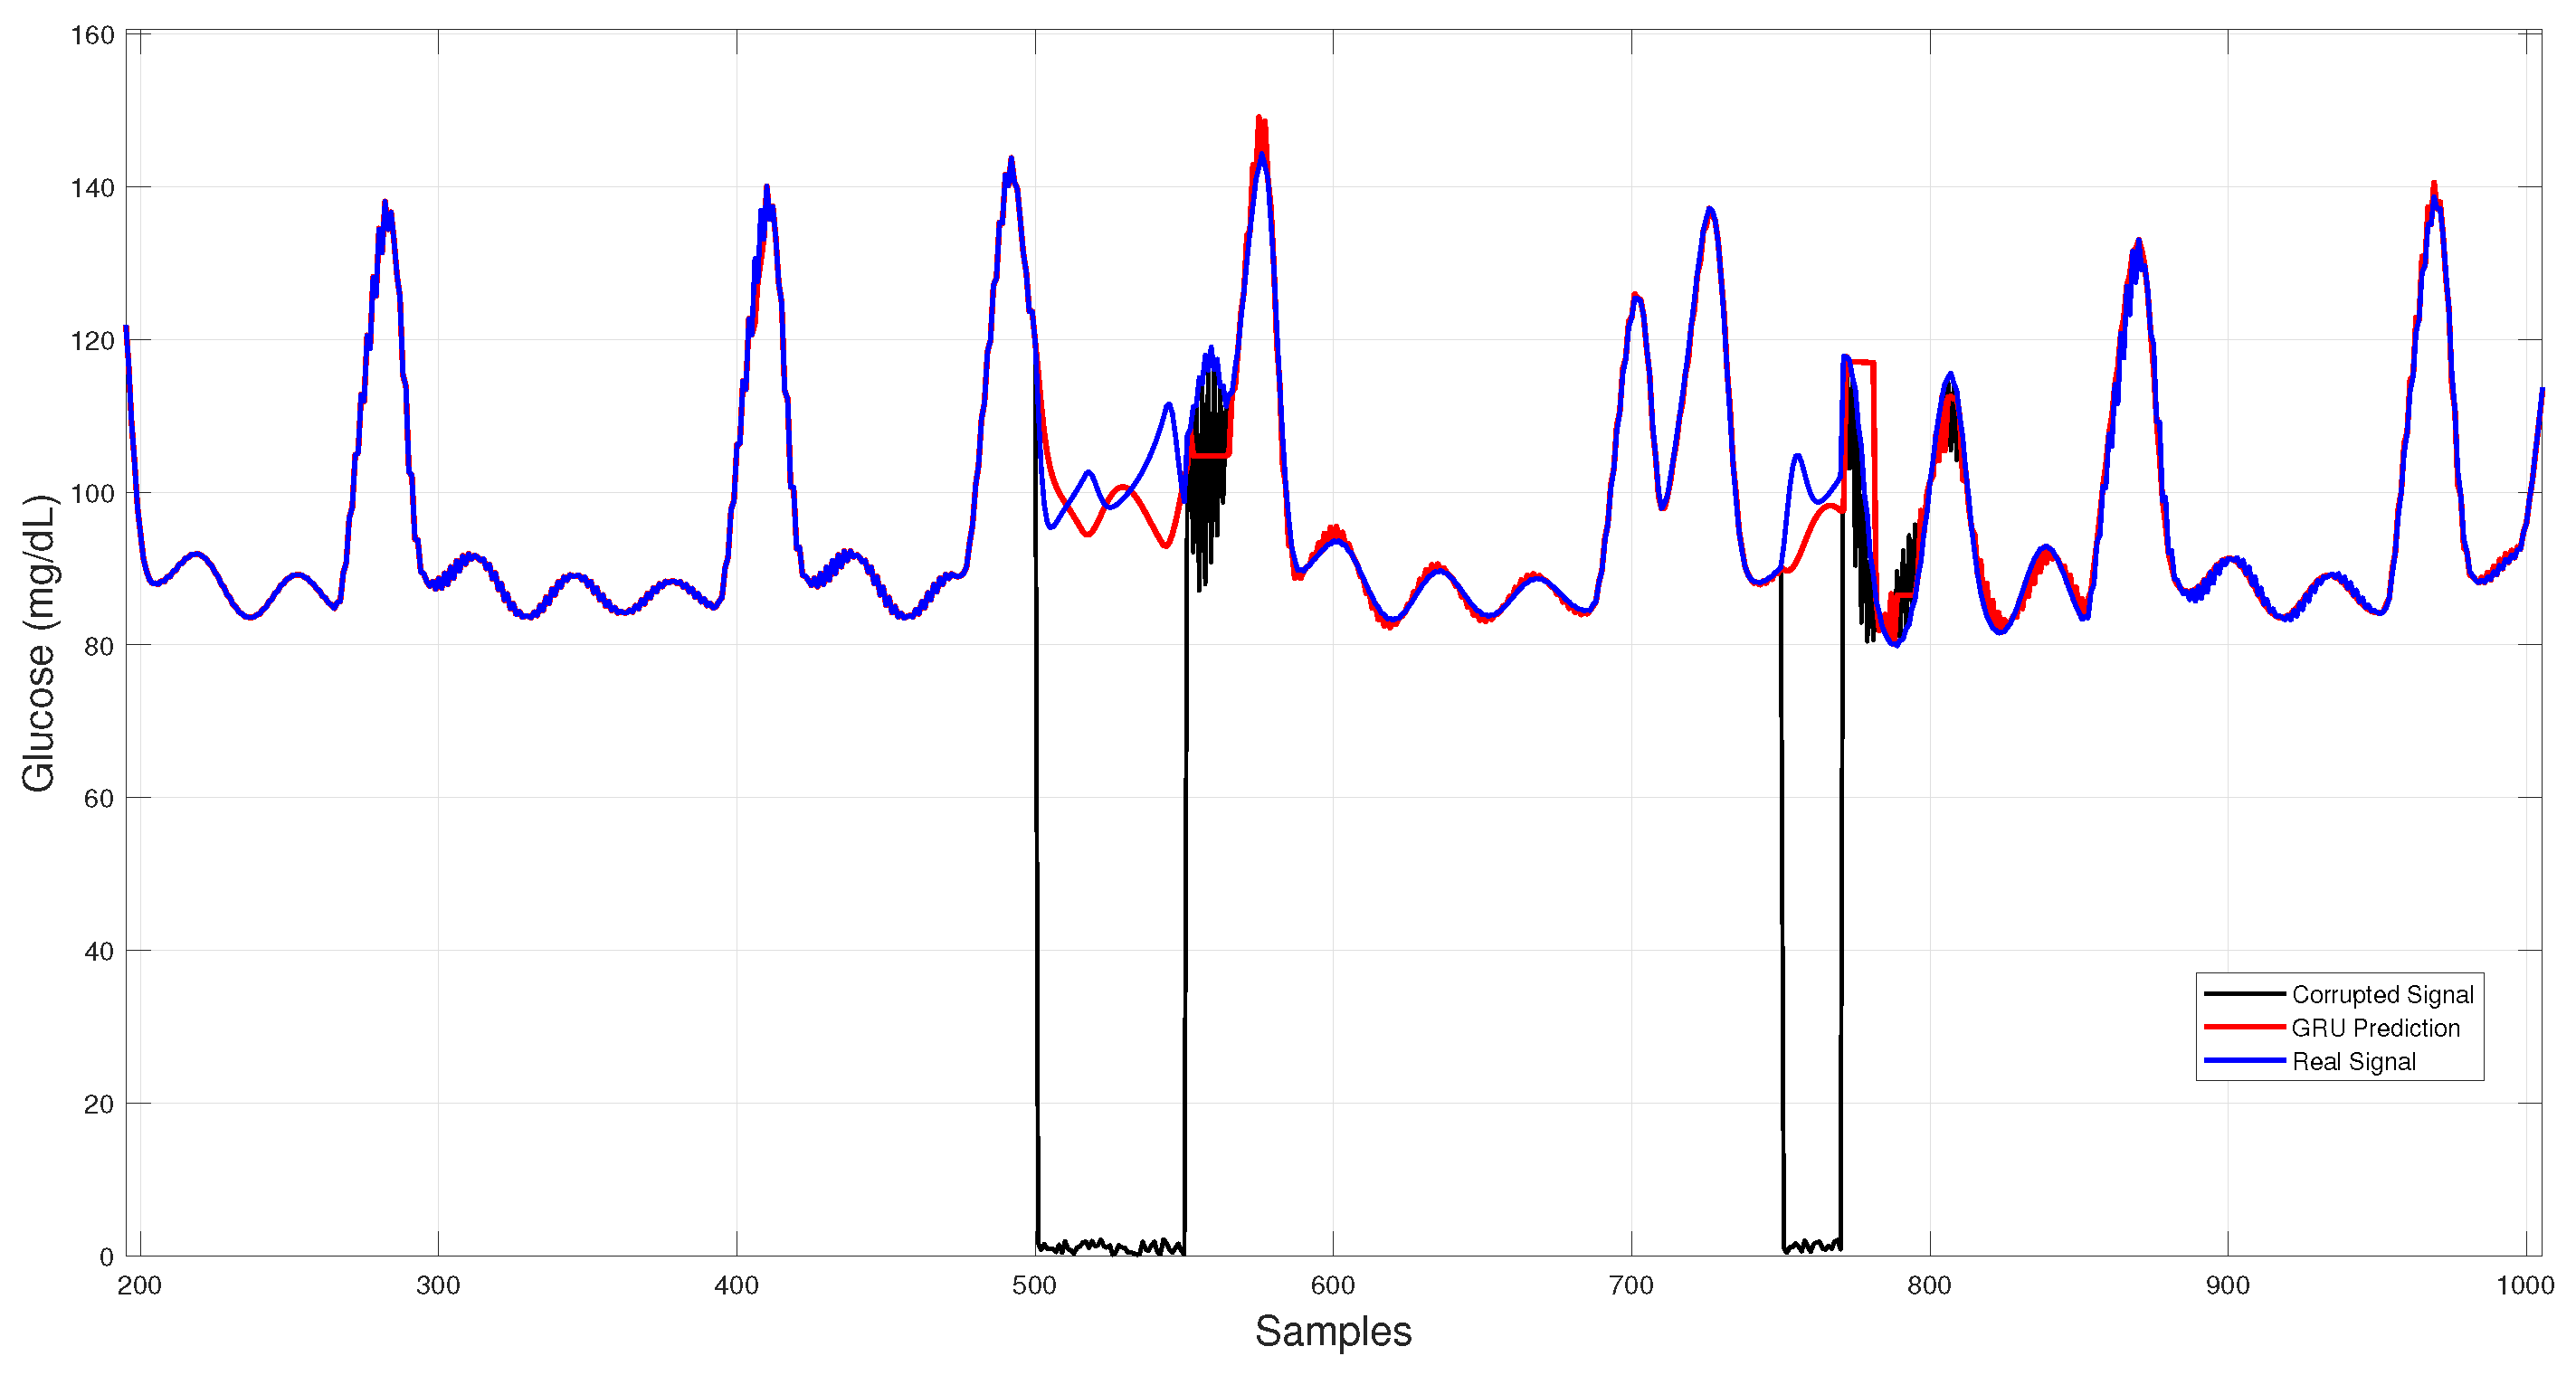
Figure 7 illustrates GRU imputation, showing trajectories that remain close to the reference trace with rapid recovery after data gaps and effective attenuation of transient noise, albeit with slight smoothing of sharp peaks.
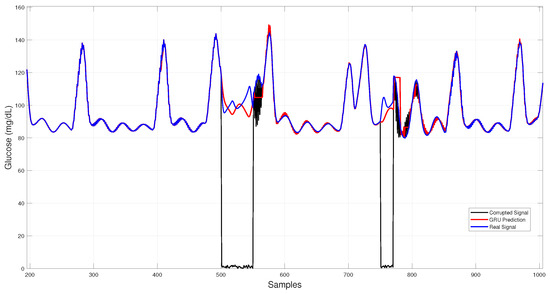
Figure 7.
GRU-based architecture glucose imputation over corrupted intervals.
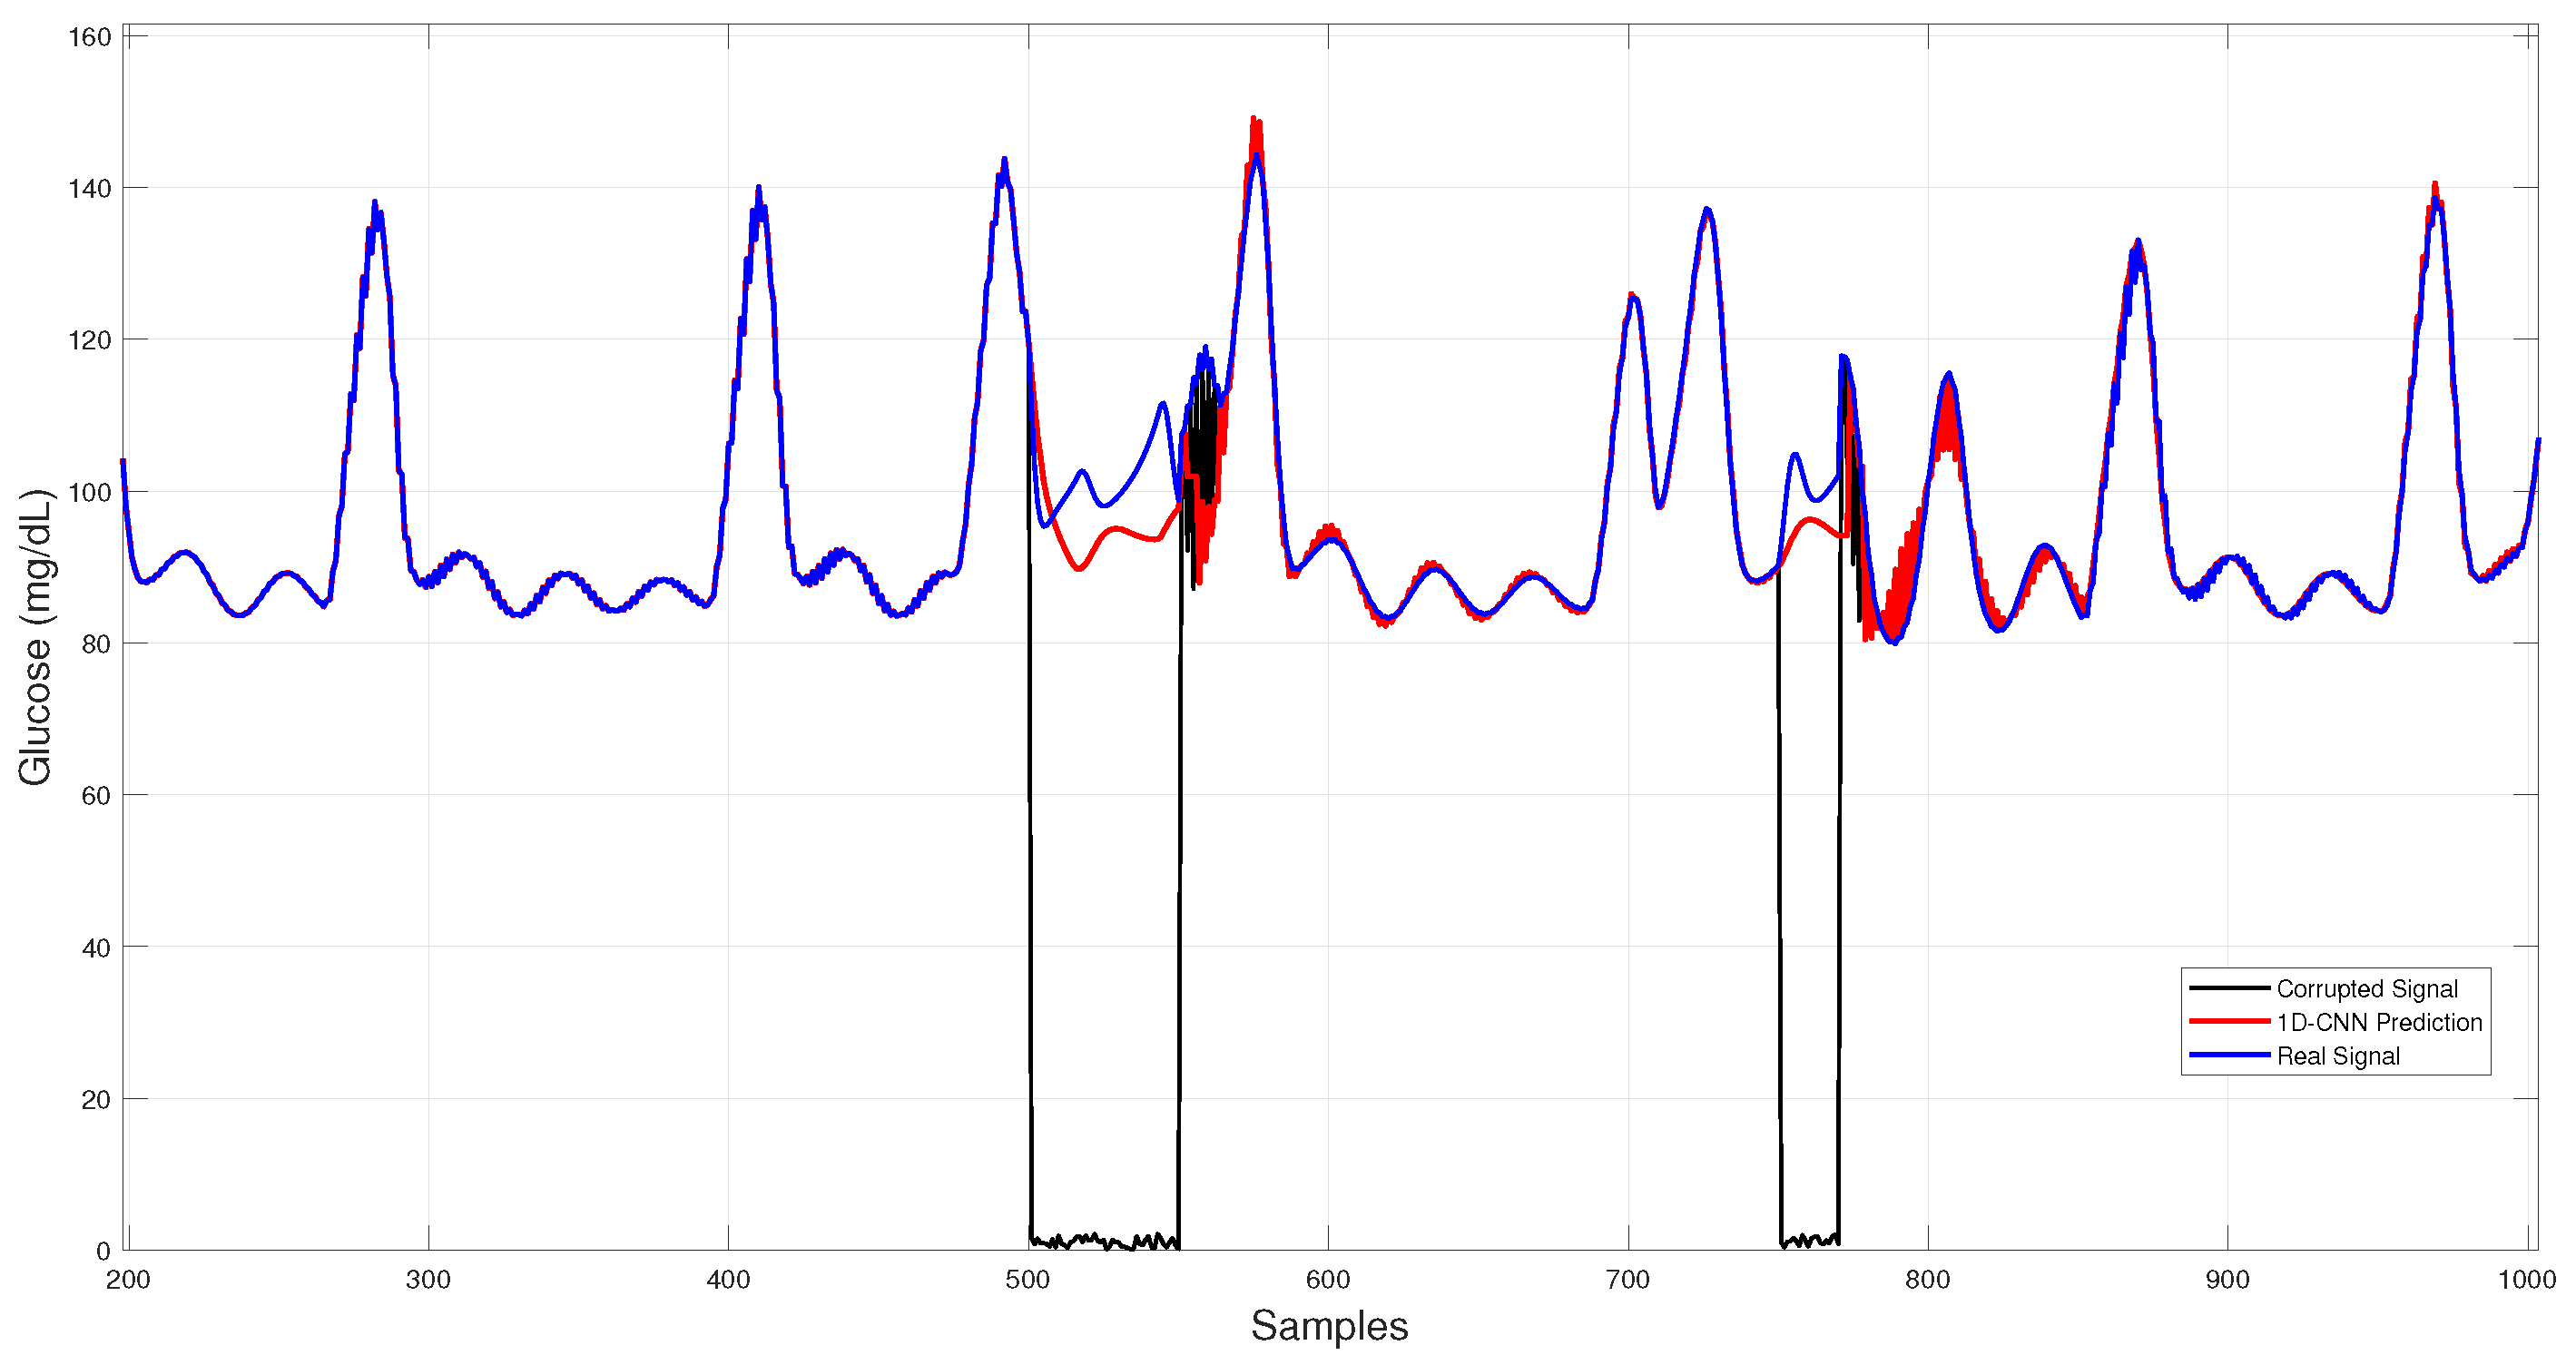
In Figure 8, 1D–CNN reconstructions during both dropouts and noise bursts align tightly with the physiological trace, showing minimal overshoot and low dispersion among runs.
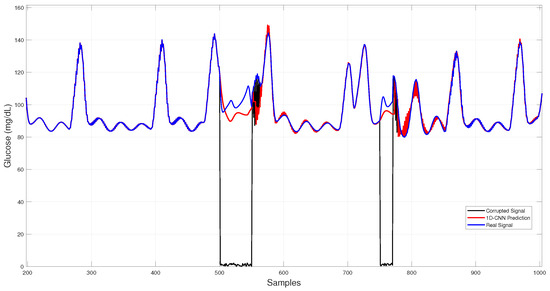
Figure 8.
1D–CNN glucose imputation over corrupted intervals.
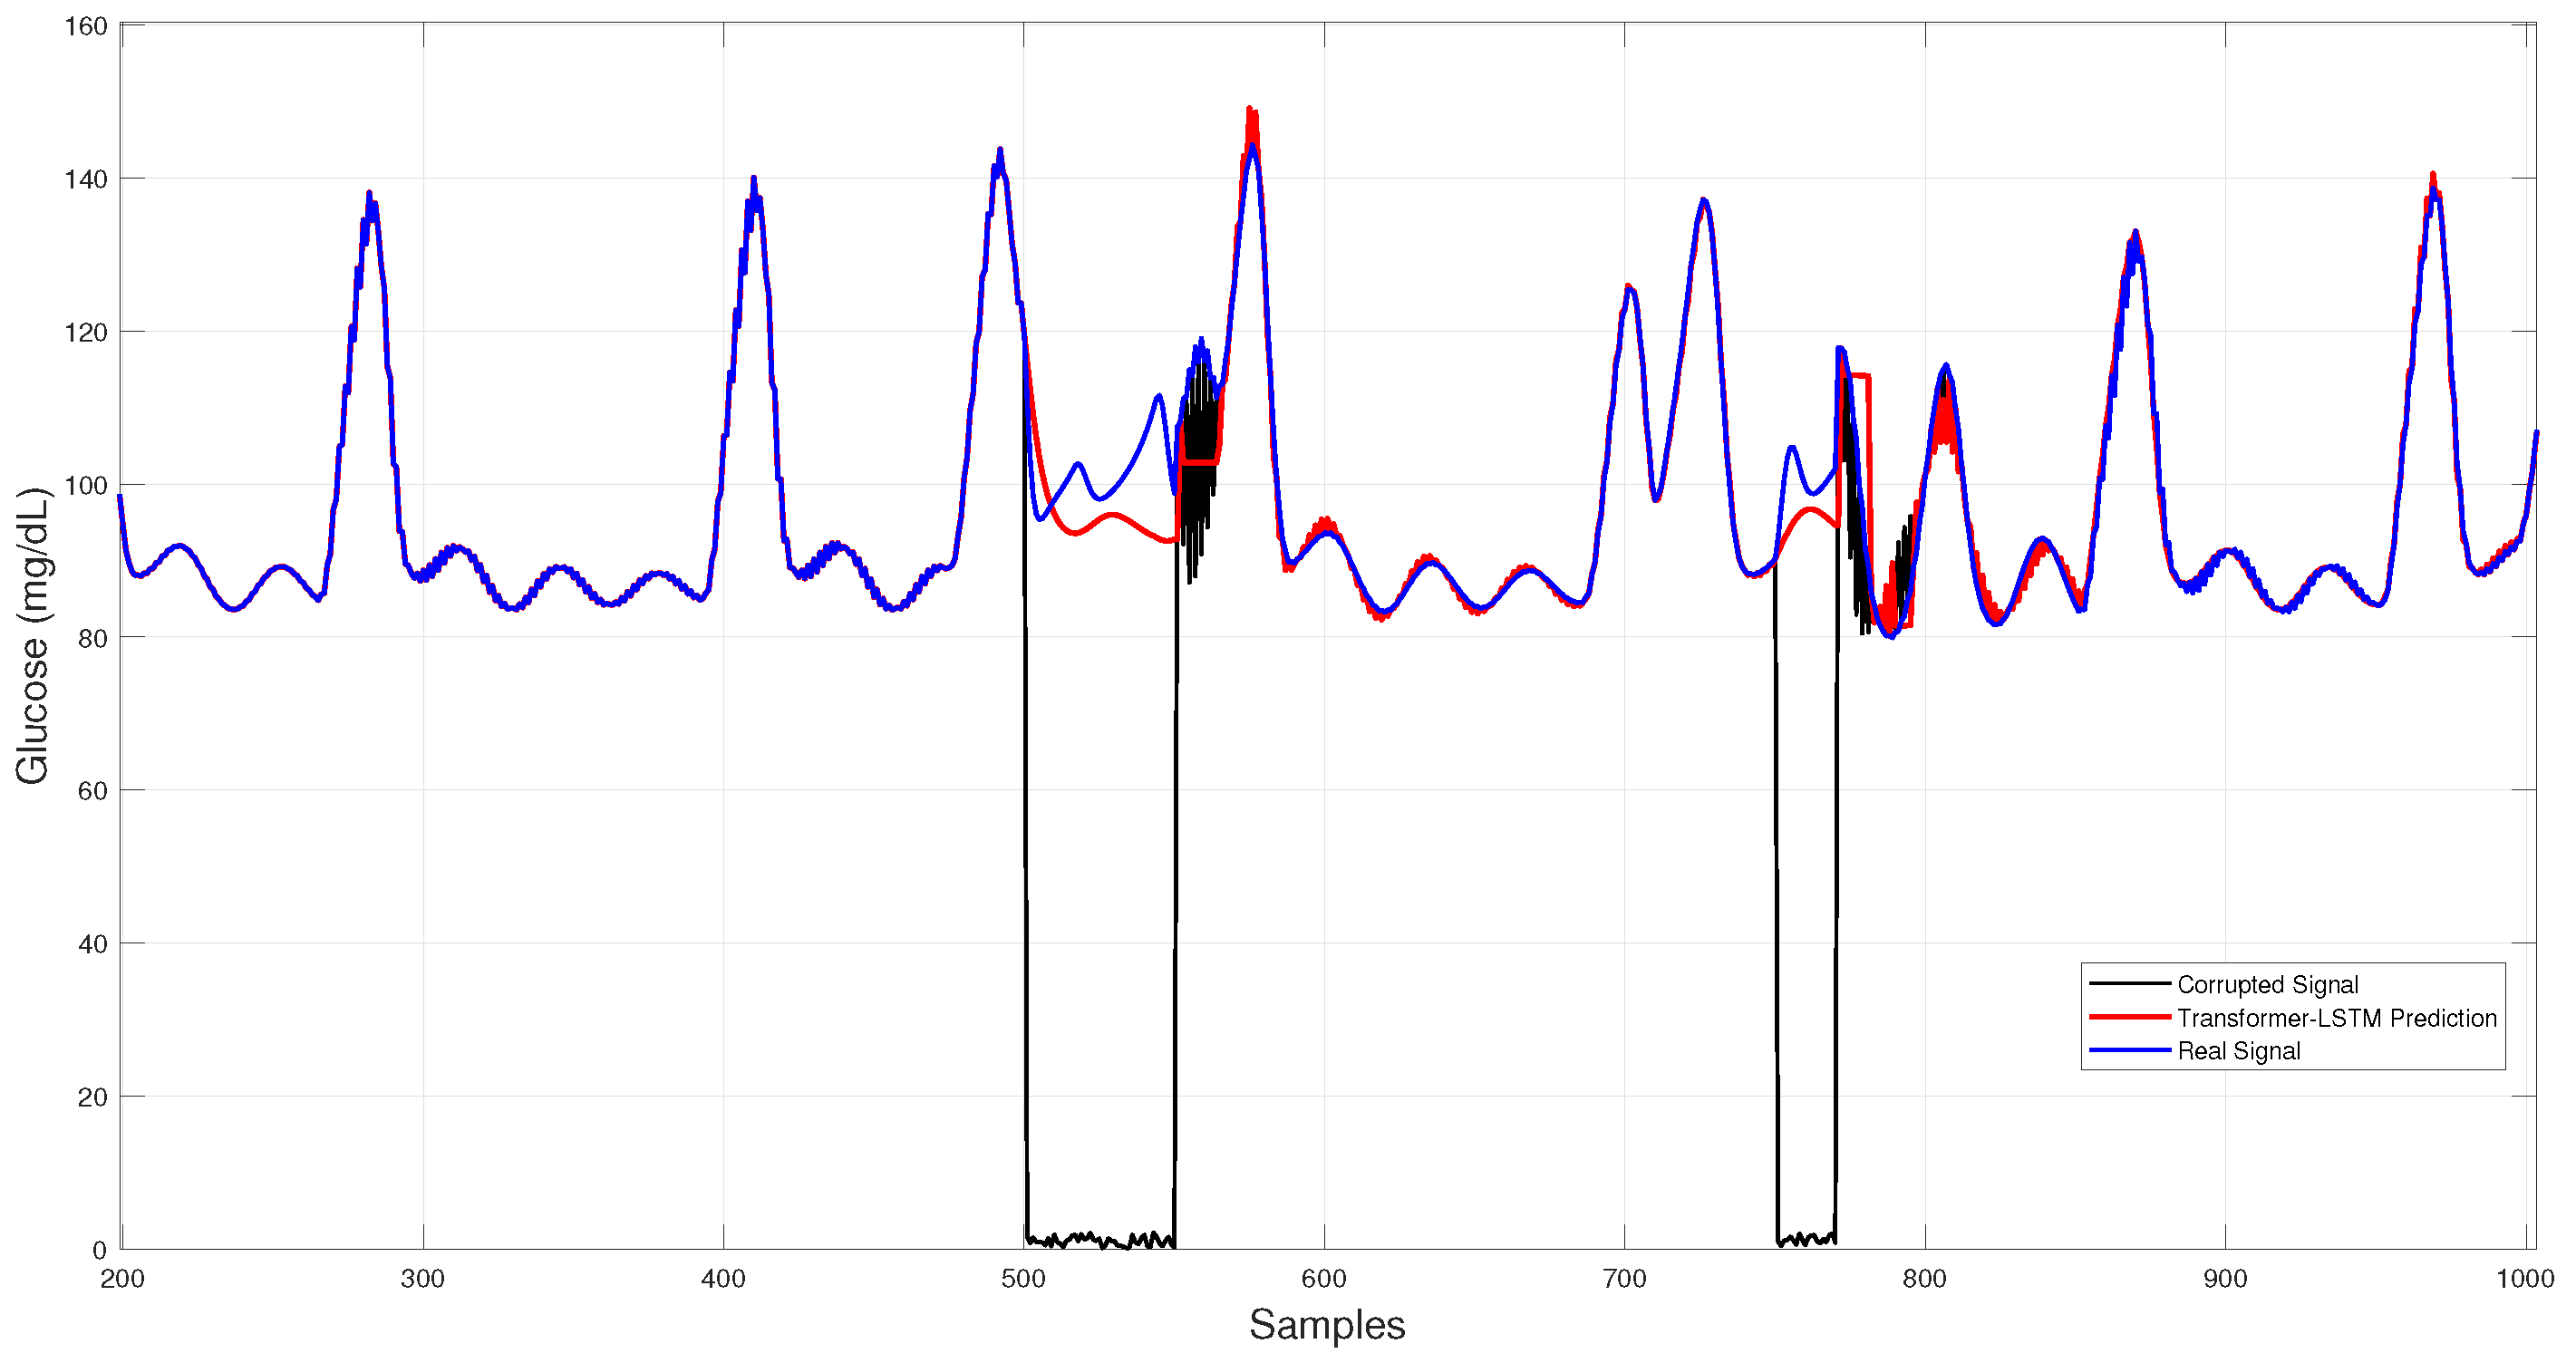
Figure 9 displays the Transformer–LSTM results, which exhibit larger deviations and higher run-to-run variability, consistent with its greater standard deviation in Table 3.
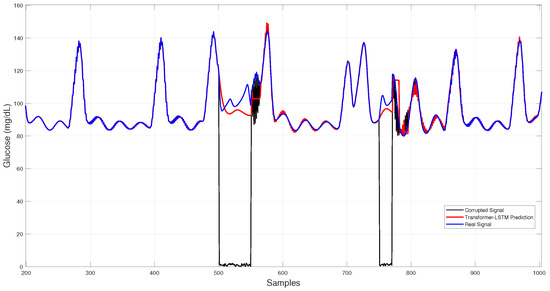
Figure 9.
Hybrid Transformer–LSTM glucose imputation over corrupted intervals.
Quantitative and qualitative results consistently indicate that 1D–CNN provides the most accurate and stable reconstructions (lowest RMSE/MARD), GRU yields the smallest typical errors (lowest MAE), CNN–LSTM achieves balanced performance, and Transformer–LSTM displays the highest variability.
5.2. Fault Detection Results
Table 4 summarizes the average performance metrics obtained for fault detection in all models evaluated, used to assess the ability of each model to distinguish between normal sensor readings and those affected by faults.

Table 4.
Fault detection performance metrics (mean ± standard deviation over five runs).
CNN–LSTM achieved the best overall performance, with an average F1-score of 0.876 and accuracy of 0.979, closely followed by GRU (F1 = 0.868; accuracy = 0.976). The 1D–CNN obtained the highest precision (0.975) but lower recall (0.663), indicating a more conservative detection behavior. Transformer–LSTM reached accuracy comparable to CNN–LSTM and GRU but with slightly lower precision (0.927) and F1-score (0.858), suggesting a higher false positive rate.
The ARIMA baseline yielded considerably lower performance (accuracy = 0.655; F1 = 0.140), confirming the limitations of linear, time-invariant models for detecting complex anomalies. Although ARIMA can identify large residuals, it lacks adaptability and produces a high rate of false positives.
The TCN achieved competitive precision (≈0.90) and accuracy (≈0.96) but lower recall (≈0.69), resulting in an F1-score of 0.78. This behavior indicates a conservative detector that minimizes false alarms, validating the potential of convolutional approaches for lightweight, real-time fault detection in CGM systems.
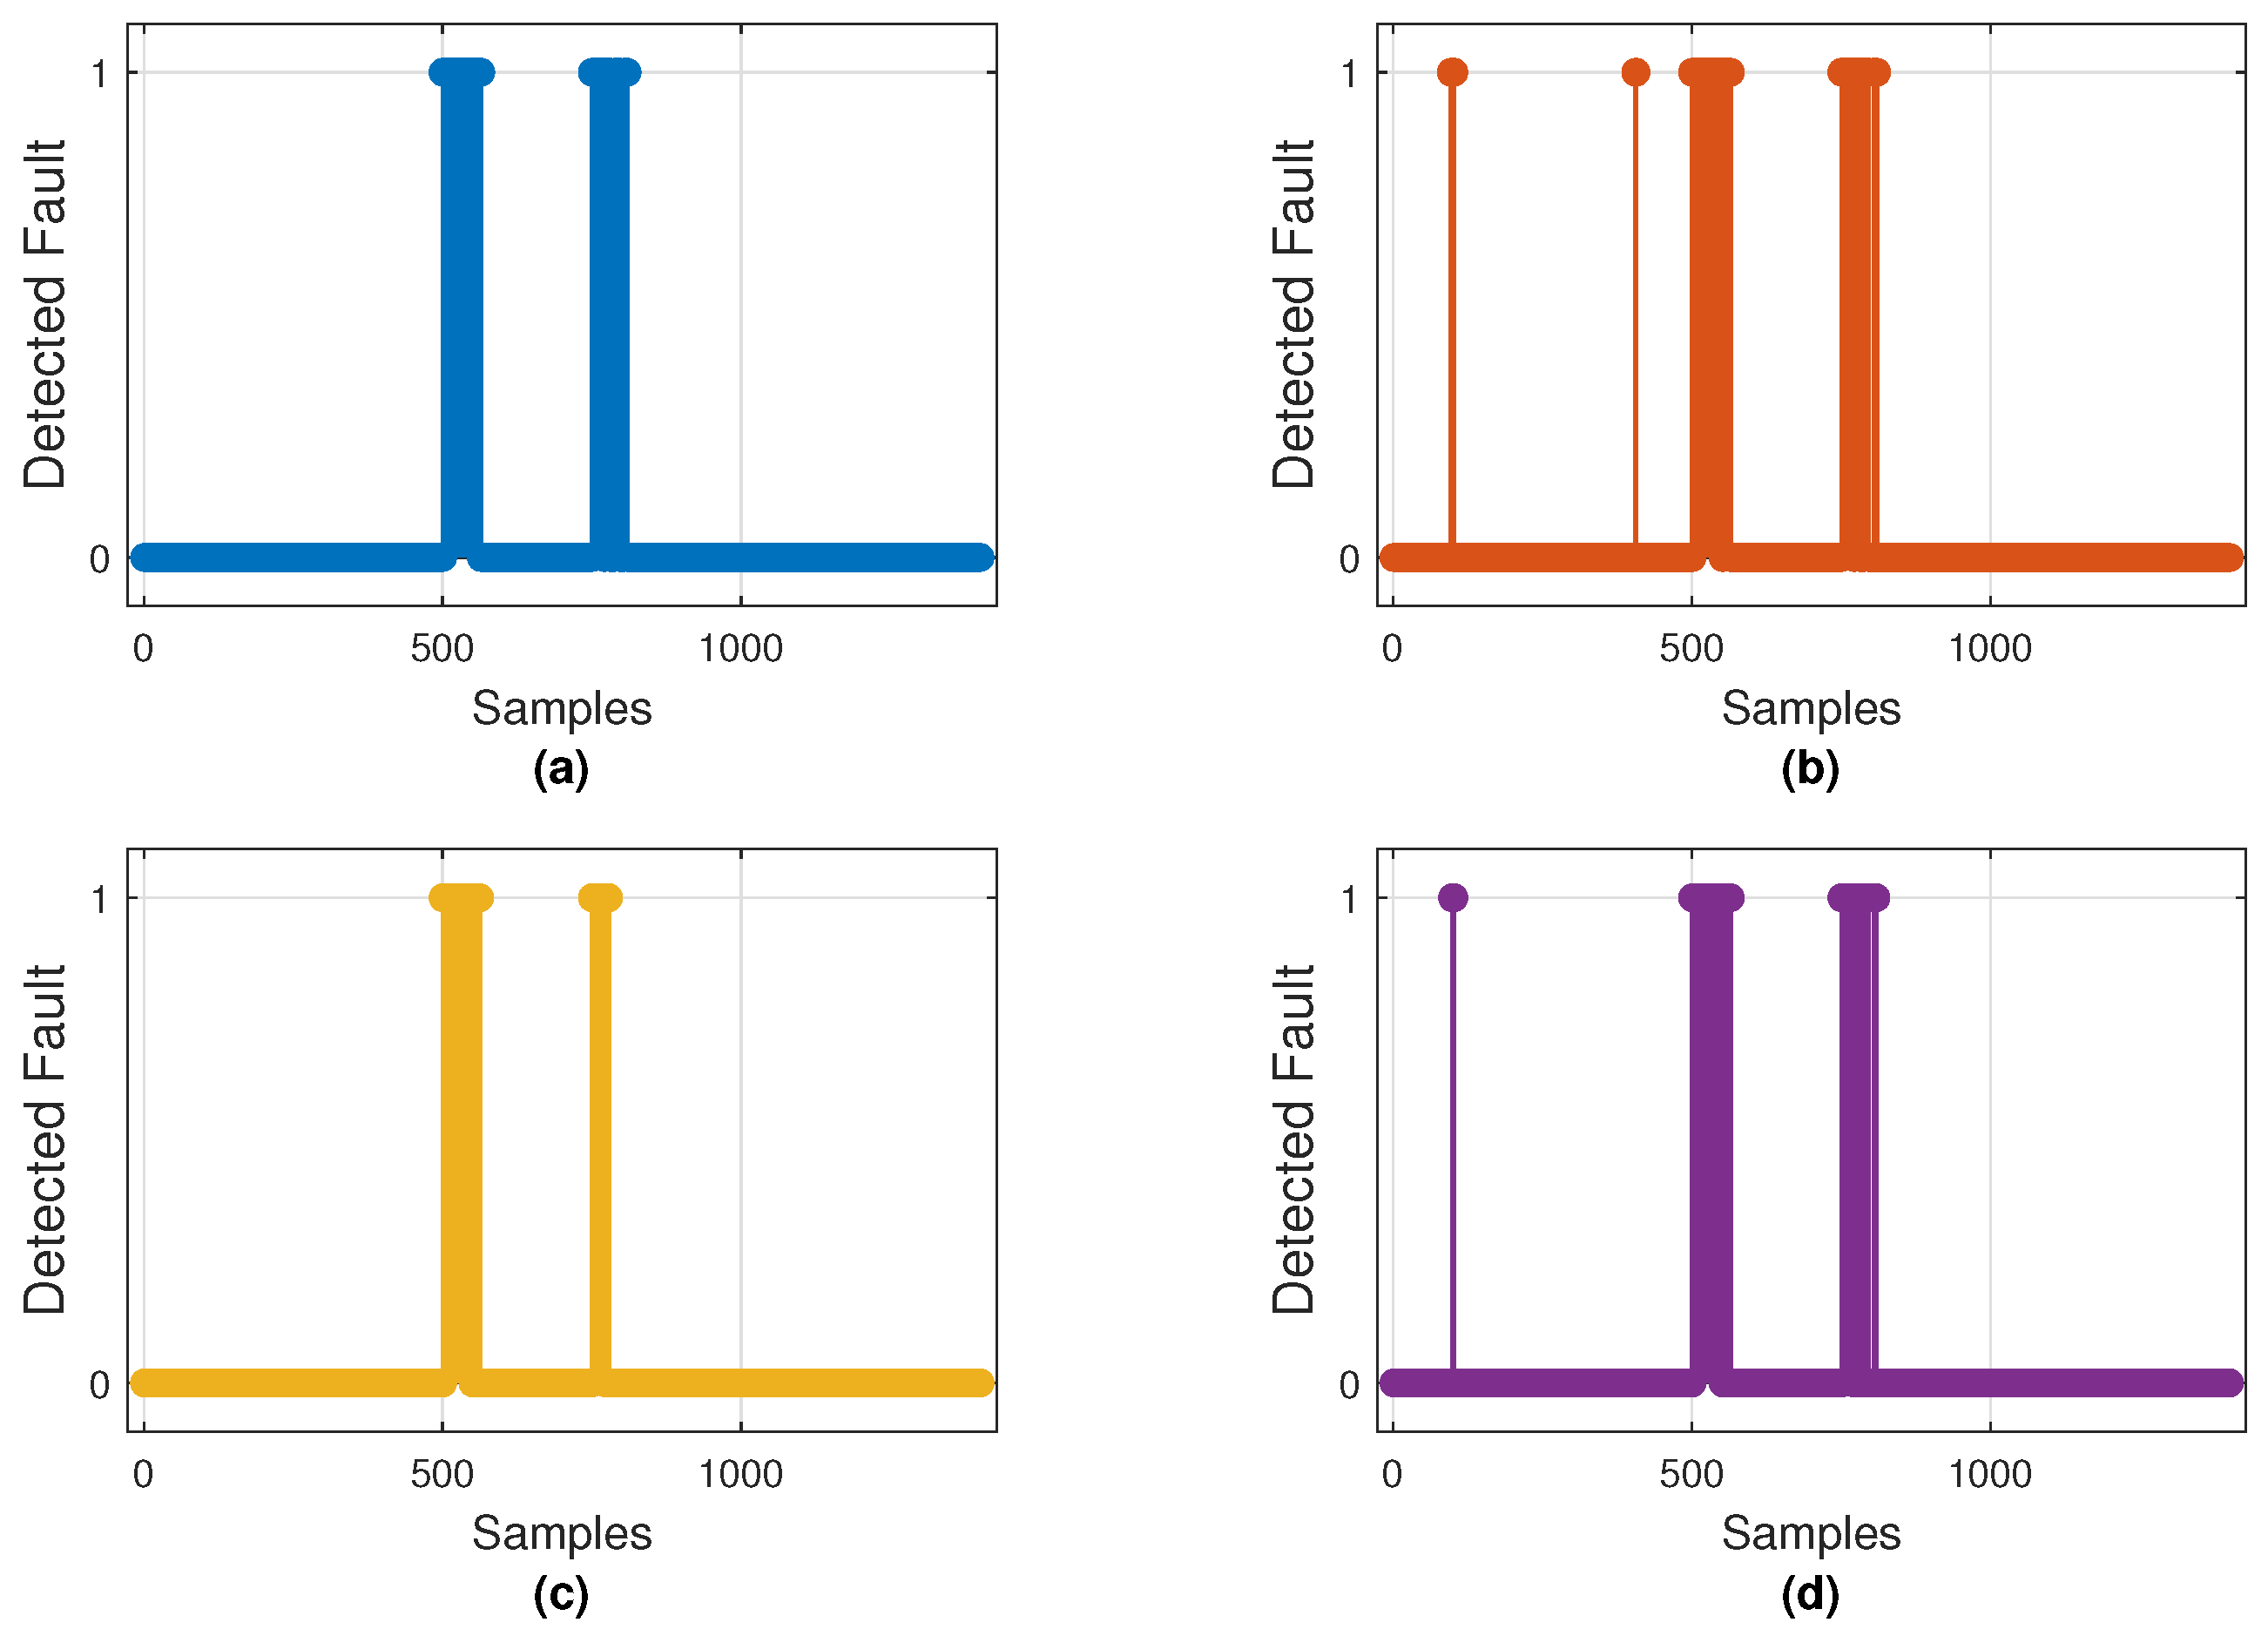
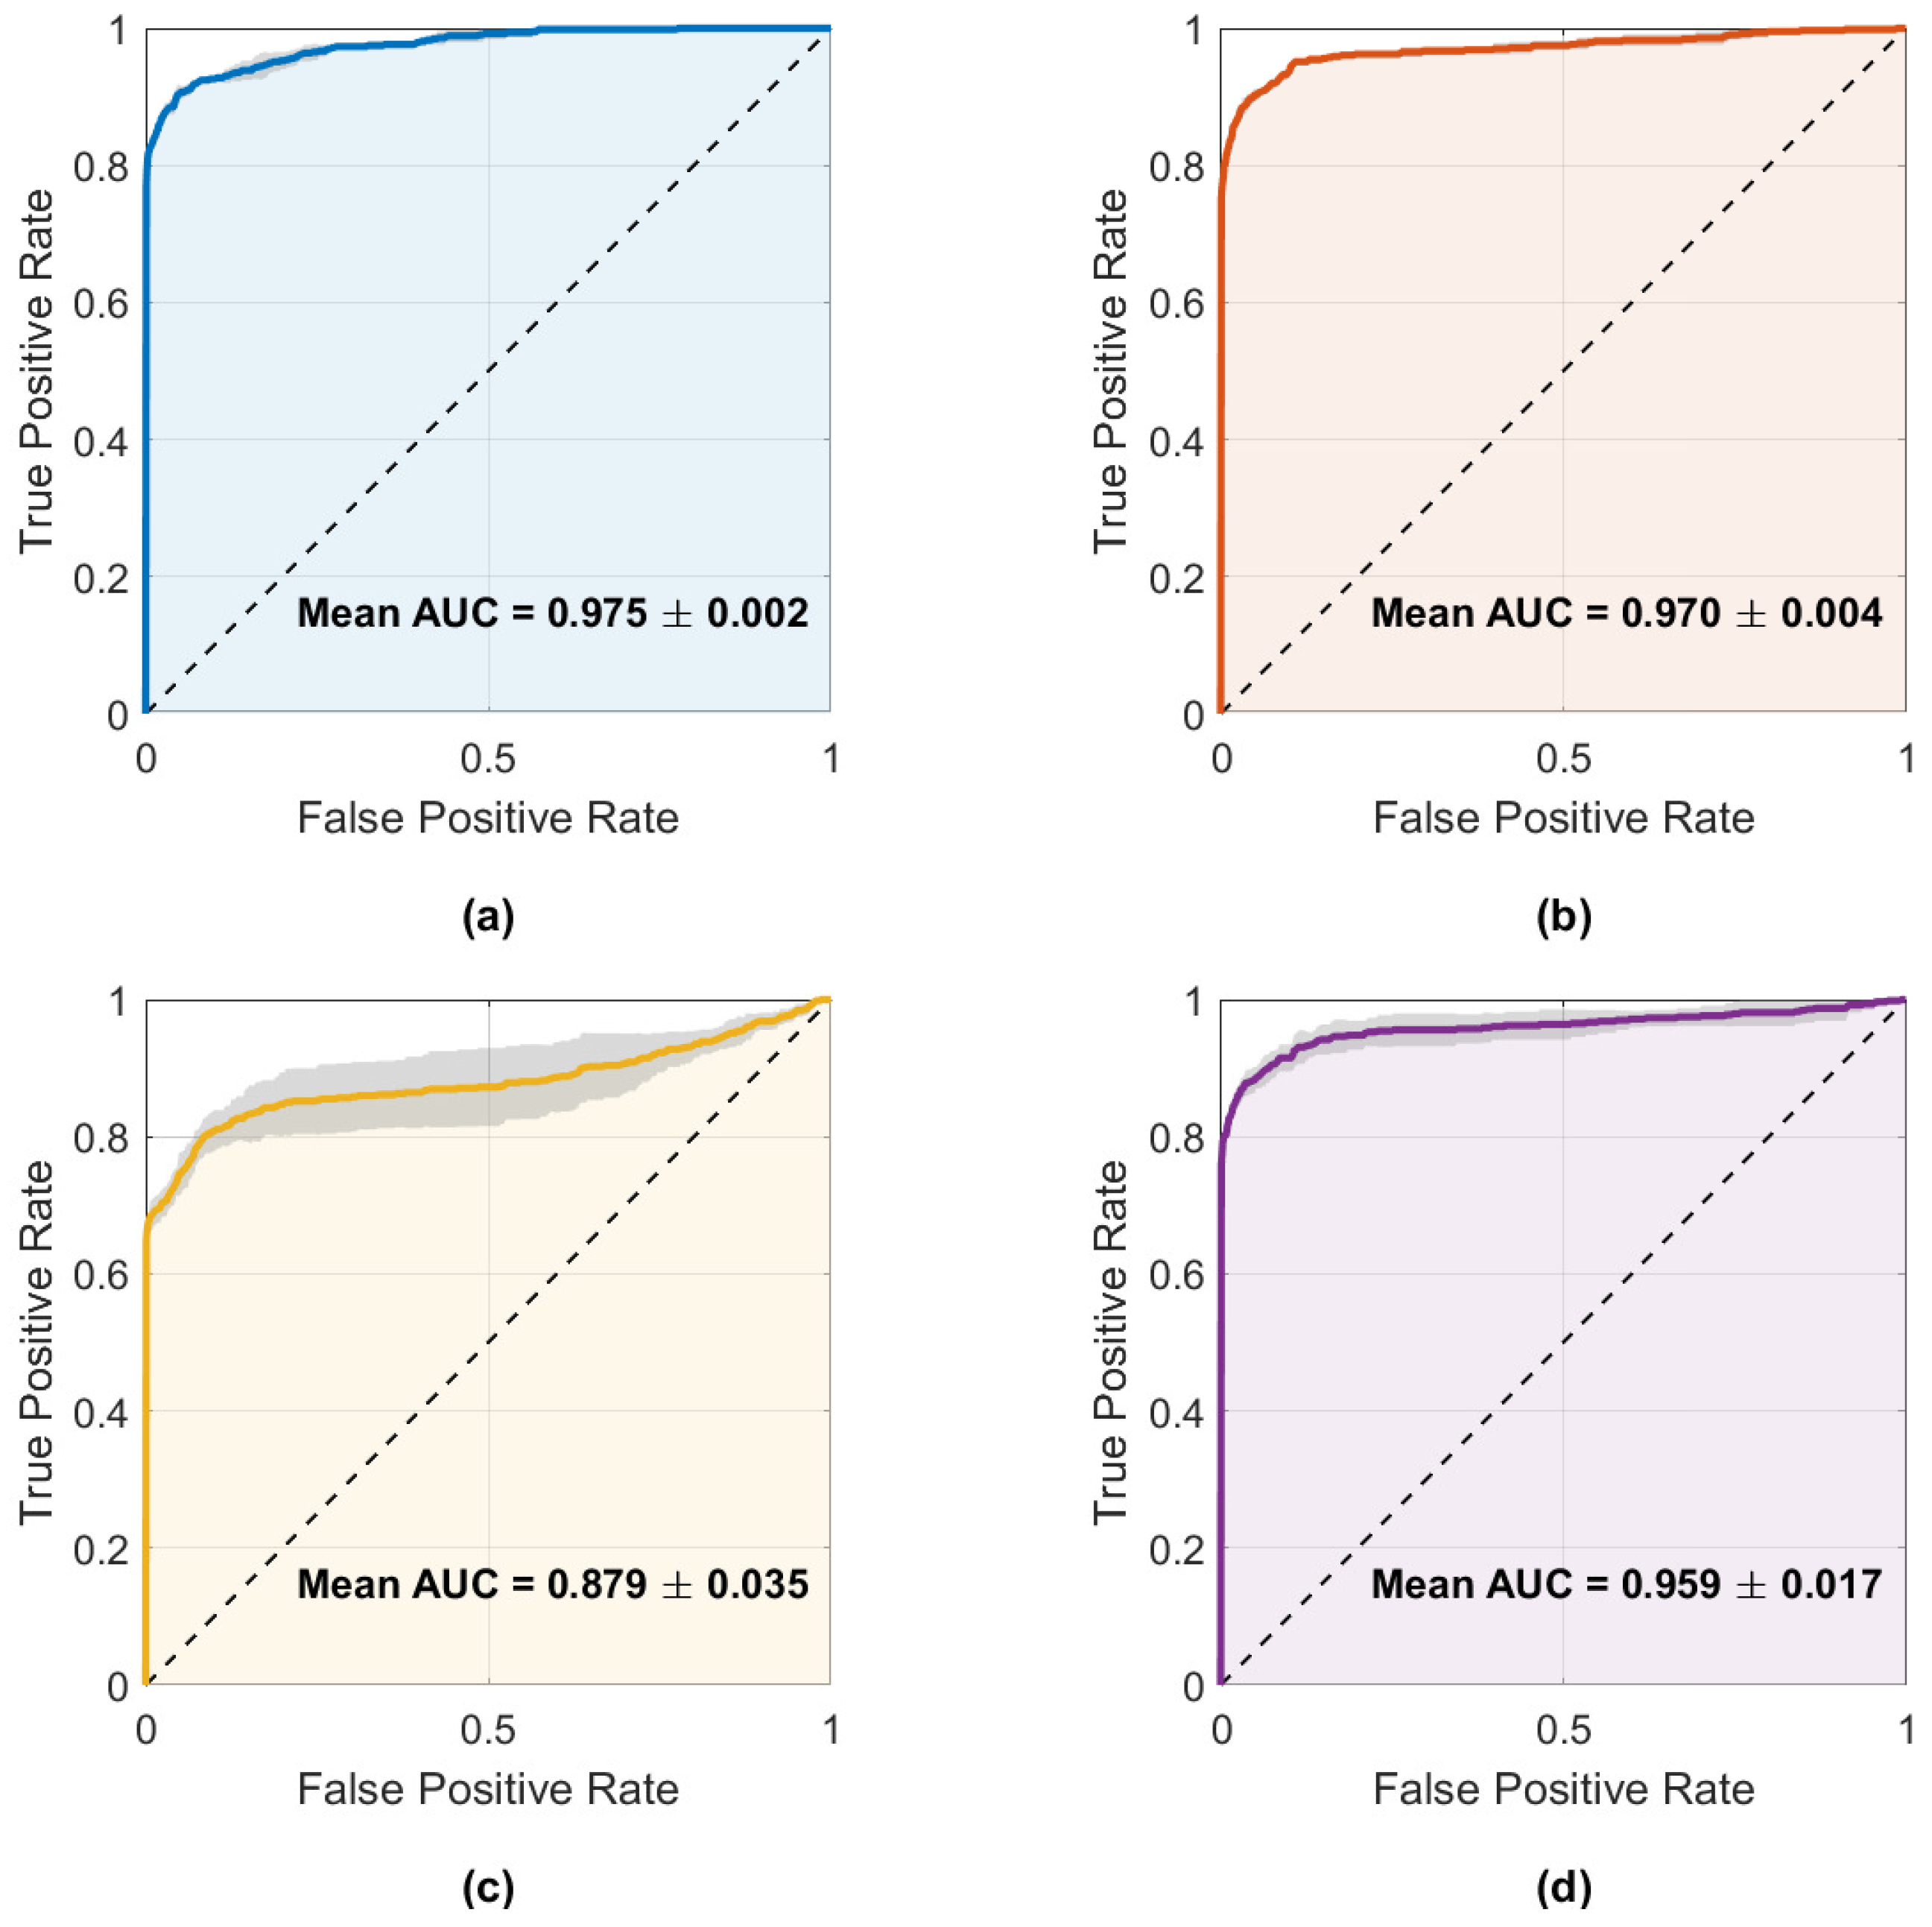
Figure 10 illustrates the fault detections produced by the best model of each architecture, while Figure 11 displays the mean ROC curves with corresponding AUCs. These results align with the metrics shown in Table 4, where CNN–LSTM and GRU achieved the highest mean AUCs (0.975 and 0.970), whereas 1D–CNN exhibited the lowest (0.879).
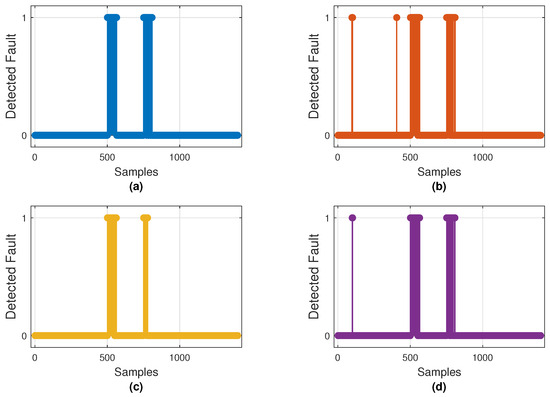
Figure 10.
Binary fault detections on the test set by the best-performing model of each architecture: (a) CNN–LSTM, (b) GRU, (c) 1D–CNN, and (d) Transformer–LSTM. Markers at 1 indicate samples classified as faulty (0 = normal).
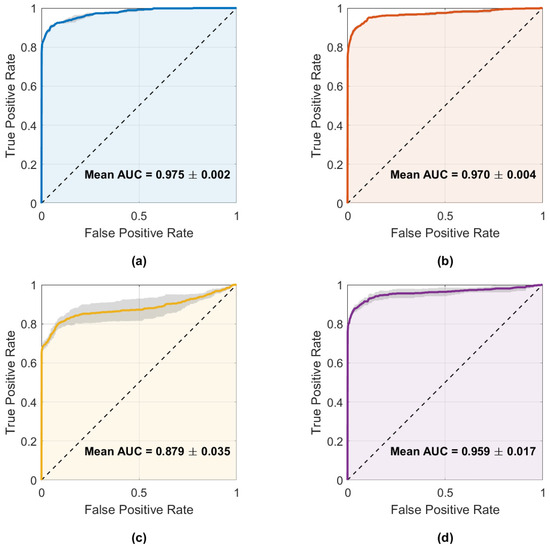
Figure 11.
Mean ROC curves with ±1 standard deviation for the four main architectures: (a) CNN–LSTM, (b) GRU, (c) 1D–CNN, and (d) Transformer–LSTM. Annotated AUC values correspond to the mean ± SD across runs.
Both plots confirm that CNN–LSTM and GRU successfully detect most injected faults with few false alarms. In contrast, 1D–CNN is more conservative—missing brief noise bursts—while Transformer–LSTM shows inconsistent detection behavior. Overall, CNN–LSTM remains the most balanced and reliable detector, with GRU as a close alternative.
5.3. Validation on the OhioT1DM Clinical Dataset
To demonstrate the effectiveness of detecting and imputing anomalous and missing data, a validation was performed using the publicly available OhioT1DM clinical dataset, which includes real-world continuous glucose monitoring (CGM) measurements accompanied by time-stamped insulin doses and meal carbohydrate information. It should be noted that the data presented in this repository contain sensor failures, resulting in noise and missing data that naturally occur due to sensor disconnections. We present this in Table 5. This table shows some of the longest periods with missing data. However, the noisy data cannot be corroborated as this information is not available in the dataset.

Table 5.
Top 5 periods with longest missing data.
Then, due to hybrid CNN-LSTM architecture performed as the best model for detecting missing and anomalous data, it was used without architectural changes. Since OhioT1DM lacks a reference glucose trace, which is critical for missing segments, we only report classification metrics and include a qualitative imputation graph for context.
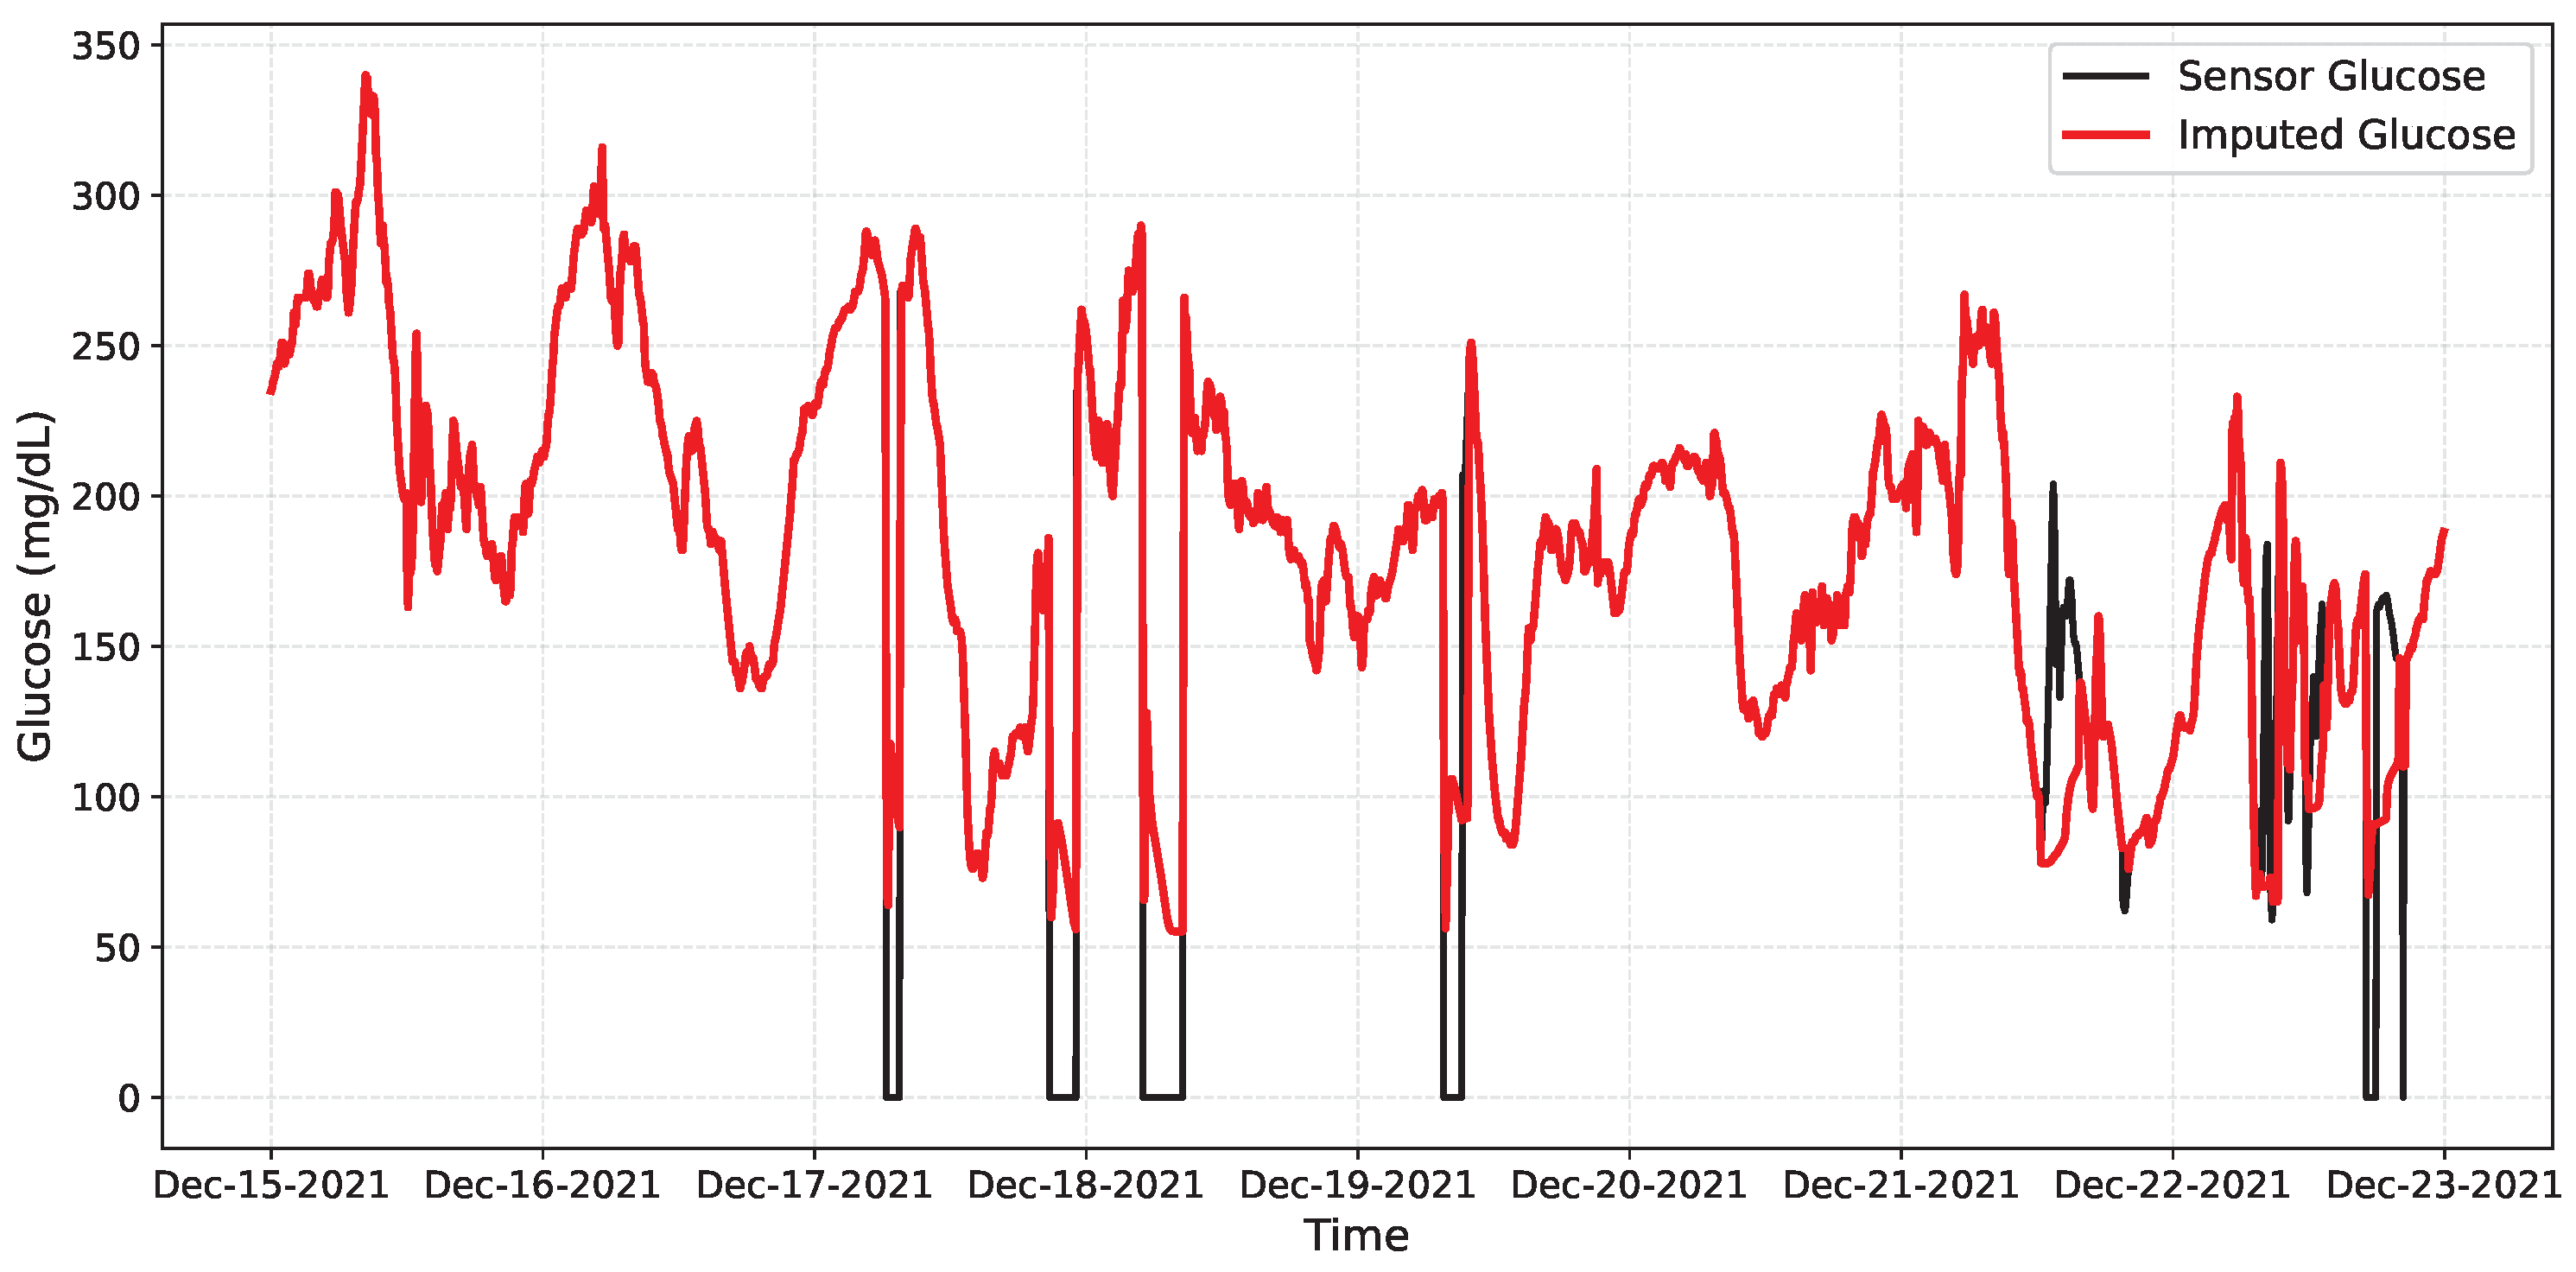
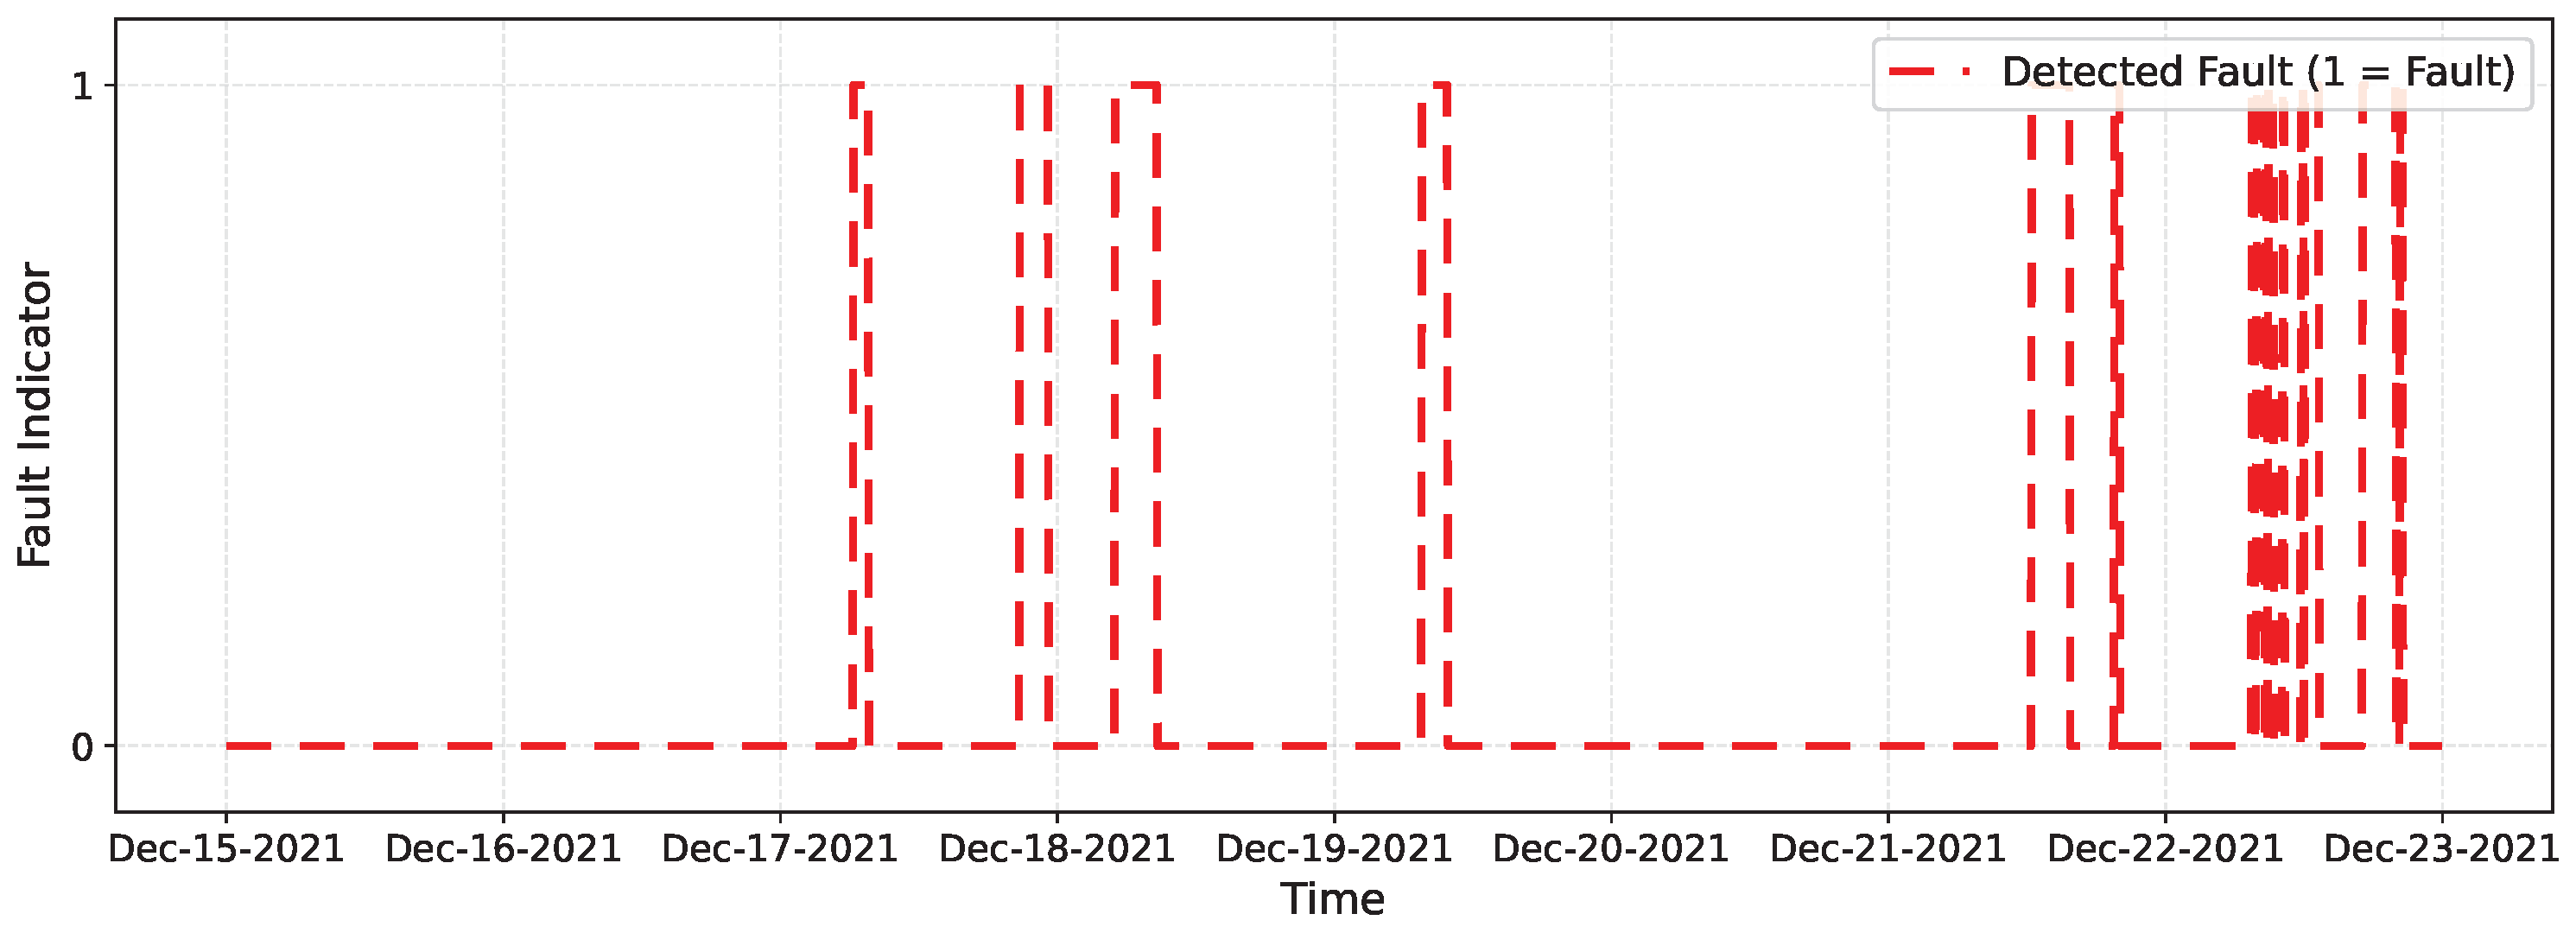
Table 6 summarizes the network performance. The model achieved a high recall rate, meaning all disconnections were detected, with moderate precision (0.6266), indicating some false positives during noisy but valid periods. The F1 of 0.7705 reflects a good balance for our online setting, and the overall accuracy (0.9547) remains high, as most samples are free of faults. Figure 12 shows the imputation achieved by the network on a segment of the data, while Figure 13 presents the intervals in which the network detects anomalous or missing data.

Table 6.
Fault detection performance on the OhioT1DM dataset (single subject, mean ± SD over 5 runs).
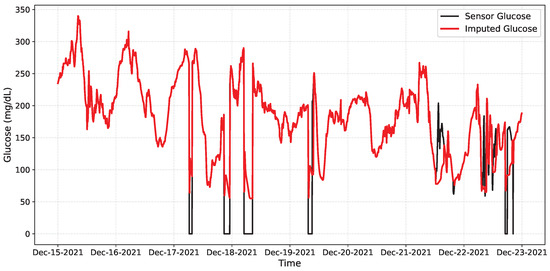
Figure 12.
Qualitative online imputation on OhioT1DM. Black: CGM glucose; Red: CNN–LSTM prediction. Dropouts appear as gaps/near-zero samples; the model bridges them smoothly and re-aligns when data resume.
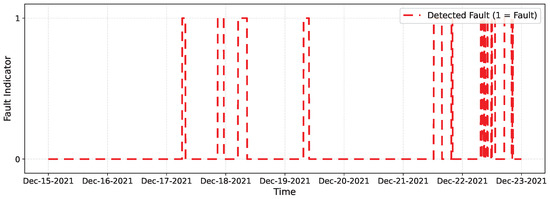
Figure 13.
Binary online fault detection on OhioT1DM. Markers at 1 indicate time samples classified as faulty (0 = normal).
6. Discussion
Results highlight complementary strengths among the evaluated architectures. For imputation, the GRU achieved the lowest MAE (2.29 ± 0.19 mg/dL), showing the highest accuracy in restoring missing or anomalous data, while the 1D–CNN attained the best RMSE (3.75 ± 0.26 mg/dL) and MARD (0.17 ± 0.02%), excelling at limiting large deviations. CNN–LSTM remained competitive across metrics, whereas Transformer–LSTM underperformed in all three. The ARIMA baseline yielded substantially higher errors across all metrics, confirming the limitations of linear models for nonlinear glucose dynamics, whereas the TCN achieved intermediate performance—stable but less accurate than recurrent and hybrid architectures.
In fault detection, all models achieved high AUCs (≥0.968). CNN–LSTM offered the best overall balance (F1 = 0.876; accuracy = 0.979), closely followed by GRU (F1 = 0.868), while 1D–CNN reached the highest precision (0.975) but at lower recall. Transformer–LSTM showed accuracy comparable to the top performers but with slightly higher false positives. TCN performed moderately well (F1 ≈ 0.78), while ARIMA remained far below the neural models, emphasizing the superiority of deep learning approaches for robust online fault detection. In short, GRU minimizes typical errors, 1D–CNN limits large deviations, and CNN–LSTM provides the most balanced detection under diverse fault conditions.
Recurrent models (LSTM/GRU) effectively capture long-term glucose dynamics, while convolutional approaches enhance denoising and extraction of short-term features. Together, they form a complementary framework that supports reliable online prediction and correction of CGM signals.
The proposed system can operate as a lightweight software layer integrated into CGM platforms, where a real-time detector (e.g., CNN–LSTM) continuously monitors glucose readings and interacts with an imputation module (GRU or 1D–CNN) to correct faulty samples. Built-in safety mechanisms, such as fallback to a Last Observation Carried Forward (LOCF) strategy and flags for automated insulin delivery systems, ensure safe operation.
By reconstructing missing segments and suppressing noise, the framework reduces false alarms, stabilizes inputs for automated insulin delivery, and improves interpretation of meal and insulin-related glucose trends. These improvements could help patients spend more time within target glucose ranges. Prospective clinical validation remains necessary to confirm these benefits and quantify their impact on alarm frequency and patient outcomes.
Finally, real-world implementation will need to account for variability among CGM brands, environmental conditions, and inter-individual physiological differences. Future trials should evaluate robustness under motion, temperature, and long-term use to ensure clinical reliability.
7. Conclusions and Future Work
This study addressed online data imputation and anomaly detection in continuous glucose monitoring (CGM) systems using deep neural networks fed with physiological inputs. Four architectures, CNN–LSTM, GRU, 1D–CNN, and Transformer LSTM, were evaluated under a controlled fault-injection protocol. An ARIMA model served as a classical baseline, providing a deterministic benchmark, and a Temporal Convolutional Network (TCN) was included to assess the behavior of causal convolutional models. Performance was compared through regression metrics (MAE, RMSE, MARD) and classification metrics (accuracy, precision, recall, F1, AUC).
Results indicate that no single model dominates both tasks; rather, performance depends on the operational goal. For anomaly detection, CNN–LSTM achieved the best F1-score and accuracy, followed closely by GRU, while 1D–CNN offered the fewest false alarms. In online imputation, 1D–CNN minimized large deviations (lowest RMSE and MARD) and showed excellent stability, whereas GRU achieved the smallest average errors. The TCN demonstrated stable long-range modeling and robustness during extended data gaps, though with slightly lower accuracy than recurrent or hybrid architectures, and ARIMA underperformed across all metrics, confirming the advantage of nonlinear neural approaches.
Integrating physiological signals such as insulin and carbohydrate intake improved signal alignment and noise resilience by providing contextual information to the models. The combined detection imputation framework, supported by a sliding-window temporal structure, enables robust real-time handling of corrupted CGM data. Model selection should therefore depend on whether the primary goal is to minimize large errors or ensure reliable detection.
Validation using one subject from the clinical OhioT1DM dataset confirmed that the trained models generalize to real CGM signals, maintaining high detection accuracy and consistent imputation performance.
Although this study employed a fixed 10 mg/dL detection threshold, future work will explore adaptive schemes that scale with glucose level or recent variability. Such heteroscedastic thresholds could better discriminate faults across hypo- and hyperglycemic ranges, reducing false alarms and improving reliability during unstable glycemic conditions.
From a clinical perspective, adaptive fault detection could enhance the safety of closed-loop insulin delivery systems by distinguishing genuine glucose excursions from sensor noise, supporting smoother and more accurate automated control.
As future work, a mixed online framework will be developed using the best performing networks, CNN-LSTM for real-time fault detection and 1D–CNN/GRU for imputation, combined with adaptive thresholds to achieve a more robust and clinically deployable CGM correction system.
Author Contributions
Investigation, O.D.S. and E.M.-P.; Methodology, A.Y.A. and E.M.-P.; Software, O.D.S. and D.A.P.; Supervision, D.A.P. and A.Y.A.; Visualization, O.D.S. and J.G.A.; Writing—original draft, O.D.S., D.A.P. and H.M.H.; Writing—review and editing, A.Y.A. and D.A.P.; Development of Metodology, O.D.S. and D.A.P. All authors have read and agreed to the published version of the manuscript.
Funding
The Centro Universitario de Ciencias Exactas e Ingenierías (CUCEI) of Universidad de Guadalajara (U. de G.), provided funding to publish this paper.
Data Availability Statement
Data are available upon request to the corresponding author.
Acknowledgments
The authors thank the Universidad de Guadalajara for giving us the support to develop this research. We also thank SECIHTI for the financing provided in the project.
Conflicts of Interest
The authors declare no conflicts of interest.
Appendix A. Sorensen Model
The model proposed by Sorensen is a system consisting of 19 nonlinear equations. Through three subsystems, the dynamics of glucose are represented: insulin, glucagon, and metabolic rates. A detailed description of this model can be found in [29]. So, to reproduce the dynamics of T1DM, the following assumptions are made: first, release of insulin by pancreas is omitted, and second, scale of metabolic functions can be changed in such a way that blood glucose levels correspond to a patient with T1DM concerning parametric identification. Equations of the Sorensen model are shown in Appendix A.1. In addition, for greater clarity, equations are grouped into three subsystems to which they belong. In Appendix B, the set of nominal values of the Sorensen parameters are included.
Appendix A.1. Glucose Subsystem
The first subsystem shown is the one corresponding to glucose that involves six compartments (brain and central nervous system; heart and lungs; adipose tissue and skeletal muscle; stomach and small intestine; liver and kidney). These compartments connect directly, and there are a minimal set of physiological processes to isolate the unit of glucose metabolism in said organs and tissues. As a result, the glucose subsystem has eight differential equations with nonlinear terms:
Brain (vascular tissue):
Brain (interstitial tissue):
Heart and lungs:
Gut:
Liver:
Kidney:
Periphery (vascular tissue):
Periphery (interstitial tissue):
Appendix A.2. Insulin Subsystem
The dynamics of insulin are similar to physiological glucose, with the only difference being that the insulin subsystem considers the pancreas as one more compartment. However, this compartment is eliminated according to the aforementioned assumption for patients with T1DM. In addition, the dynamics of insulin in interstitial fluid of the brain is not considered since the brain cell membrane is impermeable to passage of insulin in cerebrospinal fluid [30]:
Brain (vascular tissue):
Heart and lungs:
Gut:
Liver:
Kidney:
Periphery (vascular tissue):
Periphery (interstitial tissue):
Appendix A.3. Metabolic Rates and Dynamics of Glucagon
Finally, we describe metabolic rates that contribute to the mass balance of physiological processes in some compartments. In the glucose subsystem, seven metabolic rates are considered, three are included for the insulin subsystem, and finally, two correspond to the plasmatic glucagon elimination and release rates.
Brain glucose uptake rate:
Red blood cell glucose rate:
Glut glucose uptake rate:
Periphery glucose uptake rate:
Hepatic glucose production rate:
Hepatic glucose production mediated by insulin:
Hepatic glucose uptake rate:
Solution of hepatic glucose uptake mediated by insulin:
Kidney glucose excretion rate:
Hepatic insulin clearance rate:
Pancreatic insulin release rate:
Kidney insulin clearance rate:
Periphery insulin clearance rate:
Plasmatic glucagon release rate:
Only one compartment is used for modeling the counter-regulatory effect of glucagon on the glucose–insulin system.
Appendix B. Sorensen Nominal Parameter Values

Table A1.
Hemodynamic parameters.
Table A1.
Hemodynamic parameters.

Table A2.
Hemodynamic parameters.
Table A2.
Hemodynamic parameters.

Table A3.
Metabolic parameters.
Table A3.
Metabolic parameters.
References
- Cobelli, C.; Dalla Man, C.; Sparacino, G.; Magni, L.; De Nicolao, G.; Kovatchev, B.P. Diabetes: Models, Signals, and Control. IEEE Rev. Biomed. Eng. 2009, 2, 54–96. [Google Scholar] [CrossRef] [PubMed]
- Bian, Q.; As’arry, A.; Cong, X.; Rezali, K.A.b.M.; Raja Ahmad, R.M.K.b. A hybrid Transformer-LSTM model apply to glucose prediction. PLoS ONE 2024, 19, e0310084. [Google Scholar] [CrossRef] [PubMed]
- Alanis, A.Y.; Alvarez, J.G.; Sanchez, O.D.; Hernandez, H.M.; Valdivia-G, A. Fault-Tolerant Closed-Loop Controller Using Online Fault Detection by Neural Networks. Machines 2024, 12, 844. [Google Scholar] [CrossRef]
- van Doorn, W.P.T.M.; Foreman, Y.D.; Schaper, N.C.; Savelberg, H.H.C.M.; Koster, A.; van der Kallen, C.J.H.; Wesselius, A.; Schram, M.T.; Henry, R.M.A.; Dagnelie, P.C.; et al. Machine learning-based glucose prediction with use of continuous glucose and physical activity monitoring data: The Maastricht Study. PLoS ONE 2021, 16, e0253125. [Google Scholar] [CrossRef] [PubMed]
- Hegde, H.; Shimpi, N.; Panny, A.; Glurich, I.; Christie, P.; Acharya, A. MICE vs PPCA: Missing data imputation in healthcare. Inform. Med. Unlocked 2019, 17, 100275. [Google Scholar] [CrossRef]
- Zhang, Z. Multiple imputation with multivariate imputation by chained equation (MICE) package. Ann. Transl. Med. 2016, 4, 30. [Google Scholar] [PubMed]
- Sun, Y.; Li, J.; Xu, Y.; Zhang, T.; Wang, X. Deep learning versus conventional methods for missing data imputation: A review and comparative study. Expert Syst. Appl. 2023, 227, 120201. [Google Scholar] [CrossRef]
- Zhao, C.; Fu, Y. Statistical analysis based online sensor failure detection for continuous glucose monitoring in type I diabetes. Chemom. Intell. Lab. Syst. 2015, 144, 128–137. [Google Scholar] [CrossRef]
- Li, K.; Daniels, J.; Liu, C.; Herrero, P.; Georgiou, P. Convolutional Recurrent Neural Networks for Glucose Prediction. IEEE J. Biomed. Health Inform. 2020, 24, 603–613. [Google Scholar] [CrossRef] [PubMed]
- Alkanhel, R.I.; Saleh, H.; Elaraby, A.; Alharbi, S.; Elmannai, H.; Alaklabi, S.; Alsamhi, S.H.; Mostafa, S. Hybrid CNN-GRU Model for Real-Time Blood Glucose Forecasting: Enhancing IoT-Based Diabetes Management with AI. Sensors 2024, 24, 7670. [Google Scholar] [CrossRef] [PubMed]
- Dey, R.; Salem, F.M. Gate-Variants of Gated Recurrent Unit (GRU) Neural Networks. In Proceedings of the 2017 IEEE 60th International Midwest Symposium on Circuits and Systems (MWSCAS), Boston, MA, USA, 6–9 August 2017; IEEE: Piscataway, NJ, USA, 2017; pp. 1597–1600. [Google Scholar] [CrossRef]
- Alshehri, O.S.; Alshehri, O.M.; Samma, H. Blood Glucose Prediction Using RNN, LSTM, and GRU: A Comparative Study. In Proceedings of the 2024 IEEE International Conference on Advanced Systems and Emergent Technologies (IC_ASET), Hammamet, Tunisia, 27–29 April 2024; IEEE: Piscataway, NJ, USA, 2024; pp. 1–5. [Google Scholar] [CrossRef]
- Acuna, E.; Aparicio, R.; Palomino, V. Analyzing the Performance of Transformers for the Prediction of the Blood Glucose Level Considering Imputation and Smoothing. Big Data Cogn. Comput. 2023, 7, 41. [Google Scholar] [CrossRef]
- Shi, J.; Wang, S.; Qu, P.; Shao, J. Time series prediction model using LSTM-Transformer neural network for mine water inflow. Sci. Rep. 2024, 14, 18284. [Google Scholar] [CrossRef] [PubMed]
- Ruiz Velázquez, E.; Sánchez, O.D.; Quiroz, G.; Pulido, G.O. Parametric identification of Sorensen model for glucose-insulin-carbohydrates dynamics using evolutive algorithms. Kybernetika 2018, 54, 110–134. [Google Scholar] [CrossRef]
- Samal, K.K.R. Auto Imputation Enabled Deep Temporal Convolutional Network (TCN) Model for PM2.5 Forecasting. EAI Endorsed Trans. Scalable Inf. Syst. 2025, 12, e5102. [Google Scholar] [CrossRef]
- Muñoz-Organero, M.; Queipo-Álvarez, P.; García Gutiérrez, B. Learning Carbohydrate Digestion and Insulin Absorption Curves Using Blood Glucose Level Prediction and Deep Learning Models. Sensors 2021, 21, 4926. [Google Scholar] [CrossRef] [PubMed]
- Annuzzi, G.; Apicella, A.; Arpaia, P.; Bozzetto, L.; Criscuolo, S.; De Benedetto, E.; Pesola, M.; Prevete, R.; Vallefuoco, E. Impact of Nutritional Factors in Blood Glucose Prediction in Type 1 Diabetes Through Machine Learning. IEEE Access 2023, 11, 17104–17115. [Google Scholar] [CrossRef]
- Scholz, M.; Gatzek, S.; Sterling, A.; Fiehn, O.; Selbig, J. Metabolite fingerprinting: Detecting biological features by independent component analysis. Bioinformatics 2004, 20, 2447–2454. [Google Scholar] [CrossRef] [PubMed]
- Sanchez, O.D.; Martinez-Soltero, G.; Alvarez, J.G.; Alanis, A.Y. Real-Time Neural Classifiers for Sensor Faults in Three Phase Induction Motors. IEEE Access 2023, 11, 19657–19670. [Google Scholar] [CrossRef]
- Huang, W.; Li, S.; Lu, J.; Shen, Y.; Wang, Y.; Wang, Y.; Feng, K.; Huang, X.; Zou, Y.; Hu, L.; et al. Accuracy of the intermittently scanned continuous glucose monitoring system in critically ill patients: A prospective, multicenter, observational study. Endocrine 2022, 78, 470–475. [Google Scholar] [CrossRef] [PubMed]
- Siami-Namini, S.; Tavakoli, N.; Siami Namin, A. The Performance of LSTM and BiLSTM in Forecasting Time Series. In Proceedings of the 2019 IEEE International Conference on Big Data (Big Data), Los Angeles, CA, USA, 9–12 December 2019; IEEE: Piscataway, NJ, USA, 2019; pp. 3285–3292. [Google Scholar] [CrossRef]
- Lindemann, B.; Müller, T.; Vietz, H.; Jazdi, N.; Weyrich, M. A survey on long short-term memory networks for time series prediction. Procedia CIRP 2021, 99, 650–655. [Google Scholar] [CrossRef]
- Shenfield, A.; Howarth, M. A Novel Deep Learning Model for the Detection and Identification of Rolling Element-Bearing Faults. Sensors 2020, 20, 5112. [Google Scholar] [CrossRef] [PubMed]
- Zhou, Y.; Wu, W.; Nathan, R.; Wang, Q.J. Deep Learning-Based Rapid Flood Inundation Modeling for Flat Floodplains With Complex Flow Paths. Water Resour. Res. 2022, 58, e2022WR033214. [Google Scholar] [CrossRef]
- Wen, Q.; Zhou, T.; Zhang, C.; Chen, W.; Ma, Z.; Yan, J.; Sun, L. Transformers in Time Series: A Survey. arXiv 2023, arXiv:2202.07125. [Google Scholar] [CrossRef]
- International Organization for Standardization. In Vitro Diagnostic Test Systems—Requirements for Blood-Glucose Monitoring Systems for Self-Testing in Managing Diabetes Mellitus; Standard No. ISO 15197:2013; ISO: Geneva, Switzerland, 2013; Available online: https://www.iso.org/standard/54976.html (accessed on 25 October 2025).
- Clarke, W.L.; Cox, D.; Gonder-Frederick, L.A.; Carter, W.; Pohl, S.L. Evaluating clinical accuracy of systems for self-monitoring of blood glucose. Diabetes Care 1987, 10, 622–628. [Google Scholar] [CrossRef] [PubMed]
- Sorensen, J.T. A Physiologic Model of Glucose Metabolism in Man and Its Use to Design and Assess Improved Insulin Therapies for Diabetes. Ph.D. Thesis, Massachusetts Institute of Technology, Cambridge, MA, USA, 1985. [Google Scholar]
- Hovorka, R.; Shojaee-Moradie, F.; Carroll, P.; Chassin, L.; Gowrie, I.; Jackson, N.; Tudor, R.; Umpleby, A.; Jones, R. Partitioning glucose distribution/transport, disposal, and endogenous production during IVGTT. Am. J. Physiol. Endocrinol. Metab. 2002, 282, E992–E1007. [Google Scholar] [CrossRef] [PubMed]
Disclaimer/Publisher’s Note: The statements, opinions and data contained in all publications are solely those of the individual author(s) and contributor(s) and not of MDPI and/or the editor(s). MDPI and/or the editor(s) disclaim responsibility for any injury to people or property resulting from any ideas, methods, instructions or products referred to in the content. |
© 2025 by the authors. Licensee MDPI, Basel, Switzerland. This article is an open access article distributed under the terms and conditions of the Creative Commons Attribution (CC BY) license (https://creativecommons.org/licenses/by/4.0/).

