
Algorithm and Methods for Analyzing Power Consumption Behavior of Industrial Enterprises Considering Process Characteristics


Abstract
1. Introduction
2. Materials and Methods
- The types, quantity, and parameters of controlled components.
- The sequence, duration, and frequency of analysis of the state of the technological process and its power supply system.
- The accuracy of assessment of current parameters of the production process and its power supply system.
3. Results
- 1.
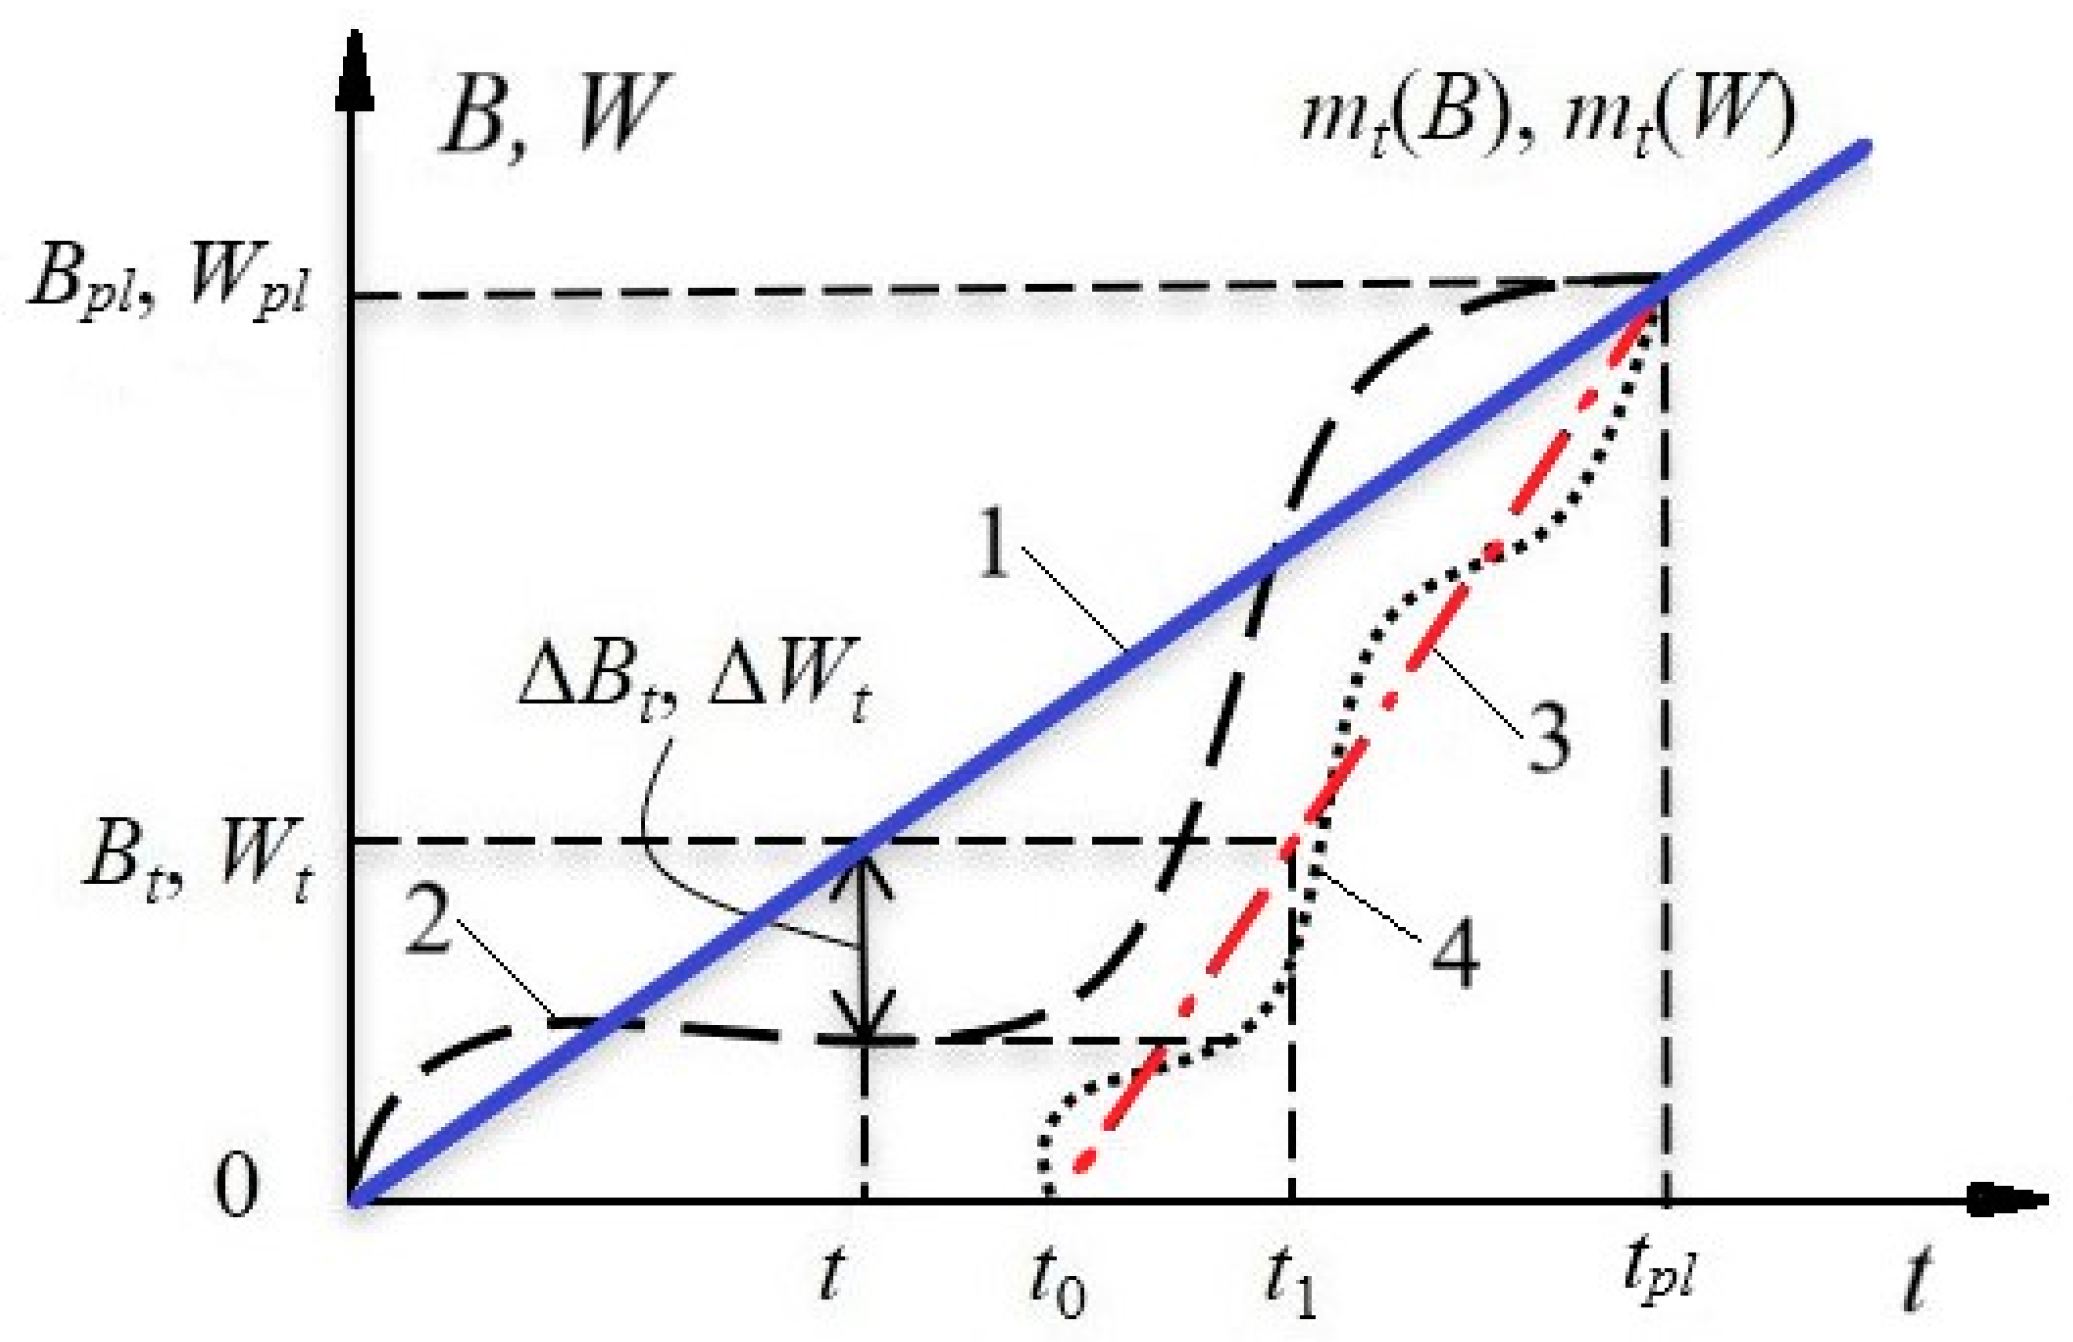
- By the time of control t, 65% of the planned production volume with power consumption should have been produced.
- 2.
- The actual process state (as measured by sensors and electricity meters) by control time t corresponds to an output of 50% .
- 3.
- The remaining amount of work to fulfill the output plan with the corresponding electricity consumption is determined to be 50%.
- 4.
- Actual deviations from the plan on output and power consumption , amounted to 15%.
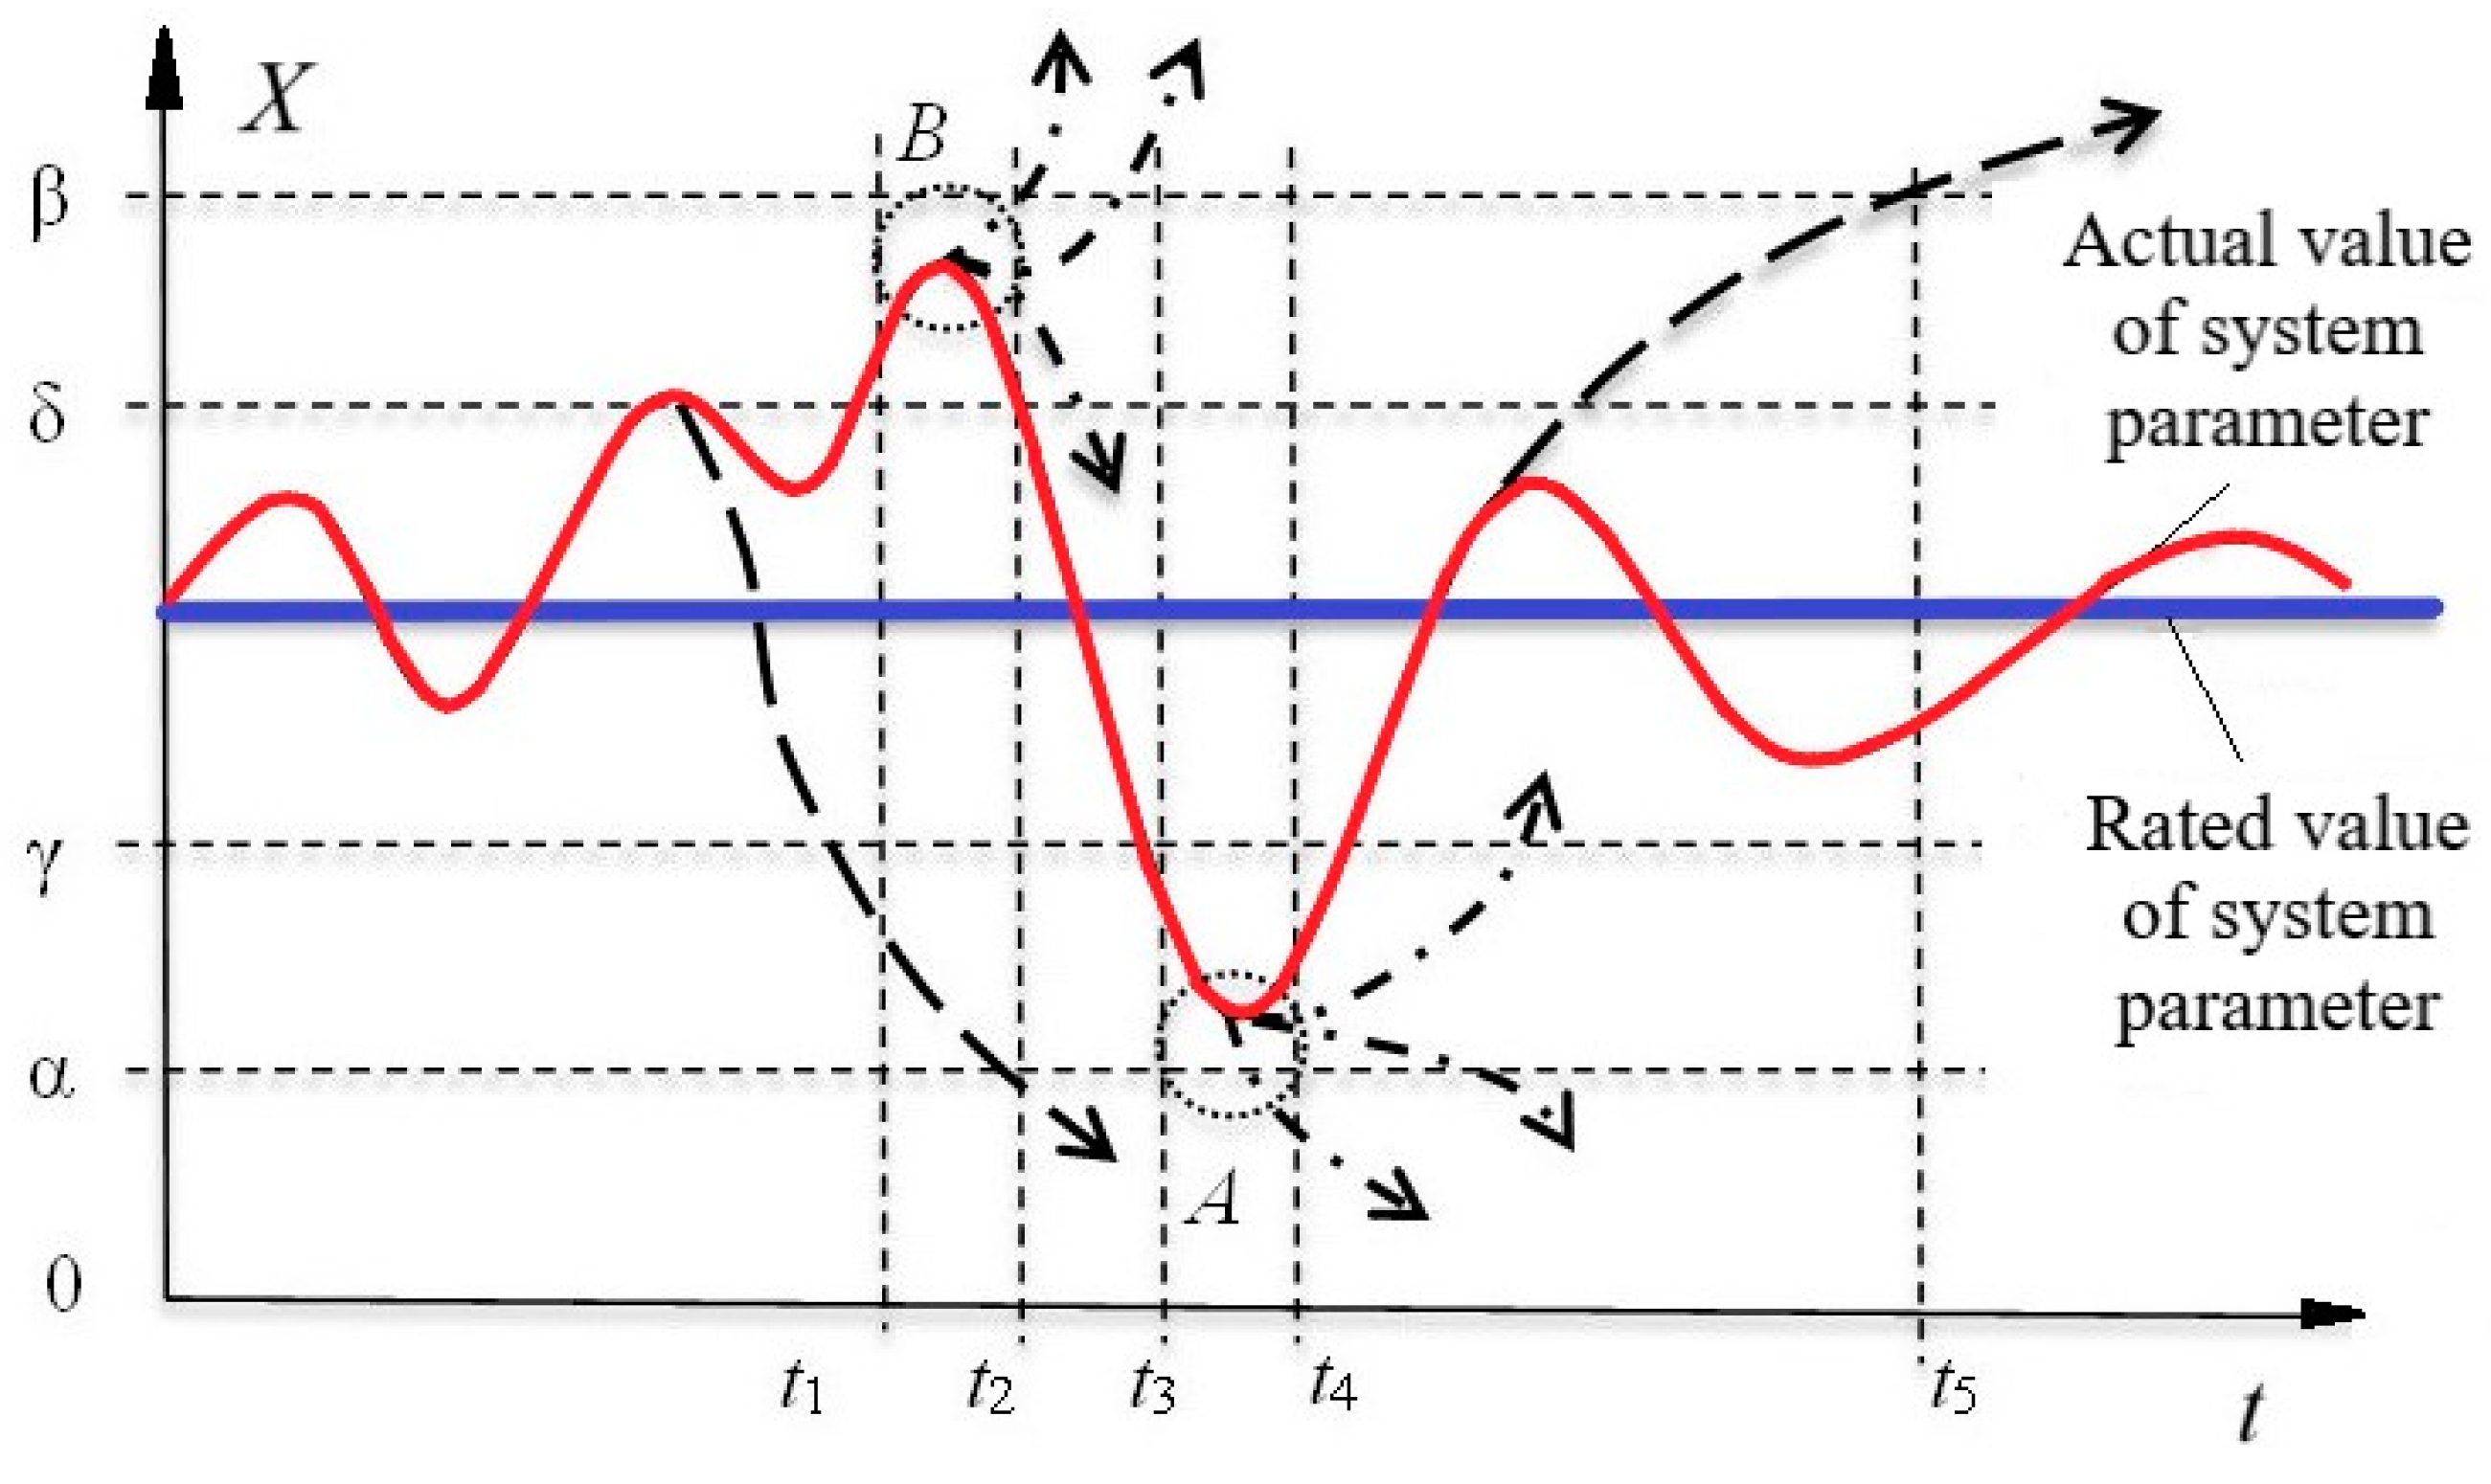
- 5.
- It is required to increase the speed of the technological process, compared to the planned (calculated), to complete the task of production in the established time for a time equal to 35% of the total time of work .
- 6.
- If there are no restrictions on the amount of power consumption, then by increasing the speed of the technological process by 43% at the time interval , provided that all the technological regulations are observed, the plan for production output can be fulfilled by the time .
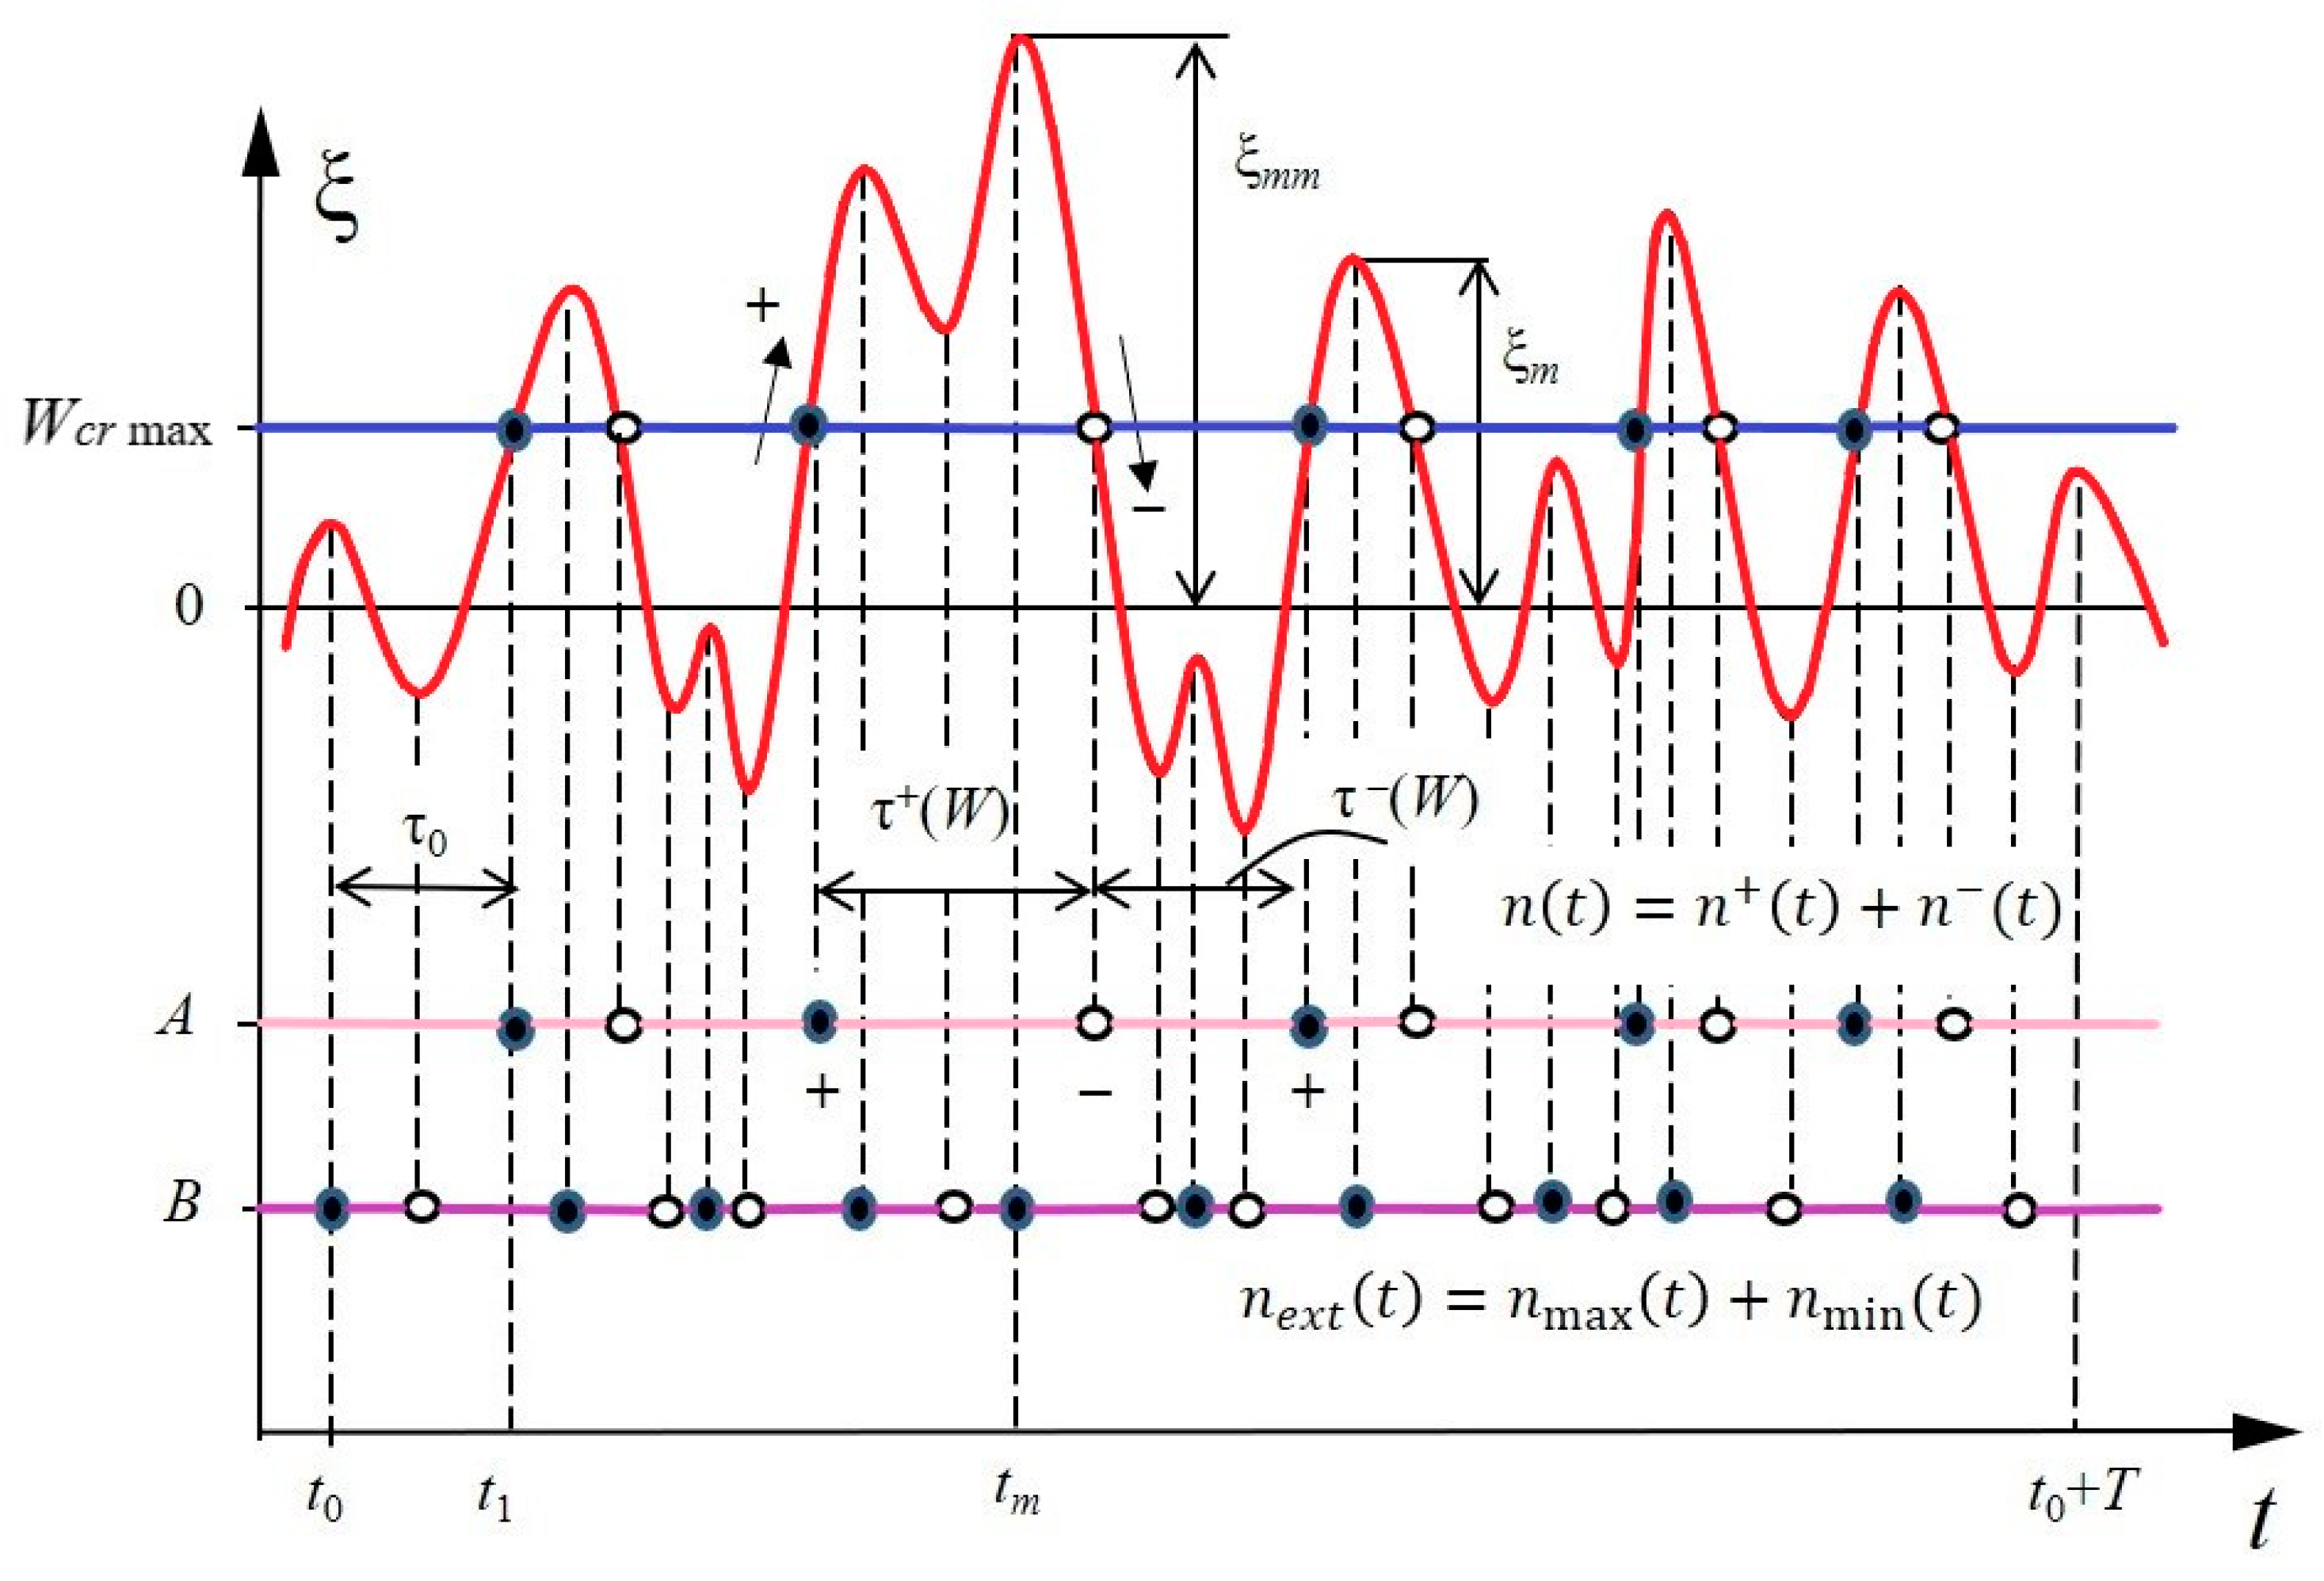
- 7.
- If at the time interval , there are failures of technological or electrical equipment in the power supply system, disruptions in the receipt of raw materials and components, as well as there is a deficit of active capacity in the power system, it is necessary to assess the probability of transition to a mode with increased speed of the technological process. According to retrospective statistical data for the enterprise under consideration and on the basis of the probability multiplication theorem for independent events .
- 8.
- If technological regulations allow the maximum speed of the technological process (due to the introduction of reserve equipment) to exceed the nominal one by 80%, then the minimum time required to fulfill the plan for production output by the time will be 56% of .
- 9.
- Based on this, it is possible to calculate the maximum time of possible delay in the start of production , which for the considered enterprise will amount to 44% of at the nominal speed of the technological process.
4. Discussion
Potential Areas of Development
5. Conclusions
Author Contributions
Funding
Data Availability Statement
Conflicts of Interest
References
- Sinsel, S.R.; Riemke, R.L.; Hoffmann, V.H. Challenges and solution technologies for the integration of variable renewable energy sources—A review. Renew. Energy 2020, 145, 2271–2285. [Google Scholar] [CrossRef]
- Bassam, N.E. Grid challenges: Integration of distributed renewables with the national grid. In Distributed Renewable Energies for Off-Grid Communities: Empowering a Sustainable, Competitive, and Secure Twenty-First Century; Elsevier: Amsterdam, The Netherlands, 2021; pp. 451–456. [Google Scholar] [CrossRef]
- Ilyushin, P.V.; Pazderin, A.V.; Seit, R.I. Photovoltaic power plants participation in frequency and voltage regulation. In Proceedings of the 17th International Ural Conference on AC Electric Drives (ACED 2018), Ekaterinburg, Russia, 26–30 March 2018. [Google Scholar] [CrossRef]
- Somma, M.D.; Graditi, G.; Heydarian-Forushani, E.; Shafie-khah, M.; Siano, P. Stochastic optimal scheduling of distributed energy resources with renewables considering economic and environmental aspects. Renew. Energy 2018, 116, 272–287. [Google Scholar] [CrossRef]
- Liang, J. Hydropower Industry Development in China and United States. Adv. Econ. Manag. Political Sci. 2024, 87, 159–165. [Google Scholar] [CrossRef]
- Bhatt, P.; Joshi, K.R. Hydropower Development in Nepal: Status, opportunities and challenges. J. UTEC Eng. Manag. 2024, 2, 125–135. [Google Scholar] [CrossRef]
- Hai, T.; Zhou, J.; Rezvani, A.; Le, B.N.; Oikawa, H. Optimal energy management strategy for a renewable based microgrid with electric vehicles and demand response program. Electr. Power Syst. Res. 2023, 221, 109370. [Google Scholar] [CrossRef]
- Dorahaki, S.; Rashidinejad, M.; Fatemi Ardestani, S.F.; Abdollahi, A.; Salehizadeh, M.R. An integrated model for citizen energy communities and renewable energy communities based on clean energy package: A two-stage risk-based approach. Energy 2023, 277, 127727. [Google Scholar] [CrossRef]
- Ilyushin, P.; Kulikov, A.; Suslov, K.; Filippov, S. Consideration of Distinguishing Design Features of Gas-Turbine and Gas-Reciprocating Units in Design of Emergency Control Systems. Machines 2021, 9, 47. [Google Scholar] [CrossRef]
- Ilyushin, P.; Filippov, S.; Kulikov, A.; Suslov, K.; Karamov, D. Intelligent Control of the Energy Storage System for Reliable Operation of Gas-Fired Reciprocating Engine Plants in Systems of Power Supply to Industrial Facilities. Energies 2022, 15, 6333. [Google Scholar] [CrossRef]
- Kumar, A.; Deng, Y.; He, X.; Singh, A.R.; Kumar, P.; Bansal, R.C.; Bettayeb, M.; Ghenai, C.; Naidoo, R.M. Impact of demand side management approaches for the enhancement of voltage stability load ability and customer satisfaction index. Appl. Energy 2023, 339, 120949. [Google Scholar] [CrossRef]
- Poulek, V.; Aleš, Z.; Finsterle, T.; Libra, M.; Beránek, V.; Severová, L.; Belza, R.; Mrázek, J.; Kozelka, M.; Svoboda, R. Reliability characteristics of first-tier photovoltaic panels for agrivoltaic systems—Practical consequences. Int. Agrophysics 2024, 38, 383–391. [Google Scholar] [CrossRef]
- Yang, H.; Dong, Y.; Yang, Z. Emergency energy management of microgrid in industrial park based on robust optimization. Energy Eng. 2023, 120, 2917–2931. [Google Scholar] [CrossRef]
- Ilyushin, P.V.; Filippov, S.P. Under-frequency load shedding strategies for power districts with distributed generation. In Proceedings of the 2019 International Conference on Industrial Engineering, Applications and Manufacturing (ICIEAM), Sochi, Russia, 25–29 March 2019. [Google Scholar] [CrossRef]
- Lesnykh, V.; Timofeeva, T. Problems of Assessment of Economic Damage Caused by Power Supply Interruption on Example of Gas Industry Objects. In Proceedings of the 29th European Safety and Reliability Conference (ESREL), Hannover, Germany, 22–26 September 2019. [Google Scholar] [CrossRef]
- El-Bassiouny, A.; El-Shimy, M.; Hammouda, R. Impact of Power Transformer Failures on Customer Interruptions Costs Using Customer Damage Functions. In Proceedings of the 19th International Middle East Power Conference (MEPCON’19), Cairo, Egypt, 19–21 December 2017. [Google Scholar] [CrossRef]
- Çelık, D.; Meral, M.E.; Waseem, M. A New Area Towards to Digitalization of Energy Systems: Enables, Challenges and Solutions. In Proceedings of the 2022 14th International Conference on Electronics, Computers and Artificial Intelligence (ECAI), Ploiesti, Romania, 30 June–1 July 2022. [Google Scholar] [CrossRef]
- Zimnukhova, D.I.; Zubkova, G.A.; Morkovkin, D.E.; Stroev, P.V.; Gibadullin, A.A. Management and development of digital technologies in the electric power industry of Russia. J. Phys. Conf. Ser. 2019, 1399, 033097. [Google Scholar] [CrossRef]
- Radanliev, P.; De Roure, D.; Van Kleek, M.; Santos, O.; Ani, U. Artificial intelligence in cyber physical systems. AI Soc. 2021, 36, 783–796. [Google Scholar] [CrossRef]
- Chander, B.; Pal, S.; De, D.; Buyya, R. Artificial Intelligence-based Internet of Things for Industry 5.0. In Artificial Intelligence-based Internet of Things Systems. Internet of Things; Pal, S., De, D., Buyya, R., Eds.; Springer: Cham, Switzerland, 2022. [Google Scholar] [CrossRef]
- Huang, T.N. On Application of Artificial Intelligence in Electric Power Service Field. J. Phys. Conf. Ser. 2021, 1883, 012173. [Google Scholar] [CrossRef]
- Rakhmonov, I.U.; Ushakov, V.Y.; Khoshimov, F.A.; Niyozov, N.N.; Kurbonov, N.N.; Mytnikov, A.V. Methods of Estimation Electrical Power Consumption by Industrial Enterprises. In Electric Consumption by Industrial Enterprises. Power Systems; Springer: Cham, Switzerland, 2024. [Google Scholar] [CrossRef]
- Todorov, G.N.; Volkova, E.E.; Vlasov, A.I.; Nikitina, N.I. Modeling Energy-Efficient Consumption at Industrial Enterprises. Int. J. Energy Econ. Policy 2019, 9, 10–18. [Google Scholar] [CrossRef]
- Knežević, S.; Žarković, M. Artificial intelligence modeling for power system planning. Electr. Eng. 2024. [Google Scholar] [CrossRef]
- Bai, J.; Wang, J.; Ran, J.; Li, X.; Tu, C. An Improved Neural Network Algorithm for Energy Consumption Forecasting. Sustainability 2024, 16, 9332. [Google Scholar] [CrossRef]
- Hossain, N.; Hasan, M. The Impacts of Cyberattack on SMEs in the USA and Way to Accelerate Cybersecurity. Adv. Soc. Sci. Res. J. 2024, 11, 197–203. [Google Scholar] [CrossRef]
- Mtukushe, N.; Onaolapo, A.K.; Aluko, A.; Dorrell, D.G. Review of Cyberattack Implementation, Detection, and Mitigation Methods in Cyber-Physical Systems. Energies 2023, 16, 5206. [Google Scholar] [CrossRef]
- Sinchuk, O.N.; Kobeliatskyi, D.V. Modeling assessment of power consumption efficiency at iron ore mining enterprises. Appl. Asp. Inf. Technol. 2023, 6, 43–51. [Google Scholar] [CrossRef]
- Wang, P.; Bu, H.; Sun, H. The Impact of On-the-Job Consumption on the Sustainable Development of Enterprises. Sustainability 2021, 13, 13478. [Google Scholar] [CrossRef]
- Zhang, X. Analysis of Deep Peak Shaving Methods for Thermal Power Generation Units Based on the Improved Energy Consumption Framework. J. Electr. Syst. 2024, 20, 2026–2049. [Google Scholar] [CrossRef]
- Gao, L.; Li, J.; Zhang, L.; Hu, P. Exploration of Monte Carlo Method for Optimization of Energy Consumption in Industrial Enterprises in Energy Efficiency Diagnosis. Appl. Math. Nonlinear Sci. 2024, 9, 1–16. [Google Scholar] [CrossRef]
- Beridze, T. Efficiency of electricity consumption at mining enterprises taking emissions into account. J. Electr. Power Eng. 2024, 31, 33–39. [Google Scholar] [CrossRef]
- Epikhin, A.; Kukartseva, O.; Sergeevich, V.; Nguyen, V. Energy saving and energy efficiency assessment of a coal mining enterprise. Sustain. Dev. Mt. Territ. 2024, 16, 679–691. [Google Scholar] [CrossRef]
- Ushakov, V.Y.; Rakhmonov, I.; Niyozov, N.N.; Kurbonov, N.N. Forecasting electricity consumption by LSTM neural network. Bull. Tomsk. Polytech. Univ. Geo Assets Eng. 2023, 334, 125–133. [Google Scholar] [CrossRef]
- Wu, Q.; Ren, H.; Shi, S. Analysis and prediction of industrial energy consumption behavior based on big data and artificial intelligence. Energy Rep. 2023, 9, 395–402. [Google Scholar] [CrossRef]
- Isakov, A.; Muratov, K.; Kadirov, K.; Kushev, A. Characteristics of application of different time rates for electricity consumed in industrial enterprises. E3S Web Conf. 2023, 401, 05049. [Google Scholar] [CrossRef]
- Zhou, W.; Li, H.; Zhang, Z. A Novel Rolling and Fractional-ordered Grey System Model and Its Application for Predicting Industrial Electricity Consumption. J. Syst. Sci. Syst. Eng. 2024, 33, 207–231. [Google Scholar] [CrossRef]
- Xu, X.; Liu, Z.; Fang, D.; Cao, J.; Ma, H. Research and Implementation of Optimization and Promotion of Power Grid Emergency Command Center. SHS Web Conf. 2023, 162, 01046. [Google Scholar] [CrossRef]
- Shafai, B.; Li, C. Positive stabilization of singular systems by proportional derivative state feedback. In Proceedings of the 2017 IEEE Conference on Control Technology and Applications (CCTA), Maui, HI, USA, 27–30 August 2017; pp. 1140–1146. [Google Scholar] [CrossRef]
- Sheida, K.; Seyedi, M.; Afridi, M.A.; Ferdowsi, F.; Khattak, M.J. Resilient Control for Islanded Hybrid DC Microgrid Integrating Piezoelectric, Solar and Battery. In Proceedings of the 56th North American Power Symposium (NAPS), El Paso, TX, USA, 13–15 October 2024; pp. 1–6. [Google Scholar] [CrossRef]
- Baesmat, K.H.; Shiri, A. A new combined method for future energy forecasting in electrical networks. Int. Trans. Electr. Energy Syst. 2018, 29, e2749. [Google Scholar] [CrossRef]
- Baesmat, K.H.; Masoudipour, I.; Samet, H. Improving the Performance of Short-Term Load Forecast Using a Hybrid Artificial Neural Network and Artificial Bee Colony Algorithm. IEEE Can. J. Electr. Comput. Eng. 2021, 44, 275–282. [Google Scholar] [CrossRef]
- Yan, K.; Li, G.; Zhang, R.; Xu, Y. Frequency Control and Optimal Operation of Low-Inertia Power Systems with HVDC and Renewable Energy: A Review. IEEE Trans. Power Syst. 2024, 39, 4279–4295. [Google Scholar] [CrossRef]
- Ilyushin, P.V.; Shepovalova, O.V.; Filippov, S.P.; Nekrasov, A.A. The Effect of Complex Load on the Reliable Operation of Solar Photovoltaic and Wind Power Stations Integrated into Energy Systems and into Off-Grid Energy Areas. Energy Rep. 2022, 8, 1515–1529. [Google Scholar] [CrossRef]
- Alizade, R.; Nasibov, V. Operation modes of the power system of Azerbaijan under conditions of penetration of large volumes of RES. E3S Web Conf. 2024, 584, 01045. [Google Scholar] [CrossRef]
- Sekhar, N.; Kumaresan, N. Operation and control of a stand-alone power system with integrated multiple renewable energy sources. Wind. Eng. 2022, 46, 221–239. [Google Scholar] [CrossRef]
- Mohanty, A.; Ramasamy, A.K.; Verayiah, R.; Bastia, S.; Dash, S.S.; Cuce, E.; Khan, T.M.Y.; Soudagar, M.E.M. Power system resilience and strategies for a sustainable infrastructure: A review. Alex. Eng. J. 2024, 105, 261–279. [Google Scholar] [CrossRef]
- Al-Douri, A.; El-Halwagi, M.M.; Groth, K.M. Emergency shutdowns of propylene production plants: Root cause analysis and availability modeling. J. Loss Prev. Process Ind. 2022, 80, 104921. [Google Scholar] [CrossRef]
- Petroșanu, D.-M. Designing, Developing and Validating a Forecasting Method for the Month Ahead Hourly Electricity Consumption in the Case of Medium Industrial Consumers. Processes 2019, 7, 310. [Google Scholar] [CrossRef]
- Gifalli, A.; Amaral, H.L.M.d.; Bonini Neto, A.; de Souza, A.N.; Frühauf Hublard, A.v.; Carneiro, J.C.; Neto, F.T. Forecasting Electricity Consumption Using Function Fitting Artificial Neural Networks and Regression Methods. Appl. Syst. Innov. 2024, 7, 100. [Google Scholar] [CrossRef]
- Zhan, X.; Qian, X.; Liu, W.; Liu, X.; Chen, Y.; Zhang, L.; Hong, H.; Shen, Y.; Xiao, K. Predicting Industrial Electricity Consumption Using Industry–Geography Relationships: A Graph-Based Machine Learning Approach. Energies 2024, 17, 4296. [Google Scholar] [CrossRef]
- Niyozov, N.N.; Rikhsitillaev, B.K.; Jalilova, D.A.; Kuatbaev, P.M. Forecasting of electricity consumption by industrial enterprises with a continuous nature of production based on the principal component method (PCA). E3S Web Conf. 2023, 384, 01031. [Google Scholar] [CrossRef]
- Kultan, J.; Gaponenko, T.V.; Laamarti, Y.A.; Zhang, S.; Tiang, J. Enhancing the sustainability of energy networks through the utilization of smart consumers. E3S Web Conf. 2024, 535, 05006. [Google Scholar] [CrossRef]
- Jiang, Z.; Xing, Y. Load mitigation method for wind turbines during emergency shutdowns. Renew. Energy 2022, 185, 978–995. [Google Scholar] [CrossRef]
- Kostin, V.N.; Serikov, V.A.; Sherstennikova, I.A. Higher harmonics and limiting thereof in power supply systems of different voltages. IOP Conf. Ser. Earth Environ. Sci. 2019, 378, 012051. [Google Scholar] [CrossRef]
- Bashirov, M.; Yusupova, I.; Shvan, M.; Daminov, N.; Kuznetsov, K.; Sagitov, T. Development and research of an intelligent system for controlling the modes of power supply systems. E3S Web Conf. 2024, 494, 03007. [Google Scholar] [CrossRef]
- Kinev, E.; Tyapin, A.; Efimov, S.; Goncharov, K.; Kachan, V. Mode restrictions in the power supply system of industrial induction equipment. E3S Web Conf. 2024, 486, 07001. [Google Scholar] [CrossRef]
- Gvozdev, D.B.; Bolonov, V.O.; Konin, E.P.; Zdiruk, K.B.; Kuzminov, I.M. About the possibility of using digital twins in the management of electric power facilities. Electr. Transm. Distrib. 2019, 6, 30–35. [Google Scholar]
- Gurevich, Y.E.; Libova, L.E. Application of Mathematical Models of Electrical Load in Calculation of the Power Systems Stability and Reliability of Power Supply to Industrial Enterprises; ELEKS-KM: Moscow, Russia, 2008; 248p. (In Russian) [Google Scholar]
- Gurevich, Y.E.; Kabikov, K.V. Features of Power Supply, Focused on the Uninterrupted Operation of Industrial Consumers; ELEKS-KM: Moscow, Russia, 2005; 408p. (In Russian) [Google Scholar]
- Guoa, L.; Anb, C.; Huang, Y. Research on the construction of load management system for power supply guarantee target. E3S Web Conf. 2024, 565, 02009. [Google Scholar] [CrossRef]
- Dela Cruz, A.B.; De Guzman, R.A.M.; Diwa, B.J.E.; Buan, R.P.M.; Guanlao, R.I.; Tangcuangco, A.L.; Soriano, M.E.C. Design and Performance of a Solar-Powered Single-Phase Smart Energy Monitoring System. Asian J. Electr. Sci. 2024, 13, 1–9. [Google Scholar] [CrossRef]
- Papkov, B.V.; Osokin, V.L. Probabilistic and Statistical Methods for Assessing the Reliability of Elements and Systems of the Electric Power Industry: Theory, Examples, Tasks; TNT: Stary Oskol, Russia, 2017; 424p. (In Russian) [Google Scholar]
- Sviridov, V.V. Control in Complex Systems; Znanie: Moscow, Russia, 1978; 64p. [Google Scholar]
- Wentzel, E.S. Theory of Probability; Higher School: Moscow, Russia, 1999; 576p. [Google Scholar]
- Lesnykh, V.V.; Timofeyeva, T.B.; Petrov, V.S. Problems of the Assessment of Economic Damage Caused by Power Supply Interruption. Econ. Reg. 2017, 13, 847–858. [Google Scholar] [CrossRef]
- Elphick, S.; Knott, J.C.; Drury, G.; Langstaff, T.; Robinson, D.A. Quantifying the Economic Impact of Supply Voltage Magnitude on Consumers. Energies 2024, 17, 5590. [Google Scholar] [CrossRef]
- Gnatuk, V.; Kivchun, O.; Morozov, D.; Devi, G. Processing of Data on Power Consumption in the Management of Energy Resources of the Regional Electrical Complex. In Digital and Information Technologies in Economics and Management. DITEM 2023; Gibadullin, A., Ed.; Lecture Notes in Networks and Systems; Springer: Cham, Switzerland, 2024; Volume 942. [Google Scholar] [CrossRef]
- Mądziel, M.; Campisi, T. Energy Consumption of Electric Vehicles: Analysis of Selected Parameters Based on Created Database. Energies 2023, 16, 1437. [Google Scholar] [CrossRef]
- Ilyushin, P.V.; Kulikov, A.L.; Filippov, S.P. Adaptive algorithm for automated undervoltage protection of industrial power districts with distributed generation facilities. In Proceedings of the 2019 International Russian Automation Conference (RusAutoCon), Sochi, Russia, 8–14 September 2019. [Google Scholar] [CrossRef]
- Suslov, K.; Shushpanov, I.; Buryanina, N.; Ilyushin, P. Flexible power distribution networks: New opportunities and applications. In Proceedings of the 9th International Conference on Smart Cities and Green ICT Systems (SMARTGREENS), Prague, Czech Republic, 2–4 May 2020; Volume 1, pp. 57–64. [Google Scholar] [CrossRef]
- Sultanov, M.M.; Shamigulov, P.V.; Baydakova, N.V.; Ivanitsky, M.S.; Kuryanova, E.V.; Norov, D.S. Assessment of the level of reliability and safety based on the index of the technical condition of the equipment of energy systems. E3S Web Conf. 2023, 411, 01060. [Google Scholar] [CrossRef]
- Gumbel, E. Statistics of Extreme Values; Mir: Moscow, Russia, 1965; 451p. (In Russian) [Google Scholar]
- Kovalenko, I.N.; Kuznetsov, N.Y. Methods of Calculating Highly Reliable Systems; Radio and Communications: Moscow, Russia, 1988; 175p. (In Russian) [Google Scholar]
- Ilyushin, P.V.; Pazderin, A.V. Requirements for power stations islanding automation an influence of power grid parameters and loads. In Proceedings of the 2018 International Conference on Industrial Engineering, Applications and Manufacturing (ICIEAM), Moscow, Russia, 15–18 May 2018. [Google Scholar] [CrossRef]
- Ilyushin, P.; Volnyi, V.; Suslov, K.; Filippov, S. Review of Methods for Addressing Challenging Issues in the Operation of Protection Devices in Microgrids with Voltages of up to 1 kV that Integrates Distributed Energy Resources. Energies 2022, 15, 9186. [Google Scholar] [CrossRef]
- Khimenko, V.I. Emissions of Random Processes and the Problem of Crossing Levels; TECHNOSPHERE: Moscow, Russia, 2022; 582p. [Google Scholar]
- Gnedenko, B.V. Course of Probability Theory; Publishing House of LKI. URSS: Moscow, Russia, 2015. [Google Scholar]
- Xu, X.; Wu, Y.; Zeng, B. Forecasting short-term energy consumption in Chongqing using a novel grey Bernoulli model. Grey Syst. Theory Appl. 2024. [Google Scholar] [CrossRef]
- Ilyushin, P.; Filippov, S.; Kulikov, A.; Suslov, K.; Karamov, D. Specific Features of Operation of Distributed Generation Facilities Based on Gas Reciprocating Units in Internal Power Systems of Industrial Entities. Machines 2022, 10, 693. [Google Scholar] [CrossRef]
- Danylchenko, D.O.; Kuznetsov, D.S. Increase the efficiency of implementation and interaction of distributed generation with the local electric network. Electr. Eng. Power Eng. 2024, 2, 18–26. [Google Scholar] [CrossRef]
- Eroshenko, S.A.; Ilyushin, P.V. Features of implementing multi-parameter islanding protection in power districts with dis-tributed generation units. In Proceedings of the 2018 IEEE 59th International Scientific Conference on Power and Electrical Engineering of Riga Technical University (RTUCON), Riga, Latvia, 12–14 November 2018. [Google Scholar] [CrossRef]
- Golobokov, S.V.; Stepanova, K.A.; Brostilova, T.Y.; Kornilov, G.E. Electrical distributed generation for industrial power supply. IOP Conf. Ser. Earth Environ. Sci. 2021, 866, 012033. [Google Scholar] [CrossRef]


| B, kg | 1000 | 1100 | 1220 | 1350 |
| W, MWh | 5.6 | 6.6 | 7.0 | 7.8 |
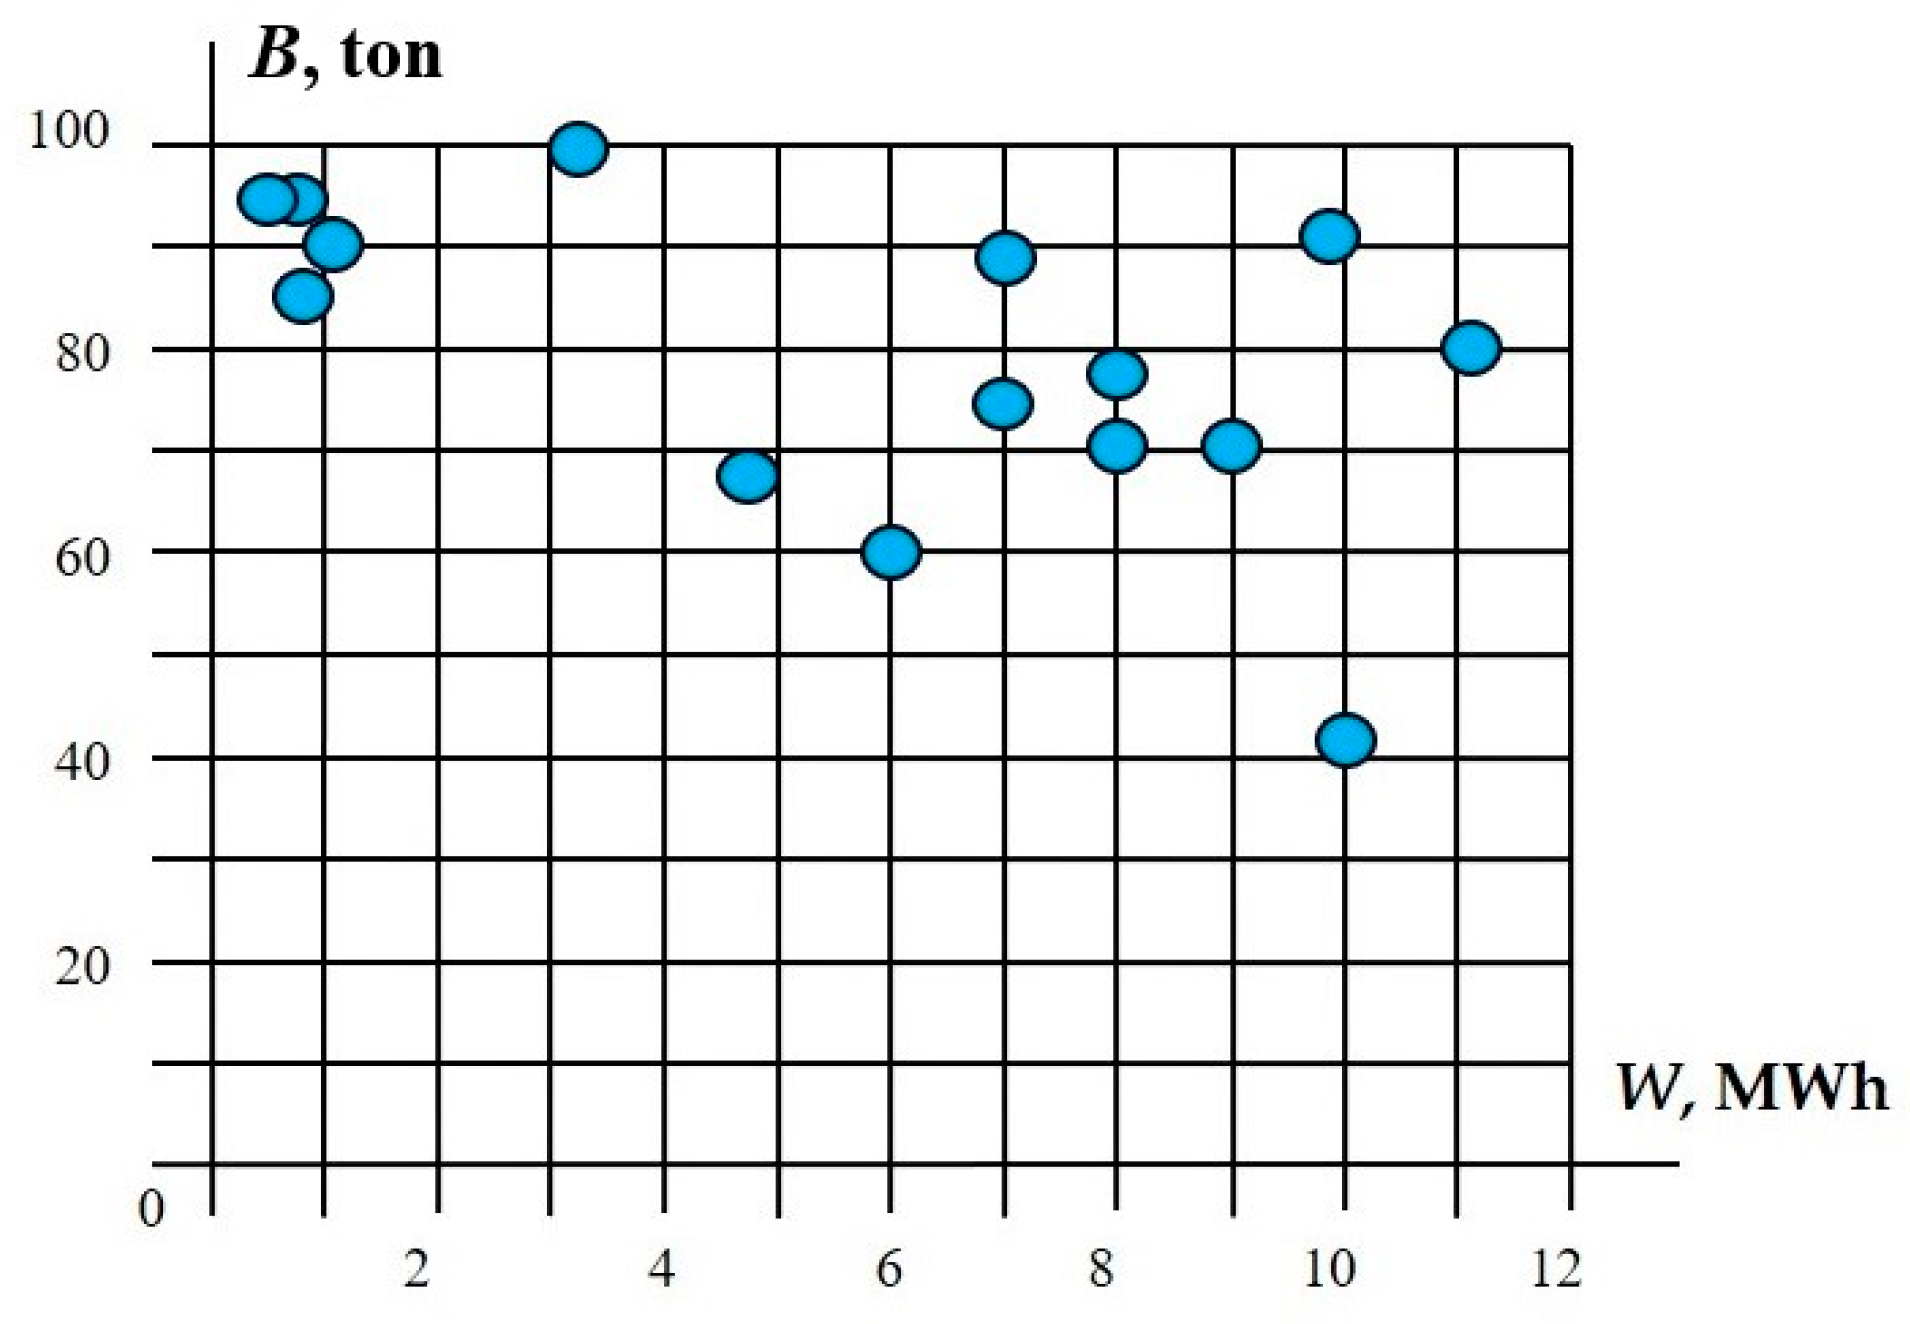
| № | B, ton | W, MWh | № | B, ton | W, MWh | № | B, ton | W, MWh |
|---|---|---|---|---|---|---|---|---|
| 1 | 70.3 | 7.9 | 6 | 98.4 | 0.8 | 11 | 81.9 | 11.2 |
| 2 | 85.0 | 0.9 | 7 | 59.2 | 6.0 | 12 | 97.1 | 0.5 |
| 3 | 100.0 | 3.7 | 8 | 86.8 | 7.2 | 13 | 68.2 | 4.6 |
| 4 | 78.1 | 8.1 | 9 | 70.1 | 8.8 | 14 | 92.1 | 9.7 |
| 5 | 77.9 | 6.9 | 10 | 42.2 | 10.2 | 15 | 91.2 | 1.0 |
Disclaimer/Publisher’s Note: The statements, opinions and data contained in all publications are solely those of the individual author(s) and contributor(s) and not of MDPI and/or the editor(s). MDPI and/or the editor(s) disclaim responsibility for any injury to people or property resulting from any ideas, methods, instructions or products referred to in the content. |
© 2025 by the authors. Licensee MDPI, Basel, Switzerland. This article is an open access article distributed under the terms and conditions of the Creative Commons Attribution (CC BY) license (https://creativecommons.org/licenses/by/4.0/).
Share and Cite
Ilyushin, P.; Papkov, B.; Kulikov, A.; Suslov, K. Algorithm and Methods for Analyzing Power Consumption Behavior of Industrial Enterprises Considering Process Characteristics. Algorithms 2025, 18, 49. https://doi.org/10.3390/a18010049
Ilyushin P, Papkov B, Kulikov A, Suslov K. Algorithm and Methods for Analyzing Power Consumption Behavior of Industrial Enterprises Considering Process Characteristics. Algorithms. 2025; 18(1):49. https://doi.org/10.3390/a18010049
Chicago/Turabian StyleIlyushin, Pavel, Boris Papkov, Aleksandr Kulikov, and Konstantin Suslov. 2025. "Algorithm and Methods for Analyzing Power Consumption Behavior of Industrial Enterprises Considering Process Characteristics" Algorithms 18, no. 1: 49. https://doi.org/10.3390/a18010049
APA StyleIlyushin, P., Papkov, B., Kulikov, A., & Suslov, K. (2025). Algorithm and Methods for Analyzing Power Consumption Behavior of Industrial Enterprises Considering Process Characteristics. Algorithms, 18(1), 49. https://doi.org/10.3390/a18010049