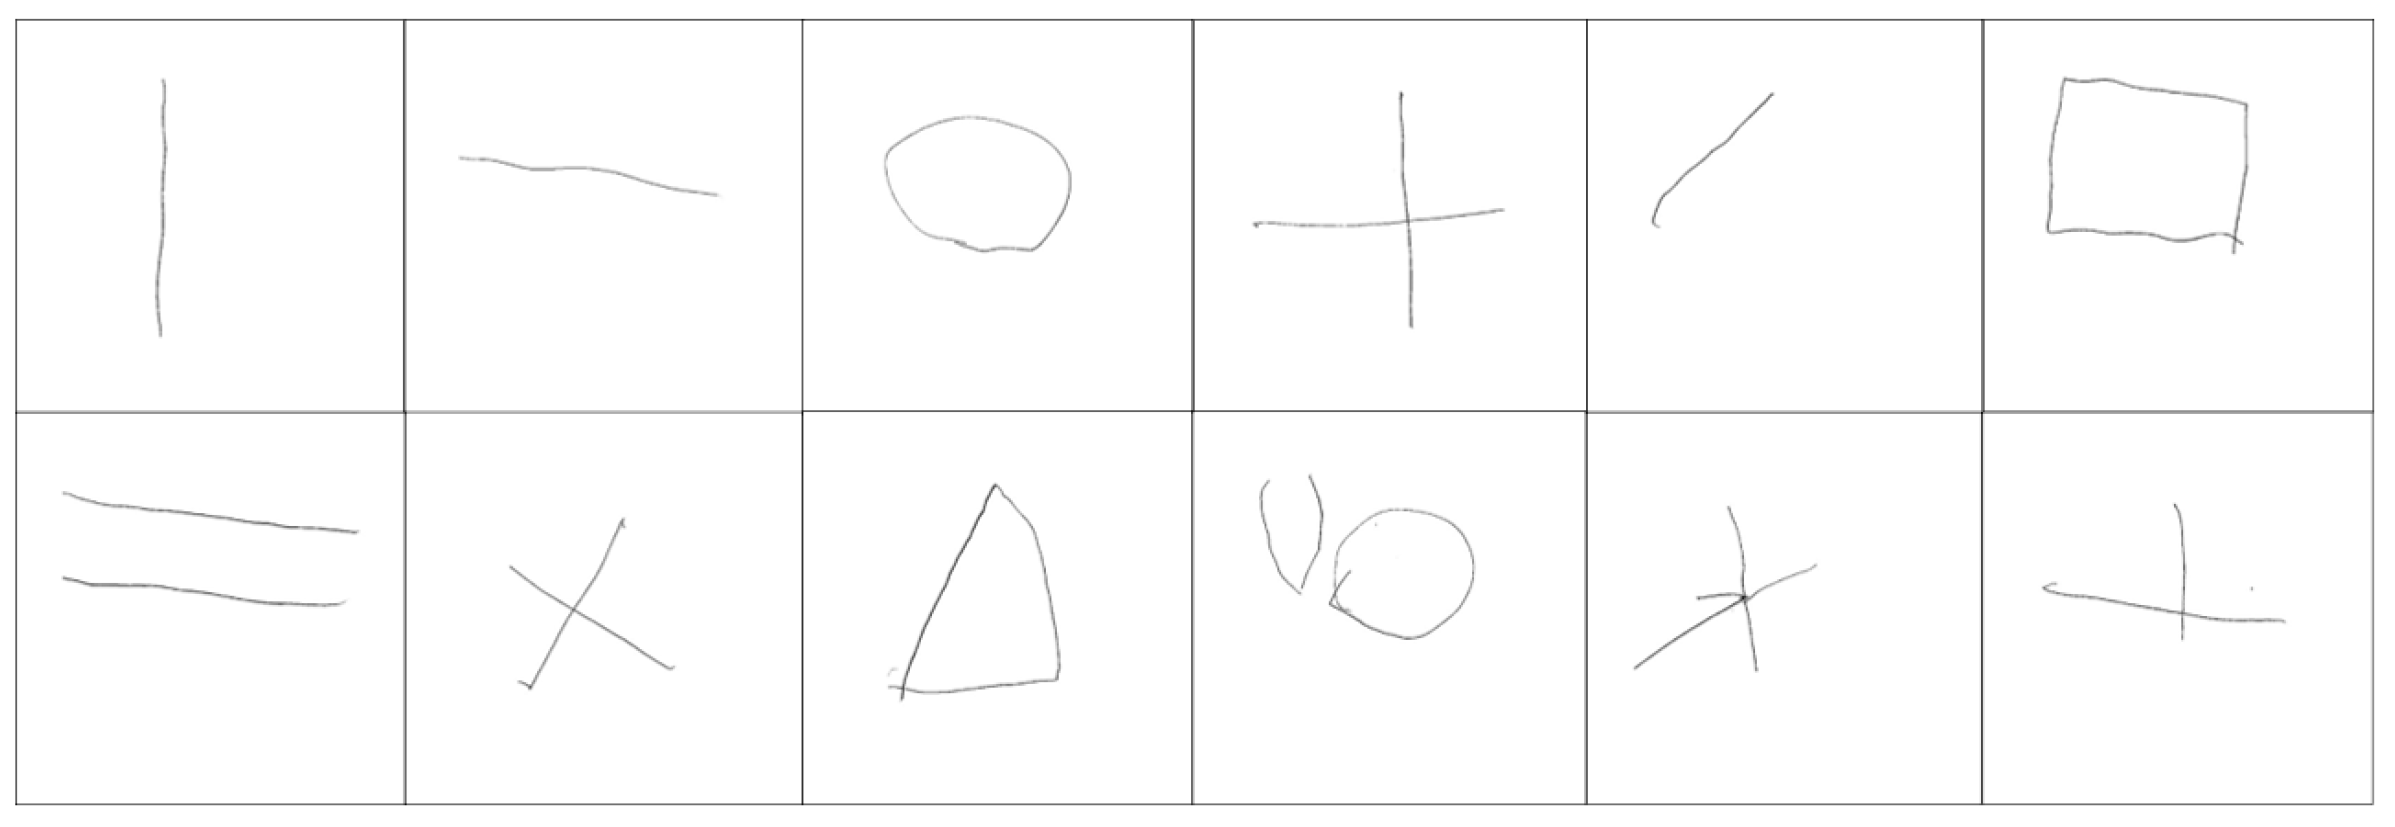
Abstract
In pediatric rehabilitation medicine, manual assessment methods for visual–motor integration result in inconsistent scoring standards. To address these issues, incorporating artificial intelligence (AI) technology is a feasible approach that can reduce time and improve accuracy. Existing research on visual–motor integration scoring has proposed a framework based on convolutional neural networks (CNNs) for the Beery–Buktenica developmental test of visual–motor integration. However, as the number of training questions increases, the accuracy of this framework significantly decreases. This paper proposes a new architecture to reduce the number of features, channels, and overall model complexity. The architectureoptimizes input features by concatenating question numbers with answer features and selecting appropriate channel ratios and optimizes the output vector by designing the task as a multi-class classification. This paper also proposes a model named improved DenseNet. After experimentation, DenseNet201 was identified as the most suitable pre-trained model for this task and was used as the backbone architecture for improved DenseNet. Additionally, new fully connected layers were added for feature extraction and classification, allowing for specialized feature learning. The architecture can provide reasons for unscored results based on prediction results and decoding rules, offering directions for children’s training. The final experimental results show that the proposed new architecture improves the accuracy of scoring 6 question graphics by 12.8% and 12 question graphics by 20.14% compared to the most relevant literature. The accuracy of the proposed new architecture surpasses the model frameworks of the most relevant literature, demonstrating the effectiveness of this approach in improving scoring accuracy and stability.
1. Introduction
Children’s development can be divided into gross motor skills and fine motor skills. Gross motor skills (such as running, throwing, and using a racket to hit a ball) play a crucial role in the development of perceptual and cognitive abilities [1]. Fine motor skills, on the other hand, are an important aspect of healthy development and can effectively predict school readiness. Research shows that there is a close relationship between fine motor control and later achievements (such as reading and writing skills) [2]. Visual–motor integration has a significant impact on children’s future writing abilities [3]. If visual–motor integration is insufficient, it may lead to difficulties in writing, which in turn affects learning performance [4]. From a developmental perspective, visual–motor integration is considered a prerequisite skill for learning to write [5].
Screening helps to identify potential problems early and provides treatment during the critical period to avoid negative impacts on children’s learning and development. To assess children’s visual–motor integration abilities, experts have developed assessment tools. By using these tools, professionals can determine if a child’s visual–motor integration ability meets the standards for their age, thereby providing early guidance and assistance, helping children overcome writing difficulties, intervening early in learning disabilities, and improving future learning performance [6].
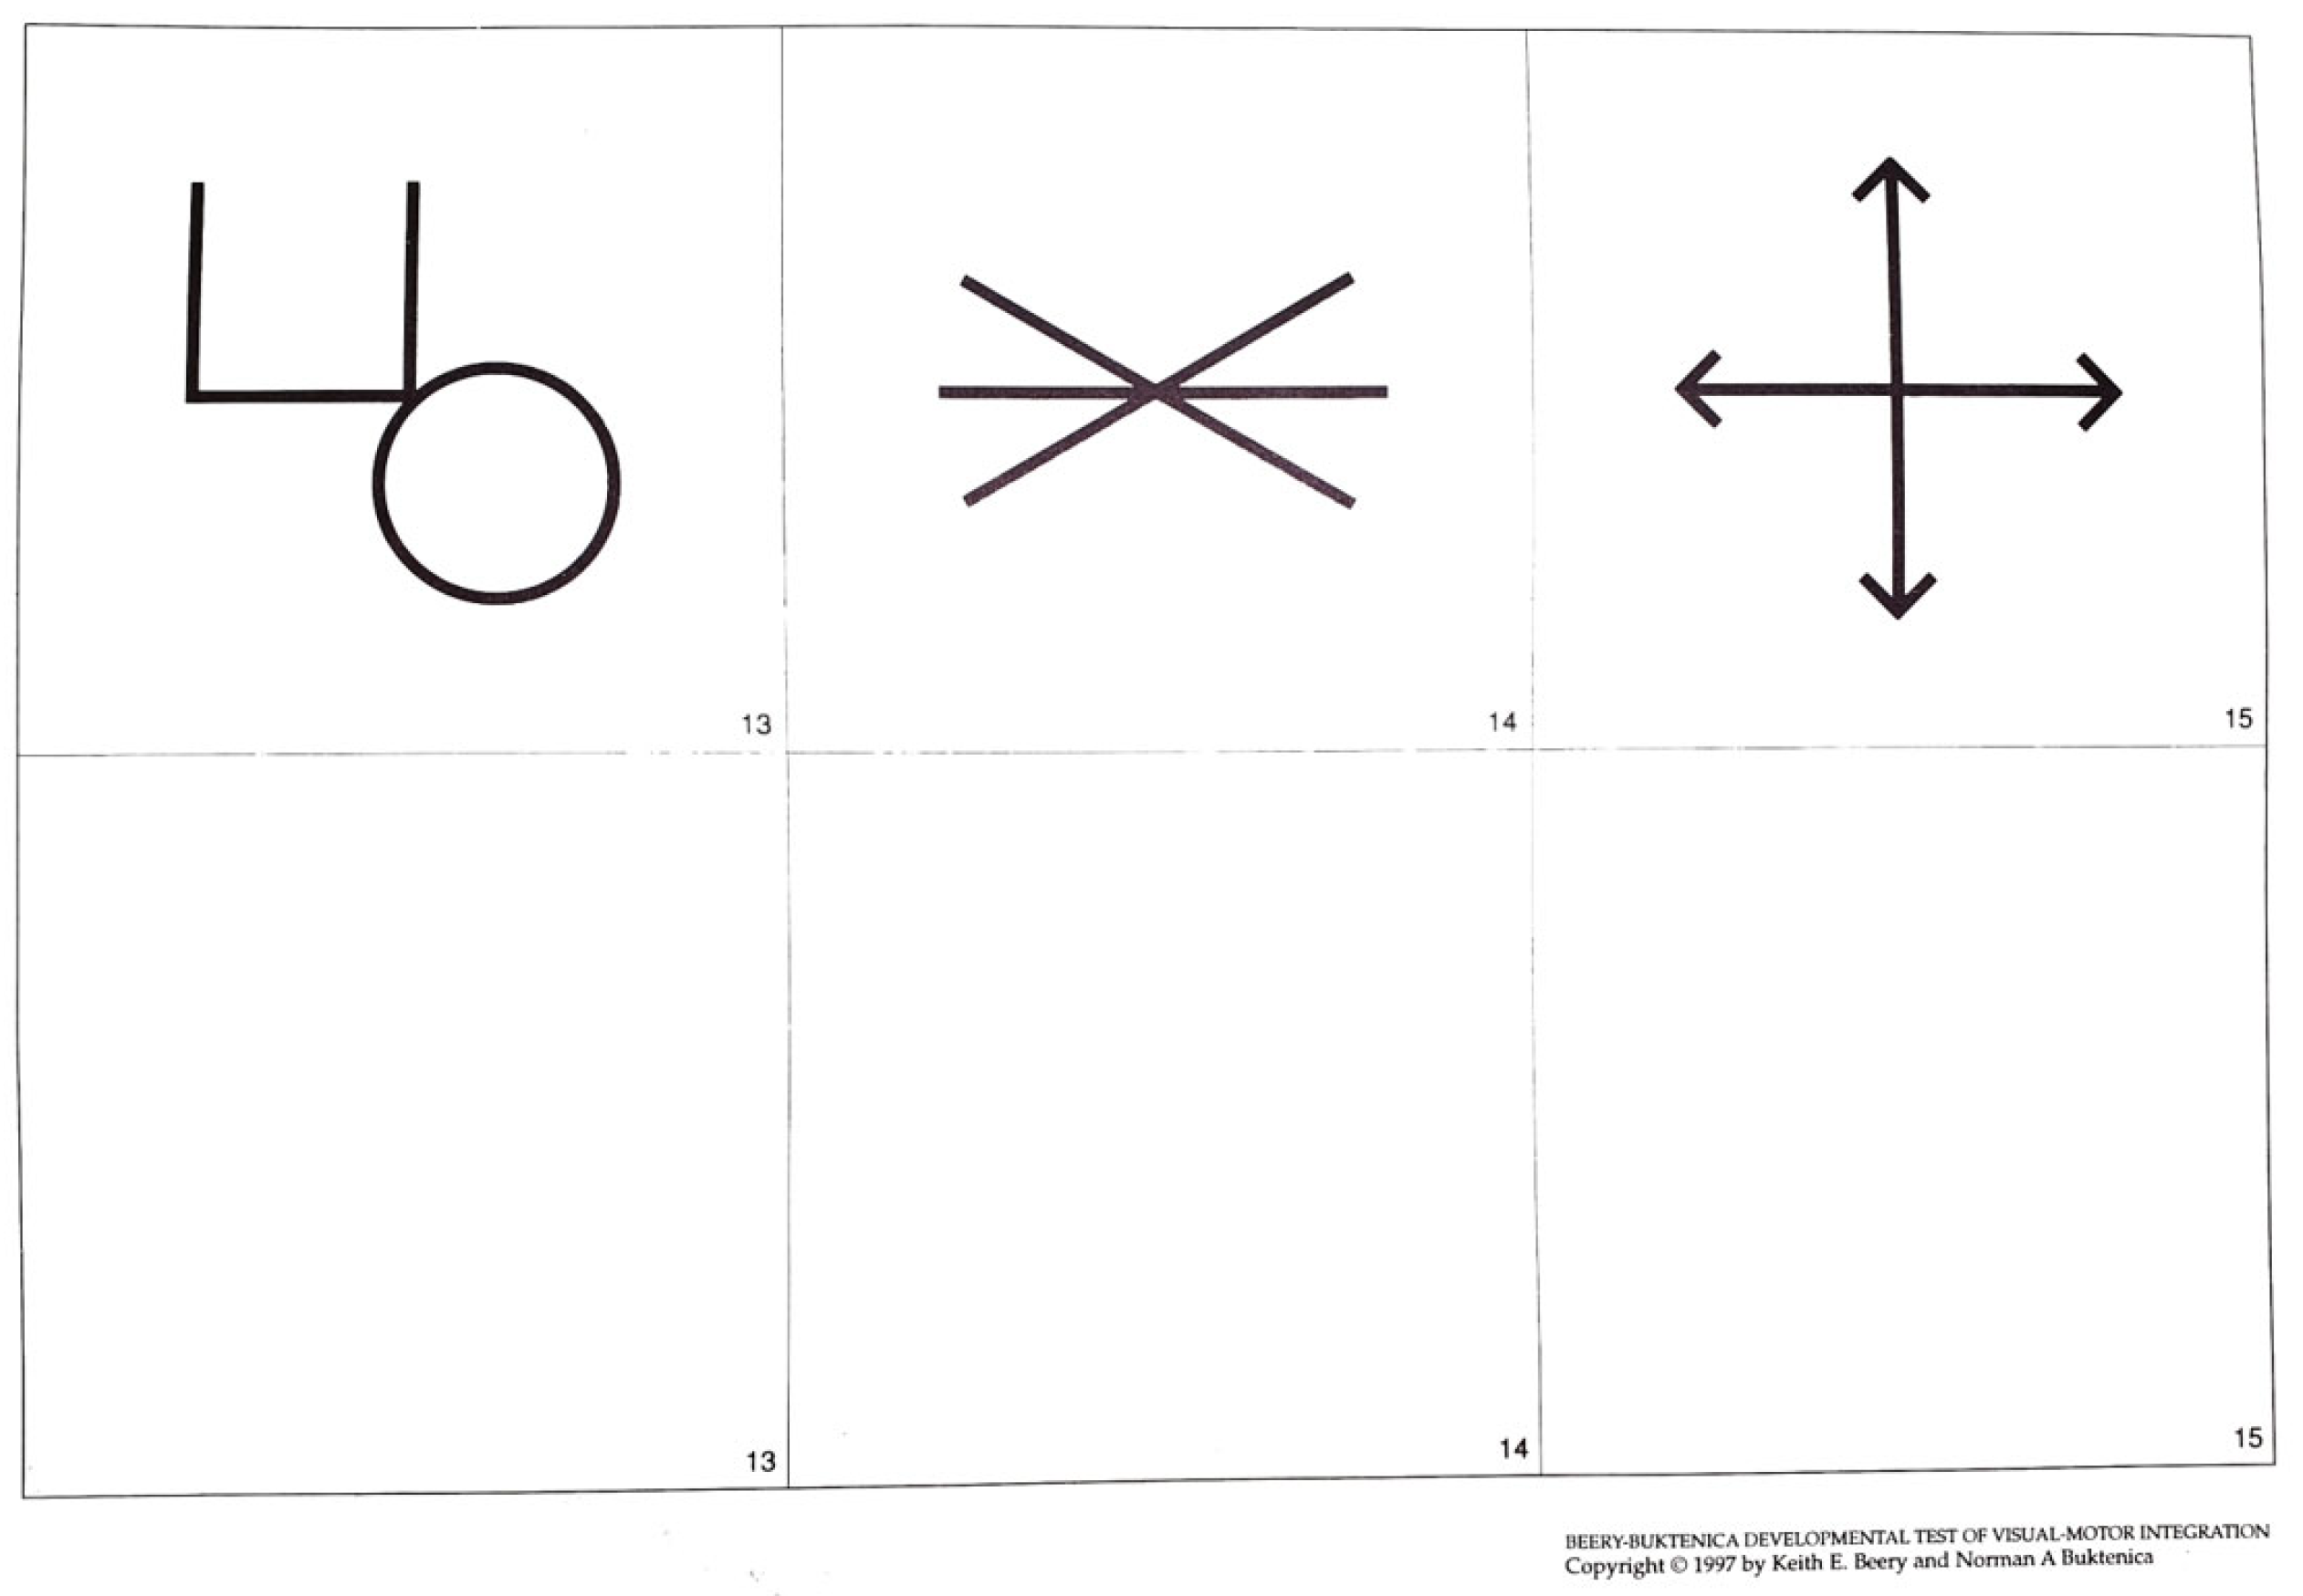
In the assessment of visual–motor integration abilities, the most commonly used tool is the Beery–Buktenica developmental test of visual–motor integration, abbreviated as VMI [7]. This test includes various graphic drawings, ranging from simple lines and circles to complex cubes and overlapping circles. The test form consists of six boxes, with each page displaying three graphic items at the top. Children need to draw the corresponding answer shapes in the area below. Figure 1 shows some of the graphics from the VMI test manual.
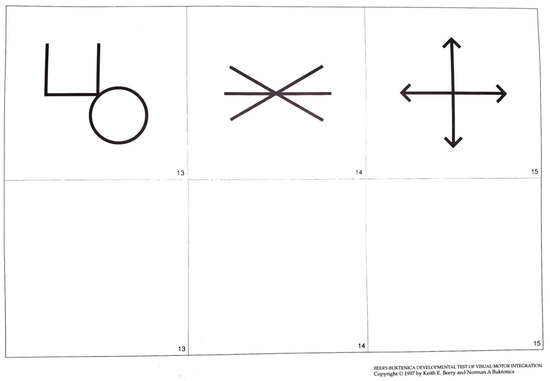
Figure 1.
Beery–Buktenica developmental test of visual–motor integration [7].
The VMI assessment is conducted through one-on-one or group testing by professionals such as occupational therapists or special education teachers. Professionals score each drawing according to the standards (rules) in the VMI scoring manual (0 or 1 point). The scoring method for the VMI test awards 1 point per question, for a total of 27 points. After three consecutive mistakes, no points are given for subsequent questions. The first three shapes (straight lines, horizontal lines, and shapes) are to be copied after observing a demonstration by a professional, and these scores are also included in the total score. The raw score has a maximum of 27 points. After calculating the raw score, it can be compared with age equivalents from the manual, and additionally, it can be converted to a standard score and then to a percentile score, which is used to determine if the child is developmentally delayed.
However, manual assessment methods have some drawbacks, such as time-consuming scoring processes. Conducting large-scale testing for an entire school would result in a significant workload for professionals. Therefore, large-scale screening has not been implemented, leading to some children with minor developmental delays who need help not being identified early. Additionally, while scoring is based on the VMI scoring manual’s rules, it still relies on subjective human judgment to determine adherence to the rules. The assessment manual cannot cover all possible situations to address real-world conditions, leading to potential discrepancies in scores given by different assessors. Even for the same professional, scoring standards may change with experience and tenure, causing issues with consistency. Therefore, there is a need to introduce artificial intelligence technology to assist in scoring to reduce the time required for assessment and improve scoring accuracy.
Currently, the most relevant literature on implementing AI for VMI scoring [8] proposes a convolutional neural network (CNN) [9] architecture. The paper connects the problem images with children’s drawings directly along the channel direction, uses the tanh function as the activation function at the output nodes, and designs it as a multi-label task, with results represented as 1, 0, or −1, indicating rule conformity, non-conformity, or no such rule, respectively. This method results in excessive parameters and high model complexity, affecting training and inference efficiency. Moreover, as the number of questions increases (from six to twelve), the accuracy of this method significantly decreases, making it difficult to apply in practical testing scenarios and limiting its practicality and widespread application. Considering that the accuracy of standardized assessment tools is a key factor for clinical application, this paper focuses on addressing these issues through in-depth design and exploration. By improving existing methods, this paper aims to enhance the scoring accuracy for the same number of questions to achieve more accurate VMI assessment results, thereby improving its reliability and applicability in real-world scenarios.
Our main contribution is the proposal of a new architecture. The new architecture optimizes input features by concatenating the problem number and answers and selecting appropriate channel ratios. Additionally, it optimizes output vectors by designing the task as a multi-class classification problem. In addition to optimizing input and output vectors, this paper also proposes improved DenseNet. This involves selecting the pre-trained DenseNet201 [10] model, which is more suitable for this task, as the backbone architecture through experiments and adding a new fully connected layer for feature extraction and classification, using softmax instead of tanh as the final activation function. This new architecture effectively avoids overfitting, reduces the complexity of output vectors, and improves accuracy. The results indicate that the proposed architecture and improved DenseNet in this paper outperform existing methods in terms of accuracy as the number of questions increases.
The rest of this paper is organized as follows: Section 2 describes the current state of research on AI applications in child development assessment. Then, Section 3 describes the new architecture proposed in this paper. Next, Section 4 presents the experimental results. Finally, Section 5 provides the conclusion.
2. Related Work
In the application of AI for observing gross motor development, Trost et al. [11] used artificial neural networks (ANNs) to determine adolescent activity types and energy expenditure. The test included five types of physical activities: sedentary, walking, running, light household activities or games, and moderate to vigorous games or sports. De Vries et al. [12] had children perform activities in an outdoor environment such as sitting, standing, walking, running, skipping rope, kicking a soccer ball, and riding a bicycle. They primarily used ANN based on single-axis or tri-axial accelerometer data to identify children’s physical activity types to improve accuracy in recognizing children’s movements.
In the application of AI for standardized assessment of gross motor development, Suzuki et al. [1] noted that personal differences among raters could lead to differences in the assessment results of test subjects. This study used the standardized assessment tool test of gross motor development-3 (TGMD-3) as the experimental target. TGMD-3 assesses 13 basic motor skills, divided into two subscales: locomotion skills (e.g., running and jumping) and ball skills (e.g., kicking and throwing). A new CNN-based deep learning network was proposed to perform both gross motor classification and assessment simultaneously.
In the application of AI for observing fine motor development, Rodríguez et al. [13] used augmented reality (AR) materials to allow children to interact via gesture control devices. The study aimed to use AI to interpret children’s movements in AR, experimenting with various AI image recognition methods such as CNN, K-NN, support vector machine (SVM), and decision tree (DT) to provide a mechanism for evaluating and giving feedback on children’s performance in AR educational materials, ensuring that the motor skills learned through these AR materials are properly developed.
In the application of AI for standardized assessment of fine motor development, Strikas et al. [6] used a CNN model to propose a new framework for evaluating fine motor skills of students in Greek public kindergartens. The study was based on the Griffiths Scales No. II children’s development scale and only used subtest D (eye–hand coordination) in the scale, specifically the drawing person test, which classifies drawings into six levels. The study utilized the developed deep learning model to categorize children’s drawings into these six levels. The proposed model could assist teachers and parents in classifying specific drawing results. In the field of child psychology, there is some literature applying CNNs to the scoring of children’s drawings, for example, the bender gestalt visual–motor test (BGT). Moetesum et al. [14] used VGG-16 as a pre-trained model with a transfer learning backbone architecture. Several years later, they further employed ResNet101 as the backbone architecture for transfer learning [15]. Ruiz Vazquez et al. [16] similarly applied CNNs to develop a new CNN model architecture for BGT scoring rules and used transfer learning. Zeeshan et al. [17] applied a CNN architecture fine-tuned twice to the scoring items of the draw-A-person (DAP) test.
In the scope of fine motor skills, visual–motor integration refers to the ability to coordinate the eyes and hands to perform operations in a stable and efficient manner. This ability is crucial for children’s future academic development. Relevant research on this ability is as follows:
Kim et al. [18] collected drawings from 20 children, including preschoolers and elementary school students, using a tablet. Children drew numbers (i.e., 0–9) and letters (i.e., A–F) with a digital pen on the tablet. A random forest classifier was used to classify the children’s ages. A total of 130 feature sets were analyzed, achieving an accuracy of about 82%, but the ability to correctly draw angles and curves was overlooked. Polsley et al. [2] expanded on Kim et al.’s [18] work by adding features focused on curve and angle recognition. They classified children’s digit sketches on a tablet into mature or immature categories using a random forest. The final results showed better classification accuracy with the random forest, with accuracy rates of 85.7% for curves and 80.6% for angles. Polsley et al.’s [2] task, however, lacked standardized tools with normative research and fixed testing processes, making it impossible to apply results to different regions or countries or to clearly define cutoff scores for identifying children with borderline or delayed developmental abilities.
Lee [8] conducted the most relevant research for this study. The goal was to apply AI to evaluate visual–motor integration using the most common standardized assessment tool, VMI. A new CNN-based model was proposed to learn the rules of these assessment tools and to apply them to VMI scoring while also explaining the scoring comments and results. The model consists of two stages: Stage one involved inputting the children’s drawn answer images and the images of the test items from the manual through two separate CNNs, each producing two feature maps. Stage one also involved experimenting with the CNN architecture to see if incorporating residual modules improved feature extraction performance for this task. The two feature maps were combined through subtraction or concatenation to form a single feature map for input into stage two. Stage two CNN performs classification to predict if the scoring criteria are met. The output nodes used multi-label output, with six nodes corresponding to the maximum of six rules. The tanh function was used as the activation function, outputting values from 1 to −1. Outputs of 1 and −1 represented scores of 1 and 0, respectively, with the remaining nodes set to 0 if the standard was less than 6. The final experimental results showed that using residual modules and concatenation for scoring six types of items achieved the best performance with an accuracy of 82.26%, but accuracy decreased to 69.7% when the task was extended to twelve items.
Based on the literature review, the most relevant study is Lee’s [8] 2022 research on AI applications for VMI scoring. This study’s framework showed significant limitations when handling more items. Considering that the accuracy of standardized assessment tools is a key factor for clinical applicability, this paper will use the most relevant literature as a starting point for in-depth design and exploration. By proposing an improved new framework, this paper aims to enhance the accuracy of scoring for the same number of items to achieve more accurate VMI assessment results and improve its reliability and applicability in practical use.
3. Method
3.1. Dataset and Data Preparation
The dataset used in this study was provided by the Occupational Therapy Department of National Taiwan University. This dataset contains hand-drawn sketch data from preschool children aged 3 to 6 years old and includes 12 types of drawings from the Beery VMI test. Each hand-drawn answer is saved as an image, totaling 8610 images of children’s hand-drawn answers. The distribution of these images across categories is uneven, depending on the difficulty of the different shapes. For example, drawing straight lines is relatively simple for most children, so the number of images with “incorrect straight lines” is much smaller compared to the number of images with “correct straight lines”. A task is classified into different categories based on the number of rules met. For instance, if a task has N rules, it will have N + 1 categories (meeting 0 to N conditions). Overall, the data distribution among different categories is imbalanced. According to the classification of error rules, the category with the fewest original images has 16 images, while the category with the most has 800 images, resulting in a 50-fold difference. Therefore, it is necessary to balance the data volume for each category through data augmentation methods.
To augment the data for each category, this study employs computer vision techniques (OpenCV), including rotation, stretching, scaling, and skewing. It is important to note that rules impose significant restrictions on shape variations. For example, when using rotation for augmentation, it must be considered that some tasks will not be scored if horizontal lines form an angle greater than 15 degrees with the horizontal axis, while other tasks can be rotated arbitrarily without concern for the angle. When extending or shortening length, it must be ensured that some rules stipulate that line lengths must not be less than 1/16 inch. Additionally, shape distortions will change the aspect ratio, so it is important to adhere to rules that restrict the aspect ratio to less than 2:1. Furthermore, OpenCV was used to supplement parts of the drawings that were not completed according to the rules. Through these methods, a dataset of 20,365 images was ultimately generated. When separating training and validation datasets, 1/10 of the original images was randomly selected as the validation dataset. The selected validation data were not included in the training dataset, and the training dataset does not contain any augmented data based on images selected for the validation set. Augmented data were used exclusively for the training dataset and were not included in the validation dataset.
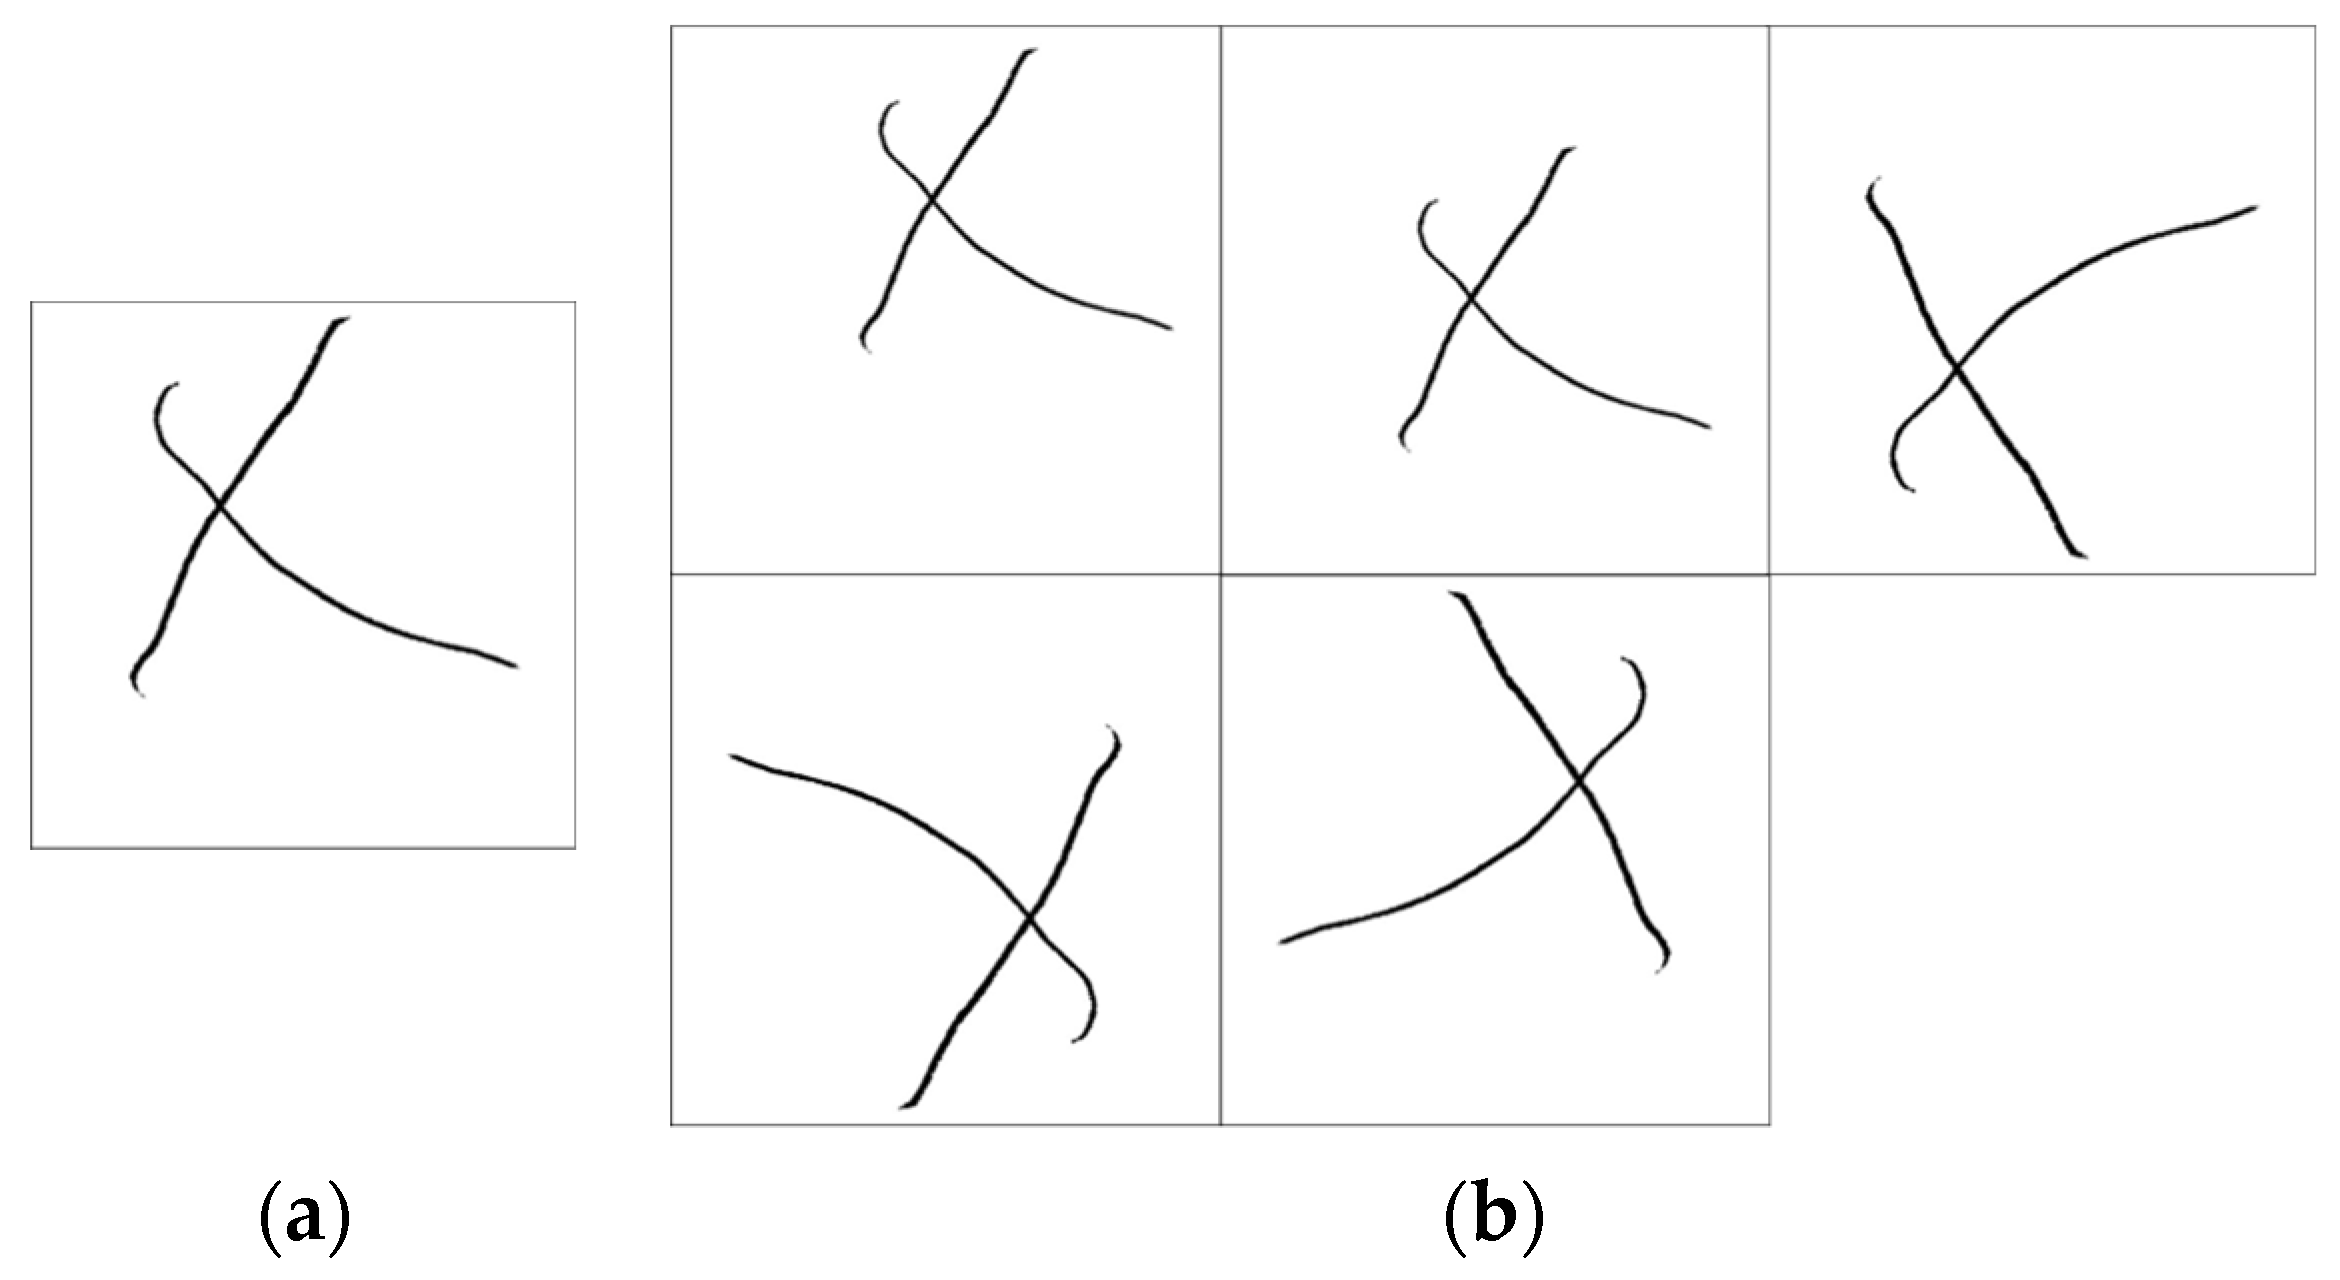
The children’s hand-drawn answers were scanned into PDF files and underwent a series of processing steps, including segmentation, cropping, binarization, denoising, and compression, and were ultimately saved at a resolution of 500 × 500 pixels. During training, these images were resized to 224 × 224 pixels to meet the model’s input requirements. After inputting at 224 × 224 pixels, the pixels were not adjusted during channel slicing and combining, so the final channels remained at 224 × 224. Figure 2 uses question 11 as an example to show the difference between an image before and after augmentation.
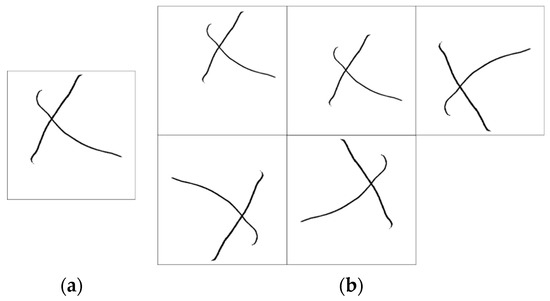
Figure 2.
Question 11. (a) Before augmentation after processing and (b) after augmentation.
3.2. System Architecture
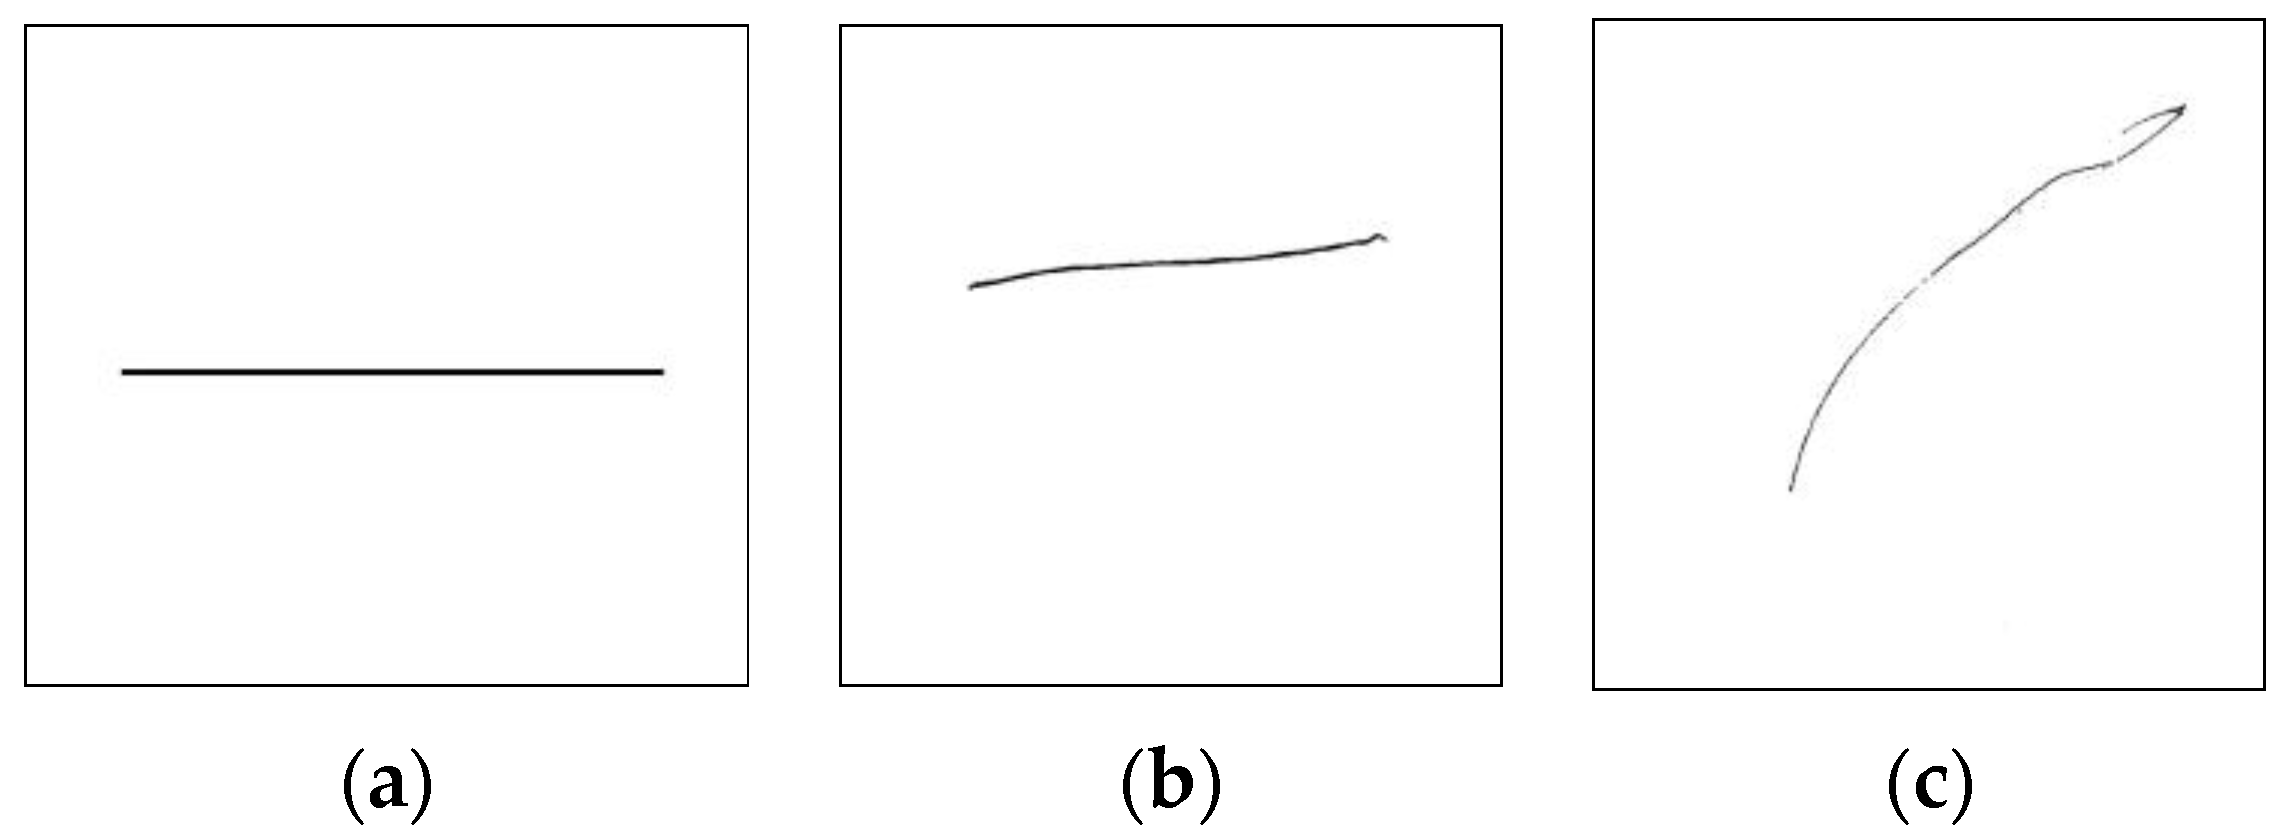
The new architecture implemented in this study is described as follows: By selecting appropriate channel ratios, the task numbers and answer features are concatenated to form input feature maps, thereby optimizing the task’s input channel and feature structure. This design improves the efficiency and accuracy of data processing, ensuring the stability and reliability of subsequent analysis processes. Next, the improved DenseNet proposed in this study is used as the classifier for the task. The improved DenseNet is based on the pre-trained DenseNet201 model, which was experimentally selected as a suitable backbone architecture for this task, with a new fully connected layer added for feature extraction and classification. Softmax is chosen over tanh as the activation function to further enhance the model’s performance and stability. Additionally, the task is designed as a multi-class classification to optimize the structure of the output vector, reducing the complexity of the output vector and improving accuracy. Moreover, to achieve the goal of clinical application, an AI scoring system application software with a user interface was implemented. The model’s prediction results are imported into a scoring rule decoding system, which decodes and identifies errors in the answers based on a set of rules. According to the rules in the scoring manual, all results are summed and the raw scores are calculated. As an example, the rule for question 2 is that the horizontal line should be more than half and the vertical line should not exceed 30°. Figure 3 uses question 2 as an example to show answers that satisfy and do not satisfy the rule. Subsequently, the system performs norm referencing to convert the raw scores into standard scores and achievement levels and finally displays the detailed results and performance of the children in the VMI scoring test. This entire process ensures the accuracy and fairness of the scoring, making the final results reliable and valuable for reference. The following section provides a detailed description of how the architecture is integrated through the experimental content of each stage. Figure 4 is the new architecture proposed in this paper.
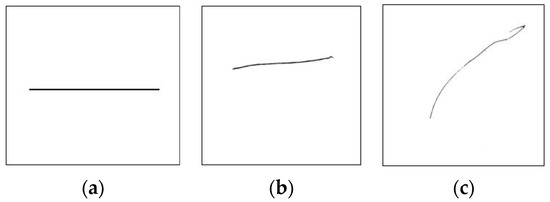
Figure 3.
(a) Question 2 prompt (b) satisfies the rule and (c) does not satisfy the rule.

Figure 4.
Proposed architecture.
4. Experiments
4.1. Selection of Pre-Trained Backbone Architectures
When dealing with classification problems with relatively small amounts of data, using pre-trained convolutional neural network (CNN) backbone architectures to enhance model performance is an effective strategy. We selected four different pre-trained models for experimentation: ResNet50, ResNet101, DenseNet201, and InceptionResNetV2 [19]. The reason for choosing these four models lies in their varying depth and architectural characteristics, which provide diverse feature extraction capabilities. These models have all been pre-trained on the ImageNet dataset [20], which includes a large number of images such as strawberries, balloons, and dogs covering a wide range of object types. The pre-trained models, having undergone initial training with this rich image data, possess strong feature extraction abilities that are crucial for the specific tasks in this study.
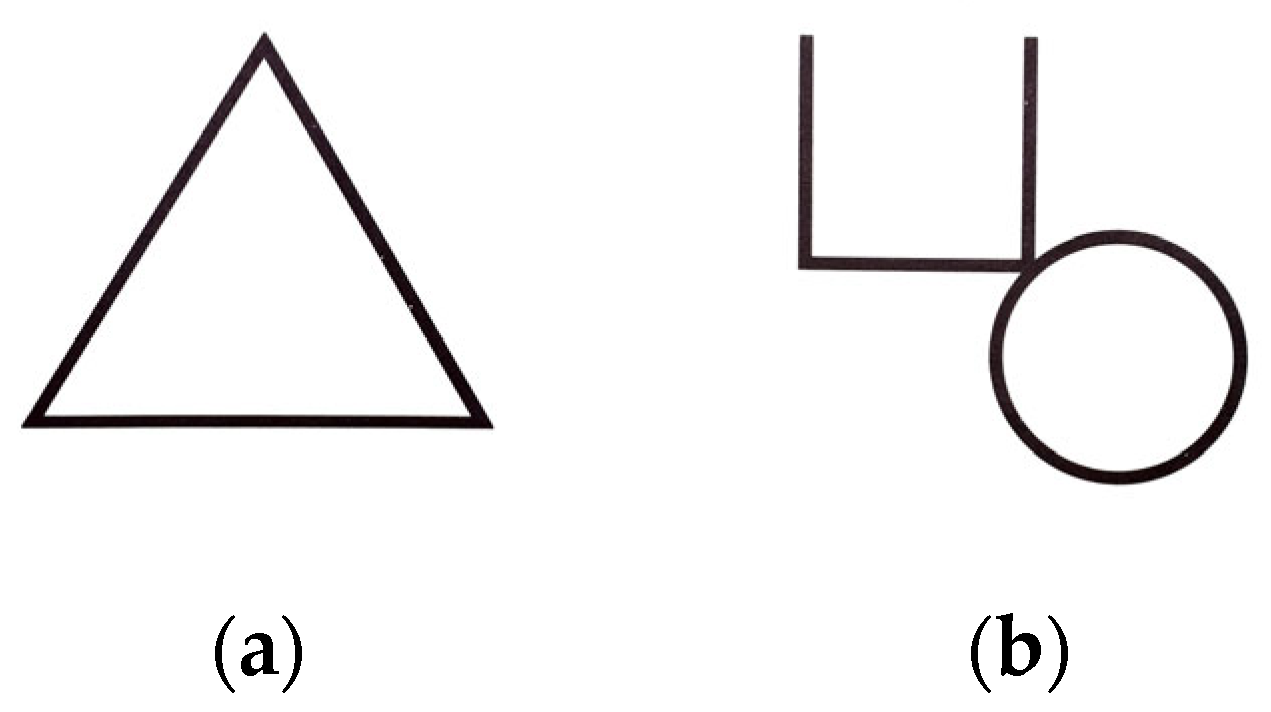
As shown in Figure 5, we initially used questions 12 and 13, which have complex scoring rules, from the datasets as inputs for the pre-trained models in the experiment. We froze 97% of the network layers of the selected pre-trained models and added a new connection layer, then fine-tuned these pre-trained models and performed the prediction tasks. From the results, we observed which pre-trained model performed better and had higher accuracy for this task, indicating a better fit for this type of task. The pre-trained model with the highest accuracy was selected as the backbone architecture for the next phase of the experiment.
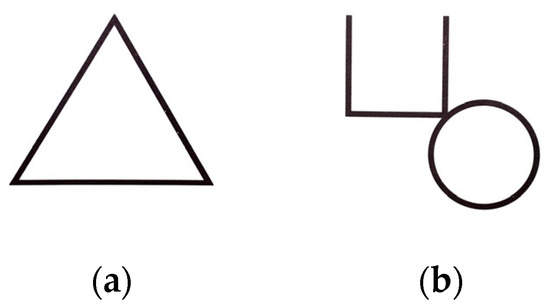
Figure 5.
Illustration of VMI. (a) Question 12 and (b) Question 13 [7].
4.2. Optimizing Input Features
In this phase of the experiment, the aim is to reduce the number of input channels and data complexity by replacing the original question images with question numbers. This optimization design aims to maintain model performance and improve accuracy as the number of scoring questions increases. The input for training is designed as a four-dimensional data array with the structure batch size, height, width, and channels.
The experiment consists of different combinations of four data sources: zero arrays, question number arrays, question images, and answer images. The goal is to evaluate the impact of different input combinations on model performance. For the questions, straight-line images from question 1 (same as question 4) are used. The objectives are to observe the following:
- To observe if using a zero array as a baseline channel reduces interference and enhances the model’s focus on hand-drawn answer images and question images.
- To observe if repeating the hand-drawn answer image information strengthens the model’s learning of answer image features, thereby improving classification accuracy.
- To observe if simplifying question images to numbers reduces data complexity and assesses the impact of such simplification on model performance.
- To observe if repeating the same data can enhance the information from hand-drawn answer images while simplifying the complexity of question inputs.
By comparing and analyzing the effects of different input combinations on model performance, the optimal input optimization strategy can be identified to improve model accuracy and stability in multi-question scoring situations. The combination structure is shown in Table 1.

Table 1.
Channels and data combinations.
4.3. Optimizing Output Vectors
We designed the task as a multi-class classification problem, where the number of classes is determined based on the combinations of rules satisfied. Although the number of classes increases with the number of questions, each image will ultimately have only one predicted class with the highest probability to reduce the complexity of the output vector and improve accuracy. This study adopts 12 questions, with the current task subdivided into 34 classes, representing different question numbers and rules satisfied.
4.4. Optimizing and Training the Model
The model training experiment is divided into two stages, including modifications to the model architecture and improvements in classification efficiency. The details of each experimental stage are described as follows:
4.4.1. Training the Improved DenseNet Classifier
We propose an improved DenseNet model, termed improved DenseNet, aimed at enhancing the model’s adaptability and performance for specific classification tasks. DenseNet201 was chosen as the base backbone architecture due to its excellent performance in previous experiments. We made a series of improvements and adjustments to better meet our needs.
First, we removed the original fully connected top layer of DenseNet201 and introduced a new Global Average Pooling (GAP) 2D layer, which reduces the dimensionality of feature maps to two dimensions, facilitating a more efficient feature extraction process. Additionally, we added two new fully connected layers with 1024 and 256 neurons, respectively, using the ReLU activation function. These designs are intended to enhance the model’s non-linear processing capabilities, thus improving learning and prediction efficiency. Finally, the model’s output layer uses the Softmax activation function to convert output values into probabilities between 0 and 1, ensuring that the sum of probabilities for all labels is 1 for multi-class classification.
During the model training process, we performed gradual fine-tuning, progressively unfreezing the backbone architecture’s parameters to enhance the model’s adaptability and performance for this task. These improvements and adjustments enable improved DenseNet to handle complex multi-class classification tasks more effectively, achieving higher levels of accuracy and stability. These measures are expected to significantly improve the model’s performance in practical applications, providing a foundation for future research and applications.
4.4.2. Improved DenseNet Feature Extraction Combined with Machine Learning Classification
To further enhance classification speed, this study utilizes features extracted by the feature extractor trained in the previous phase and employs a traditional machine learning classifier based on stochastic gradient descent (SGD) for training. We compared the accuracy and training time of this approach. The core of this process lies in obtaining high-quality feature representations through the optimized feature extractor and then using these features to train a more efficient classifier. Compared to deep learning models, traditional machine learning classifiers have faster training speeds, so we aim to significantly reduce the model training time while maintaining accuracy.
Support vector machine (SVM) is a supervised learning model that can effectively perform classification tasks. In the standard SVM training process, methods such as sequential minimal optimization (SMO) [21] are commonly used to solve this quadratic optimization problem. However, the SMO method can result in excessively long training times when dealing with large datasets [22]. In big data analysis, combining the use of stochastic gradient descent (SGD with hinge loss) to train SVMs with hinge loss can achieve better training speed while maintaining good classification performance [23]. Gradient descent is used in the process of finding the minimum and updating weights. This makes SGD an effective tool for training SVMs and other deep learning models, and it is widely applied in various machine learning tasks. Therefore, this paper uses SGD as the traditional machine learning classifier.
The feature extractor from the previous phase of experiments, which underwent pre-training and fine-tuning with deep learning models, possesses strong feature extraction capabilities. This experiment uses these extracted features to train an SGD-based classifier and compares the results with those from the original deep learning model. SGD classifiers are widely used in traditional machine learning due to their high computational efficiency and fast convergence [23]. Thus, using an SGD classifier with fixed features can significantly improve training speed. Training time and accuracy were recorded during the experiment and analyzed for comparison.
4.5. Implementation of AI Assessment and Scoring Application
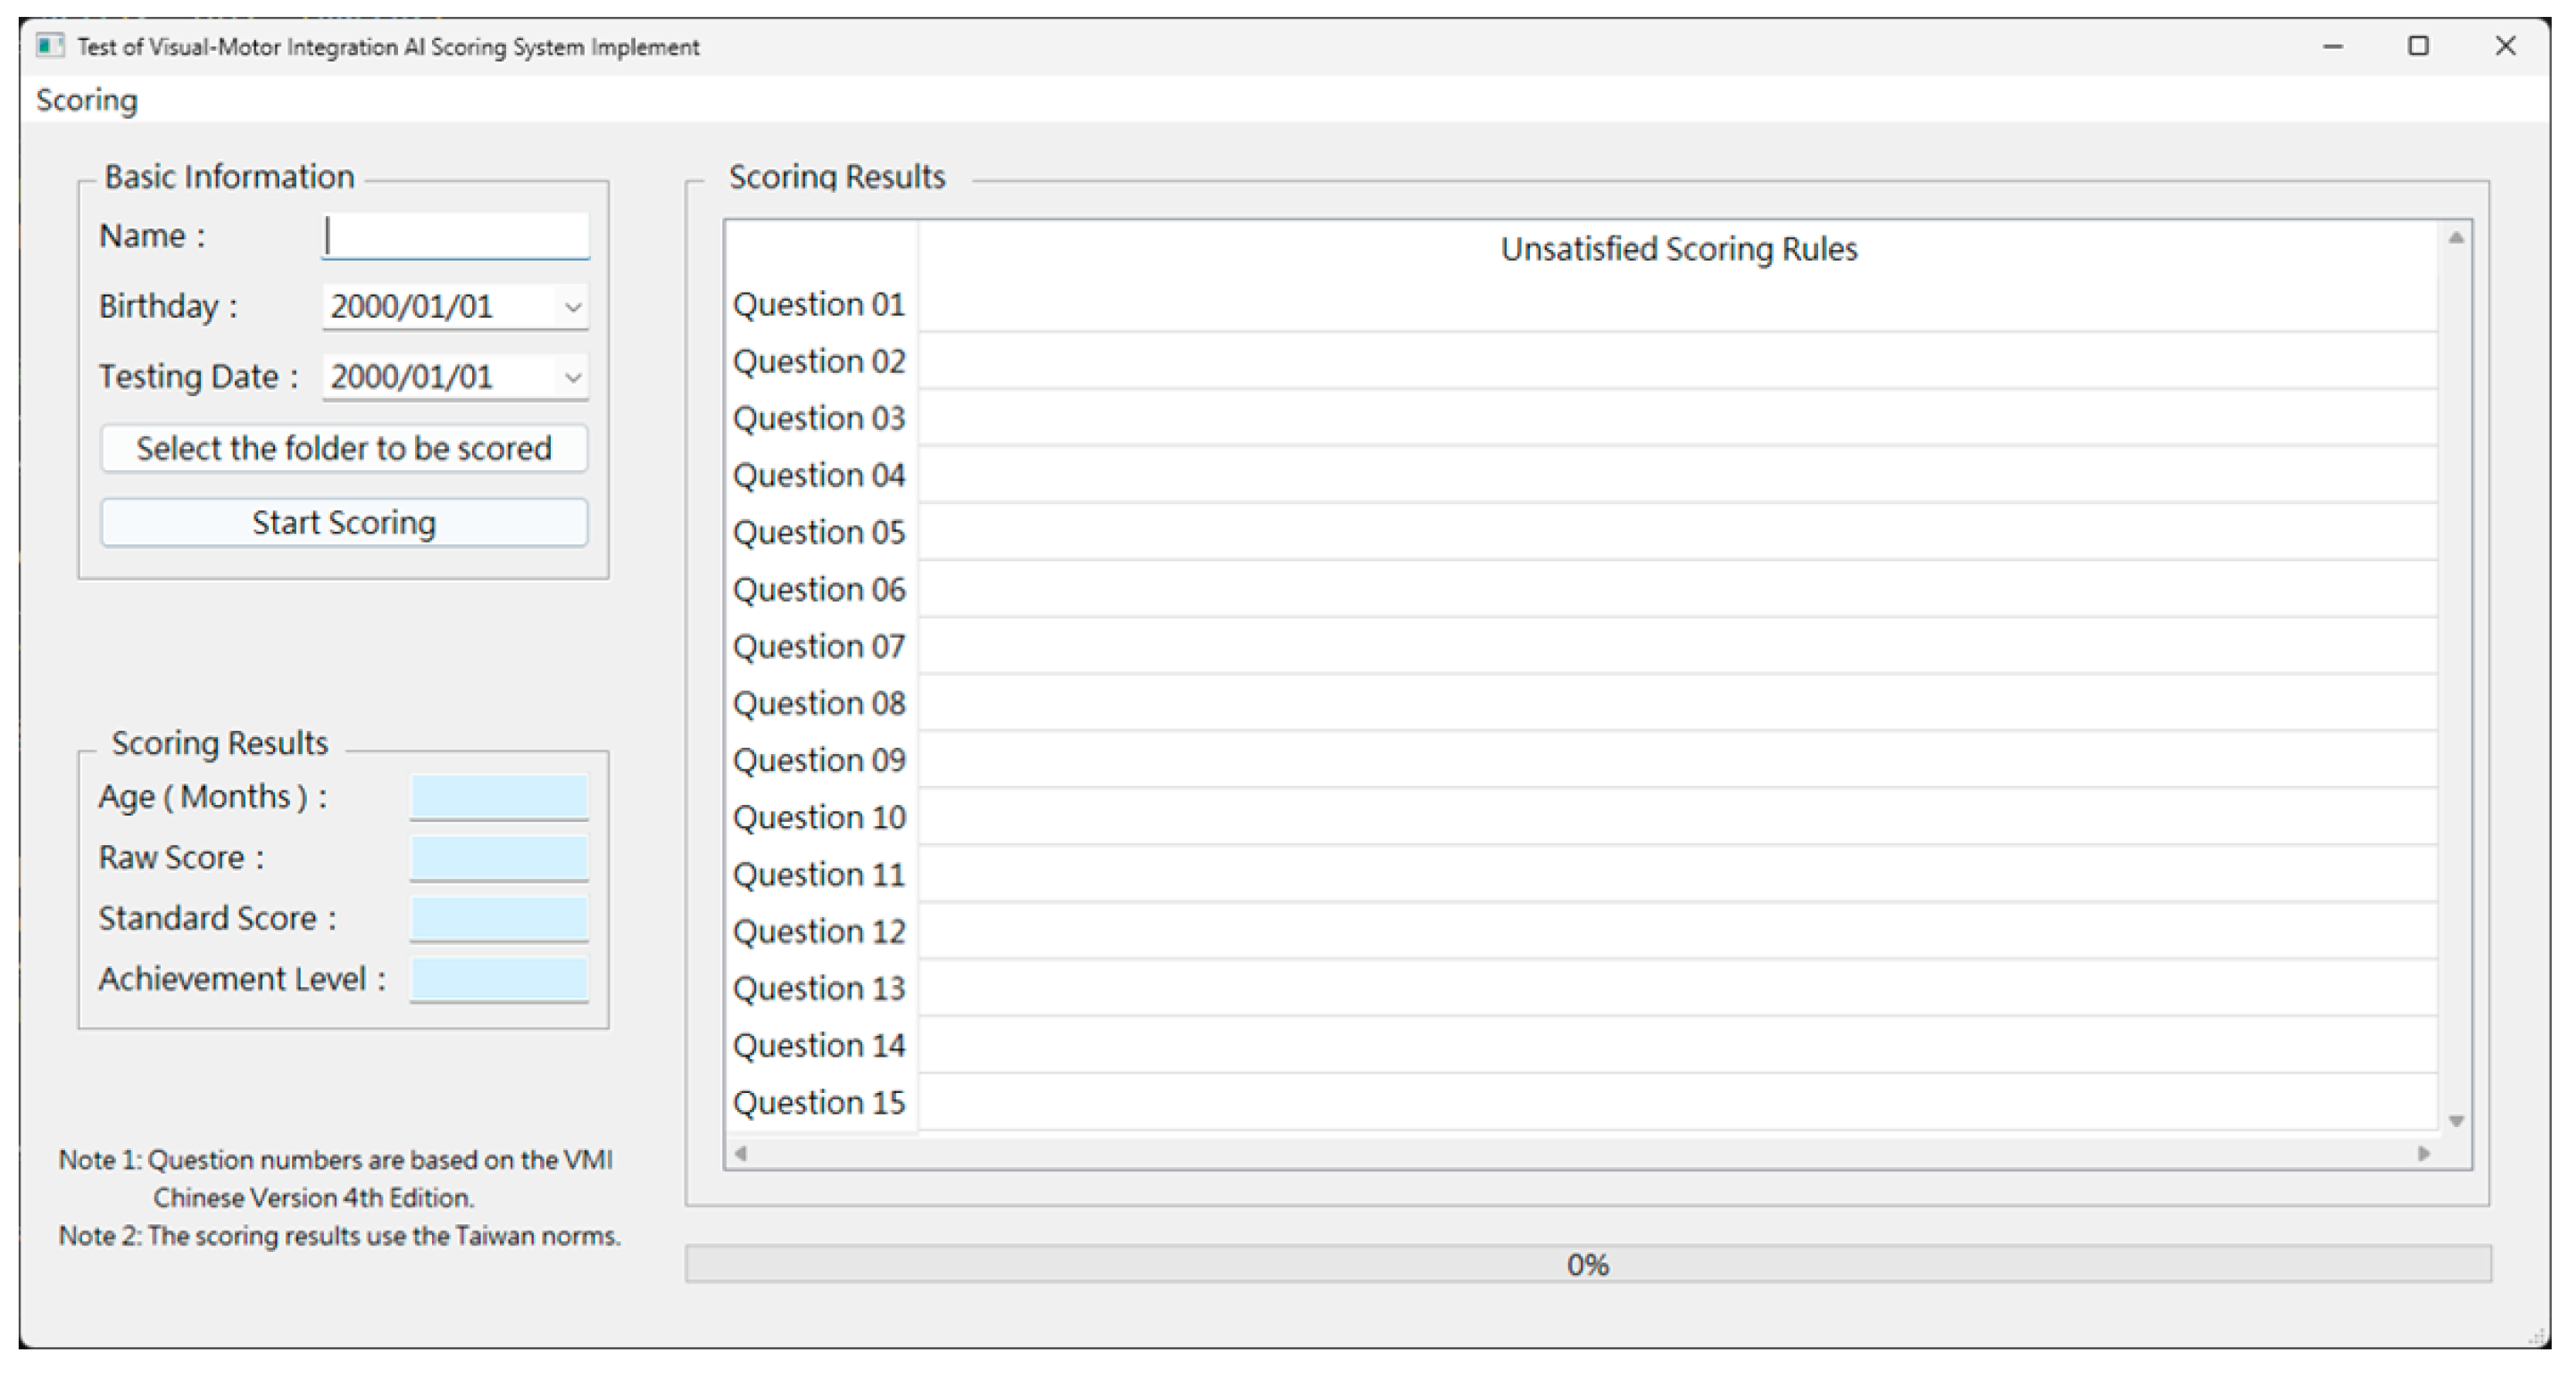
To demonstrate a clinically applicable scenario, we developed an evaluation software application that provides a convenient platform for importing patient test images and performing automated AI scoring. The software uses the trained model to predict and score, outputting seven sets of numeric codes. These codes are further converted by the application into raw scores and mapped to age-related data using predefined rules, norms, score conversion tables, and comments to generate standardized scores and achievement levels. Additionally, the application includes an intuitive user interface that enables medical professionals to easily operate and obtain the necessary information.
The software’s functionalities are particularly focused on the following aspects:
- Raw Score: The total score obtained by the patient in the test.
- Standard Score: The conversion of the raw score into a standardized score using the Z-score method, which helps in fairly comparing patient performance across different ages and backgrounds.
- Achievement Level: Classification of the patient into different achievement levels, such as excellent, good, average, weak, or very weak, based on the standardized score, providing a more detailed assessment of abilities.
Additionally, the application can identify specific rule deficiencies in patients, providing valuable information for medical professionals in diagnosis and treatment planning. However, due to the limitations in data collection, the application currently cannot accurately identify individual rule errors for questions 14 and 15.
4.6. Comparison with Existing Work
The most relevant literature presents a two-stage architecture based on CNN. The first stage involves concatenating feature maps of questions and answers along the channel direction to obtain input data, followed by classification using a second-stage CNN with a tanh activation function for result interpretation. The final design uses multi-label outputs, with each result producing six labels represented by 1, 0, and −1, indicating whether the rules are met, not met, or not applicable, respectively. These results are matched with a predefined set of evaluation rules to provide corresponding explanations. When the architecture incorporates residual modules and feature concatenation, the training accuracy for six questions reaches a maximum of 82.26%. However, these designs lead to overly complex input features and numerous possible output vector combinations (a total of 36 combinations). When the number of questions increases to twelve, the accuracy significantly drops to 69.7%.
In this paper, we propose a new architecture. Our contribution lies in optimizing the input features by concatenating question numbers and answers and choosing appropriate channel ratios to reduce the number of features, channels, and overall model complexity that result from directly concatenating questions and answers, effectively avoiding overfitting. Additionally, the new architecture optimizes the output vector. By designing the task as multi-class classification, the complexity of the output vector is reduced, and accuracy is improved. In addition to optimizing input features and output vectors, we introduce improved DenseNet. The experiment selects the pre-trained model DenseNet201 [10] as the backbone architecture, which is suitable for this task, and adds new fully connected layers for feature extraction and classification, using softmax instead of tanh as the final activation function. This design leverages the feature extraction capabilities of the pre-trained model while tailoring feature learning and extraction to specific problem requirements. Furthermore, we implemented an AI scoring system application with a user interface, integrating the classified prediction results into a rule-decoding system that calculates raw scores, performs norm-based standard score conversion, and achieves level conversion. These processes ensure the accuracy of the prediction results. Based on the predictions and decoding rules, this paper can provide detailed evaluations of answer penalties, such as unmet specific conditions. In addition to improving classification efficiency and accuracy, it offers a basis for penalties, providing targeted guidance for children’s training and improvement in future clinical applications, thus enhancing children’s abilities. Through the proposed improvements, we hope to provide a more efficient and accurate result for automated scoring systems.
5. Results and Discussion
This chapter details the experimental results for selecting pre-trained models, optimizing input channel data, training the improved DenseNet model, integrating machine learning classifiers, and implementing the software application
5.1. Results of Pre-Trained CNN Selection Experiments
During the process of selecting pre-trained model parameters, it was found that a more complex model does not necessarily yield better performance. In fact, the model’s performance depends on various factors, including its structure, the number of parameters, and its adaptability to specific tasks.
In the experiments, DenseNet201 demonstrated superior performance on unseen datasets. The validation loss and testing loss of DenseNet201 were lower compared to other pre-trained models, indicating that this model has higher generalization capability when handling new data. The gap between training loss and validation loss for DenseNet201 was smaller, suggesting lower overfitting. Overfitting refers to a situation where a model performs well on training data but poorly on validation data. Lower overfitting indicates that DenseNet201 can better balance performance between training data and unseen data, thus enhancing its reliability in practical applications.
Based on these observations, this paper decided to choose DenseNet201 as the backbone architecture for the model. Specifically, this paper utilizes parts of DenseNet’s structure, combined with improvements, to achieve optimal performance for the specific task in this study. Table 2 and Table 3 show the experiment results of the pre-trained model for questions 12 and 13, respectively.

Table 2.
Pre-trained model experiment results for question 12.

Table 3.
Pre-trained model experiment results for question 13.
5.2. Results of Optimizing Input Channel Data
The final experimental results show that the model performed best when Channel 1 and Channel 2 contained the answer features and Channel 3 contained the question number feature. This combination not only effectively reduced the complexity of the data but also improved the accuracy and stability of the model. Specifically, this configuration reduced interference from extraneous information while maintaining the model’s efficient learning capability, leading to better training results. The results also indicate that using a zero array might lead to information loss; although it successfully reduced complexity, it also diminished model performance.
This finding suggests that by carefully selecting the data content of the input channels, the training efficiency and performance of deep learning models can be significantly improved. Simplifying the question images to question number features and effectively combining them with answer features not only simplifies the data structure but also helps the model converge more quickly, achieving optimal prediction accuracy. Table 4 shows the results of optimizing input channel data.

Table 4.
Results of optimizing input channel data.
5.3. Results of Model Optimization and Training
The results of model adjustment and training experiments are presented in two phases, as described in the following sections.
5.3.1. Results of Training Improved DenseNet
The experimental results indicate that the model proposed in this paper outperforms the four model architectures of Lee [8] in terms of accuracy, whether with 6 questions or 12 questions. Improved DenseNet achieved an accuracy of 95.13% for 6-question graphics and 89.84% for 12-question graphics. Specifically, the model demonstrated better accuracy across multiple evaluation standards, whether in small-scale tests (6 questions) or larger-scale tests (12 questions).
In contrast, the four model architectures in the most relevant literature showed slightly inferior accuracy for the same number of questions. This indicates that the model proposed in this paper has stronger stability and adaptability when handling different numbers of questions. Particularly when the number of questions increased to 12, the model in this paper still maintained high accuracy, whereas the accuracy of models in the relevant literature significantly declined.
These results provide strong evidence for the superiority of the model proposed in this paper, especially in the application value in multi-question testing scenarios. The model demonstrates efficient performance under different testing conditions through effective feature extraction and classification methods, supporting its practical application. Table 5 shows the results of training improved DenseNet classification.

Table 5.
Results of training improved DenseNet classification.
After training with 12-question graphics, to further enhance the model’s adaptability to the task, fine-tuning with unfreezing layers was conducted. During the process of adjusting the number of frozen layers for improved DenseNet, it was found that when the number of frozen layers reached 90%, the model’s accuracy significantly improved and performed excellently. Specifically, as the number of frozen layers decreased, the number of epochs required to achieve accuracy exceeding 90% was significantly reduced, indicating that the model could adapt to new data more quickly and training efficiency was greatly improved.
However, as the number of frozen layers was further reduced, although training time was significantly shortened, it also led to a decrease in model accuracy. This is because unfreezing more layers makes the model parameters more flexible but also more susceptible to noise and specifics in the training data, thereby reducing the model’s generalization capability.
In the experiment of unfreezing layers, it was found that while unfreezing improved model performance, the improvement was not significant. It is hypothesized that this is due to DenseNet201 being pre-trained on the ImageNet dataset. The ImageNet dataset contains over 20,000 categories, such as “cat”, “dog”, “balloon”, or “strawberry”, each with hundreds of color images that have high complexity and diversity. Therefore, when transferring these pre-trained models to the black-and-white geometric images studied in this paper, excessive training may lead to overfitting due to the significant differences in features and complexity compared to ImageNet images.
Therefore, the experimental results in this paper show that while unfreezing some layers can increase model flexibility to a certain extent, excessive unfreezing may backfire and lead to decreased model performance. In transfer learning, it is crucial to reasonably select the number of frozen layers to balance between improving training efficiency and model accuracy. Table 6 shows the performance of improved DenseNet with frozen layers.

Table 6.
Performance of improved DenseNet with frozen layers.
5.3.2. Results of Improved DenseNet Feature Extraction Combined with SGD Classification
Although the final accuracy of the classifier using SGD (with hinge loss as the loss function) was reduced, it showed significant advantages in classification efficiency. Specifically, the SGD classifier could achieve accuracy similar to more complex methods within fewer training epochs. This indicates that although there is some loss in final accuracy, it is acceptable because it results in a substantial reduction in overall training time.
The study found that the rapid convergence property of the SGD classifier allows it to complete training in a shorter time. This is particularly important for applications that require rapid model iteration and deployment. For example, in tasks that demand real-time responses and quick decision making, the improved classification efficiency can significantly enhance the overall performance of the system. Although the decrease in accuracy is a non-negligible issue, this trade-off is reasonable and valuable when balancing efficiency and accuracy.
Additionally, the SGD classifier also excels in resource utilization. With reduced computational resources and time required for training, the SGD classifier can achieve high classification performance under limited hardware conditions, which is a significant advantage for resource-constrained scenarios. Therefore, despite a slight decrease in accuracy, the SGD classifier still holds considerable application value due to its significant advantages in training efficiency and resource utilization.
More importantly, the efficiency of the SGD classifier is not only reflected in the training process but also in the inference phase of actual applications. The model’s simplicity results in faster inference speeds, making the SGD classifier more competitive in real-time applications. For example, in real-time data processing and instant decision-making systems, the efficient inference capability of the SGD classifier can significantly enhance system responsiveness and processing efficiency.
In summary, while using the SGD stochastic gradient descent classifier (with hinge loss) for classification results in a reduction in final accuracy, it can substantially shorten overall training time by reducing the number of training epochs and resource consumption. This trade-off between efficiency and accuracy makes the SGD classifier still invaluable in specific application scenarios. However, since accuracy is the most crucial criterion for this task, the next stage of software application implementation will omit SGD as the classifier and use the model with 90% of the improved DenseNet training frozen, applying this model for classification. Table 7 shows the experimental results, with the combination of SGD recording the time taken for feature extraction and classification separately.

Table 7.
Results of improved DenseNet (90% frozen) combined with SGD classifier.
5.4. Results of Implementing the AI Assessment and Scoring Application
To realize and demonstrate the application of the scoring system, we developed an AI-based assessment and scoring application. Users are first required to fill in basic information such as name, birthdate, and test date and upload hand-drawn graphics of children. Figure 6 is an example image of a participant completing the test, uploaded to the application as input for the model. After completing these steps, users can activate the internal model for automatic scoring of the graphics. The model extracts features and scores each uploaded graphic, and once scoring is complete, the software displays important data on the interface, including raw scores, standard scores, and achievement levels, which helps assess the child’s overall performance in the test. Additionally, the software provides a dedicated area showing the scoring rules that the child did not meet, which is significant for parents and teachers to improve targeted teaching and training. The performance of the application in the experiment demonstrated its feasibility and effectiveness in practical applications. Through precise data processing and a user-friendly interface design, the software not only enhances scoring accuracy and efficiency but also provides unmet standards, offering strong support for the assessment and development training of children. Figure 7 shows the initial screen of the software application.
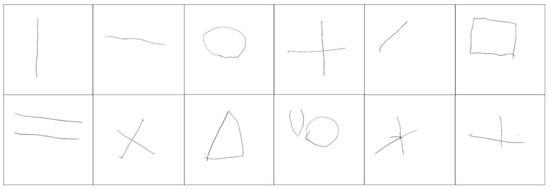
Figure 6.
Sample images from a participant completing the test.
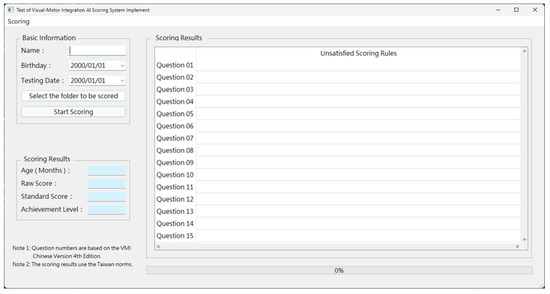
Figure 7.
Initial screen of the software application.
6. Conclusions
Ensuring accuracy in model output is a key focus in AI applications for VMI assessments. This paper introduces a framework capable of maintaining the accuracy of AI applications for multiple VMI scoring tasks. The final experimental results show that using our input features and output vector architecture with the proposed improved DenseNet model increased accuracy by 12.8% for 6-question graphics and by 20.14% for 12-question graphics compared to the most relevant literature. The accuracy of both our architecture and the proposed improved DenseNet model surpasses that of the model architectures in the most relevant literature, demonstrating the effectiveness of our approach in improving scoring accuracy. Future research directions include improving the balance between SGD classification efficiency and accuracy, expanding the number of assessment tool questions, and enhancing model accuracy.
Author Contributions
Conceptualization, Y.-T.T. and C.-Y.H.; methodology, Y.-T.T. and J.-S.L.; software, Y.-T.T.; validation, Y.-T.T.; formal analysis, Y.-T.T.; investigation, Y.-T.T., J.-S.L. and C.-Y.H.; resources Y.-T.T. and C.-Y.H.; data curation, Y.-T.T.; writing—original draft preparation, Y.-T.T. and J.-S.L.; writing—review and editing, Y.-T.T. and J.-S.L.; visualization, Y.-T.T.; supervision, J.-S.L.; project administration, J.-S.L.; funding acquisition, J.-S.L. All authors have read and agreed to the published version of the manuscript.
Funding
This work was supported by the National Science and Technology Council (112-2221-E-027-094), Taiwan.
Institutional Review Board Statement
The study was conducted according to the guidelines of the Declaration of Helsinki. The protocol was approved by the Ethics Committee of National Taiwan University Hospital (202111091RIPB).
Informed Consent Statement
The assessment is non-invasive and does not involve experiments on children. Each result is identified by a code, and no personal information is disclosed. Parents were asked for consent to provide data for collection and analysis to contribute to scientific knowledge about visual–motor integration.
Data Availability Statement
The data presented in this study are available on request from the corresponding author. The data are not publicly available due to confidentiality.
Conflicts of Interest
Author Yu-Ting Tsai was employed by the company Taishin International Bank Co., Ltd. The remaining authors declare that the research was conducted in the absence of any commercial or financial relationships that could be construed as a potential conflict of interest.
References
- Suzuki, S.; Amemiya, Y.; Sato, M. Deep learning assessment of child gross-motor. In Proceedings of the 2020 13th International Conference on Human System Interaction (HSI), Tokyo, Japan, 6–8 June 2020; IEEE: New York, NY, USA, 2020; pp. 189–194. [Google Scholar]
- Polsley, S.; Powell, L.; Kim, H.-H.; Thomas, X.; Liew, J.; Hammond, T. Detecting Children’s Fine Motor Skill Development using Machine Learning. Int. J. Artif. Intell. Educ. 2021, 32, 991–1024. [Google Scholar] [CrossRef]
- Wu, H.-M.; Lin, C.-K.; Li, C.-H.; Yang, S.-R. The Research on the Growth Model of Chinese Visual-Motor Integration and Visual Perception for Kindergarteners. Psychol. Test. 2019, 66, 429–451. [Google Scholar]
- Tseng, M.H.; Chow, S.M. Perceptual-motor function of school-age children with slow handwriting speed. Am. J. Occup. Ther. 2000, 54, 83–88. [Google Scholar] [CrossRef] [PubMed]
- Kaiser, M.-L.; Albaret, J.-M.; Doudin, P.-A. Relationship between visual-motor integration, eye-hand coordination, and quality of handwriting. J. Occup. Ther. Sch. Early Interv. 2009, 2, 87–95. [Google Scholar] [CrossRef]
- Strikas, K.; Valiakos, A.; Tsimpiris, A.; Varsamis, D.; Giagazoglou, P. Deep learning techniques for fine motor skills assessment in preschool children. Int. J. Educ. Learn. Syst. 2022, 7, 43–49. [Google Scholar]
- Beery, K.E. The Beery-Buktenica Developmental Test of Visual-Motor Integration (Beery-VMI) with Supplemental Developmental Tests of Visual Perception and Motor Coordination: Administration, Scoring and Teaching Manual 4th Edition, Revised; Psychological Publishing Co., Ltd.: New Taipei City, Taiwan, 2007. [Google Scholar]
- Lee, T.-G.; Yoo, J.-H. Rule Training for VMI Sketch in Developmental Testing based on a Deep Neural Network. In Proceedings of the Empowering Communities: A Participatory Approach to AI for Mental Health, Virtual, 9 December 2022. [Google Scholar]
- Krizhevsky, A.; Sutskever, I.; Hinton, G.E. Imagenet classification with deep convolutional neural networks. In Advances in Neural Information Processing System; The MIT Press: Cambridge, MA, USA, 2012; Volume 25. [Google Scholar]
- Huang, G.; Liu, Z.; Van Der Maaten, L.; Weinberger, K.Q. Densely connected convolutional networks. In Proceedings of the IEEE Conference on Computer Vision and Pattern Recognition, Honolulu, HI, USA, 21–26 July 2017; pp. 4700–4708. [Google Scholar]
- Trost, S.G.; Wong, W.K.; Pfeiffer, K.A.; Zheng, Y. Artificial neural networks to predict activity type and energy expenditure in youth. Med. Sci. Sports Exerc. 2012, 44, 1801–1809. [Google Scholar] [CrossRef] [PubMed]
- de Vries, S.I.; Engels, M.; Garre, F.G. Identification of children’s activity type with accelerometer-based neural networks. Med. Sci. Sports Exerc. 2011, 43, 1994–1999. [Google Scholar] [CrossRef] [PubMed]
- Rodríguez, A.O.R.; Riaño, M.A.; Gaona-García, P.A.; Montenegro-Marin, C.E.; Mendivil, Í.S.M. Image Classification Methods Applied in Immersive Environments for Fine Motor Skills Training in Early Education. Int. J. Interact. Multimed. Artif. Intell. 2019, 5, 151–158. [Google Scholar] [CrossRef]
- Moetesum, M.; Siddiqi, I.; Vincent, N. Deformation Classification of Drawings for Assessment of Visual-Motor Perceptual Maturity. In Proceedings of the 2019 International Conference on Document Analysis and Recognition (ICDAR), Sydney, Australia, 20–25 September 2019. [Google Scholar]
- Moetesum, M.; Siddiqi, I.; Ehsan, S.; Vincent, N. Deformation modeling and classification using deep convolutional neural networks for computerized analysis of neuropsychological drawings. Neural Comput. Appl. 2020, 32, 12909–12933. [Google Scholar] [CrossRef]
- Ruiz Vazquez, D.; Ramirez Alonso, G.M.d.J.; González Gurrola, L.C.; Cornejo Garcia, R.; Martinez Reyes, F. Exploring Convolutional Neural Networks Architectures for the Classification of Hand-Drawn Shapes in Learning Therapy Applications. Comput. Sist. 2020, 24, 1483–1497. [Google Scholar] [CrossRef]
- Zeeshan, M.O.; Siddiqi, I.; Moetesum, M. Two-Step fine-tuned convolutional neural networks for multi-label classification of children’s drawings. In Document Analysis and Recognition–ICDAR 2021, Proceedings of the 16th International Conference, Lausanne, Switzerland, 5–10 September 2021; Proceedings, Part II 16; Springer: Cham, Switzerland, 2021; pp. 321–334. [Google Scholar]
- Kim, H.-h.; Taele, P.; Valentine, S.; McTigue, E.; Hammond, T. KimCHI: A sketch-based developmental skill classifier to enhance pen-driven educational interfaces for children. In Proceedings of the International Symposium on Sketch-Based Interfaces and Modeling, Anaheim, CA, USA, 19–21 July 2013; pp. 33–42. [Google Scholar]
- Chollet, F. Keras Applications. Available online: https://keras.io/api/applications/#keras-applications (accessed on 16 September 2024).
- ImageNet. Stanford Vision Lab, Stanford University, Princeton University. Available online: https://www.image-net.org/ (accessed on 16 September 2024).
- Ed-daoudy, A.; Maalmi, K. Breast cancer classification with reduced feature set using association rules and support vector machine. Netw. Model. Anal. Health Inform. Bioinform. 2020, 9, 34. [Google Scholar] [CrossRef]
- Murty, M.N.; Raghava, R. Support Vector Machines and Perceptrons: Learning, Optimization, Classification, and Application to Social Networks; Springer: Cham, Switzerland, 2016. [Google Scholar]
- Wang, Z.; Crammer, K.; Vucetic, S. Breaking the curse of kernelization: Budgeted stochastic gradient descent for large-scale svm training. J. Mach. Learn. Res. 2012, 13, 3103–3131. [Google Scholar]
Disclaimer/Publisher’s Note: The statements, opinions and data contained in all publications are solely those of the individual author(s) and contributor(s) and not of MDPI and/or the editor(s). MDPI and/or the editor(s) disclaim responsibility for any injury to people or property resulting from any ideas, methods, instructions or products referred to in the content. |
© 2024 by the authors. Licensee MDPI, Basel, Switzerland. This article is an open access article distributed under the terms and conditions of the Creative Commons Attribution (CC BY) license (https://creativecommons.org/licenses/by/4.0/).

