Article

Detection of Irrigated and Non-Irrigated Soybeans Using Hyperspectral Data in Machine-Learning Models

by
Izabela Cristina de Oliveira
1,
Ricardo Gava
1,
Dthenifer Cordeiro Santana
1,
Ana Carina da Silva Cândido Seron
1,
Larissa Pereira Ribeiro Teodoro
1,
Mayara Favero Cotrim
2,
Regimar Garcia dos Santos
3,
Rita de Cássia Félix Alvarez
1,
Carlos Antonio da Silva Junior
4,
Fábio Henrique Rojo Baio
1 and
Paulo Eduardo Teodoro
1,*
1
Department of Agronomy, Federal University of Mato Grosso do Sul (UFMS), Chapadão do Sul 79560-000, MS, Brazil
2
Department of Agronomy, State University of São Paulo (UNESP), Jaboticabal 14884-900, SP, Brazil
3
Plant Sciences Building, Department of Horticulture, The University of Georgia, Athens, GA 30602, USA
4
Department of Geography, State University of Mato Grosso (UNEMAT), Sinop 78555-000, MT, Brazil
*
Author to whom correspondence should be addressed.
Algorithms 2024, 17(12), 542; https://doi.org/10.3390/a17120542
Submission received: 21 October 2024 / Revised: 22 November 2024 / Accepted: 29 November 2024 / Published: 1 December 2024
(This article belongs to the Section Algorithms for Multidisciplinary Applications)

Abstract

:
The objectives of this work are (i) to classify soybean cultivars under different irrigation managements using hyperspectral data, looking for the best machine-learning algorithm for the classification and the input that improves the performance of the models. The experiment was implemented in the 2023/24 harvest in the experimental area of the Federal University of Mato Grosso do Sul, Câmpus Chapadão do Sul, Mato Grosso do Sul, and it was conducted in a strip scheme with seven cultivars subjected to irrigated and rainfed management. Sixty days after crop emergence, three leaves per plot were collected for evaluation by the hyperspectral sensor. The spectral data was then separated into 28 bands to reduce dimensionality. In this way, two databases were generated: one with all the spectral information provided by the sensor (WL) and one with the 28 spectral bands (SB). Each database was subjected to different machine-learning models to ascertain the improved accuracy of the models in distinguishing the different eucalyptus species. The models tested were artificial neural networks (ANN), decision trees (DT), linear regression (LR), M5P algorithm, random forest (RF), and support vector machine (SVM). The results demonstrate the effectiveness of machine-learning models in differentiating soybean management under rainfed and irrigated conditions, highlighting the advantage of hyperspectral data (WL) over selected spectral bands (SB). Models such as the support vector machine (SVM) showed the best levels of accuracy when using the entire available spectrum. On the other hand, artificial neural networks (ANN) performed well with spectral band data, demonstrating their ability to work with smaller data sets without compromising the classification.

1. Introduction

Soybean (Glycine max [L.] Merrill.) is a crop of great agricultural importance to Brazil and the world. Soybean productivity is the result of meeting its requirements in the field and using seeds with high-quality value [1]. Soybean productivity depends on meeting its requirements during the period of plant growth and development, avoiding quantitative and qualitative losses in the seeds formed [2]. The reproductive phases include flowering, formation, and filling of the legumes, and are the most affected by water deficit, responsible for the greatest productive losses in soybean cultivation due to its relationship with the decrease in photosynthetic performance and, consequently, its damage to productivity [3].
Water availability is considered one of the most important productivity factors due to the greater resistance to diffusion of CO entering the cells when less water is available, which results in a reduction in the internal concentration of CO and a decrease in net photosynthesis and soybean yields [4]. To mitigate the effects of water deficit, irrigation is a widely used technique since the adequate supply of water via irrigation is capable of providing better crop development, better fertilization efficiency, plant health control, and higher productivity. However, genetics influences the agronomic characteristics of the crop, as cultivars with different phenological characteristics can show different responses to irrigation [5].
Technological advances applied to agriculture make it possible to use hyperspectral sensors to measure different characteristics. Hyperspectral sensors are remote sensing tools that enable the acquisition of hundreds of spectral bands, reproducing the reflectance spectra of the targets and allowing them to be identified [6]. Reflectance is an analytical technique that uses the electromagnetic energy reflected by materials in the visible, near-infrared, and short-wave infrared regions through electronic and vibrational processes where certain atoms and molecules absorb energy depending on their atomic structures, manifesting them through spectral reflectance curves [7]. In this way, it is possible to capture small changes in the chemical composition of the materials by detecting the shifting of the position and shape of the spectral absorption features of the reflected radiation [8].
Classification is one of the functionalities of machine-learning algorithms in which the algorithm learns a classification model on a given set of data [9]. However, each machine-learning algorithm performs differently with the data set, leading to the need to test different algorithms to find the best classifier [10]. The use of machine learning applied to spectral data has been widely explored, especially in soybean seeds, as it is a non-destructive method used in the identification of varieties [11] or in the classification of vigor [12]. It is also possible to use both technologies to distinguish soybean genotypes using spectral bands using public Landsat-8 satellite images, providing advances in soybean mapping [13] using such technology in the classification of five genetic genotypes.
Thus, the objectives of this work are (i) to classify soybean cultivars under different irrigation managements using hyperspectral data, looking for the best machine-learning algorithm for classification and the input that improves the performance of the models, and (ii) to find the most accurate machine-learning algorithm for classifying soybean cultivars and to determine the input data for the models that improve the performance of the algorithms.

2. Materials and Methods

The experiment was carried out during the 2023/24 harvest in the experimental area of the Federal University of Mato Grosso do Sul, Câmpus Chapadão do Sul, Mato Grosso do Sul, at the geographical coordinates 18°41′33″ south latitude and 52°40′45″ west longitude and at an average altitude of 810 m. The soil in the area was characterized as Latossolo Vermelho Distrófico [14] Clay (48% clay). The region’s climate is defined as tropical savannah (Aw), according to the Koppen classification.
The experiment was conducted in a strip scheme with thirty cultivars subjected to irrigated and rainfed management. Conventional sprinkling was used for irrigation, positioning the sprinklers every 12 m, thus creating an irrigated strip over all the hybrids with a width of 18 m (Figure 1). The method used was the FAO Penman–Monteith method, using data from an automatic weather station of the National Meteorological Institute (INMET), with 100% replacement of crop evapotranspiration (ETc) whenever the soil water balance approached the lower limit of the actual soil water capacity (ARWC), as in Ref. [15]. The soil was prepared using the conventional method (plowing and harrowing). The cultivars were sown using a seeder-adviser, with a rod-type furrowing mechanism for the fertilizer and a double mismatched furrowing mechanism for the seed, at a spacing of 0.45 m and with a population of 15 plants per meter.
Three leaves per plot were collected 60 days after crop emergence, at full bloom, when soybeans reach their highest peak of nutrient absorption and photosynthetic activity, for evaluation by the hyperspectral sensor. The sampled leaves were read on the hyperspectral spectroradiometer sensor (FieldSpec 3 Jr, Analytical Spectral Devices, Boulder, CO, USA), which provides spectral information in the 350 to 2500 nm range. This made it possible to form a spectral signature for each species and differentiate them by their spectral curve. The spectral data was then separated into 28 spectral bands to reduce dimensionality, as performed in Ref. [16]. In this way, two types of databases were generated: one with all the spectral information provided by the sensor (WL) and one with the 28 spectral bands (SB). Each database was subjected to different machine-learning models to ascertain the improved accuracy of the models to distinguish the different eucalyptus species. The models tested were artificial neural networks (ANN), decision tree (DT), linear regression (LR), the M5P algorithm, and random forest (RF) [10,17].
The machine-learning (ML) models were analyzed using stratified cross-validation 10 times with 10 repetitions (totaling 100 runs for each model). Correct classification (CC) and the Kappa coefficient were used to check the accuracy of the models. The machine-learning analyses were carried out with Weka 3.9.4 software, using the standard configuration for all the models tested [18] except for ANN, in which two layers with ten neurons in each were used.
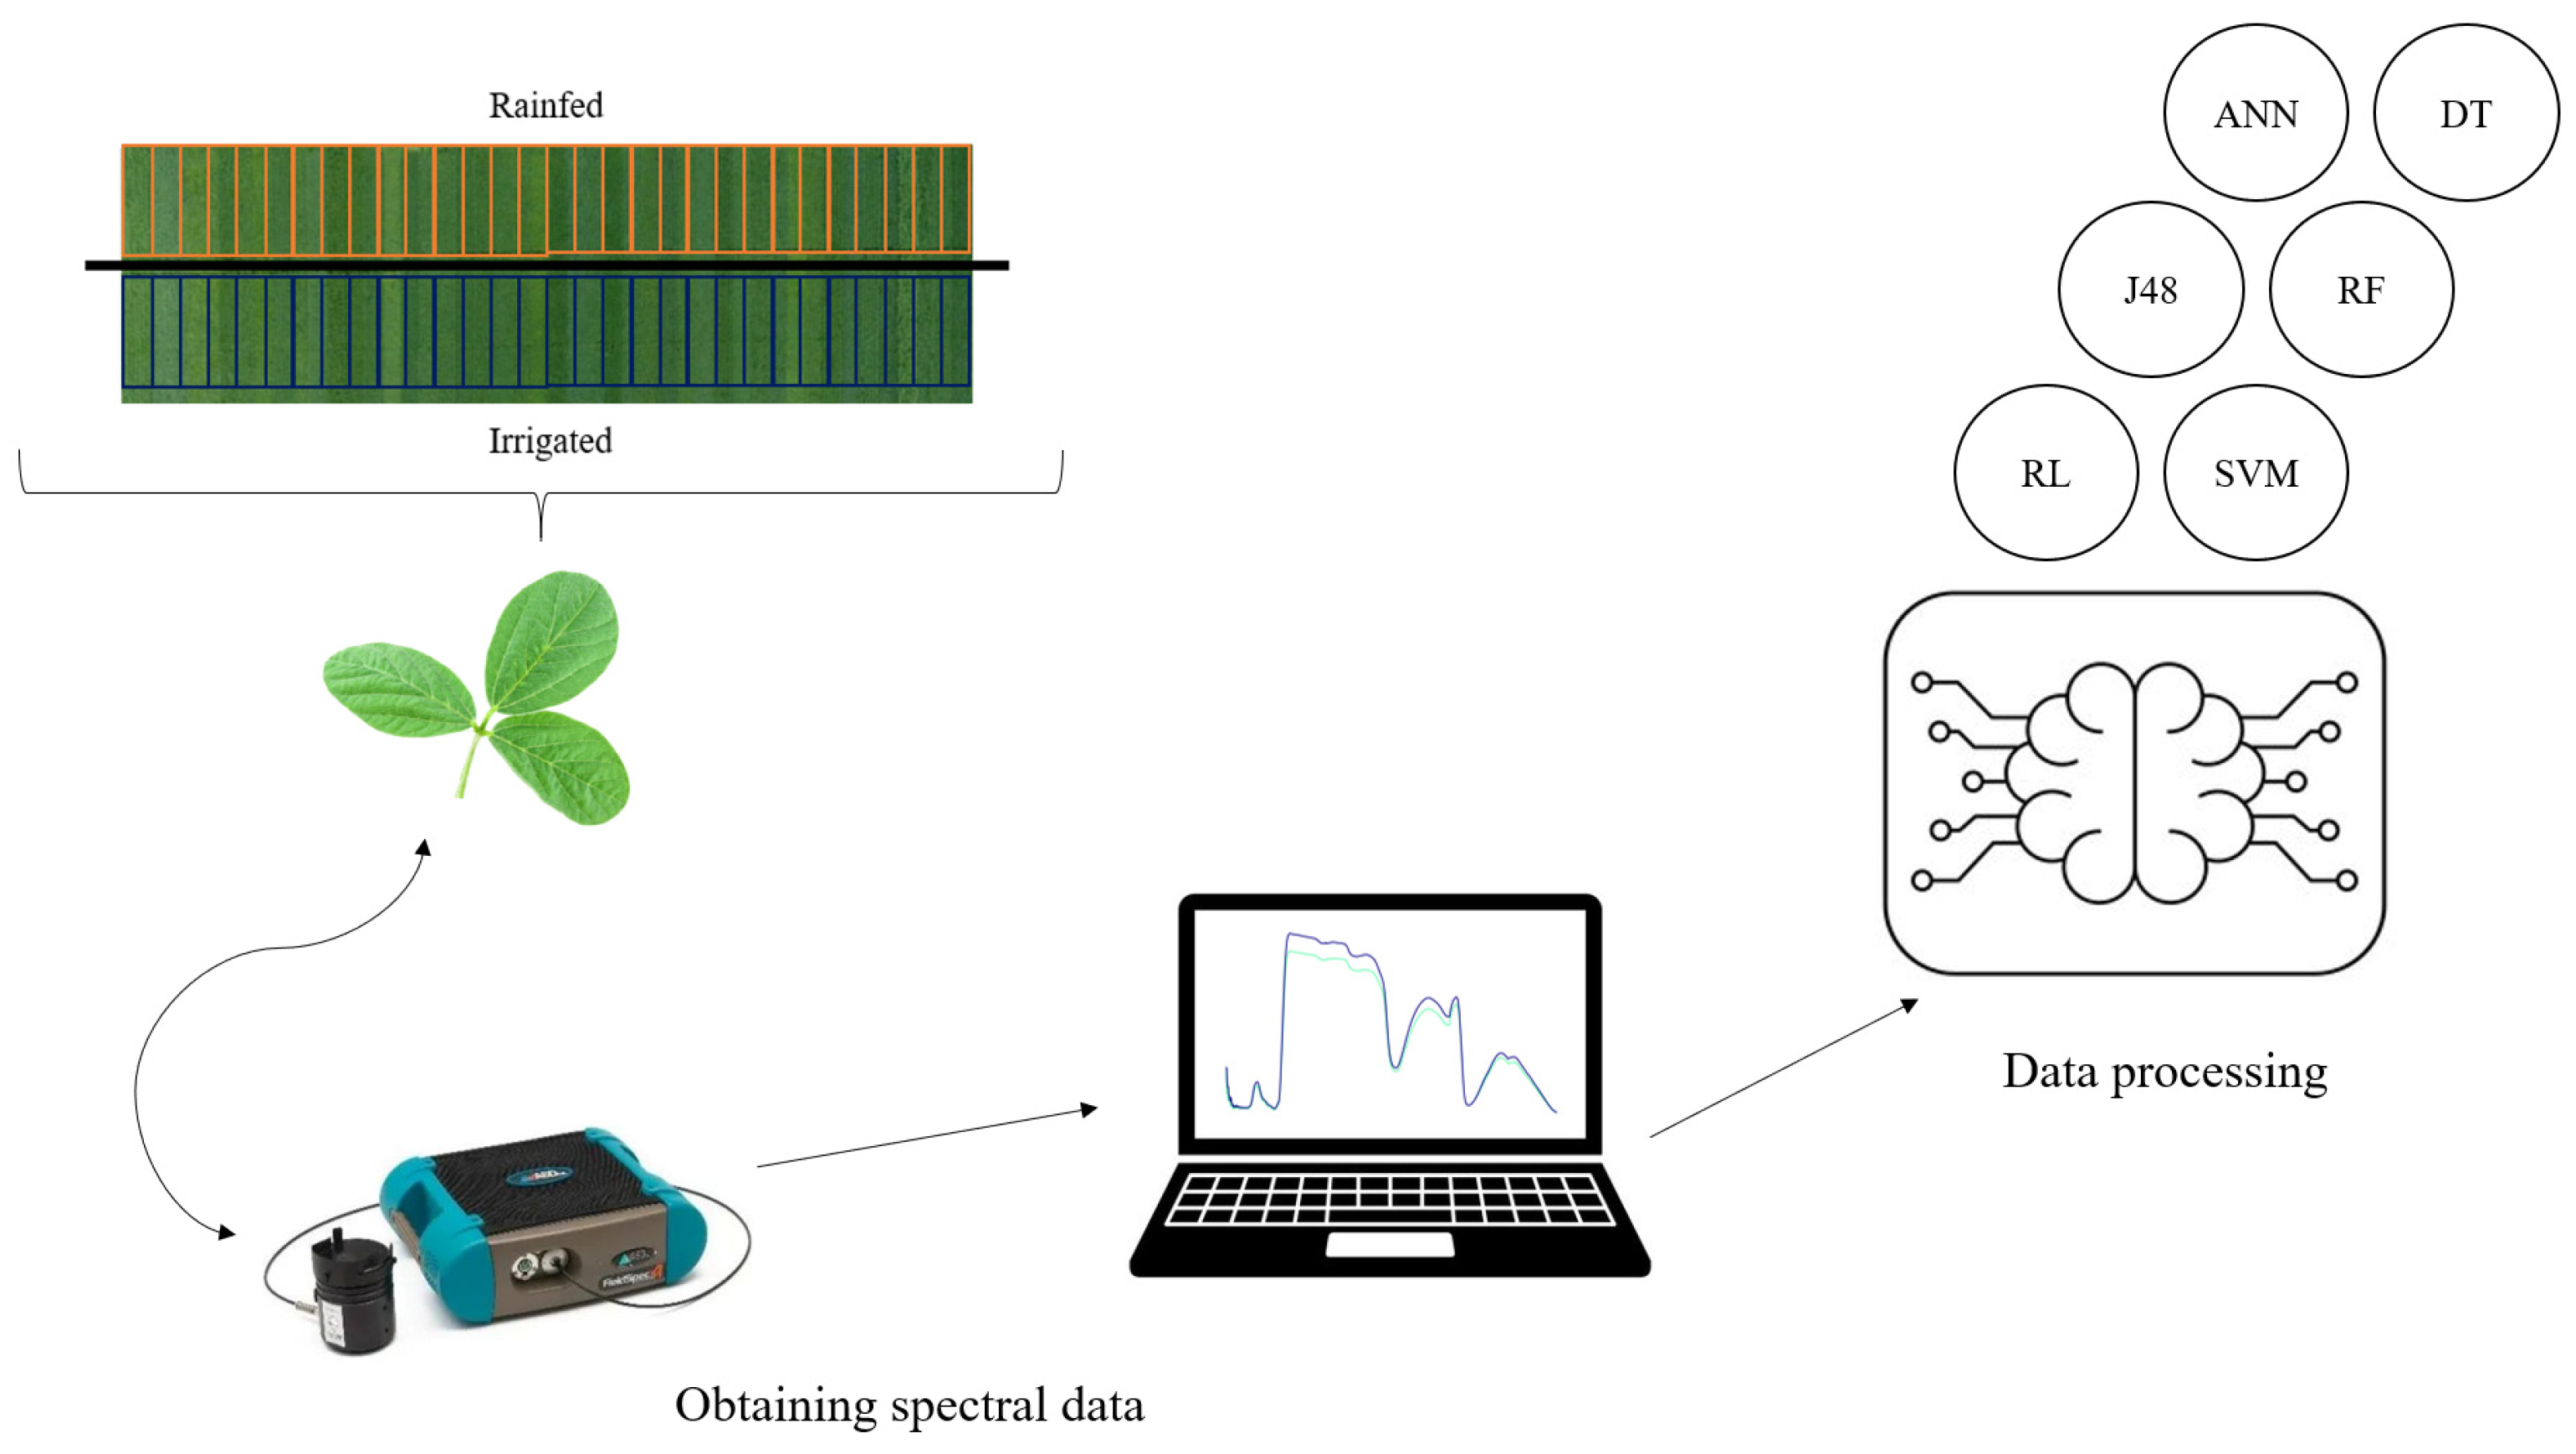
The artificial neural network (ANN) architecture used was of the multilayer perceptron (MLP) type, configured with a backpropagation algorithm to adjust the connection weights. The learning rate was set to 0.3, the momentum rate to 0.2, and the model was trained for 500 epochs. The J48 model, an implementation of the C4.5 classifier, was applied to solve classification problems, including an additional pruning step based on an error-reduction strategy. For this analysis, the pruning procedure was used, and the minimum number of instances allowed in a leaf node was set to 4. This configuration aims to minimize overfitting and improve generalization. REPTree operates with decision tree logic, creating multiple trees in several iterations and selecting the best one based on the information gained. It adopts error-reduction pruning as a splitting criterion to increase efficiency. In the experiment, we used Weka’s default configuration, which sets the minimum total weight of instances in a leaf to 2.0, with no restrictions on the maximum depth of the tree. Random forest (RF) builds an ensemble of decision trees (100 trees in this study) and combines their predictions through a majority voting scheme, resulting in a robust classification that is less prone to overfitting. Weka’s default settings were maintained for the remaining hyperparameters. The support vector machine (SVM) in Weka uses the sequential minimal optimization (SMO) algorithm and supports different kernel functions, such as linear, polynomial, and radial basis functions (RBF), allowing flexibility in modeling complex relationships in the data. In Weka, the SVM parameters such as cost (C), kernel type, and its hyperparameters can be tuned. These approaches, combining fine-tuned configurations and default strategies, ensure that the models are optimized for the dataset and the study objectives. Figure 2 shows a diagram to facilitate the understanding of how data collection and processing were carried out.
After obtaining the results of the accuracy metrics, an analysis of variance was carried out considering a 6 × 2 factorial scheme (models versus inputs) with 10 repetitions (folds). The means were grouped using the Scott–Knott test at 5% probability. Boxplot graphs for each variable (CC and Kappa) were created according to their significance. In addition, a ranking was created using the random forest algorithm in the same Weka software to find out which spectral bands and which bands contribute the most to differentiating the eucalyptus species.

3. Results

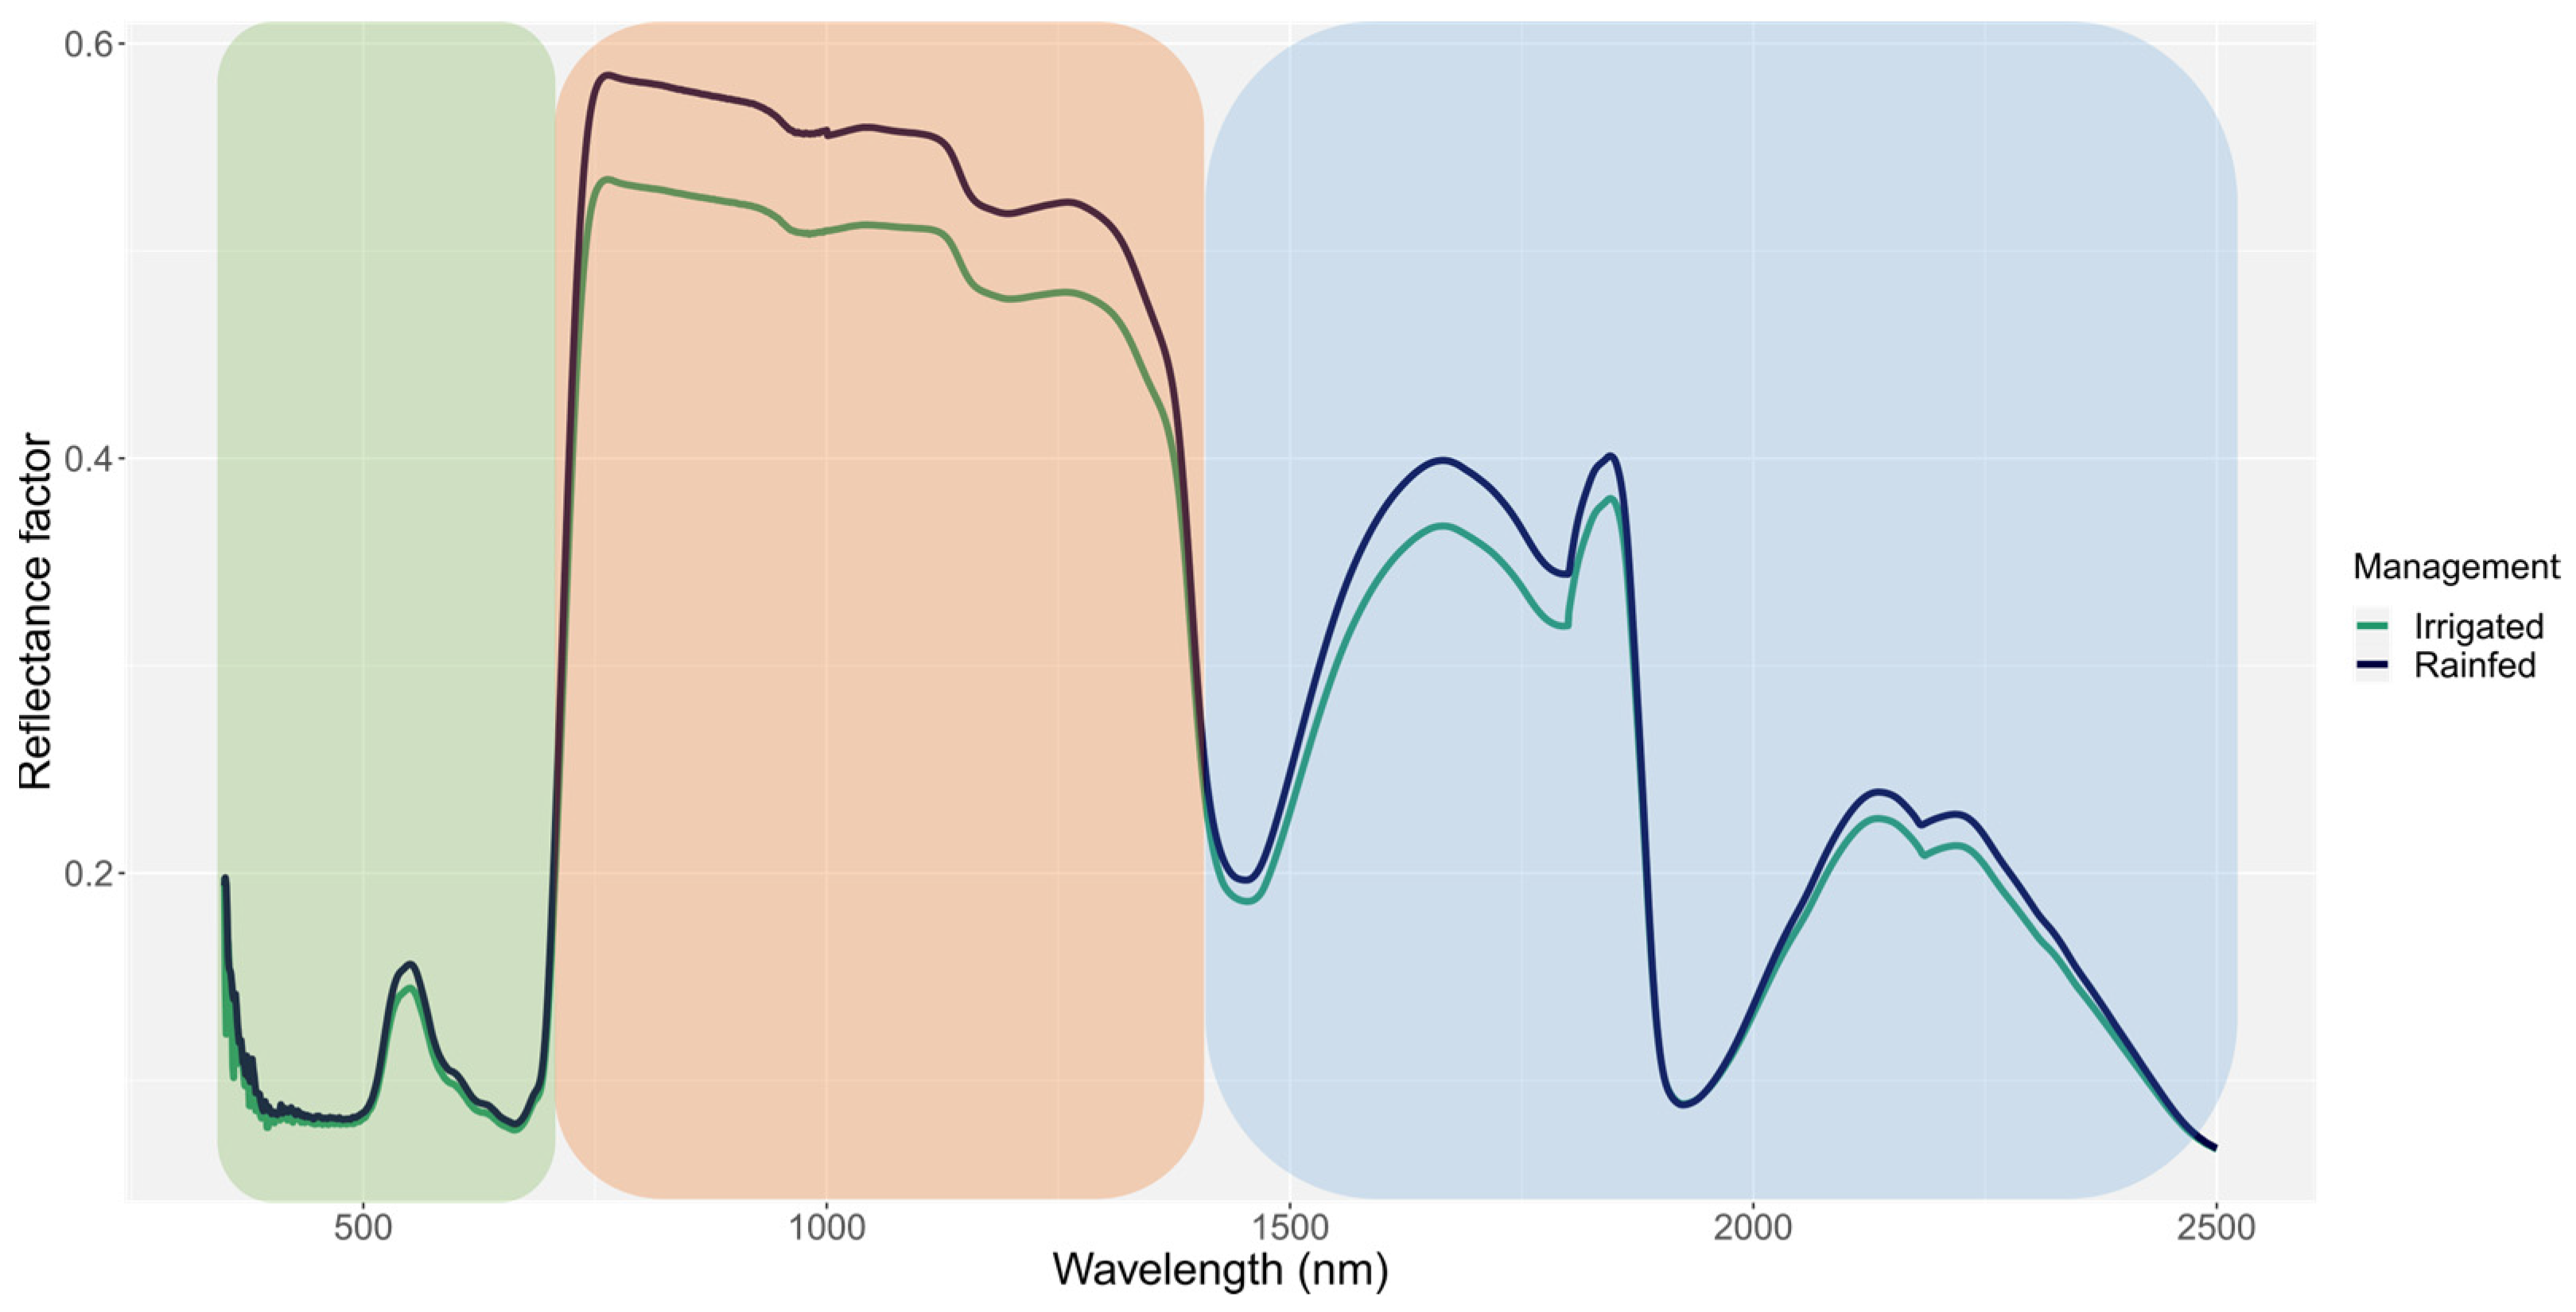
According to the hyperspectral signature of the soybean cultivars, there was a distinct behavior between irrigated and rainfed management (Figure 3), in which the reflectance factor of irrigated management showed lower values throughout the spectrum. Notably, the behavior of the curve in the visible region (VIS), which comprises the 400–700 nm wavelengths (the region highlighted in green in Figure 3), is almost imperceptible, except for the peak in the green range (550 nm).
In the near-infrared (NIR) region, which covers the spectral range from 700 to 1300 nm (highlighted in red in Figure 3), and in the short-wave infrared (SWIR) region, between 1300 and 2500 nm (highlighted in blue in Figure 3), there is greater differentiation among the spectral curves. These wavelength ranges are of significant importance in differentiating spectral signals and are particularly relevant to improving the ability of machine-learning models to discriminate among different irrigation management in soybean cultivation. The high sensitivity of these spectral regions to variations in humidity, chemical composition, and leaf structure makes them essential for increasing the accuracy of the classification of different treatments.
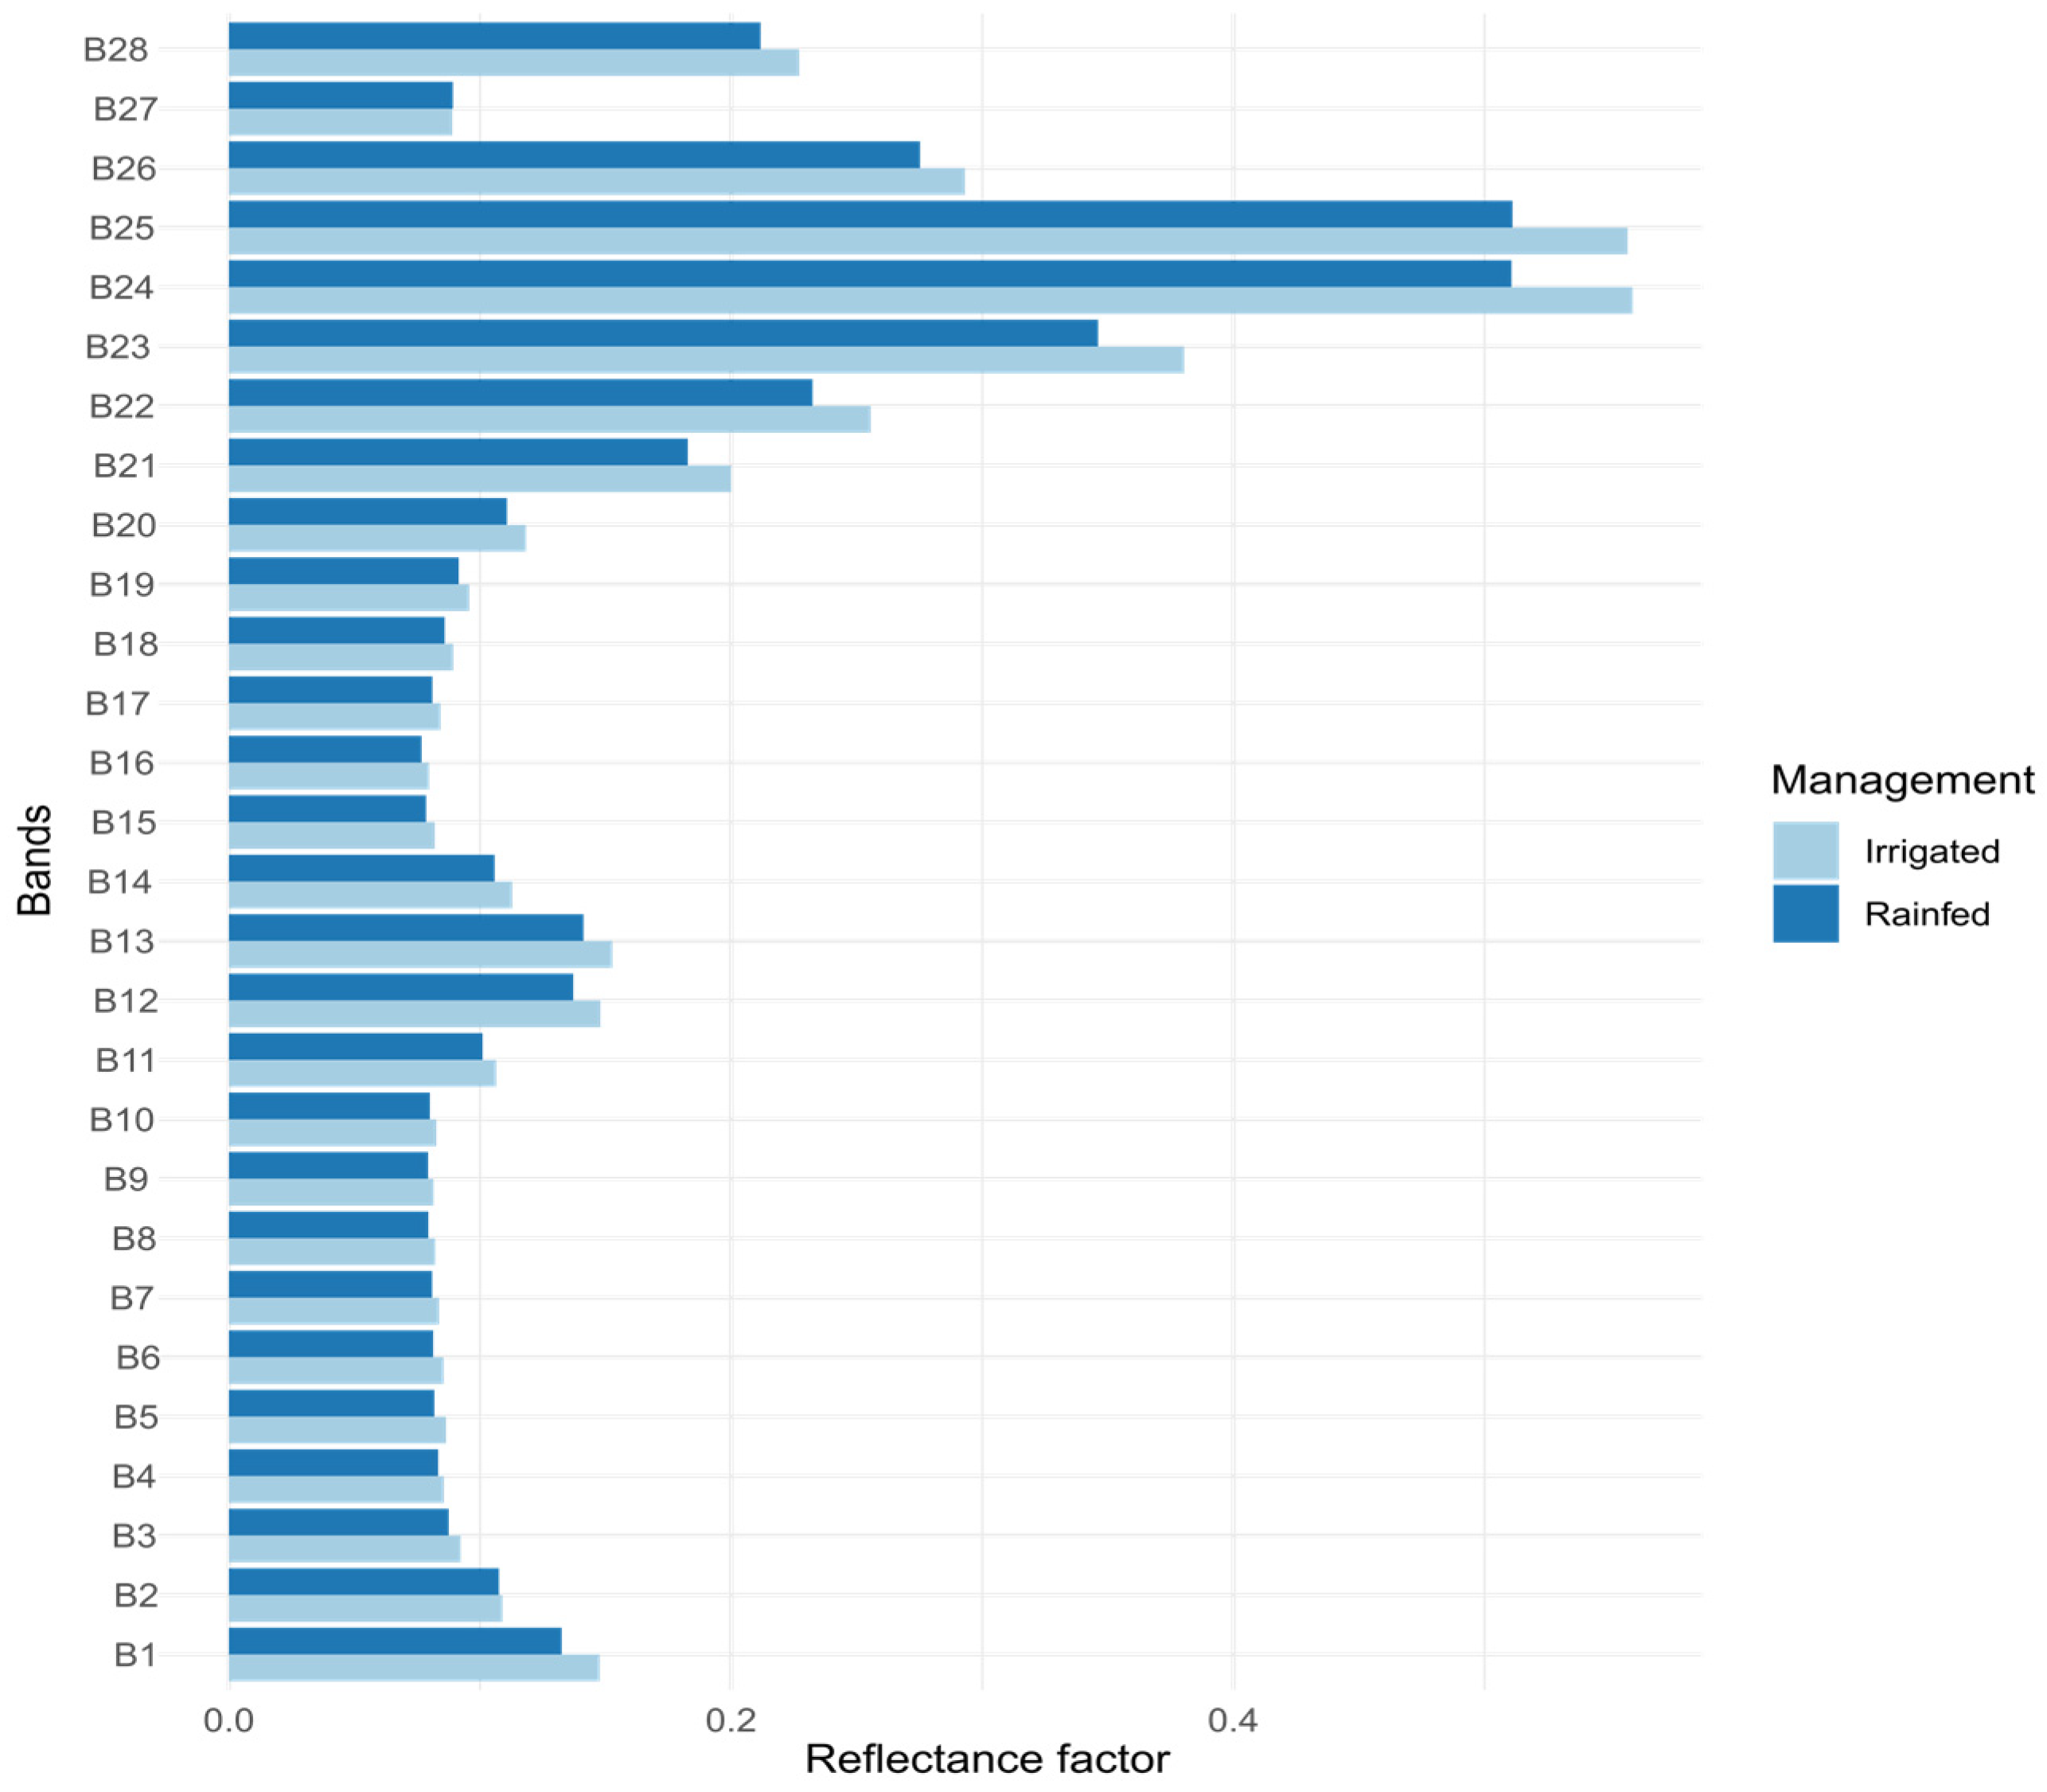
Figure 4 shows the spectral reflectance of the different bands for soybean management under rainfed and irrigated conditions. In all the bands analyzed, rainfed management had higher reflectance values than irrigated management. The distinction between the two managements is most evident in bands B21–B26, which predominantly cover wavelengths located in the near-infrared (NIR) region. This greater differentiation in the NIR region was also evident in the spectral curve shown in Figure 3, underscoring the sensitivity of this spectral band to the water content of the materials.
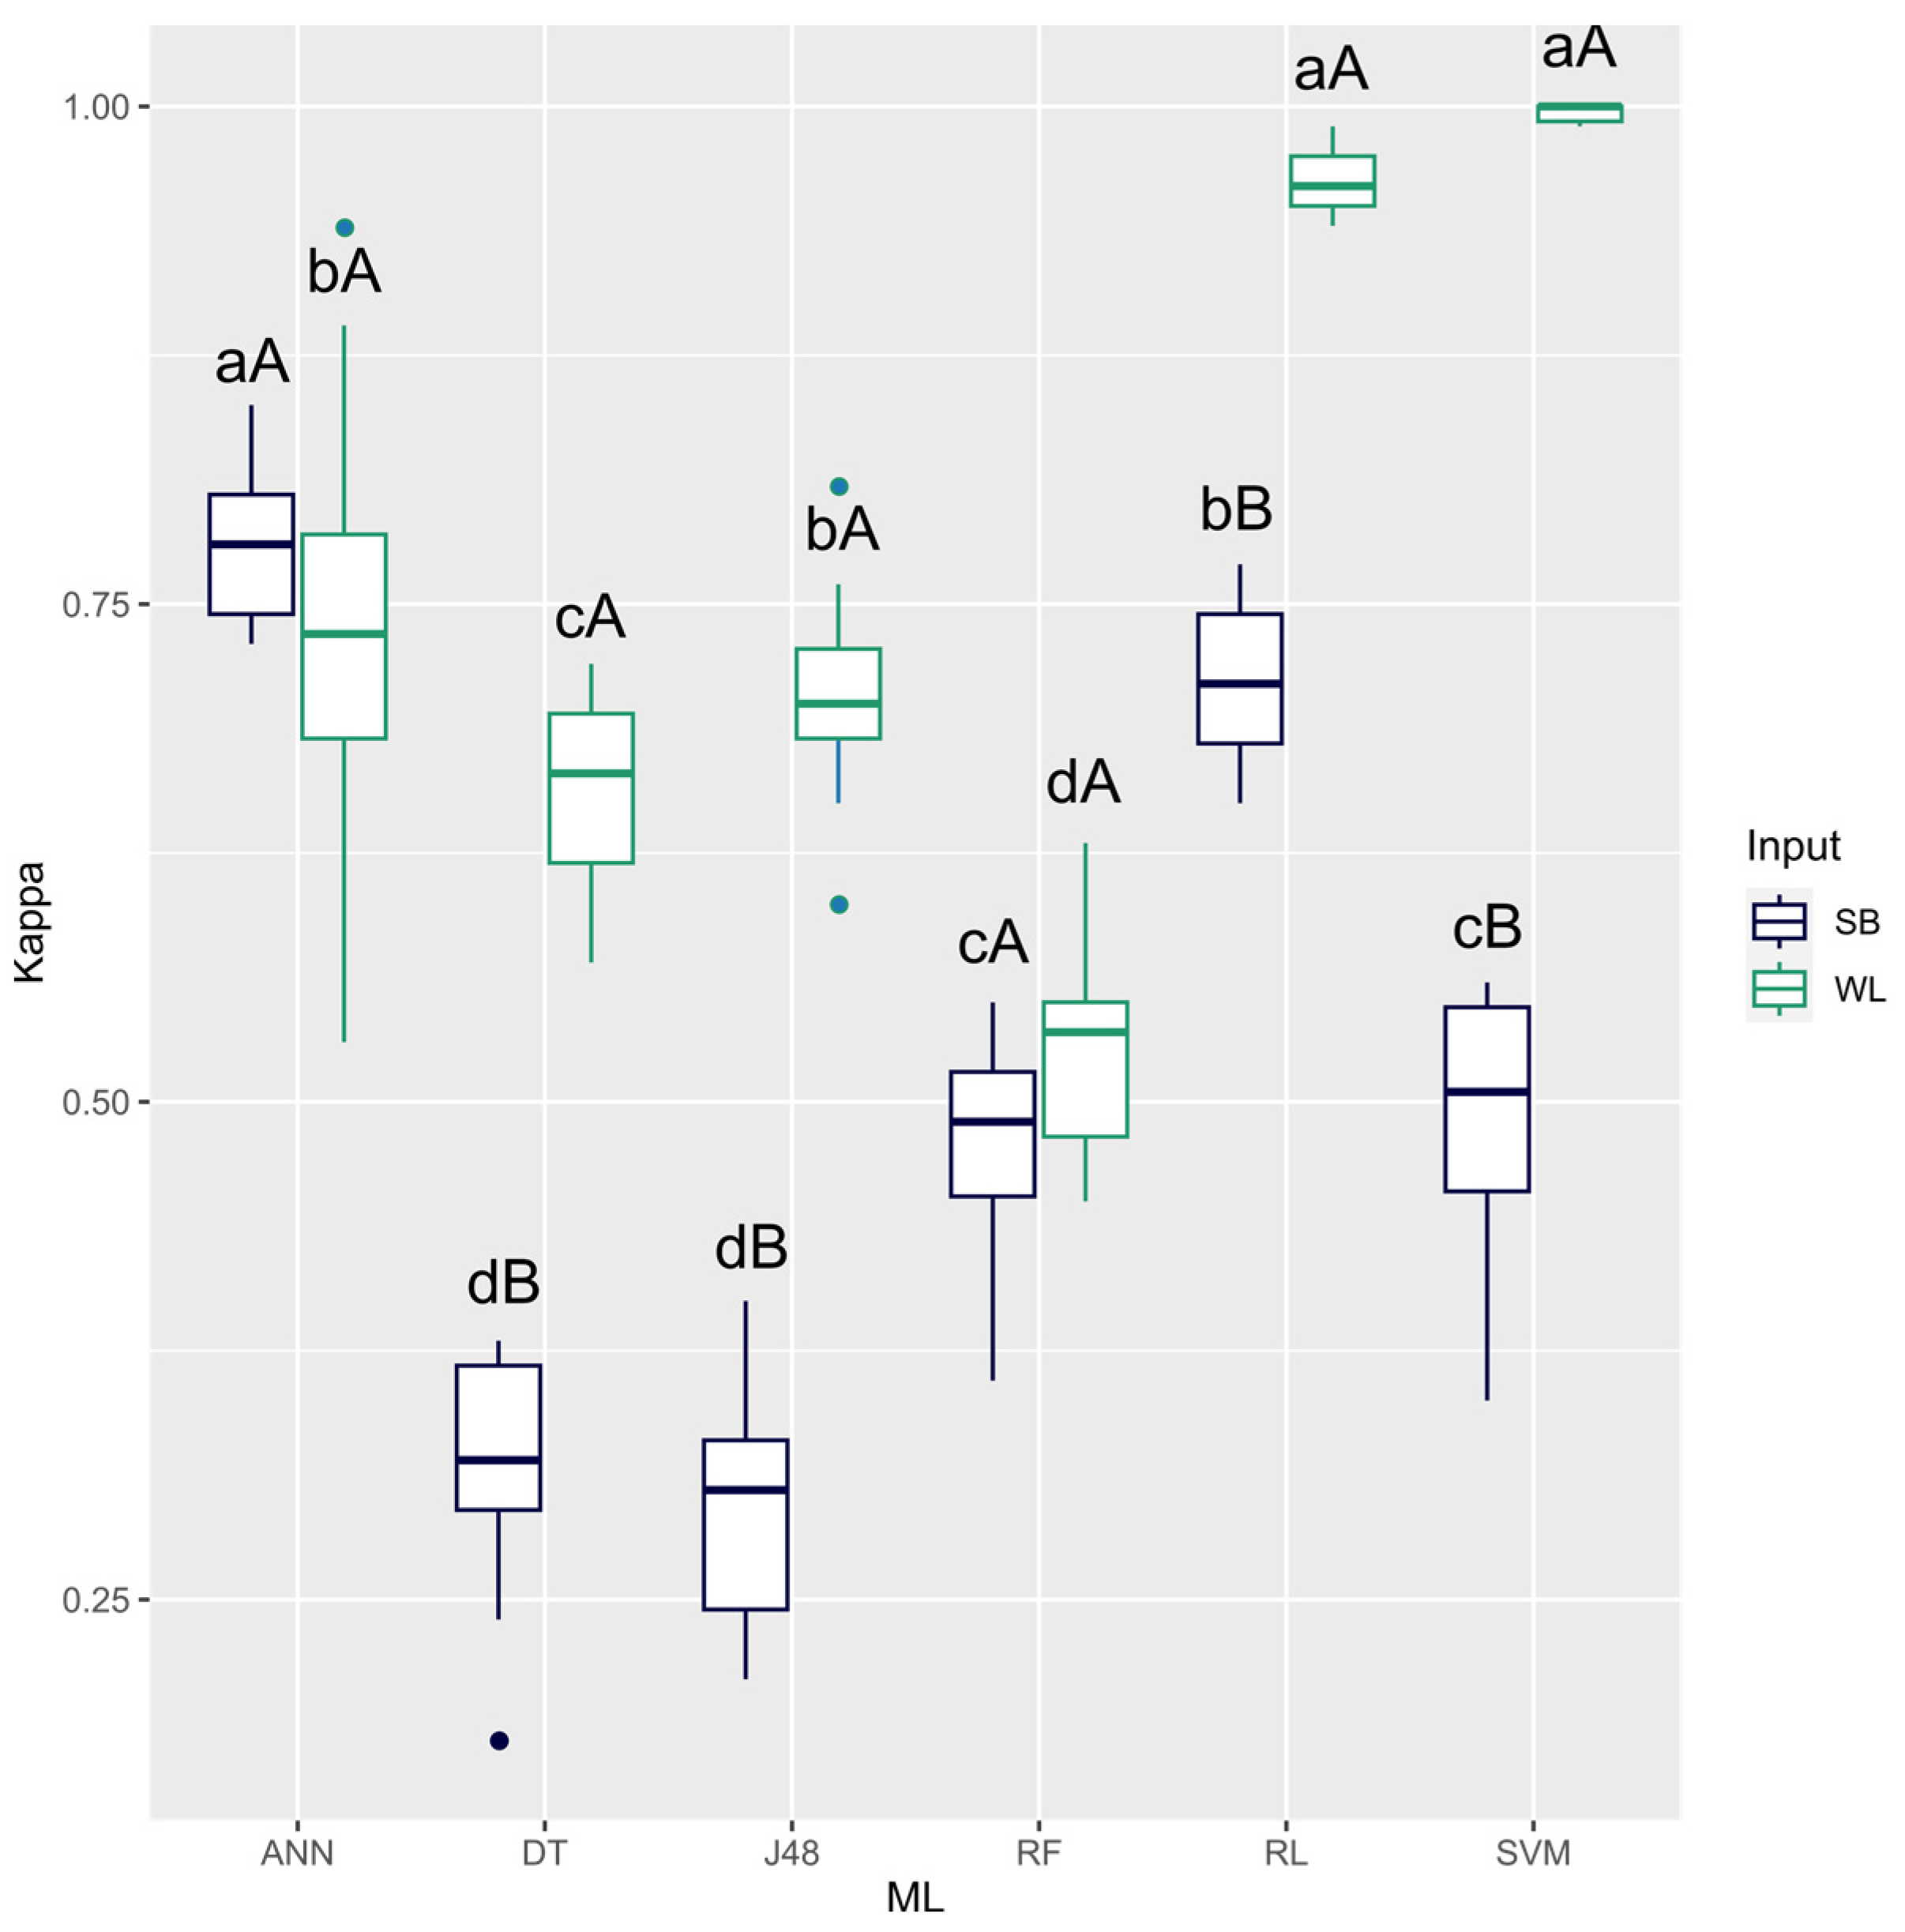
Six machine-learning models were used to distinguish among soybean materials grown under rainfed and irrigated conditions, using two types of input data for each model: hyperspectral curve data (WL) and data from 28 selected spectral bands (SB). The performance of the models was assessed using three accuracy metrics. In the Kappa coefficient metric (Figure 5), the results showed that both the WL and SB inputs provided similar performances for the artificial neural network (ANN) and random forest (RF) models. On the other hand, the DT and J48 decision tree models, logistic regression (LR), and support vector machines (SVM) performed better when using all the spectral information from the hyperspectral curve (WL). When analyzing the models with the SB input, the ANN performed well, achieving an accuracy of 0.78. However, when using WL as the input, the SVM and RL models showed significantly better results, with accuracies of 0.99 and 0.96, respectively. There is little variation in the accuracy of both models, attributed to the smaller box plot.
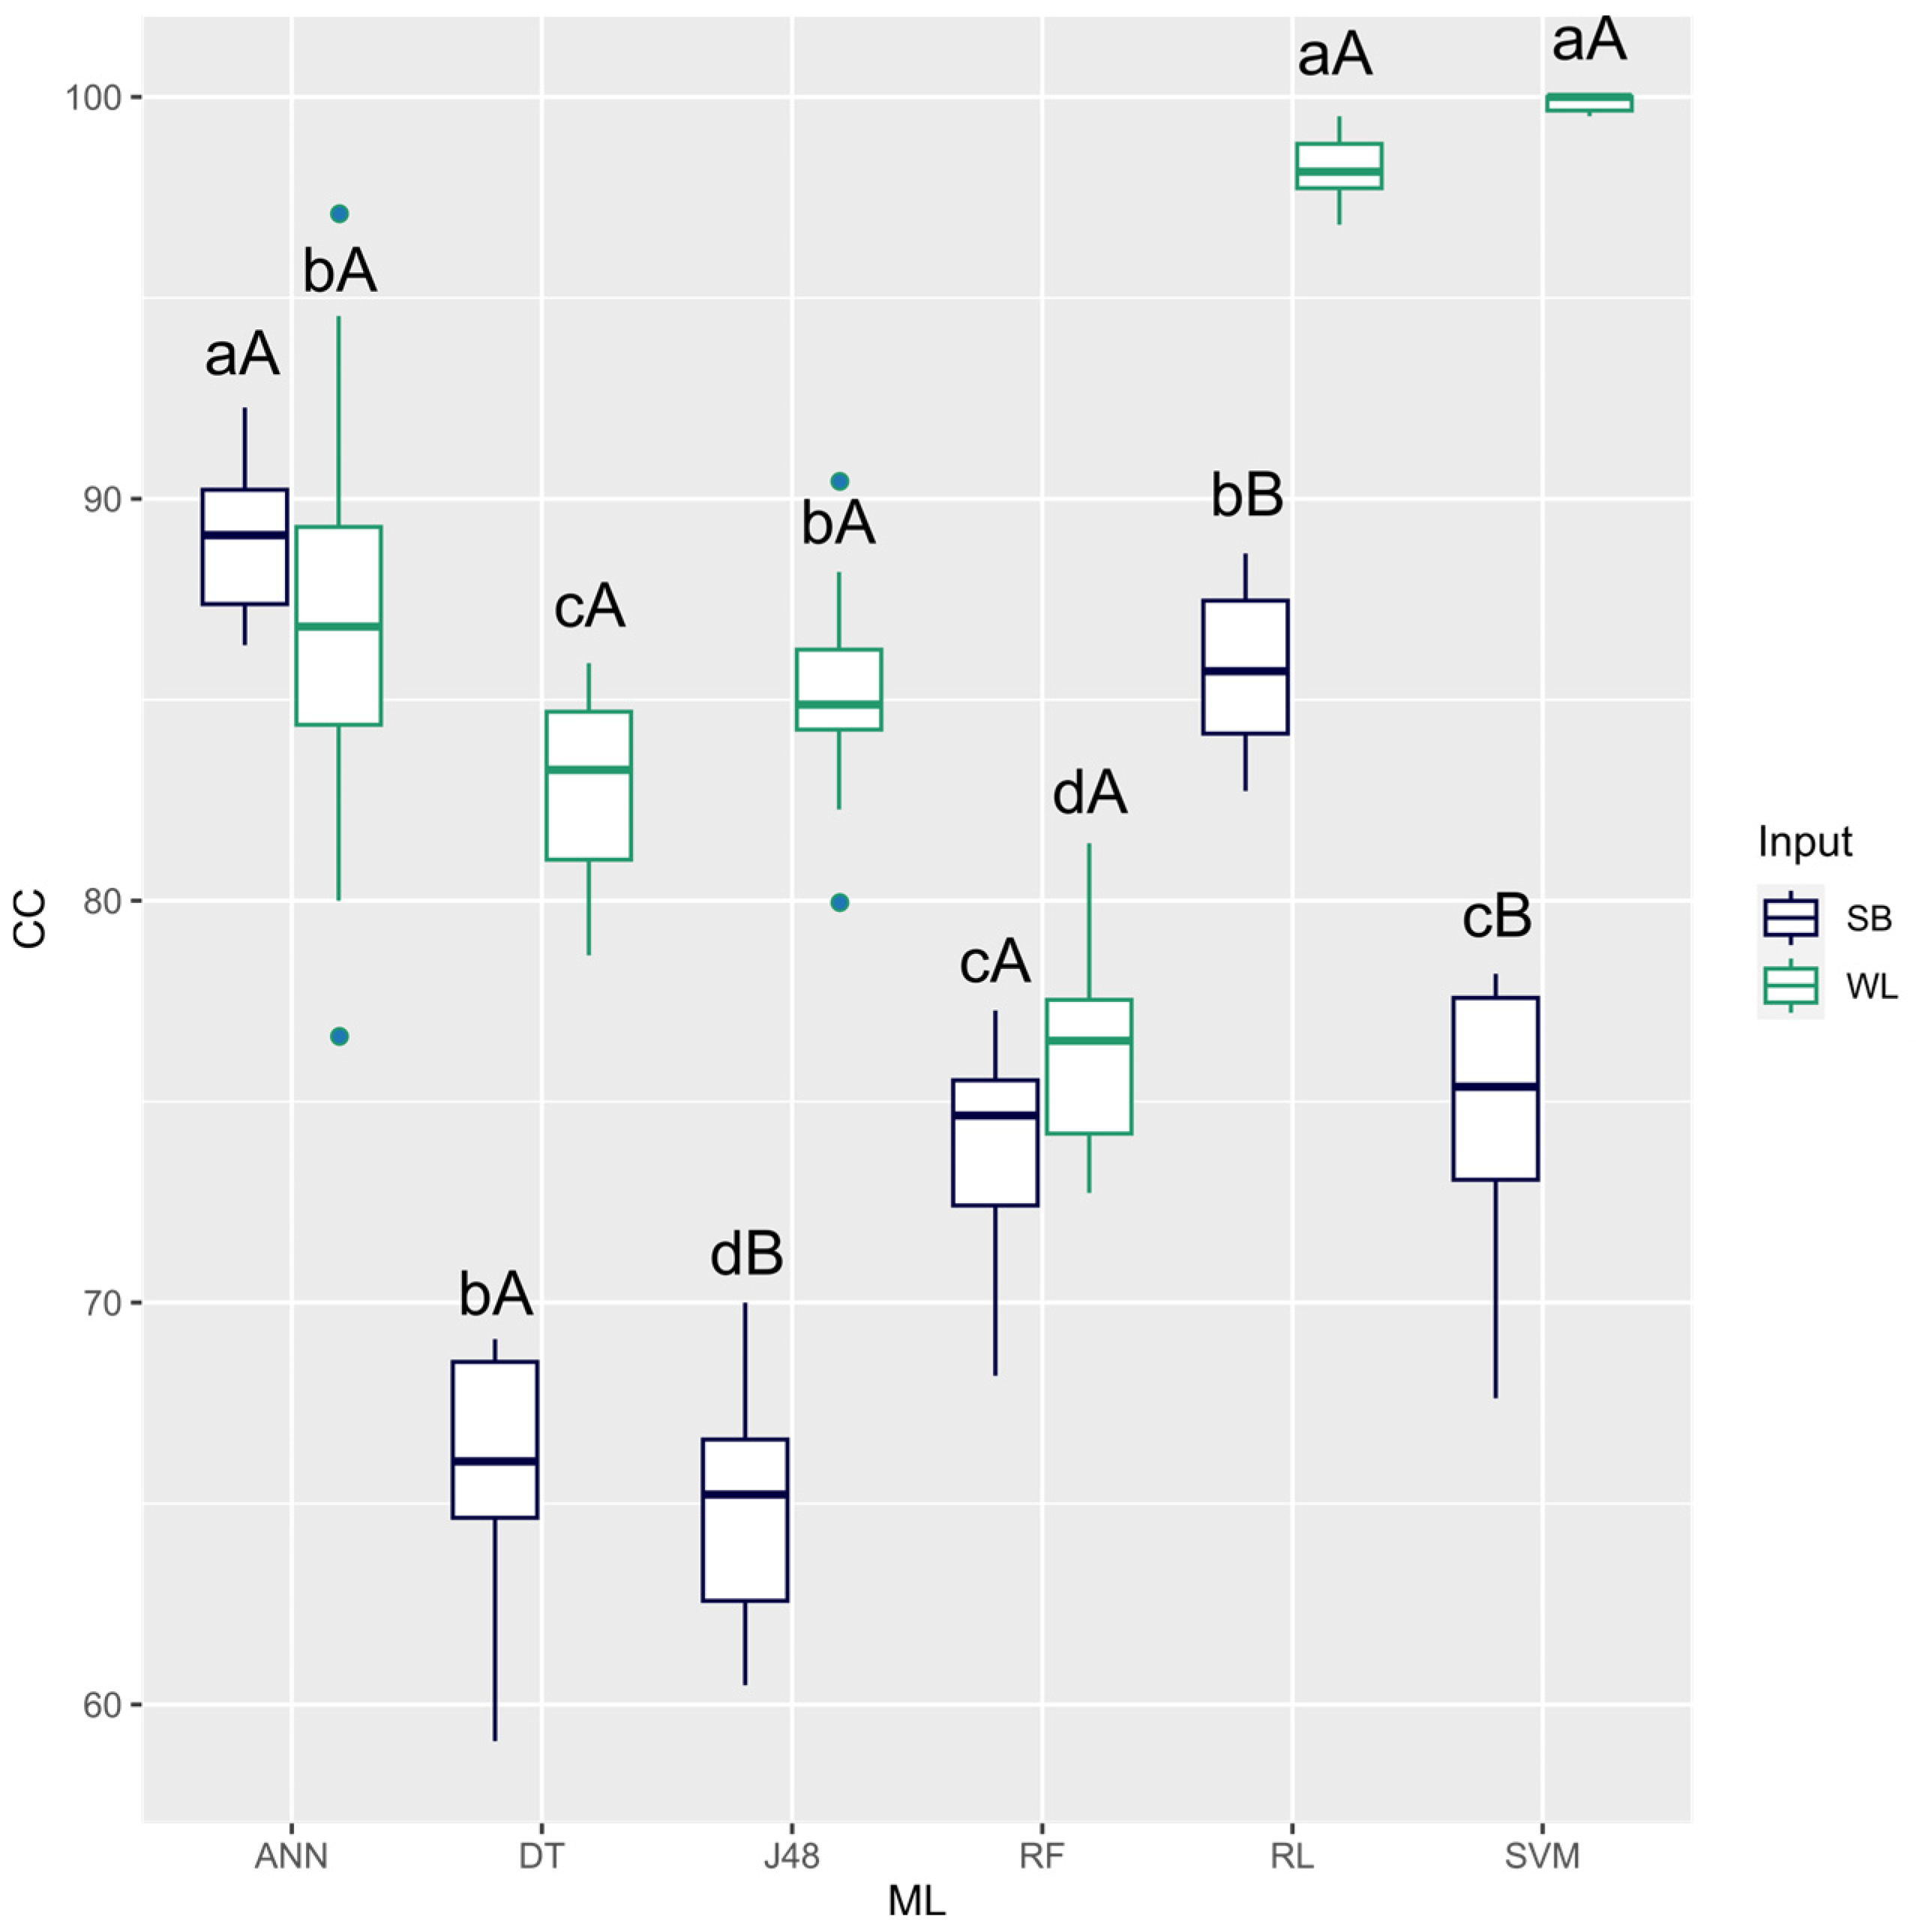
For CC (Figure 6), models also showed a similar behavior: the ANN and RF showed similar performances with both inputs, while DT, J48, RL, and SVM performed better when using WL. Using SB as the input, the ANN obtained an accuracy of 89.02%, while SVM and RL achieved 99.86% and 98.20%, respectively, when using WL, also showing little variation in the accuracy of both models. This is attributed to the smaller box plot reflecting greater accuracy due to the smaller variation in the response of the accuracy in the final results of the classification.
When evaluating the F-Score metric (Figure 7), only for the ANN model did both inputs provide good accuracy. All the other models performed better using WL. Comparing the influence of each input on the models, ANN stood out as the best model using SB, achieving an accuracy of 0.89. With the WL input, the SVM and RL models again stood out, with accuracies of 0.99 and 0.98, respectively.
The results presented demonstrate the effectiveness of machine-learning models in distinguishing between soybean management under rainfed and irrigated conditions, highlighting the use of hyperspectral data (WL) compared to selected spectral bands (SB). Models such as SVM and logistic regression (LR) proved superior when using all the spectral information, achieving high levels of accuracy. Meanwhile, the artificial neural network (ANN) model performed well with data from the selected bands, demonstrating its flexibility in dealing with reduced information for the classification task.

4. Discussion

The ability to identify and classify plants is essential for automatic vegetation mapping, as it is an effective and accurate technique for comprehensively classifying plants, which is currently in high demand [19]. In this regard, the use of data from sensors, especially those that provide hyperspectral reflectance of leaves, provides a series of narrow and continuous spectral bands, enabling finer discrimination of the spectral properties of plants [19,20,21]. What determines the spectral distinction among plants is the biochemical composition, pigments, water content, and internal cell structures [22].
When the plant goes through periods of water restriction, various physiological mechanisms are negatively affected [23], and stomatal closure occurs to prevent water loss. The process of avoiding water loss leads to a reduction in the absorption of carbon dioxide from the air [24,25] and consequently affects the absorption of nutrients by soil roots [26]. These effects caused by water stress affect the plant instantaneously, with a reduction in leaf water content that interferes with gas exchange, as previously mentioned, and in the long term, significantly affects the morphological characters of the crop, such as the leaf area index and plant biomass [27,28,29]. This influences what will be reflected by the plant.
Using sensor information is an efficient alternative for monitoring water relations through canopy and leaf reflectance, thus helping with water management, especially in precision agriculture practices. [30]. Specifically, leaf reflectance in the shortwave infrared (SWIR) region (1300–2500 nm) is strongly influenced by leaf structure and water content [31]. Ref. [32] state that leaf reflectance and leaf water content in maize have strong correlations in the transition between the NIR and SWIR wavelengths. Ref. [33] stated that VIS and SWIR wavelengths have greater sensitivity to leaf water content compared to NIR. Figure 1 shows that the greatest distinction among the curves formed by the soybean genetic materials under irrigated and rainfed management is in the NIR and SWIR regions, while in the VIS region, there was a greater distinction among the curves in the green region corresponding to 560 nm, suggesting that this band may also play an important role in distinguishing water management.
The regions of the highest reflectance, at 970 nm and 1200 nm, provide convenient wavebands for detecting the water content of the plant canopy [34]. Specifically, these regions are close to the B24 and B25 bands, which cover wavelengths of 960 nm and 1100 nm, respectively. These bands, as shown in Figure 4, showed a significant distinction between rainfed and irrigated management, reinforcing the usefulness of these bands in crop water monitoring. The sensitivity of these bands to variations in water content makes them essential for implementing water management strategies in agricultural systems, allowing for a better distinction between different irrigation treatments.
Once the spectral regions that make it possible to distinguish water management have been identified, such as the bands covering the NIR and SWIR, the potential for using this information in advanced machine-learning models becomes clear. Machine learning has become a highly relevant alternative for obtaining recognition, prediction, and filtering results in many complex agricultural problems. The significant distinction between irrigation managements in the ranges indicates that spectral data, when applied to supervised machine-learning algorithms, can be extremely effective for the automated classification of genetic materials under different water regimes. The use of RL and SVM models stands out, specifically SVM, which, even though it showed no statistical difference, had a higher classification rate. The compilation of the use of ML with spectral data has been explored in the analysis of soybean seeds, as it is a non-destructive method used in the identification of varieties [11] or in the classification of vigor [12], in addition to being able to be used in the industrial classification of soybean grains. Furthermore, the application of these techniques can be extended to the identification of diseases in plants in terms of severity [35,36] and the identification of the causative agent [37].
The SVM model is a supervised machine-learning algorithm used in classification and prediction tasks that is widely used for its pattern recognition efficiency [38]. The main objective of the algorithm is to find the best way to effectively separate data into categories, with high accuracy and requiring less memory than other classification methods, especially when applied to high-dimensional datasets such as those with many variables or characteristics, for example, hyperspectral data. This makes SVM a robust choice for classification tasks in complex problems [39,40]. SVM achieved good performance in classifying individual species, even though these species are closely related and morphologically similar, highlighting the model’s ability in complex classification tasks because restricted morphological differences make differentiation difficult.
Another sign of effectiveness reported about SVM is its ability to distinguish levels of psyllid attack severity in eucalyptus, especially when using all the information provided by the spectrum [17]. The WL input also provided better overall accuracies for all the models used to distinguish irrigated and non-irrigated soybean materials, because providing all the spectrum information made available by the sensor provides a complete set of data that contributes to improving the accuracy of the models by increasing the amount and variability of data available for analysis.
Providing full spectrum information makes variations available in different wavelength ranges, each providing data on specific characteristics of the material being evaluated [41]. By making the entire spectrum available as information to ML models, they have a greater amount of information with more details that help distinguish the patterns of variation among the classes studied.
In some studies, the limited availability of spectral information can change the performance of the models, and then the use of artificial neural networks (ANN) becomes an efficient alternative, especially when the data is reduced to bands, as demonstrated in the accuracy of the models tested (Figure 3). This is because neural networks are capable of learning non-linear patterns, guaranteeing good performance in a variety of problem-solving situations, even when the data available is not as detailed [42].
ANNs have many applications, especially in artificial intelligence, using this model for automatic control, information processing, and pattern recognition [43]. Ref. [44] using ANN models, achieved a high correlation coefficient between estimated and observed corn grain yield and also showed acceptable errors in yield estimation, making it the best model for predicting harvest area and soybean production [45].
Our findings highlight the importance of exploiting high-resolution spectral data, such as that provided by hyperspectral curves, to maximize the accuracy of classification models in agronomic research. The clear distinction between irrigation management in the spectral curve and among bands, especially in the NIR bands, highlights the importance of using data from this spectral region to identify management variations, reinforcing its applicability in monitoring and decision-making in the field. Thus, the adoption of machine-learning techniques associated with the use of hyperspectral data can provide a specialized methodology to optimize agricultural practices and increase management efficiency in soybean crops. In future work, the use of more irrigation blades to ascertain different water deficits in soybeans and other crops should be assessed, as well as the use of thermal sensors that can help in classification and even in yield-prediction tasks.

5. Conclusions

The distinction between the managements was most evident in the near-infrared (NIR) and short-wave infrared (SWIR) regions, which cover the spectral intervals of 700 to 1300 nm and 1300 to 2500 nm, respectively.
The results demonstrate the effectiveness of machine-learning models in differentiating soybean management under rainfed and irrigated conditions, highlighting the advantage of hyperspectral data (WL) over selected spectral bands (SB).
Models such as the support vector machine (SVM) showed the best levels of accuracy when using the entire available spectrum with average Kappa and F-score values close to 1.0 and a correct classification rate close to 100%. On the other hand, artificial neural networks (ANN) performed well with spectral band data, demonstrating their ability to work with smaller data sets without compromising the classification, with average Kappa and F-score values close to 0.8 and a correct classification rate close to 90%.

Author Contributions

Conceptualization, I.C.d.O. and R.G.; methodology, D.C.S., R.d.C.F.A., A.C.d.S.C.S. and P.E.T.; software, D.C.S.; validation, L.P.R.T., C.A.d.S.J. and F.H.R.B.; formal analysis, D.C.S.; investigation, I.C.d.O. and R.G.; resources, P.E.T.; data curation, P.E.T.; writing—original draft preparation, I.C.d.O.; writing—review and editing, R.G.d.S. and M.F.C.; visualization, D.C.S.; supervision, P.E.T.; project administration, R.G.; funding acquisition, R.d.C.F.A. All authors have read and agreed to the published version of the manuscript.

Funding

This research received no external funding.

Data Availability Statement

The raw data supporting the conclusions of this article will be made available by the authors on request.

Conflicts of Interest

The authors declare no conflict of interest.

References

  1. Bornhofen, E.; Benin, G.; Galvan, D.; Flores, M.F. Épocas de Semeadura e Desempenho Qualitativo de Sementes de Soja. Pesqui. Agropecu. Trop. 2015, 45, 46–55. [Google Scholar] [CrossRef]
  2. Mertz-Henning, L.M.; Ferreira, L.C.; Henning, F.A.; Mandarino, J.M.G.; Santos, E.D.; Oliveira, M.C.N.D.; Nepomuceno, A.L.; Farias, J.R.B.; Neumaier, N. Effect of Water Deficit-Induced at Vegetative and Reproductive Stages on Protein and Oil Content in Soybean Grains. Agronomy 2017, 8, 3. [Google Scholar] [CrossRef]
  3. Soba Hidalgo, D.; Arrese-Igor Sánchez, C.; Aranjuelo Michelena, I. Additive Effects of Heatwave and Water Stresses on Soybean Seed Yield Is Caused by Impaired Carbon Assimilation at Pod Formation but Not at Flowering. Plant Sci. 2022, 321, 111320. [Google Scholar] [CrossRef] [PubMed]
  4. Wijewardana, C.; Reddy, K.R.; Krutz, L.J.; Gao, W.; Bellaloui, N. Drought Stress Has Transgenerational Effects on Soybean Seed Germination and Seedling Vigor. PLoS ONE 2019, 14, e0214977. [Google Scholar] [CrossRef] [PubMed]
  5. RRodrigues, S.A.; Peiter, M.X.; Robaina, A.D.; Bruning, J.; Piroli, J.D.; Gollo, E.D.A. Oil Content and Economic Water Productivity of Soybean Cultivars under Different Water Availability Conditions. Ciência Rural 2022, 53, e20210836. [Google Scholar] [CrossRef]
  6. Kumar, L.; Schmidt, K.; Dury, S.; Skidmore, A. Imaging Spectrometry and Vegetation Science. In Imaging Spectrometry: Basic Principles and Prospective Applications; Springer: Berlin/Heidelberg, Germany, 2001; pp. 111–155. [Google Scholar]
  7. Zhu, L.; Suomalainen, J.; Liu, J.; Hyyppä, J.; Kaartinen, H.; Haggren, H. A Review: Remote Sensing Sensors. In Multi-Purposeful Application of Geospatial Data; IntechOpen: Rijeka, Croatia, 2018; pp. 19–42. [Google Scholar]
  8. Santana, D.C.; Cotrim, M.F.; Flores, M.S.; Baio, F.H.R.; Shiratsuchi, L.S.; da Silva Junior, C.A.; Teodoro, L.P.R.; Teodoro, P.E. UAV-Based Multispectral Sensor to Measure Variations in Corn as a Function of Nitrogen Topdressing. Remote Sens. Appl. 2021, 23, 100534. [Google Scholar] [CrossRef]
  9. Karakatič, S.; Podgorelec, V. Improved Classification with Allocation Method and Multiple Classifiers. Inf. Fusion 2016, 31, 26–42. [Google Scholar] [CrossRef]
  10. Santana, D.C.; Teodoro, L.P.R.; Baio, F.H.R.; dos Santos, R.G.; Coradi, P.C.; Biduski, B.; da Silva Junior, C.A.; Teodoro, P.E.; Shiratsuchi, L.S. Classification of Soybean Genotypes for Industrial Traits Using UAV Multispectral Imagery and Machine Learning. Remote Sens. Appl. 2023, 29, 100919. [Google Scholar] [CrossRef]
  11. Wei, Y.; Li, X.; Pan, X.; Li, L. Nondestructive Classification of Soybean Seed Varieties by Hyperspectral Imaging and Ensemble Machine Learning Algorithms. Sensors 2020, 20, 6980. [Google Scholar] [CrossRef]
  12. de Medeiros, A.D.; Capobiango, N.P.; da Silva, J.M.; da Silva, L.J.; da Silva, C.B.; dos Santos Dias, D.C.F. Interactive Machine Learning for Soybean Seed and Seedling Quality Classification. Sci. Rep. 2020, 10, 11267. [Google Scholar] [CrossRef]
  13. Gava, R.; Santana, D.C.; Cotrim, M.F.; Rossi, F.S.; Teodoro, L.P.R.; da Silva Junior, C.A.; Teodoro, P.E. Soybean Cultivars Identification Using Remotely Sensed Image and Machine Learning Models. Sustainability 2022, 14, 7125. [Google Scholar] [CrossRef]
  14. dos Santos, H.G.; JACOMINE, P.K.T.; Dos Anjos, L.H.C.; De Oliveira, V.A.; Lumbreras, J.F.; Coelho, M.R.; De Almeida, J.A.; de Araujo Filho, J.C.; De Oliveira, J.B.; Cunha, T.J.F. Sistema Brasileiro de Classificação de Solos; Embrapa: Brasília, DF, Brazil, 2018; ISBN 8570358172. [Google Scholar]
  15. Allen, R.G. Crop Evapotranspiration. FAO Irrig. Drain. Pap. 1998, 56, 60–64. [Google Scholar]
  16. da Silva Junior, C.A.; Nanni, M.R.; Shakir, M.; Teodoro, P.E.; de Oliveira-Júnior, J.F.; Cezar, E.; de Gois, G.; Lima, M.; Wojciechowski, J.C.; Shiratsuchi, L.S. Soybean Varieties Discrimination Using Non-Imaging Hyperspectral Sensor. Infrared Phys. Technol. 2018, 89, 338–350. [Google Scholar] [CrossRef]
  17. Gregori, G.S.D.; de Souza Loureiro, E.; Amorim Pessoa, L.G.; Azevedo, G.B.D.; Azevedo, G.T.D.O.S.; Santana, D.C.; Oliveira, I.C.D.; Oliveira, J.L.G.D.; Teodoro, L.P.R.; Baio, F.H.R. Machine Learning in the Hyperspectral Classification of Glycaspis brimblecombei (Hemiptera Psyllidae) Attack Severity in Eucalyptus. Remote Sens. 2023, 15, 5657. [Google Scholar] [CrossRef]
  18. Bouckaert, R.R.; Frank, E.; Hall, M.; Kirkby, R.; Reutemann, P.; Seewald, A.; Scuse, D. WEKA Manual for Version 3-7-3; The University of WAIKATO: Hamilton, New Zealand, 2010; Volume 327. [Google Scholar]
  19. Song, G.; Wang, Q. Species Classification from Hyperspectral Leaf Information Using Machine Learning Approaches. Ecol. Inform. 2023, 76, 102141. [Google Scholar] [CrossRef]
  20. Hennessy, A.; Clarke, K.; Lewis, M. Hyperspectral Classification of Plants: A Review of Waveband Selection Generalisability. Remote Sens. 2020, 12, 113. [Google Scholar] [CrossRef]
  21. Omeer, A.A.; Deshmukh, R.R. Improving the Classification of Invasive Plant Species by Using Continuous Wavelet Analysis and Feature Reduction Techniques. Ecol. Inform. 2021, 61, 101181. [Google Scholar] [CrossRef]
  22. Nakaji, T.; Oguma, H.; Nakamura, M.; Kachina, P.; Asanok, L.; Marod, D.; Aiba, M.; Kurokawa, H.; Kosugi, Y.; Kassim, A.R. Estimation of Six Leaf Traits of East Asian Forest Tree Species by Leaf Spectroscopy and Partial Least Square Regression. Remote Sens. Environ. 2019, 233, 111381. [Google Scholar] [CrossRef]
  23. Staniak, M.; Księżak, J.; Bojarszczuk, J.; Feledyn-Szewczyk, B. Gas Exchange Parameters in Red Cover (Trifolium pratense L.) and Festulolium (Festulolium braunii (K. Richt) A. Camus) under Drought Stress. Appl. Ecol. Environ. Res. 2019, 17, 213–230. [Google Scholar] [CrossRef]
  24. Khan, M.J.; Khan, H.S.; Yousaf, A.; Khurshid, K.; Abbas, A. Modern Trends in Hyperspectral Image Analysis: A Review. IEEE Access 2018, 6, 14118–14129. [Google Scholar] [CrossRef]
  25. Sperry, J.S.; Love, D.M. What Plant Hydraulics Can Tell Us about Responses to Climate-change Droughts. New Phytol. 2015, 207, 14–27. [Google Scholar] [CrossRef] [PubMed]
  26. Dong, Z. A Primary Discussion on High Velocity of Plant Transpiration. Chin. Agric. Sci. Bull. 2010, 26, 131–135. [Google Scholar]
  27. Ma, X.; He, Q.; Zhou, G. Sequence of Changes in Maize Responding to Soil Water Deficit and Related Critical Thresholds. Front. Plant Sci. 2018, 9, 511. [Google Scholar] [CrossRef] [PubMed]
  28. Blum, A.; Blum, A. Plant Water Relations, Plant Stress and Plant Production. In Plant Breeding for Water-Limited Environments; Springer: Berlin/Heidelberg, Germany, 2011; pp. 11–52. [Google Scholar]
  29. Pinheiro, C.; Chaves, M.M. Photosynthesis and Drought: Can We Make Metabolic Connections from Available Data? J. Exp. Bot. 2011, 62, 869–882. [Google Scholar] [CrossRef]
  30. El-Hendawy, S.E.; Al-Suhaibani, N.A.; Elsayed, S.; Hassan, W.M.; Dewir, Y.H.; Refay, Y.; Abdella, K.A. Potential of the Existing and Novel Spectral Reflectance Indices for Estimating the Leaf Water Status and Grain Yield of Spring Wheat Exposed to Different Irrigation Rates. Agric. Water Manag. 2019, 217, 356–373. [Google Scholar] [CrossRef]
  31. Junttila, S.; Hölttä, T.; Saarinen, N.; Kankare, V.; Yrttimaa, T.; Hyyppä, J.; Vastaranta, M. Close-Range Hyperspectral Spectroscopy Reveals Leaf Water Content Dynamics. Remote Sens. Environ. 2022, 277, 113071. [Google Scholar] [CrossRef]
  32. Crusiol, L.G.T.; Sun, L.; Sun, Z.; Chen, R.; Wu, Y.; Ma, J.; Song, C. In-Season Monitoring of Maize Leaf Water Content Using Ground-Based and UAV-Based Hyperspectral Data. Sustainability 2022, 14, 9039. [Google Scholar] [CrossRef]
  33. Ronay, I.; Ephrath, J.E.; Eizenberg, H.; Blumberg, D.G.; Maman, S. Hyperspectral Reflectance and Indices for Characterizing the Dynamics of Crop–Weed Competition for Water. Remote Sens. 2021, 13, 513. [Google Scholar] [CrossRef]
  34. Sims, D.A.; Gamon, J.A. Estimation of Vegetation Water Content and Photosynthetic Tissue Area from Spectral Reflectance: A Comparison of Indices Based on Liquid Water and Chlorophyll Absorption Features. Remote Sens. Environ. 2003, 84, 526–537. [Google Scholar] [CrossRef]
  35. Santana, D.C.; de Queiroz Otone, J.D.; Baio, F.H.R.; Teodoro, L.P.R.; Alves, M.E.M.; da Silva Junior, C.A.; Teodoro, P.E. Machine Learning in the Classification of Asian Rust Severity in Soybean Using Hyperspectral Sensor. Spectrochim. Acta Part A Mol. Biomol. Spectrosc. 2024, 313, 124113. [Google Scholar] [CrossRef]
  36. de Queiroz Otone, J.D.; Theodoro, G.D.F.; Santana, D.C.; Teodoro, L.P.R.; de Oliveira, J.T.; de Oliveira, I.C.; da Silva Junior, C.A.; Teodoro, P.E.; Baio, F.H.R. Hyperspectral Response of the Soybean Crop as a Function of Target Spot (Corynespora cassiicola) Using Machine Learning to Classify Severity Levels. AgriEngineering 2024, 6, 330–343. [Google Scholar] [CrossRef]
  37. Poornima, S.; Kavitha, S.; Mohanavalli, S.; Sripriya, N. Detection and Classification of Diseases in Plants Using Image Processing and Machine Learning Techniques. AIP Conf. Proc. 2019, 2095, 030018. [Google Scholar]
  38. Srunitha, K.; Padmavathi, S. Performance of SVM Classifier for Image Based Soil Classification. In Proceedings of the 2016 International Conference on Signal Processing, Communication, Power and Embedded System (SCOPES), Paralakhemundi, India, 3–5 October 2016; pp. 411–415. [Google Scholar]
  39. Shailendra, R.; Jayapalan, A.; Velayutham, S.; Baladhandapani, A.; Srivastava, A.; Kumar Gupta, S.; Kumar, M. An IoT and Machine Learning Based Intelligent System for the Classification of Therapeutic Plants. Neural Process. Lett. 2022, 54, 4465–4493. [Google Scholar] [CrossRef]
  40. Kan, H.X.; Jin, L.; Zhou, F.L. Classification of Medicinal Plant Leaf Image Based on Multi-Feature Extraction. Pattern Recognit. Image Anal. 2017, 27, 581–587. [Google Scholar] [CrossRef]
  41. Britz, R.; Barta, N.; Klingler, A.; Schaumberger, A.; Bauer, A.; Pötsch, E.M.; Gronauer, A.; Motsch, V. Hyperspectral-Based Classification of Managed Permanent Grassland with Multilayer Perceptrons: Influence of Spectral Band Count and Spectral Regions on Model Performance. Agriculture 2022, 12, 579. [Google Scholar] [CrossRef]
  42. Narkhede, M.V.; Bartakke, P.P.; Sutaone, M.S. A Review on Weight Initialization Strategies for Neural Networks. Artif. Intell. Rev. 2022, 55, 291–322. [Google Scholar] [CrossRef]
  43. Huixian, J. The Analysis of Plants Image Recognition Based on Deep Learning and Artificial Neural Network. IEEE Access 2020, 8, 68828–68841. [Google Scholar] [CrossRef]
  44. García-Martínez, H.; Flores-Magdaleno, H.; Ascencio-Hernández, R.; Khalil-Gardezi, A.; Tijerina-Chávez, L.; Mancilla-Villa, O.R.; Vázquez-Peña, M.A. Corn Grain Yield Estimation from Vegetation Indices, Canopy Cover, Plant Density, and a Neural Network Using Multispectral and RGB Images Acquired with Unmanned Aerial Vehicles. Agriculture 2020, 10, 277. [Google Scholar] [CrossRef]
  45. Abraham, E.R.; Mendes dos Reis, J.G.; Vendrametto, O.; Oliveira Costa Neto, P.L.D.; Carlo Toloi, R.; Souza, A.E.D.; Oliveira Morais, M.D. Time Series Prediction with Artificial Neural Networks: An Analysis Using Brazilian Soybean Production. Agriculture 2020, 10, 475. [Google Scholar] [CrossRef]
Figure 1. Location of the experiment and distribution of treatments.
Algorithms 17 00542 g001
Figure 2. Schematic diagram of data collection and processing for the experiment.
Algorithms 17 00542 g002
Figure 3. Hyperspectral signature of soybean cultivars under irrigated and rainfed management.
Algorithms 17 00542 g003
Figure 4. Spectral behavior of soybean materials under irrigated and rainfed management in the 28 spectral bands.
Algorithms 17 00542 g004
Figure 5. Comparison of means for Kappa coefficient to evaluate the performance of machine-learning models in the classification of irrigated and non-irrigated soybeans using different spectral inputs.Different uppercase letters differ in spectral inputs, and different lowercase letters differ in machine-learning models.
Algorithms 17 00542 g005
Figure 6. Comparison of means for correct classification (CC) to evaluate the performance of machine-learning models in the classification of irrigated and non-irrigated soybeans using different spectral inputs. Different uppercase letters differ in spectral inputs, and different lowercase letters differ in machine-learning models.
Algorithms 17 00542 g006
Figure 7. Comparison of means for F-score to evaluate the performance of machine-learning models in the classification of irrigated and non-irrigated soybeans using different spectral inputs.
Algorithms 17 00542 g007
Disclaimer/Publisher’s Note: The statements, opinions and data contained in all publications are solely those of the individual author(s) and contributor(s) and not of MDPI and/or the editor(s). MDPI and/or the editor(s) disclaim responsibility for any injury to people or property resulting from any ideas, methods, instructions or products referred to in the content.