Abstract
Aiming at the problem that the surface defects of blAister tablets are difficult to detect correctly, this paper proposes a detection method based on the improved U2Net. First, the features extracted from the RSU module of U2Net are enhanced and adjusted using the large kernel attention mechanism, so that the U2Net model strengthens its ability to extract defective features. Second, a loss function combining the Gaussian Laplace operator and the cross-entropy function is designed to make the model strengthen its ability to detect edge defects on the surface of blister tablets. Finally, thresholds are adaptively determined using the local mean and OTSU(an adaptive threshold segmentation method) method to improve accuracy. The experimental results show that the method proposed in this paper can reach an average accuracy of 99% and an average precision rate of 96.3%; the model test only takes 50 ms per image, which can meet the rapid detection requirements. Minor surface defects can also be accurately detected, which is better than other algorithmic models of the same type, proving the effectiveness of this method.
1. Introduction
In the pharmaceutical industry, the detection of surface defects on tablets is a key step to ensure the safety, effectiveness, and market acceptance of drugs. According to the requirements of GMP (Good Manufacturing Practice) and ICH Q9 (Quality Risk Management), all stages of tablet production from raw material preparation, compression, to packaging must undergo strict appearance inspection to ensure that the tablet surface is free of defects such as damage, scratches, and contamination [1,2]. These defects not only affect the appearance of the tablets but also lead to more serious consequences, such as incomplete disintegration of the tablets during administration, which affects the dissolution and efficacy of the drug. These risks make the detection of surface defects in tablets a core quality-control point in pharmaceutical production.
The eligibility criteria for tablet surface defects require that tablets must achieve strict visual and functional consistency. First, the surface of the tablet must be smooth and free of scratches. Any such defect will result in uneven internal disintegration of the tablet, affecting the accuracy of administration. Scratches not only affect the appearance of the tablet but also may cause the tablet to crack during patient administration, affecting the efficacy of the drug [1]. Second, the surface of the tablet must be kept clean and free of contaminants, including the presence of black spots or other foreign objects. The presence of pollutants not only affects the physical stability of tablets but also poses a threat to the health of patients, as it may cause adverse reactions or reduce the effectiveness of the drugs [1].
In the tablet testing process, nonconformities are usually divided into serious defects and minor defects. Serious defects include those that may directly affect the function, safety, or efficacy of the tablet, and such defects must be reported immediately, and corrective action taken, to prevent nonconforming products from entering the market. Common serious defects include scratches, contaminants, and breakage [1,2]. Scratches or damage usually occur in the tablet pressing process. Due to uneven mold pressure or equipment failure, these defects will lead to incomplete disintegration of the tablet during use and inaccurate release dose, which directly affects the efficacy of the tablet [1]. The source of contaminants may be wear and tear of equipment, unclean operating conditions, or operator error. Contaminated tablets not only affect appearance but also pose health risks to patients and must be destroyed or reprocessed immediately [3].
Common minor defects include slight scratches on the surface of the tablet or small dents on the surface. Such defects usually occur during the packaging, transportation, or storage of the tablets and do not affect the function or dose release of the tablets. For example, a slight scratch on the surface of a pill, although it does not affect the efficacy of the drug, may affect the image of the product in the market [1,2].
Most of the general packaging of tablets is in the form of blister packaging, which ensures the integrity of the tablets while also solving the problem of hygiene during transportation. Therefore, how to detect it completely and accurately is of great significance for ensuring the quality and safety of drugs [4,5].
The surface defect detection method for blister tablets has experienced a process of development from traditional methods to intelligent detection today. The traditional methods mainly include human methods and extraction of defect features + classification [6,7]. Human method: this method detects defective tablets using human senses, relying on the human eye. Classification method after extraction of defect features: manually designing different rules for different defects, e.g., based on area, size, circumference, curvature, and determining which are defects according to these rules. Such traditional methods generally have the disadvantages of poor robustness and low detection effect. The intelligent detection method refers to the use of deep learning models to overcome the above shortcomings in an automatic detection method. Therefore, this paper studies the defect detection of blister tablets based on a deep learning model.
Challenges in blister tablets defect detection:
- (1)
- Small target characteristics: defects on tablets are usually small and subtle, irregular in shape, and easily masked by information from other areas. This makes it more difficult to extract image features, resulting in lower accuracy of defect recognition.
- (2)
- Multi-scale detection problem: the size of the defect image is different, and the size of the defect is also very different, so it is difficult to detect defects of different sizes.
- (3)
- Edge detection problems: whether or not the defective edge of a blister tablet can be completely detected is an important indicator of whether or not the defect is completely detected.
In order to solve the above problems and accurately detect defects in tablets of different sizes, locations, and shapes, this paper uses the U2Net [8] basic model and improves on it. In order to improve the detection capability of U2Net, this paper combines the large kernel attention mechanism with the RSU module of U2Net to enhance the attention to model sensory fields and local defects, and to cope with small target defects. A new loss function is designed using Gaussian Laplacian operator and cross-entropy function to make the model pay attention to the edge defects of the blister tablets. After strengthening the detection ability of the model as a whole, the local mean and OTSU methods are used to adaptively determine the segmentation threshold, enhance the output effect, and suppress the interference.
The contributions are as follows:
- (1)
- The semantic segmentation model is used for the first time to detect the defects of blister tablets, which can not only detect the defects but also detect the size, shape, and position.
- (2)
- The U2Net model is improved, so that the model detection ability is improved and the fine defects can be clearly detected.
- (3)
- For the first time, the method of determining segmentation threshold by local mean and OTSU is proposed to determine the accuracy of segmentation.
2. Related Works
The traditional methods are mainly used to detect defects by feature extraction and classification. Fang [9] used fast robust features to extract defective features of effervescent tablets and performed svm classification for detection. Yu Het al. [10] used the OTSU method, that is, the global threshold image segmentation method, to process the image of the blister tablets and obtain the image of the defect. Wu Wet al. [11] used a Canny algorithm based on edge detection technology to detect the edge of blister tablets. Chen Yet al. [12] converted the image into hsv color space, divided the bubble-cap region and tablet region, extracted the corresponding feature parameters, and then used a BP neural network classification algorithm to identify the corresponding defects. Although this type of detection method can also better detect surface defects in blister sheets, it often relies on the use of traditional image processing methods or specific algorithms of this type. The detection results of this type of method are easily affected by noise and environment and are not robust and are easily disturbed. Due to the rapid development of deep learning for blister tablet defect detection, many methods have emerged. For example, Duan Z et al. [13] used a Mask R-CNN model to detect hollow capsules. However, Mask R-CNN, in the face of a complex boundary may show misjudgment or miscalculation. The complex inference time of the model is slow, and it is difficult to meet the needs of detection. Huang [14] proposed a YOLOv5-DEI network model combining deformation convolution and void convolution to detect surface defects of tablets. In this kind of model, only the position of the defect can be obtained, but the shape and size of the defect cannot be obtained, and the calculation complexity is high.
In order to accurately detect blister tablets, a semantic segmentation model was adopted in this paper [15,16,17,18]. Semantic segmentation localizes defects at the pixel level, providing finer information about defect boundaries and shapes. This helps to accurately recognize and evaluate defects and can handle irregular and multi-scale defects. For example, Wu Z et al. [19] developed an improved defect segmentation method for U2Net, adjusted the expansion factor of the mixed expansion convolution of the residual module, and added the coordinate attention mechanism in the last layer of all Rsu, which reduced the influence of the residual blocks in the coding and decoding process of the original network and improved the model’s detection effect on scratches. Wang Y et al. [20] proposed a U2Net-based defect detection algorithm for metal surfaces and designed a U-shaped attention coding module which can increase the weight of defect area during coding, suppress background noise, and enhance the detection effect. Cheng et al. [21] improved the original residual module by using depth-separable convolution and proposed a new residual module to enhance crack detection on the surface of concrete structures.
Inspired by the above, this paper uses the large kernel attention mechanism combined with the RSU module of U2Net to improve the detection capability of the U2Net model and proposes a loss function composed of Gaussian Laplace and cross entropy to enhance the edge detection capability. Finally, the local mean method and OTSU method are used to improve the accuracy.
3. Experimental Data Acquisition
The experimental data were captured using a smartphone, and a total of 200 data images were collected from blister tablets with defects such as breakage, scratches, and stains. Figure 1 shows samples of each type of defect, and the dataset was expanded to 2000 using added noise, mirroring, and changing contrast. These were manually labelled using Labelme version 5.4.1 software and divided into a training set of 1200 sheets, a validation set of 400 sheets, and a test set of 400 sheets.
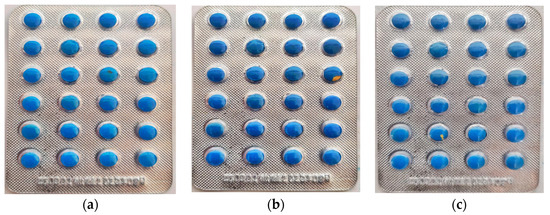
Figure 1.
Sample of blister tablet defects: (a) surface stain; (b) surface damage; (c) surface scratch.
4. Proposed Methods
4.1. U2Net Detection Models
U2Net is a deep learning network model based on a semantic segmentation proposed in 2020, which is widely used in saliency detection tasks. U2Net is based on an encoding–decoding structure, which introduces a variant of the UNet structure. U2Net is characterized by having an inner and an outer layer, with the outer layer adopting a U-shape structure and the inner layer adopting a U-shape structure as well, which is referred to as a double U-shape structure. In the external U-shaped structure, encoders and decoders are used to effectively capture features at different scales. The internal U-shaped structure contains a small UNet structure at each stage of the encoder and decoder, which is called the RSU module. When the features of the input image are collected through the RSU module, a wider receptive field can be obtained by using expansive convolution without increasing the amount of computation. This design is used to capture local features and edge information, making the segmentation results more accurate.
While U2Net’s strengths are great, there are still shortcomings. The main manifestation of this is the loss of detail information after constant sampling by the RSU module. At the same time, due to the use of conventional convolutional kernel, in the boundary, details cannot be captured with sufficient accuracy, which easily leads to the lack of edge information. The task of this paper is to detect defects in blister tablets, and a significant portion of these defects are located at the edges of the tablets, because the edges of the tablets are more prone to defects. To solve these problems, this paper introduces the large kernel attention mechanism.
4.2. Large Kernel Attention Mechanism
In 2022 Guo et al. [22] proposed a new linear attention mechanism, the Large Kernel Attention (LKA) mechanism, which was specifically studied for visual tasks. LKA combines the advantages of convolution and self-attention, having the ability to be sensitive enough to the structural information of the local context while receiving a large range of feature information. It also has the advantage of dynamically adjusting the weights. LKA allows for spatial dimension adaptation and channel dimension adaptation. These advantages overcome the lack of traditional attention mechanisms for the channel dimension. The composition of the LKA convolution module is represented in Figure 2. LKA decomposes a large K × K kernel convolution into three parts, a K/d × K/d depth-wise convolution, a 2d × 2d depth-wise dilation convolution, and a 1 × 1 convolution, where d denotes the dilatation rate, and, by means of this decomposition, accommodates the large sensory field and the attention to the localized regions.
where F is the feature tensor of the input image; DW_D_Conv, DW_Conv and are depth-wise dilation convolution, depth-wise convolution and 1 × 1 convolution, respectively; and is the weight parameter.
where Output represents the output features and represents the product operation of the feature tensor.

Figure 2.
LKA convolution module composition. (a) Depth-wise convolution; (b) Depth-wise dilation convolution; (c) 1 × 1 convolution; (d) LKA convolution.
Figure 3 represents the process of working of the LKA mechanism. The input in the left green box for LKA is the tensor F extracted by convolution. This tensor contains the local and global information extracted after multi-layer convolution processing. The output of the LKA in the green box on the right is the enhanced feature. The output of LKA module is the enhanced feature after multi-layer convolution, depth-wise convolution (DW_Conv), depth-wise dilation convolution (DW_D_Conv).

Figure 3.
Working process of LKA mechanism.
4.3. Combination of U2Net and LKA
The RSU module is the core component of U2Net for feature extraction and multi-scale fusion, which plays a very important role in accurate segmentation and efficient processing. LKA has both a broad acceptance area and a local focus. In order to change the information loss caused by the RSU module in the feature extraction stage after downsampling, which leads to the reduction of segmentation accuracy and affects the defect detection effect, in this paper, we investigate the use of LKA as the sampling component of the RSU module. There are two types of RSU modules; the first one is called RSU-L where L denotes the number of convolutional layers, and the second one is called RSU-4F. The difference between RSU and RSU-4F is that when the image is continuously sampled by the RSU-L layer, the feature size of the input image is already very small; in order to prevent the feature information from being lost, instead of using downsampling and upsampling in the next processing, the size of the features is kept constant by directly using the inflated convolution, and this is called the RSU-4F module.
In this paper, based on the original RSU module, the LKA mechanism is introduced. Since LKA is composed of depth-wise convolution, depth-wise dilation convolution, and channel convolution, it makes the model obtain more sufficient feature information and has enough focus on small-size defective regions. As shown in Figure 4, the RSU module and LKA form a new module, which is referred to as the RSLU module in this paper. For the RSU-4F module, since the resolution size of the image features is already very small after the upsampling of the RSLU-L layer, it has little spatial information and does not improve the accuracy of the model much. Therefore, the original RSU-4F module is still used in this study.
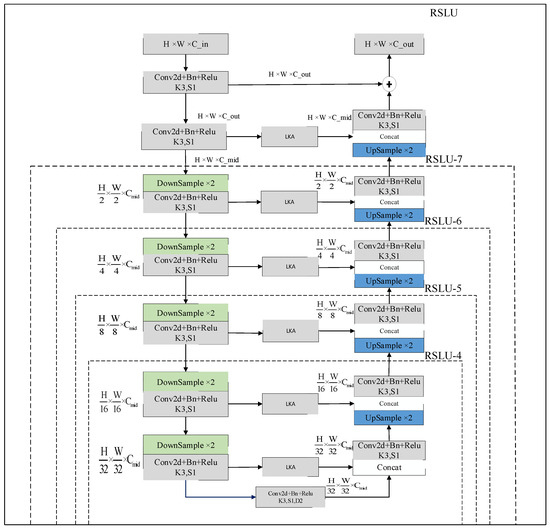
Figure 4.
RSLU module.
In Figure 4, the input image is first converted into a tensor by a normal convolution layer in preparation for the subsequent use of RSLU. The input image is first passed through the RSLU-7 layer, in which the features of size H × W extracted by the ordinary convolutional layer are accepted, and the output of size H/2 × W/2 is obtained after 1/2 downsampling. The output is used as the input to the LKA, which decomposes it into a depth-wise convolution of size H/2d × W/2d, a 2d × 2d depth-wise dilation convolution, and a 1 × 1 channel convolution, and then splices it with the features obtained from the upsampling to obtain feature fusion through the convolutional layer. When the processing of the first feature fusion of RSLU-7 is completed, the remaining sampling is performed sequentially, and the feature size of the image after five samples is H/32 × W/32. Finally, the downsampling and upsampling of the RSLU-7 layer are completed to obtain the feature fusion map, and the remaining RSLU layers are completed sequentially.
In Figure 4, H and W represent the height and width of the input image, respectively; Con2d performs convolution to extract features; Bn and Relu are used for batch normalization and activation function; K3 refers to the convolution kernel size of 3 × 3; S1 refers to the step size of 1; 2 indicates the expansion factor of 2.
4.4. Loss Function Consisting of Gaussian Laplace Operator and Cross-Entropy Function
Since this paper targets the defect detection of blister tablets, the key to detection is to be able to detect the edges of the defects, that is, the model should be able to accurately segment the edges of the defects when utilizing U2Net for segmentation. Starting from the design of the loss function, the intention is to guide the model to strengthen the ability of segmentation detection of defect edges.
The Laplace operator [23] is a second-order differential operator specialized in image processing and suitable for edge detection. The Laplace operator captures rapidly changing regions in an image, which usually correspond to edges, by calculating the second-order derivatives of the grey values of the image. However, just applying only the Laplacian operator does not solve the problem effectively, mainly because the process of extracting the features of the model is easy to be mixed with noise; in order to eliminate the noise, the noise of the defective image is eliminated by using a Gaussian filter [24], so, in this paper, the Laplacian of Gaussian (LoG) operator is used.
Equation (3) is a Gaussian filter, where x and y are the distances of the pixel positions relative to the center of the convolution kernel, and is the standard deviation of the Gaussian kernel, which controls the width of the Gaussian function.
Equation (4) is a second-order differential operator of the Laplace operator used to calculate the second-order rate of change of the grey values of the image.
Combining the Gaussian filter with the Laplace operator yields the Gaussian Laplace operator based on Gaussian filter smoothing, as shown in Equation (5). G(x,y) is the Gaussian kernel, f(x,y) is the grey value of the image at coordinates x,y, and ∗ denotes the convolution operation.
On the basis of these theoretical derivations, this paper gives the loss function based on the combination of Gaussian Laplacian operators, as shown in Equation (6), where PG(x,y) and Ps(x,y) are the pixel values of the true values, respectively, the predicted values of the model are located at the coordinates x,y, respectively, and h,w are the height and width of the image, respectively.
Cross-entropy loss function is one of the methods commonly used by U2-Net to measure the true and predicted values. This approach directs the model to learn faster, but the disadvantage is that the pixels of the image are focused all consistently without a focus point, which results in insufficient attention to the edges. The cross-entropy loss function is shown in Equation (7).
In summary of the above study, this paper adopts a loss function that combines the Gaussian Laplace operator and the cross-entropy function as the loss function of the model. Equation (8) is a new loss function called GLoss taken in this paper; γ denotes the weight of the edge loss. This design makes the model learn faster and at the same time have more attention to defective segmentation of the edges.
4.5. Segmentation Threshold Determination Based on Local Mean and OTSU Method
The improved model outputs a prediction map, which requires an artificial setting of a segmentation threshold according to which the prediction map is binarized, so this step is very important for the final output. In order to ensure the accuracy of the overall results, the thresholds were determined adaptively using the local mean method [25] and the OTSU [26] method.
The OTSU method is also known as maximum inter-class variance thresholding segmentation algorithm. The local mean method takes the local mean as the threshold value of the pixel and binarizes each pixel; if the pixel value is greater than the local mean, it is set as foreground; otherwise, it is set as background. The local mean method deals with local information in the image and is able to deal with images with uneven illumination, while the OTSU method deals with global information and is able to deal with images with high overall contrast.
In Equation (9) is the computational principle of the OTSU method; t is the maximum threshold of inter-class variance, and are the proportion of pixels on both sides of the threshold t, and and are the mean values of pixels on both sides of the threshold t, respectively.
Equation (10) is the calculation principle of the local mean method; I(i,j) is the grey value of the image; n represents the size of the window, which refers to the processing of the image selected a rectangular region; the value of n is in accordance with the image of the smallest side of the length of the 1/20 to obtain, and is set to an odd number not less than 3.
Equation (11) is the principle of segmentation thresholding by combining the local mean and OTSU methods, where k denotes the adjustment parameter, which is used to control the effect of the local mean on the threshold, and and denote the standard deviation and the mean value of the image, respectively, and T(i,j) is the segmentation threshold that is acquired adaptively.
Figure 5 shows the schematic diagram of the improved defect segmentation model based on U2Net. The first four layers are RSLU modules based on the large kernel concern mechanism, and the last two layers are RSU-4F modules, which fuse the output defect diagram and then adjust the output final defect segmentation diagram by local mean and OTSU. The blue box is the encoder used to progressively reduce the spatial resolution of the feature map while extracting advanced features. The green box represents the decoder used to restore the spatial resolution of the feature map.
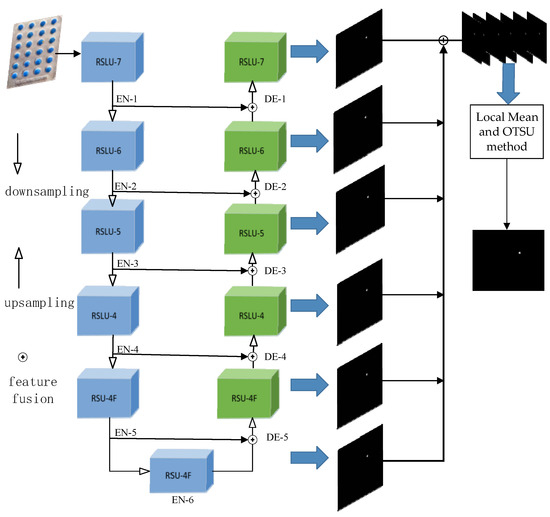
Figure 5.
Blister tablet segmentation network structure.
4.6. Overall Inspection Flowchart
Figure 6 shows the general flow chart of the method in this paper. From the figure, it is clear that the method studied in this paper is based on U2Net as the basic detection model, and the improvement of U2Net finally leads to the visual detection results.
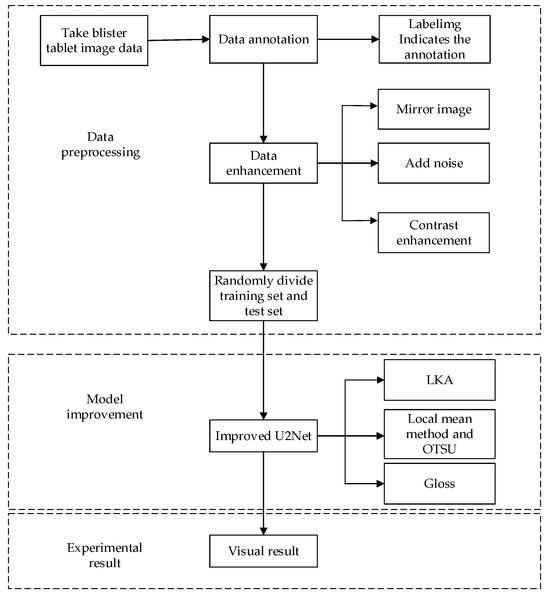
Figure 6.
Flowchart of the detection.
5. Experiments and Analysis of Results
5.1. Experimental Environment
The device used in this paper is a (GPU) IVIDIA Quadro RTX4000 with 16G of video memory; the CPU is Intel(R) UHD Graphics630; the operating system is WIN11; the deep learning framework is pytorch1.12.1, based on Python3.9; and the CUDA version is 12.4.
5.2. Evaluation Indicators
In order to accurately evaluate the effectiveness of the model in the defect detection of blister tablets, this paper selects five indicators, including the average pixel accuracy (Accuracy,Acc), precision (Precision,P), recall (Recall,R), the combined evaluation of precision and recall (β = 1), and the intersection ratio (IoU), for evaluating the overlap between predicted and actual results to evaluate the performance of the model.
In the formula, TP, TN, FP, and FN, respectively, represent the number of defect pixels correctly predicted by the model, the number of background pixels correctly predicted, the number of defect pixels incorrectly predicted, and the number of background pixels incorrectly predicted.
5.3. Training Parameter Settings
The model was trained for 350 epochs; as a result, batch_size was 4, the initial learning rate was 0.001, γ was 0.75, and the Adam optimizer was chosen. The image size of the collected blister sheet data is input into the model and adjusted to 512 × 512 width and height.
5.4. Comparison of Different Network Models
The improved U2Net model described above was compared with other models, Pspnet, Deeplabv3, and U2Net, and tested using the blister tablets defect dataset collected in this study.
Table 1 shows the evaluation index data obtained by the improved model and other models in this paper. It can be seen from the data in the table that the indicators of the method studied in this paper are higher than those of other models. The accuracy of the improved model proposed in this paper can reach 99.8%, while the accuracy of other models is lower than that of this model. The precision reached 96.3%, 1.9% higher than U2Net and higher than Pspnet and Deeplabv3. In terms of recall rate, the proposed method is 6.9% higher than the original U2Net method and 6.9% higher than the Pspnet and Deeplabv3 method. In terms of F1-Score, this method is also 4.7% higher than the U2Net method. For IoU, the proposed method is 1.3% higher than that of U2Net, much higher than that of Pspnet. The improved test time of U2Net is 0.05s, which is not much different from that of U2Net but still faster than that of Pspnet and Deeplabv3, proving that the improved U2Net can meet the fast test requirements. From the data in Table 1, it can be seen that the method studied in this paper far outperforms the other models in performance.

Table 1.
Comparison between the method proposed in this article and other models in blister tablet data.
Figure 7 represents the training dataset and validation dataset loss graphs for different models; from the curves, it can be seen that in the training phase the Pspnet model fluctuates more under the slower rate of decline, while, in the validation phase, it is Deeplabv3 with slower decline. From the figure, it can be seen that the improved U2Net is able to descend and converge quickly in both the training phase and the validation phase, and the results are more stable and convergent than all the other three models, which also shows that the improved model of the study is able to learn the task better.
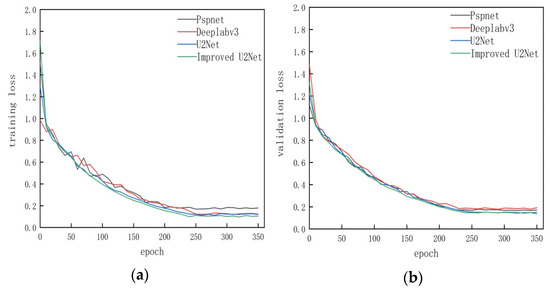
Figure 7.
Loss curves of different models. (a) Loss curve plot for the training dataset. (b) Loss curve plot for the validation dataset.
5.5. Ablation Experiment
In order to determine the impact of each part of the model studied in this paper on the performance of the segmentation detection effect, ablation experiments were carried out using the same training and validation sets, with parameters set to a batch_size of 4, an initial learning rate of 0.001, and the choice of the Adam optimizer. In the first step, the original U2net was used to train, test, and derive metrics. In the second step, the RSLU module is used instead of the original RSU module to derive the metrics, and then the loss function of Gloss is used instead of the original loss function to derive the metrics as well. Finally, the local means and thresholds of the OSTU method are combined with the previous RSLU and Gloss to derive the metrics. In Table 2, × indicates that this module is not available, while √ indicates that it is available.

Table 2.
Ablation experiments of different modules.
As can be seen from the results in Table 2, each of the modules studied in this paper has significantly improved the final results by comparison. Among them, by using the RSLU module consisting of LKA in the model with a dual-dimensional focus on channel and space, which increases the model’s attention to the defects in obvious places, the model is able to capture the details of the defects at a higher resolution, and this strengthens the accuracy of the model in dealing with the defect boundaries of the image; the introduction of a new loss function strengthens the model’s sensitivity to the defective region, whose boundaries make the model more sensitive to the defect boundary detection; and, finally, the use of local mean and OTSU in the inference stage of the model again strengthens the accuracy of the final results of the model.
5.6. Blister Tablets Visual Inspection Results
It should be noted that this paper selected serious defects such as surface stains, surface scratches, surface damage, as well as minor defects that are difficult to observe with the naked eye. For serious defects such as surface damage, surface stains, surface scratches, the original drawing before detection is represented by the capital letters A, B, C. For minor defects, the original drawing before detection is represented by a capital letter D. For each class of defects, Pspnet, Deeplabv3, and U2Net are compared with the improved U2Net presented in this paper.
In Figure 8, the object of detection is surface damage. In Pspnet model detection, Figure 8a(2) Pspnet performs poorly in damage detection, and the position of the red box is obviously offset, which fails to accurately cover the damaged area. This reflects Pspnet’s lack of global awareness when dealing with complex scenes, especially in complex backgrounds, where the model has difficulty capturing the correct location of damage. The binary segmentation results in a(3) show that the shape and size are inconsistent, and the damaged edges are fuzzy and noisy, which shows that the model cannot accurately handle the boundary segmentation. This indicates that Pspnet has deficiencies in edge detection and fails to accurately segment the damaged area.
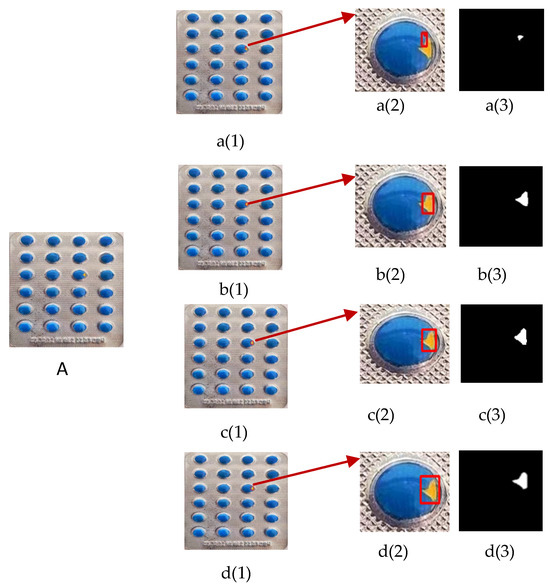
Figure 8.
Surface damage defect detection effect. (A) Surface damage images before detection; (a(1)) Pspnet detection results; (a(2)) Pspnet detection and cropping results; (a(3)) Pspnet defect segmentation binary graph results; (b(1)) Deeplabv3 detection result; (b(2)) results of Deeplabv3 detection and cropping; (b(3)) results of Deeplabv3 defect segmentation binary graph; (c(1)) U2Net test results; (c(2)) detection and cropping results of U2Net; (c(3)) U2Net defect segmentation binary graph results; (d(1)) improved U2Net detection results; (d(2)) improved U2Net detection and cropping results; (d(3)) improved U2Net defect segmentation binary graph results.
In Deeplabv3 model detection, Figure 8b(2) shows that Deeplabv3 has improved in damage detection. The red box covers part of the damaged area but fails to completely cover all damage. This shows that Deeplabv3 has a slight improvement in perceiving global information but still has the problem of missing details. The binary segmentation diagram of b(3) shows that, although the damaged area is divided, there is obvious noise at the edge and the segmentation edge is not smooth enough, indicating that the model still has inaccuracies in detail segmentation.
In the U2Net model detection, in c(2), U2Net detected most of the damaged areas, but the red box failed to completely cover the entire damaged area, and there were small areas missing detection. This reflects the limitations of U2Net in capturing damage details. The binary segmentation results in c(3) show that the edges are relatively clear, but there is still some background noise, indicating that the model has improved in the boundary accuracy and noise suppression, but these problems have not been completely solved.
In the Improve U2Net model detection, in d(2), the improved U2Net model can accurately detect and cover the damaged area, and the position of the red box is very accurate, with no obvious deviation or missing detection. LKA plays a key role here, enabling the model to efficiently perceive global information and thus accurately identify the location and shape of damage. In d(3), the binary segmentation diagram of the improved U2Net shows very smooth edges, almost no noise, and the segmentation area is completely consistent with the actual damage. This is due to the Gaussian Laplacian operator, which enhances the ability of the model to detect edges and makes the segmentation edges clearer. The cross-entropy loss function optimizes the classification of foreground (damaged area) and background, which makes the segmentation results more accurate.
In Figure 9, the object of detection is the surface stain. Pspnet performed poorly in the detection of stains in a(2). The position of the red mark box was obviously shifted, and the stained area was not covered correctly, resulting in large errors in the detection results. The binary segmentation diagram in a(3) shows that the shape and size are not accurate, and the boundary of the stain is fuzzy and has significant deviation, indicating that the model cannot effectively distinguish the stain from the background when dealing with the task of stain detection.
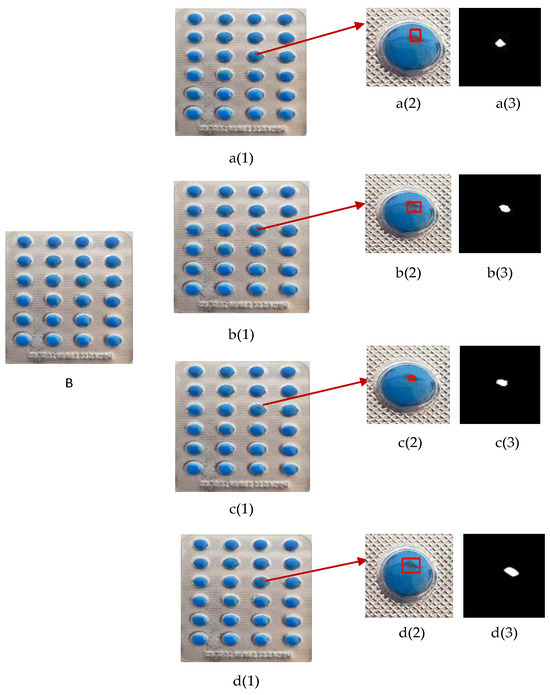
Figure 9.
Surface stains defect detection effect. (B) Surface stains images before detection; (a(1)) Pspnet detection results; (a(2)) Pspnet detection and cropping results; (a(3)) Pspnet defect segmentation binary graph results; (b(1)) Deeplabv3 detection result; (b(2)) results of Deeplabv3 detection and cropping; (b(3)) results of Deeplabv3 defect segmentation binary graph; (c(1)) U2Net test results; (c(2)) detection and cropping results of U2Net; (c(3)) U2Net defect segmentation binary graph results; (d(1)) improved U2Net detection results; (d(2)) improved U2Net detection and cropping results; (d(3)) improved U2Net defect segmentation binary graph results.
The detection result of Deeplabv3 in b(2) is slightly improved compared with that of Pspnet. The red box part covers the stained area, but the complete scope of the stain cannot be completely detected, and there are still omissions. Although the binary segmentation diagram in b(3) can partially reflect the shape of the stain, there is obvious noise at the edge, and the segmentation result is not smooth enough, indicating that Deeplabv3 has insufficient performance in processing details and edges.
The detection result of U2Net in c(2) was more accurate and marked most of the stained areas, but the red box still failed to completely cover the entire stain, resulting in some small stained areas not being detected. The segmentation results of c(3) show more background noise, and the edge of the stain is not smooth enough. The segmentation effect has been improved, but there are still limitations.
In contrast, the improved U2Net performs well in d(2), able to accurately detect and frame the complete area of the stain, and the red box accurately covers the stain, showing high detection accuracy. The results of the binary segmentation diagram of d(3) show that the edge of the stain is very smooth and noiseless, the segmented stain area is complete, and the shape is consistent with the actual stain, indicating that the improved U2Net has the best performance in stain detection and segmentation.
By introducing the local mean and OTSU methods, the improved U2Net can adaptively adjust the segmentation threshold according to different lighting conditions and material changes. Under the complex lighting and surface changes of Figure 9, the improved U2Net can still maintain high precision segmentation results, ensuring the clear and noise-free boundary of the binary graph. This makes the improved U2Net extremely robust and adaptive when handling stain detection, significantly better than Pspnet, Deeplabv3, and the original U2Net.
Figure 10 shows scratch detection against a complex background. Pspnet failed to locate the scratch area correctly in a(2); the red box deviated greatly from the actual scratch position; the shape of the binary graph in a(3) was wrong; and there was obvious noise at the edge. Deeplabv3 partially detected scratches in b(2), but the red box is still incomplete and the binary image edge of b(3) is rough and noisy. The detection performance of U2Net in c(2) is biased, and the binary segmentation graph of c(3) has some noise and unsmooth boundary problems. The improved U2Net completely detected the scratch area in d(2); the position of the red box was accurate; the segmentation edge of d(3) was smooth; and the shape was completely consistent with the actual scratch, without noise interference.
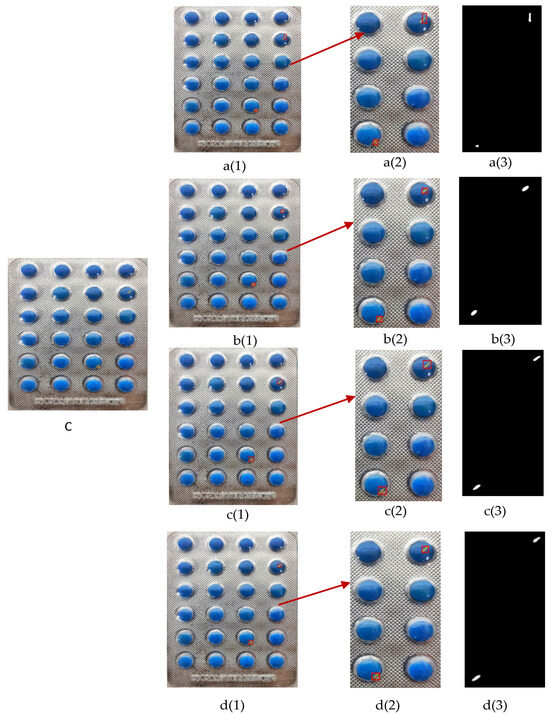
Figure 10.
Surface scratches defect detection effect. (C) Surface scratches images before detection; (a(1)) Pspnet detection results; (a(2)) Pspnet detection and cropping results; (a(3)) Pspnet defect segmentation binary graph results; (b(1)) Deeplabv3 detection result; (b(2)) results of Deeplabv3 detection and cropping; (b(3)) results of Deeplabv3 defect segmentation binary graph; (c(1)) U2Net test results; (c(2)) detection and cropping results of U2Net; (c(3)) U2Net defect segmentation binary graph results; (d(1)) improved U2Net detection results; (d(2)) improved U2Net detection and cropping results; (d(3)) improved U2Net defect segmentation binary graph results.
The Gaussian Laplace operator shows its powerful edge detection capability in Figure 10, allowing the improved U2Net to accurately capture scratched edges when dealing with complex backgrounds, while LKA helps the model obtain more context information to ensure that the scratched area is fully detected.
Figure 11 shows the detection of minor surface defects. Figure 11D is the original image before detection. As Figure 11 shows, only the improved U2Net model can detect such minor defects. Figure 11d(2) is the result of the model test, and the defect area can be fully detected. d(3) is the binary graph of the model inspection, and the results show smooth edges and no noise. The LKA can adaptively weight features while expanding the receptive field, which significantly improves the network’s ability to perceive the global context and subtle features.
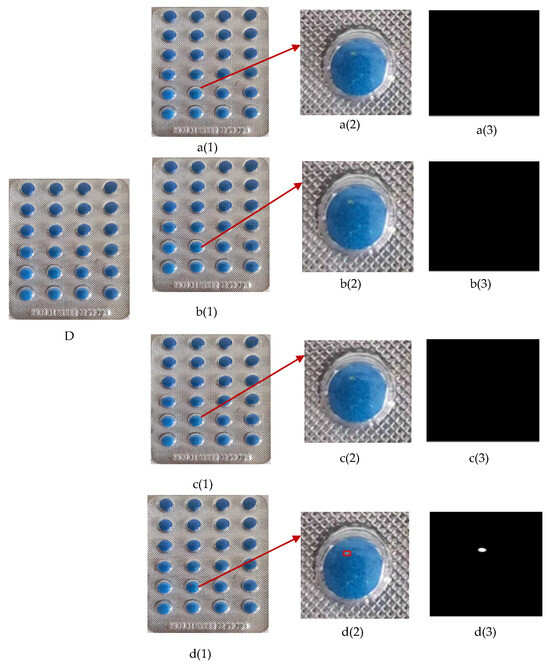
Figure 11.
Minor defects surface defect detection. (D) Minor defects images before detection; (a(1)) Pspnet detection results; (a(2)) Pspnet detection and cropping results; (a(3)) Pspnet defect segmentation binary graph results; (b(1)) Deeplabv3 detection result; (b(2)) results of Deeplabv3 detection and cropping; (b(3)) results of Deeplabv3 defect segmentation binary graph; (c(1)) U2Net test results; (c(2)) detection and cropping results of U2Net; (c(3)) U2Net defect segmentation binary graph results; (d(1)) improved U2Net detection results; (d(2)) improved U2Net detection and cropping results; (d(3)) improved U2Net defect segmentation binary graph results.
According to the specific performance of Figure 8, Figure 9, Figure 10 and Figure 11, the improved U2Net expands the receptive field by introducing LKA and improves the global context awareness capability. The edge detection is enhanced by the Gaussian Laplacian operator to ensure the smoothness of the segmentation boundary. The cross-entropy loss function improves the segmentation accuracy and reduces the noise. The local mean and OTSU methods enhance the adaptive segmentation ability of the model, so that it can maintain high-precision detection and segmentation under complex lighting and background conditions. The integration of these technologies enables the improved U2Net to significantly outperform Pspnet, Deeplabv3, and the original U2Net in surface defect detection, demonstrating greater detection accuracy and segmentation quality in scratches, stains, and subtle defect detection.
6. Conclusions
In this paper, the surface defect detection problem of blister tablets was studied, U2Net was proposed as the basic model, the U2Net model was improved, and the following conclusions were obtained:
- (1)
- The fusion of U2Net and the large kernel attention mechanism improves the feature extraction ability of the model, enabling the model to extract defect features completely and enhancing the detection effect, with the highest index among the same type of detection models. The improved U2Net model can meet the requirements of rapid detection with a detection time of 0.05S; the accuracy rate is 99.8%; the precision rate is 96.3%; and the recall rate is 84.5%.
- (2)
- The loss function composed of Gaussian Laplacian and cross entropy can enhance the model’s attention to the defects at the edge of the blister sheet, and can reduce the noise, so that the model can segment the defect edges more smoothly.
- (3)
- Using OTSU and local average methods can improve the overall accuracy of the model.
The improved U2Net model proposed in this paper can detect the size and location of bubble cap defects comprehensively and clearly, and the test time is short. The effectiveness of each part of the method is verified by ablation experiments.
In this study, improved U2Net is used to detect blister tablets, but there are still many shortcomings. For example, defect categories are not distinguished in the model, and only the detected binary graph can be marked with a red box in the blister tablet diagram. Therefore, the next step will be to study how to add defect category detection to U2Net.
Author Contributions
Conceptualization, J.H. and J.Z.; methodology, J.H.; software, J.H.; validation, J.H., J.L. (Jikang Liu) and J.L. (Jingbo Liu); formal analysis, J.L. (Jikang Liu); investigation, J.L. (Jingbo Liu); resources, J.H.; data curation, J.H.; writing—original draft preparation, J.H. and J.Z.; writing—review and editing, J.H. and J.Z.; visualization, J.H.; supervision, J.Z.; project administration, J.Z.; funding acquisition, J.Z. All authors have read and agreed to the published version of the manuscript.
Funding
This research received no external funding.
Institutional Review Board Statement
Not applicable.
Informed Consent Statement
Not applicable.
Data Availability Statement
Data are contained within the article.
Conflicts of Interest
The authors declare no conflicts of interest.
References
- World Health Organization. Good Manufacturing Practices for Pharmaceutical Products: Main Principles; WHO Technical Report Series; World Health Organization: Geneva, Switzerland, 2019; pp. 1–50. [Google Scholar]
- International Conference on Harmonisation. ICH Harmonised Tripartite Guideline: Quality Risk Management (Q9); International Conference on Harmonisation of Technical Requirements for Pharmaceuticals for Human Use: Geneva, Switzerland, 2005; pp. 1–25. [Google Scholar]
- United States Pharmacopeia. USP 42, NF 37, 3rd ed.; United States Pharmacopeial Convention: Rockville, MD, USA, 2019; pp. 1–1200. [Google Scholar]
- Sugawara, K.; Suzuki, K.; Hirosawa, N. Blister packaging design for the protection and stability of pharmaceutical products. J. Pharm. Sci. Technol. 2010, 64, 123–130. [Google Scholar]
- Yao, X.; Li, Q.; Zhang, H. Detection techniques for tablet blister packaging: Ensuring pharmaceutical quality and safety. Int. J. Pharm. Qual. Assur. 2015, 5, 215–222. [Google Scholar]
- Liu, S. Study on Real-time Tablets Image Detection and Processing System Based on Image Processing and Its Application. Comput. Mod. 2013, 1, 66–69. [Google Scholar]
- Fang, L.; Lin, M. Discrimination of Varieties of Tablets Using Near-Infrared Spectroscopy by Wavelet Clustering. Spectrosc. Spectr. Anal. 2010, 30, 2958–2961. [Google Scholar]
- Qin, X.; Zhang, Z.; Huang, C.; Dehghan, M.; Zaiane, O.; Jagersand, M. U2-Net: Going deeper with nested U-structure for salient object detection. Pattern Recognit. 2020, 106, 107404. [Google Scholar] [CrossRef]
- Fang, W.; Wang, Y. Defect Detection Method for Drug Packaging with Aluminum Plastic Bubble Cap. Packag. Eng. 2019, 40, 133–139. [Google Scholar]
- Yu, H.; Wu, W.; Cheng, Y. Application of Improved Otsu Algorithm in the Defect Detection of Aluminium-plastic Blister Drugs. Packag. Eng. 2014, 35, 15–18. [Google Scholar]
- Wu, W.; Yu, H.; Cheng, Y. Edge Detection of Aluminum-Plastic Blister Drugs Based on Improved Canny Algorithm. J. Hunan Univ. Technol. 2014, 28, 67–70. [Google Scholar]
- Chen, Y.; Ge, B.; Wang, J.; Lu, J.; LI, C. Blister packaging drug defect identification based on integrated classifier. Packag. Eng. 2021, 42, 250–259. [Google Scholar]
- Duan, Z.; LI, S.; Hu, J.; Yang, J.; Wang, Z. Capsule Defect Detection Method Based on Mask R-CNN. Radio Eng. 2020, 50, 857–862. [Google Scholar]
- Huang, Z. Study on Tablet Surface Defect Detection Based on Improved YOLOv5; Chongqing University of Science and Technology: Chongqing, China, 2023. [Google Scholar]
- Jing, J.; Wang, Z.; Matthias, R.; Zhang, H. Mobile-Unet: An efficient convolutional neural network for fabric defect detection. Text. Res. J. 2020, 92, 004051752092860. [Google Scholar] [CrossRef]
- Zhu, X.; Cheng, Z.; Wang, S.; Chen, X.; Lu, G. Coronary angiography image segmentation based on PSPNet. Comput. Methods Programs Biomed. 2021, 200, 105897. [Google Scholar] [CrossRef] [PubMed]
- Vijay, B.; Alex, K.; Roberto, C. SegNet: A Deep Convolutional Encoder-Decoder Architecture for Image Segmentation. arXiv 2015, arXiv:1505.07293. [Google Scholar]
- Zhang, E.; Kang, X. Pixel-level pruning deep supervision UNet++ for detecting fabric defects. Text. Res. J. 2023, 93, 5416–5436. [Google Scholar] [CrossRef]
- Wu, Z.; Lan, Y.; Li, L.; Xiong, X.; Qiao, W.; Wang, w. Metal bar scratch defect detection based on improved U2Net. Modul. Mach. Tool Autom. Manuf. Tech. 2024, 157–160+167. [Google Scholar] [CrossRef]
- Wang, Y.; Ge, H. Metal surface defect detection algorithm based on U2-Net. Nanjing Univ. Nat. Sci. 2023, 59, 413–424. [Google Scholar]
- Cheng, H.; Li, Y.; Li, Y.; Hu, Q.; Wang, J. Surface crack detection of concrete structures based on improved U2Net model. Water Resour. Hydropower Eng. 2024, 55, 159–171. [Google Scholar]
- Guo, M.; Lu, C.; Liu, Z.; Cheng, M.; Hu, S. Visual attention network. Comput. Vis. Media 2023, 9, 733–752. [Google Scholar] [CrossRef]
- Wang, X. Laplacian operator-based edge detectors. IEEE Trans. Pattern Anal. Mach. Intell. 2007, 29, 886–890. [Google Scholar] [CrossRef]
- Rybakova, E.O.; Limonova, E.E.; Nikolaev, D.P. Fast Gaussian Filter Approximations Comparison on SIMD Computing Platforms. Appl. Sci. 2024, 14, 4664. [Google Scholar] [CrossRef]
- Senthilkumaran, N.; Vaithegi, S. Image Segmentation By Using Thresholding Techniques For Medical Images. Comput. Sci. Eng. Int. J. 2016, 6, 1–13. [Google Scholar]
- Misael, L.; Luis, M.L.; Francisco, M.G.; Jorge, M.; Eduardo, C.; Francisco, J.V. Automatic Early Broken-Rotor-Bar Detection and Classification Using Otsu Segmentation. IEEE Access 2020, 8, 112624–112632. [Google Scholar]
Disclaimer/Publisher’s Note: The statements, opinions and data contained in all publications are solely those of the individual author(s) and contributor(s) and not of MDPI and/or the editor(s). MDPI and/or the editor(s) disclaim responsibility for any injury to people or property resulting from any ideas, methods, instructions or products referred to in the content. |
© 2024 by the authors. Licensee MDPI, Basel, Switzerland. This article is an open access article distributed under the terms and conditions of the Creative Commons Attribution (CC BY) license (https://creativecommons.org/licenses/by/4.0/).