1. Introduction
In recent decades, a steady increase in CO
2 emissions by the global population has significantly contributed to manmade climate change, the consequences of which are already being felt [
1,
2,
3,
4]. For some time now, discussions have been taking place at various levels—both nationally and internationally—on the awareness of the problem and the need for global or international efforts [
5,
6] to sustainably reduce greenhouse gases—first and foremost CO
2—in order to limit the increase in the Earth’s average temperature to such an extent that tipping points are avoided. Such efforts to drastically reduce CO
2 emissions are defined by national agendas and politically set milestones, which mainly foresee a stepwise reduction in greenhouse gas emissions towards climate neutrality in all sectors [
7,
8] by approximately the middle of the 21st century.
In the context of the so-called energy transition with reference to the energy sector, depending on the political framework, geographical and economic boundary conditions, differences in climate targets, variable technology mixes, and different time schedules can be envisaged with regard to the phasing out of fossil-based forms of energy generation and the integration of climate-neutral energy technologies in national transformation paths [
9].
Germany is in a special situation here, as not only has an ambitious roadmap—65% reduction by 2030, 100% reduction by 2045 [
10]—been postulated, but nuclear energy no longer plays a role in the future mix of sustainable power generation technologies with the politically enacted nuclear phase-out. Even if Germany, as part of the European interconnected grid, can compensate for fluctuations by means of electricity imports, there must of course be a massive expansion of renewable energies and storage in order to achieve the climate targets that it has set itself. The decarbonization of industry—e.g., adding more hydrogen-based power and heat generation [
7,
8,
11]—indicates quite clearly that it is not just a matter of replacing existing fossil-based power generation plants, but also of meeting an ever-increasing demand for electricity and the necessary supply infrastructure (i.e., conversion, storage, transport, and distribution).
In addition to purely political and administrative hurdles, as well as economic uncertainties regarding suitable long-term locations of sustainable energy supply technologies, decision-making processes regarding grid planning should be relatively fast in order to achieve the ambitious climate targets in the energy sector. However, questions regarding regional energy system planning and decentralized integration of sustainable energy technology (SET)—which mainly take place at the distribution grid level [
12], and entail environmental impacts—should be answered in cooperation with the population via appropriate participation and engagement formats. Though there is a widespread awareness of the problem among the population, and the energy transition as well as the achievement of corresponding climate targets via climate actions generally enjoy great acceptance in society in many countries, this is rather restrained when it comes to concrete regional SET integration and on-site grid expansion, and deviates from the approval or acceptance of measures to achieve abstractly formulated sustainability targets [
13]. This discrepancy or ambiguity, which often has to do with a phenomenon labeled “not in my back yard” (NIMBY) [
14,
15], can complicate and delay SET deployment.
In conclusion, acceptance problems related to specific regional integration plans contrast with the generally rather positive attitude towards the energy transition. Thus, the following question is of utmost relevance: How should decision makers—e.g., grid planners or politicians—sustainably deal with these ambiguities or discrepancies? Nevertheless, grid expansion plans need to be developed and implemented as rapidly as possible according to the set milestones, considering the population, and especially the ambiguity or discrepancy regarding SET integration in decision-making processes.
This paper addresses the question of how decision makers can be supported in regional grid expansion and SET integration issues, while taking into account the opinions and aforementioned possible ambiguities of the population directly affected by concrete planning and implementation, and proposes a novel methodology that includes structured double surveys, statistical evaluations regarding socioeconomic factors as drivers for the mentioned discrepancies, and multicriteria decision analysis to consider various criteria in final decisions in addition to citizen acceptance. The proposed methodology is transferable to other contexts, where the surveys used differ ‘only’ in the choice of perspective: a global or abstract perspective that allows for inferences to be made about general attitudes, or a local or concretizing perspective that reveals expected deviations from the global survey. In particular, the added value lies in the generic approach that combines dynamic MCDA (DMCDA) and statistical analysis to deal with these ambiguities.
The structure of this paper is as follows:
Section 2 briefly highlights acceptance issues in the context of sustainable energy technologies, smart participation/engagement formats, and dynamic MCDA, and how to deal with ambiguities.
Section 3 presents a novel generic methodology for dealing with discrepancies in decision making, using SET integration as an example. An agent-based simulation is used to demonstrate the added value of the methodology in
Section 4, considering the integration of photovoltaic and wind power plants in the German city of Karlsruhe by means of simplified, synthetic double surveys and considering only residential locations. The paper concludes with a discussion and an outlook in
Section 5, where next steps and some scientific challenges towards operationalization of the proposed methodology are sketched and highlighted, respectively.
2. State of the Art
This section underlines the relevance of the aforementioned ambiguity issues in decision making and the originality of the proposed methodology in terms of a brief state-of-the-art overview of the following related topics: SETs and issues related to their acceptability for integration into the built environment, highlighting the need for research on community involvement in grid planning decisions; different types of citizen participation and engagement formats that demonstrate the possibilities and opportunities for public participation in decision making in smart cities; and MCDA in the context of renewable energy systems, emphasizing the added value of multicriteria evaluations of different decision alternatives, especially taking into account public opinion.
Sustainable energy technologies are diverse, and differ fundamentally in their basic functionality, which can be conversion, storage, or transport (e.g., [
16]). Potential SET for electricity generation and storage, which can be implemented in a decentralized manner and will potentially play a role in urban environments, includes photovoltaic and wind power plants, renewable gas power plants, but also chemical, electrical, thermal, rotational kinetic, or potential energy storage.
In many countries, hydrogen is seen as a key enabler of the energy transition [
11,
17], as electrolyzers, for example, can be used to produce hydrogen from excess electricity, which can be converted back into electricity or used for heat generation, e.g., by means of fuel cells or combustion. Application scenarios are envisaged in the energy, industrial, and transport sectors; thus, in addition to the implementation of generation plants and storage facilities, one must also assume a massive expansion of the transport and distribution network infrastructure [
18,
19].
In addition to essential basic functional properties, SETs differ at the visual–haptic level, since these technologies have a spatial extent, a characteristic appearance, and also differ in terms of special requirements for their location, as well as implying expenses with regard to grid connection. The environmental impact of SET integration is often viewed with suspicion by local residents, who often expect a lasting deterioration in their quality of life. Aesthetic aspects or negative economic effects in the form of a decrease in tourism or a decline in the value of real estate and land usually play a special role here [
14,
15,
19,
20], also leading to the introduction of new terms such as “scenic beauty value” and methods for their assessment [
21]. However, SETs can also differ in terms of fundamental issues of sustainability—especially when it comes to life-cycle assessment—and can give rise to corresponding reservations [
22].
In general, hesitant or dismissive attitudes in this context can be attributed to the “not in my back yard” (NIMBY) phenomenon [
14,
15,
19]. This phenomenon can be observed for different regional implementation plans, whatever type of technology and infrastructure measure is at stake—from the integration of wind turbines to the development of hydrogen generation, distribution, and transport infrastructures [
19]. In general, it can be observed in many countries—including Germany—that although there is a strong awareness of the problem of manmade climate change and a positive attitude towards the need to take measures, and the energy transition is welcomed in principle, the implementation of measures is rather slow [
13]. Different studies on decision making have shown that people tend to prioritize short-term risks, such as an economic slowdown, over long-term risks, such as climate change [
13].
In the context of regional expansion plans, communication, awareness raising, attitudes regarding renewable energy, and engagement and participation, in conjunction with social factors, play an essential role in accelerating SET integration [
13]. New processes and methodologies are needed in order to enable SET integration decisions to be made effectively and sustainably in the face of the aforementioned ambiguity and an acute urge to act [
23,
24,
25,
26]. This paper presents a novel methodology that supports decision makers in the context of grid expansion to systematically incorporate citizens’ opinions as well as discrepancies in their opinions into their decisions.
Participation deals with the process of involving the public and stakeholders in making decisions that affect themselves, whether passively via consultation, or actively via two-way engagement [
23]. There are different types of engagement, such as (1) top-down one-way communication and/or consultation, where engagement is initiated by an agency with decision-making power for communicating decisions, or for consulting with stakeholders/the public while retaining decision-making power; (2) top-down deliberation and/or coproduction, where stakeholders/the public are engaged in two-way discussions prior to making a decision—coproductive approaches would involve jointly developing a decision and ways to implement it, where the organization with decision-making power would be responsible for the implementation; (3) bottom-up one-way communication and/or consultation, where engagement is initiated and led by stakeholders/the public to persuade decision-making bodies to allow engagement/consultation, and to influence decision makers or overturn decisions; and (4) bottom-up deliberation and/or coproduction, where engagement is initiated and led by stakeholders/the public, who engage in two-way discussions on the decision; decisions are made and implemented by a group of stakeholders/the public—possibly in a coproductive manner [
27]. Appropriate methods of engagement depend on the purpose and context in which engagement is needed, where success can be seen as achieving beneficial outcomes or building trust in decision-making processes. In our context, engagement means actively consulting with the public on various SET implementations to achieve beneficial and widely accepted solutions.
With regard to concrete means of participation, citizen e-participation is a form of coproduction with the potential to—for example—enhance government service quality [
28]. In general, digital citizen participation is of great importance for the development of smart sustainable cities [
29], where citizens and communities need to be proactively engaged—e.g., using digital tools and smart technologies—and diverse audiences should be considered to ensure equity and social justice [
25]. Citizen participation particularly plays a key role in the energy transition and in successful energy project planning and implementation [
24,
30], and must be further considered in strategic planning and, at the regional/community level, participation should be supported and considered in the early phases [
31]. Furthermore, the governance framework enabling communities to participate needs to be enhanced [
26]. Our research promotes public participation in the energy transition, and proposes several structured double surveys with a fixed stakeholder group that enable a structured unveiling and handling of discrepancies in the context of sustainable decision making.
The evident conflict between economic and environmental goals was the main driver that led energy planners to use MCDA methods in the early 1980s [
32]. Beginning with questions about grid design with respect to a single energy carrier, the importance of using MCDA methods for planning issues has increased with the growth in the complexity of energy systems. This is due in part to the use of multiple energy sources and the proliferation of distributed generation and conversion thereof [
33,
34]. Especially in the context of decision-making processes with respect to planning renewable energy systems, MCDA methods [
35] are especially beneficial—for example, as qualitative data and knowledge from local stakeholders can be integrated [
36] and can, for instance, be applied in the context of robustly selecting appropriate locations for solar plant sites [
37], or for the general assessment of a country’s ability to generate renewable energy [
38]. Furthermore, the assessment of societal acceptance with regard to SET implementation [
39] and its integration into MCDA approaches [
40] is essential for sustainable energy system transformation. In this context, social indicators—manifested for example in the impact on the personal environment, the sociocultural sensitivity, the attitude towards a particular technology, or the general acceptance by the public—are of great importance for the evaluation process. Ambiguities in the assessment of acceptance or acceptability that is associated with uncertainties referring to equivocal human opinions may be handled, for example, with the help of fuzzy set theory [
41,
42]. However, to the best of the authors’ knowledge, the ambiguities that arise in the context of evaluating different decision alternatives—which result from changing perspectives on the decision subject, as well as the temporal influences that arise from possibly changing framework conditions and assumptions under which decisions are made—are not sufficiently taken into account in the literature.
To integrate temporal aspects into MCDA, different approaches exist that combine MCDA methods with scenario planning, life-cycle analysis, or via stand-alone MCDA models that—for example—consider past and future data with the help of several decision matrices [
43].
In conclusion, handling ambiguities resulting from taking a global and local view on the decision problem represents a fundamental issue in decision making, and constitutes a research gap that this work begins to fill.
3. Methodology
The intent of this paper is to propose a generic procedural flow of decision making that systematically accounts for ambiguities regarding assessments within a fixed stakeholder group. Essentially, we mean ambiguities in a given context, which arise due to different perspectives within a context, such as those presented in the field of energy transition and SET integration issues, where stakeholders can also be citizens.
The methodology described in this section refers to a workflow that starts with two surveys, separated in time, in which a fixed stakeholder group participates. This ‘double survey’, or ‘global-local survey’, contains identical assessment categories in both cases, but differs in perspective.
The first global survey addresses a basic attitude regarding abstractly defined goals, whereas the second local survey aims at an assessment of the stakeholders regarding concrete, locally defined measures. Crucial here is the use of identical rating categories and scales for a numerical assessment of discrepancies or ambiguities. For statistical analyses, the first survey additionally collects socioeconomic data as well as information on place of residence.
It is decisive to establish a representative stakeholder group depending on the question. However, in this paper, we will not elaborate on this point, but would like to emphasize that the participation of all relevant groups is of great importance, but the selection must be made in relation to the context of the problem. Otherwise, negative results are possible, as shown for example in [
44,
45]. Once the relevant groups are defined, the sample size matters. There are scientific approaches (e.g., [
46]) to determine the appropriate number of participants given constraints such as confidence level and margin of error.
In the approach presented here, statistical analyses of discrepancy enable decision makers to select and calibrate weights in an MCDA approach that incorporates citizen assessment, including discrepancies, as well as other criteria, such as cost. We illustrate this approach in the context of SET integration.
General assumptions and simplifications made can be summarized as follows:
Fixed group: Carefully selected participants representing socioeconomic facets and urban habitats in a given city. Furthermore, the survey is based on a stated commitment by the participants—no random participation, so as to avoid bias and disproportionate representations of socioeconomic attitudes and allocations to urban habitats;
Global–local survey with this fixed group addressing a global view on energy transition and assessment of concrete SET integration plans in the local context, related to different energy technologies.
This approach can be repeated, and the dynamic nature of the problem manifests itself in the ambiguity of a single double survey and the iterative use of this global–local survey.
3.1. Decision Criteria for SET Integration
For determining decision criteria for SET integration, future safety and resilience requirements on the power grid need to be considered; for example:
- (i)
The possibility of autarky at the city level: In the case of a long-lasting outage of the supraregional power grid, the operation of downstream critical infrastructure in particular needs to be ensured by a city’s own supply via its local grid. The distance between energy sources and storage facilities and critical infrastructure should be kept as short as possible in order to minimize transmission losses and reduce the probability of failure due to external influences, such as extreme weather conditions;
- (ii)
The capability to manage unpredictable impacts of climate change: Global warming increases the number of people around the world who are affected by extreme weather events [
3], and has increased the probability of unprecedented extreme hot and wet events [
4]. Strong winds, hailstorms, heavy rainfall, and subsequent flooding, for example, endangering overhead power lines, pylons, substations, and transformer stations, may lead to potential damages and, consequently, have impacts on the power supply;
- (iii)
The need to meet unforeseeable future demands for electricity: Changing climate conditions and, for example, a general increase in warm temperature extremes in the future [
47], may increase the demand for air conditioning in public and private buildings. Furthermore, despite the use of renewable heat sources as an alternative, an increase in electricity consumption for heating can be expected [
48]. The growing importance of electromobility will also increase the load on the power grid, as well as the further decentralization of power generation from individual large power plants to many small-scale generators based on renewable energies.
Based on these requirements, the following criteria, among others, may be considered in the framework of integrating SETs:
Profitability: Reasonable price/performance ratio (including research costs);
Reaction time: Coupling fast-responding storage types with slow ones to fill all power gaps in the power supply and, thus, increasing the overall absorptive capacity of the distribution network;
Safety of the urban area: Considering the potential harm of the various technologies for people and the environment in the event of an accident;
Location dependency: Suitability for the built environment according to size, distance to critical infrastructures, and dependency on geological conditions, for example;
Scalability: Ability of a technology to be deployed at different scales due to various requirements for the power supply of critical infrastructure, for example;
Volatility: Ensuring that the emergency solution supplies power with the same stability as the distribution grid;
Relative land use: Reasonable ratio of output and available land due to limited space in the urban environment; one may consider combinations with other uses;
Citizen acceptance: The public’s attitude towards local SET implementation.
This list is of course not final, and may be adapted by new insights in the future and according to the changing outlines of the task at hand. Some of the criteria mentioned are techno-economic in nature or relate to safety and security of supply and, thus, can only be evaluated by corresponding experts and stakeholders, e.g., electric utilities, urban and regional planners, or operators of other critical infrastructure.
3.2. Global–Local Survey
Citizens’ opinions towards a specific technology are elicited with the help of surveys at different points in time. Consequently, surveys have different boundary conditions shaped by the political or economic environment, for example. Opinions are expressed on a qualitative scale. Surveys are twofold, reflecting global and local perspectives on implementing different technologies. Let
be the set of SETs under investigation and
be the set of different time points that mark the end of a specific survey round. A survey round consists of two surveys that elicit citizens’ opinions on different levels. The first survey
asks for opinions towards a technology on a global scale and, hence, general sentiments towards different technologies; this survey is denoted as “global survey” in the following text. The second survey
asks specifically for implementations in one’s own city and, thus, in the immediate vicinity; this survey is denoted as “local survey” in the following. Some time elapses between the global and local surveys. Let
be the set of citizens participating in the series of surveys. In addition to sentiments towards different SETs, certain socioeconomic factors
are elicited as well. The outcomes of a global survey of citizen
at time point
are summarized as follows:
with
values from a qualitative scale. The same holds for a local survey
. Furthermore, for each citizen
,
captures information on socioeconomic variables. After each survey round, the global and local surveys are aggregated by some aggregation functions
and
. These may depend, for example, on the composition of participants, promoting equity, and giving more weight to the opinions of underrepresented groups. In addition, these functions can be helpful when the group composition changes in a survey round, or even between survey rounds. For the purposes of this paper, we assume a fixed group of survey participants. How to deal with this condition not being met will be the subject of further research, and is beyond the scope of this paper. The aggregated opinions on the global implementation of the SETs studied are then denoted by
and
.
3.3. Statistical Analysis of Ambiguities and MCDA
If discrepancies between
and
towards specific technologies appear in a survey round, further analyses can be carried out to determine the corresponding drivers
. The decision makers may consider these drivers when consolidating
and
according to
with a function
. Exemplarily, the global and local surveys can be consolidated by means of the weighted sum
where the weights
and
are possibly influenced by the identified drivers
. The consolidated surveys are aggregated over time according to the function
The final outcome of the surveys is summarized as follows:
with
.
To identify a suitable SET mix, MCDA is carried out after the surveys are completed. Let
be the set of decision alternatives with
and
. Hence, each alternative represents a specific technological mix. Let
be the set of criteria that decision makers wish to consider in deciding on an appropriate technological mix. Let
reflect the respective citizens’ opinions on a specific technological mix, which is elaborated on the basis of several survey rounds.
The score of a decision alternative
with respect to a criterion
is defined as follows
The values can be summarized in a decision table, as depicted in
Table 1.
The results of the particular surveys can be mapped as follows:
In order to compare different alternatives with respect to several criteria underlying different units, a value function for the criterion
maps scores to a common scale, as follows:
Hence, the scores of all criteria for an alternative
can be summarized in the vector
The overall score for the alternative
is calculated according to
with
,
, and
, where
is the preference with respect to the criterion
.
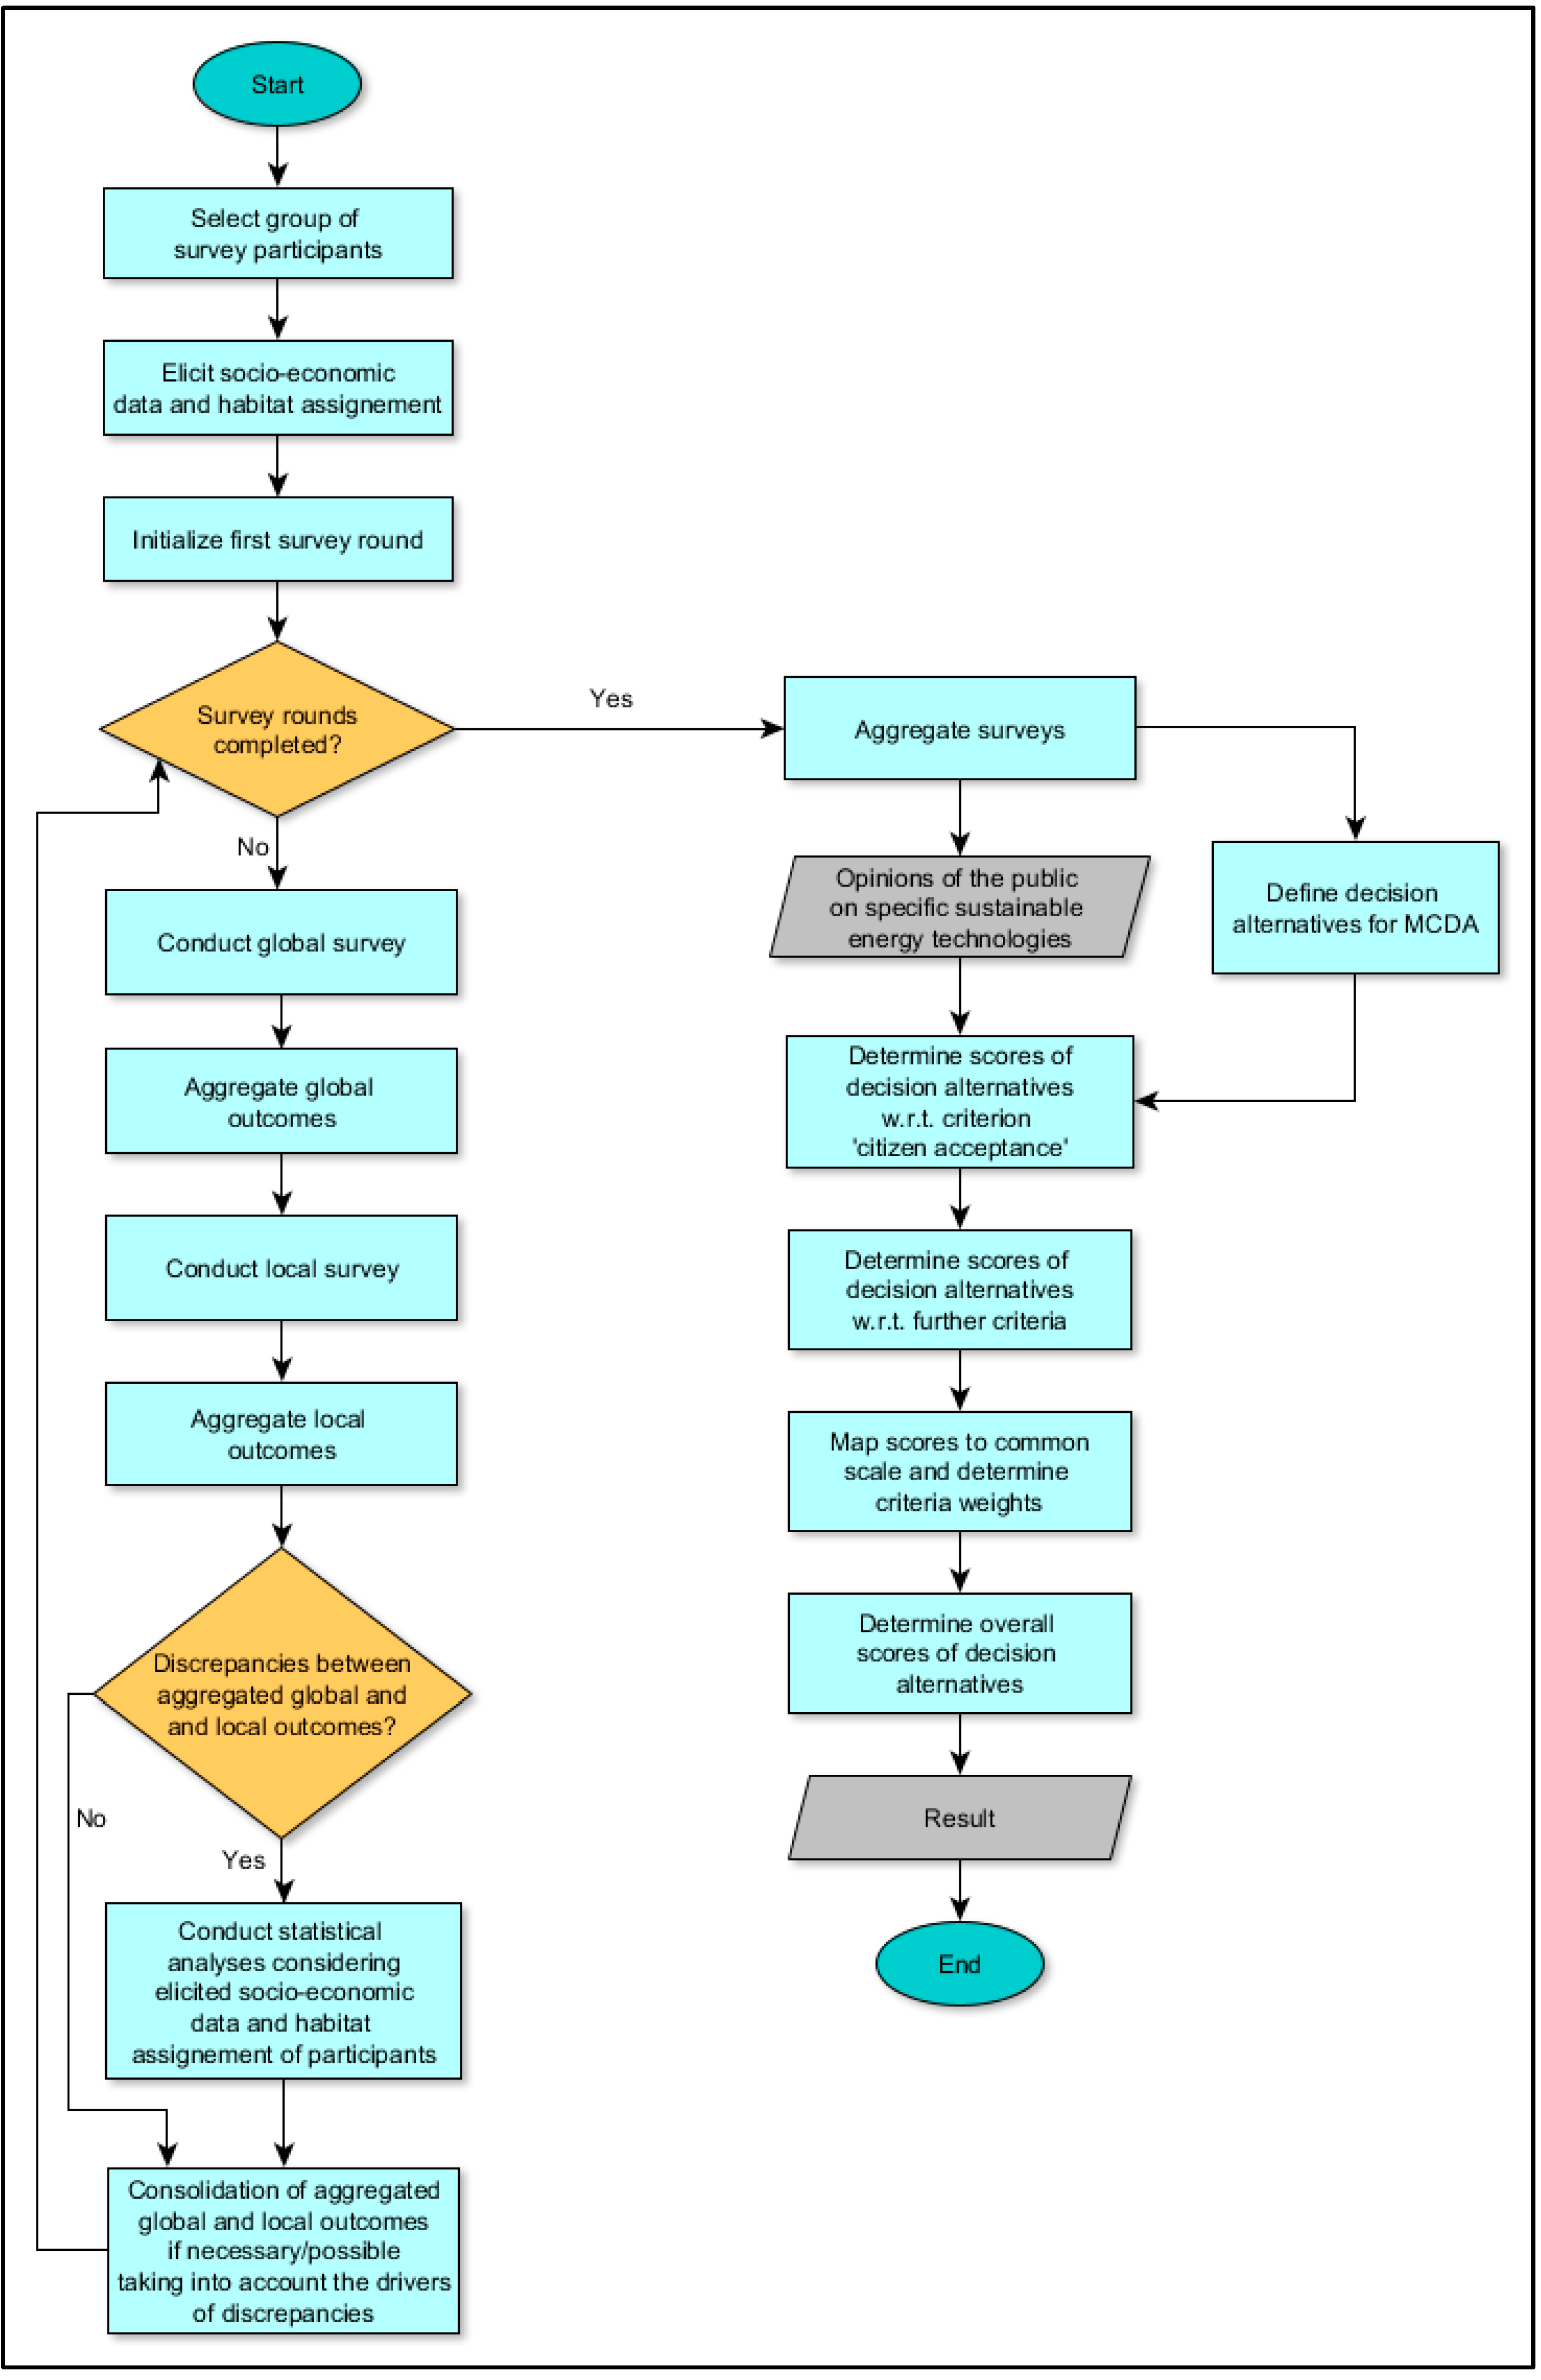
The methodology is illustrated in the flowchart in
Figure 1.
3.4. Integrating Survey Results
The procedure described previously leads to ranking values for the different alternatives—individual compositions of SETs—suggesting to decision makers which composition is preferable. While technically straightforward, the determination of the preferences—especially for the citizens’ opinions—is delicate. On the other hand, the sensible determination of the values is also key, as these are dependent on personal preferences and on several local and global surveys at different points in time. The subjectivity of this composition poses a challenge. Presenting additional facts and information based on the contextual data of the opinion-poll-like incisive events between the surveys, as well as the socioeconomic factors of the participants, may help decision makers in choosing their preferences in a less subjective way, essentially providing understanding as to why specific participants have certain attitudes. For one, direct correlation between events and socioeconomic factors and attitudes can be determined and communicated in comprehensible ways, as illustrated in the study in the following section, which shows a typical case of NIMBY. Furthermore, deep datamining for statistical analysis can provide even more insights and help decision makers to better identify hidden patterns in survey participants’ discrepancies, and determine the weighting of global and local surveys for their aggregation which, in turn, feeds into MCDA’s values. In addition, the results of the statistical analyses may also influence the weighting of the criterion itself in the final MCDA, as discrepancies that emerge across multiple survey rounds further sensitize decision makers to the importance of this criterion. However, this is generally very complex and time-consuming, and obviously requires the necessary data to be available, which is frequently simply not the case. Nevertheless, ultimately, it is always up to the decision makers as to the way in which to consider such additional information when making their decision(s). In particular, this work provides decision makers with a methodology to systematically incorporate citizens’ opinions, as well as discrepancies in their opinions, into their decisions—a process of multiple global and local surveys and statistical analyses of the discrepancies that arise, the results of which are incorporated into the aggregation of these global and local surveys and, finally, into the criterion of citizen acceptance in the MCDA.
We would like to emphasize that the focus of this paper is on how to deal with the discrepancies mentioned, and not on a detailed description of the procedural flow including the specification of the parties involved. Experts are needed in order to define and evaluate all other criteria for SET integration, in addition to the “citizen acceptance” criterion. Experts, e.g., social scientists, are also needed to identify representative survey groups and relevant socioeconomic factors associated with urban living environments. In addition, the determination of appropriate weights in the MCDA should be done by a group of stakeholders or decision makers, e.g., consisting of representatives of local governments, urban and regional planners, and utility companies. All of these processual aspects are the subject of current and future work.
4. Results
To study our approach, we set up an exemplary framework for iteratively conducting global–local surveys. For proposing a methodology as a first step, did not conduct real surveys, but rather generated synthetic data via an agent-based simulation. We consider the city of Karlsruhe and its residential buildings as survey participants, of which we have 11,664. For the sake of simplicity, we regard two renewable energy sources—namely, wind power and solar energy—and hence, technologies—wind turbines
and photovoltaic plants (
, respectively—that are subject to opinion surveys. The surveys ask for personal attitudes towards their implementation that are subsumed under the criterion
“citizen acceptance”. We assume four survey rounds with one global and one local survey. The survey participants express their attitudes towards a specific technology according to a scale from “one” to “five”, where “one” reflects disagreement, “three” reflects indifference, and “five” reflects agreement, with intermediate scores of “two” and “four”. The decision alternatives that represent different technological mixes and criteria used in the study can be found in
Table 2. The scores of the decision alternatives with respect to criteria
reflect a qualitative assessment of the technologies regarding profitability, reaction time, safety of the urban area, location dependency, scalability, volatility, and relative land use, respectively. The scores of the decision alternatives for the criterion
are gained from the simulations further explained in
Section 4.2; they, among others, depend on the distance to the next photovoltaic plant and wind turbine, whose potential locations are further discussed in
Section 4.1.
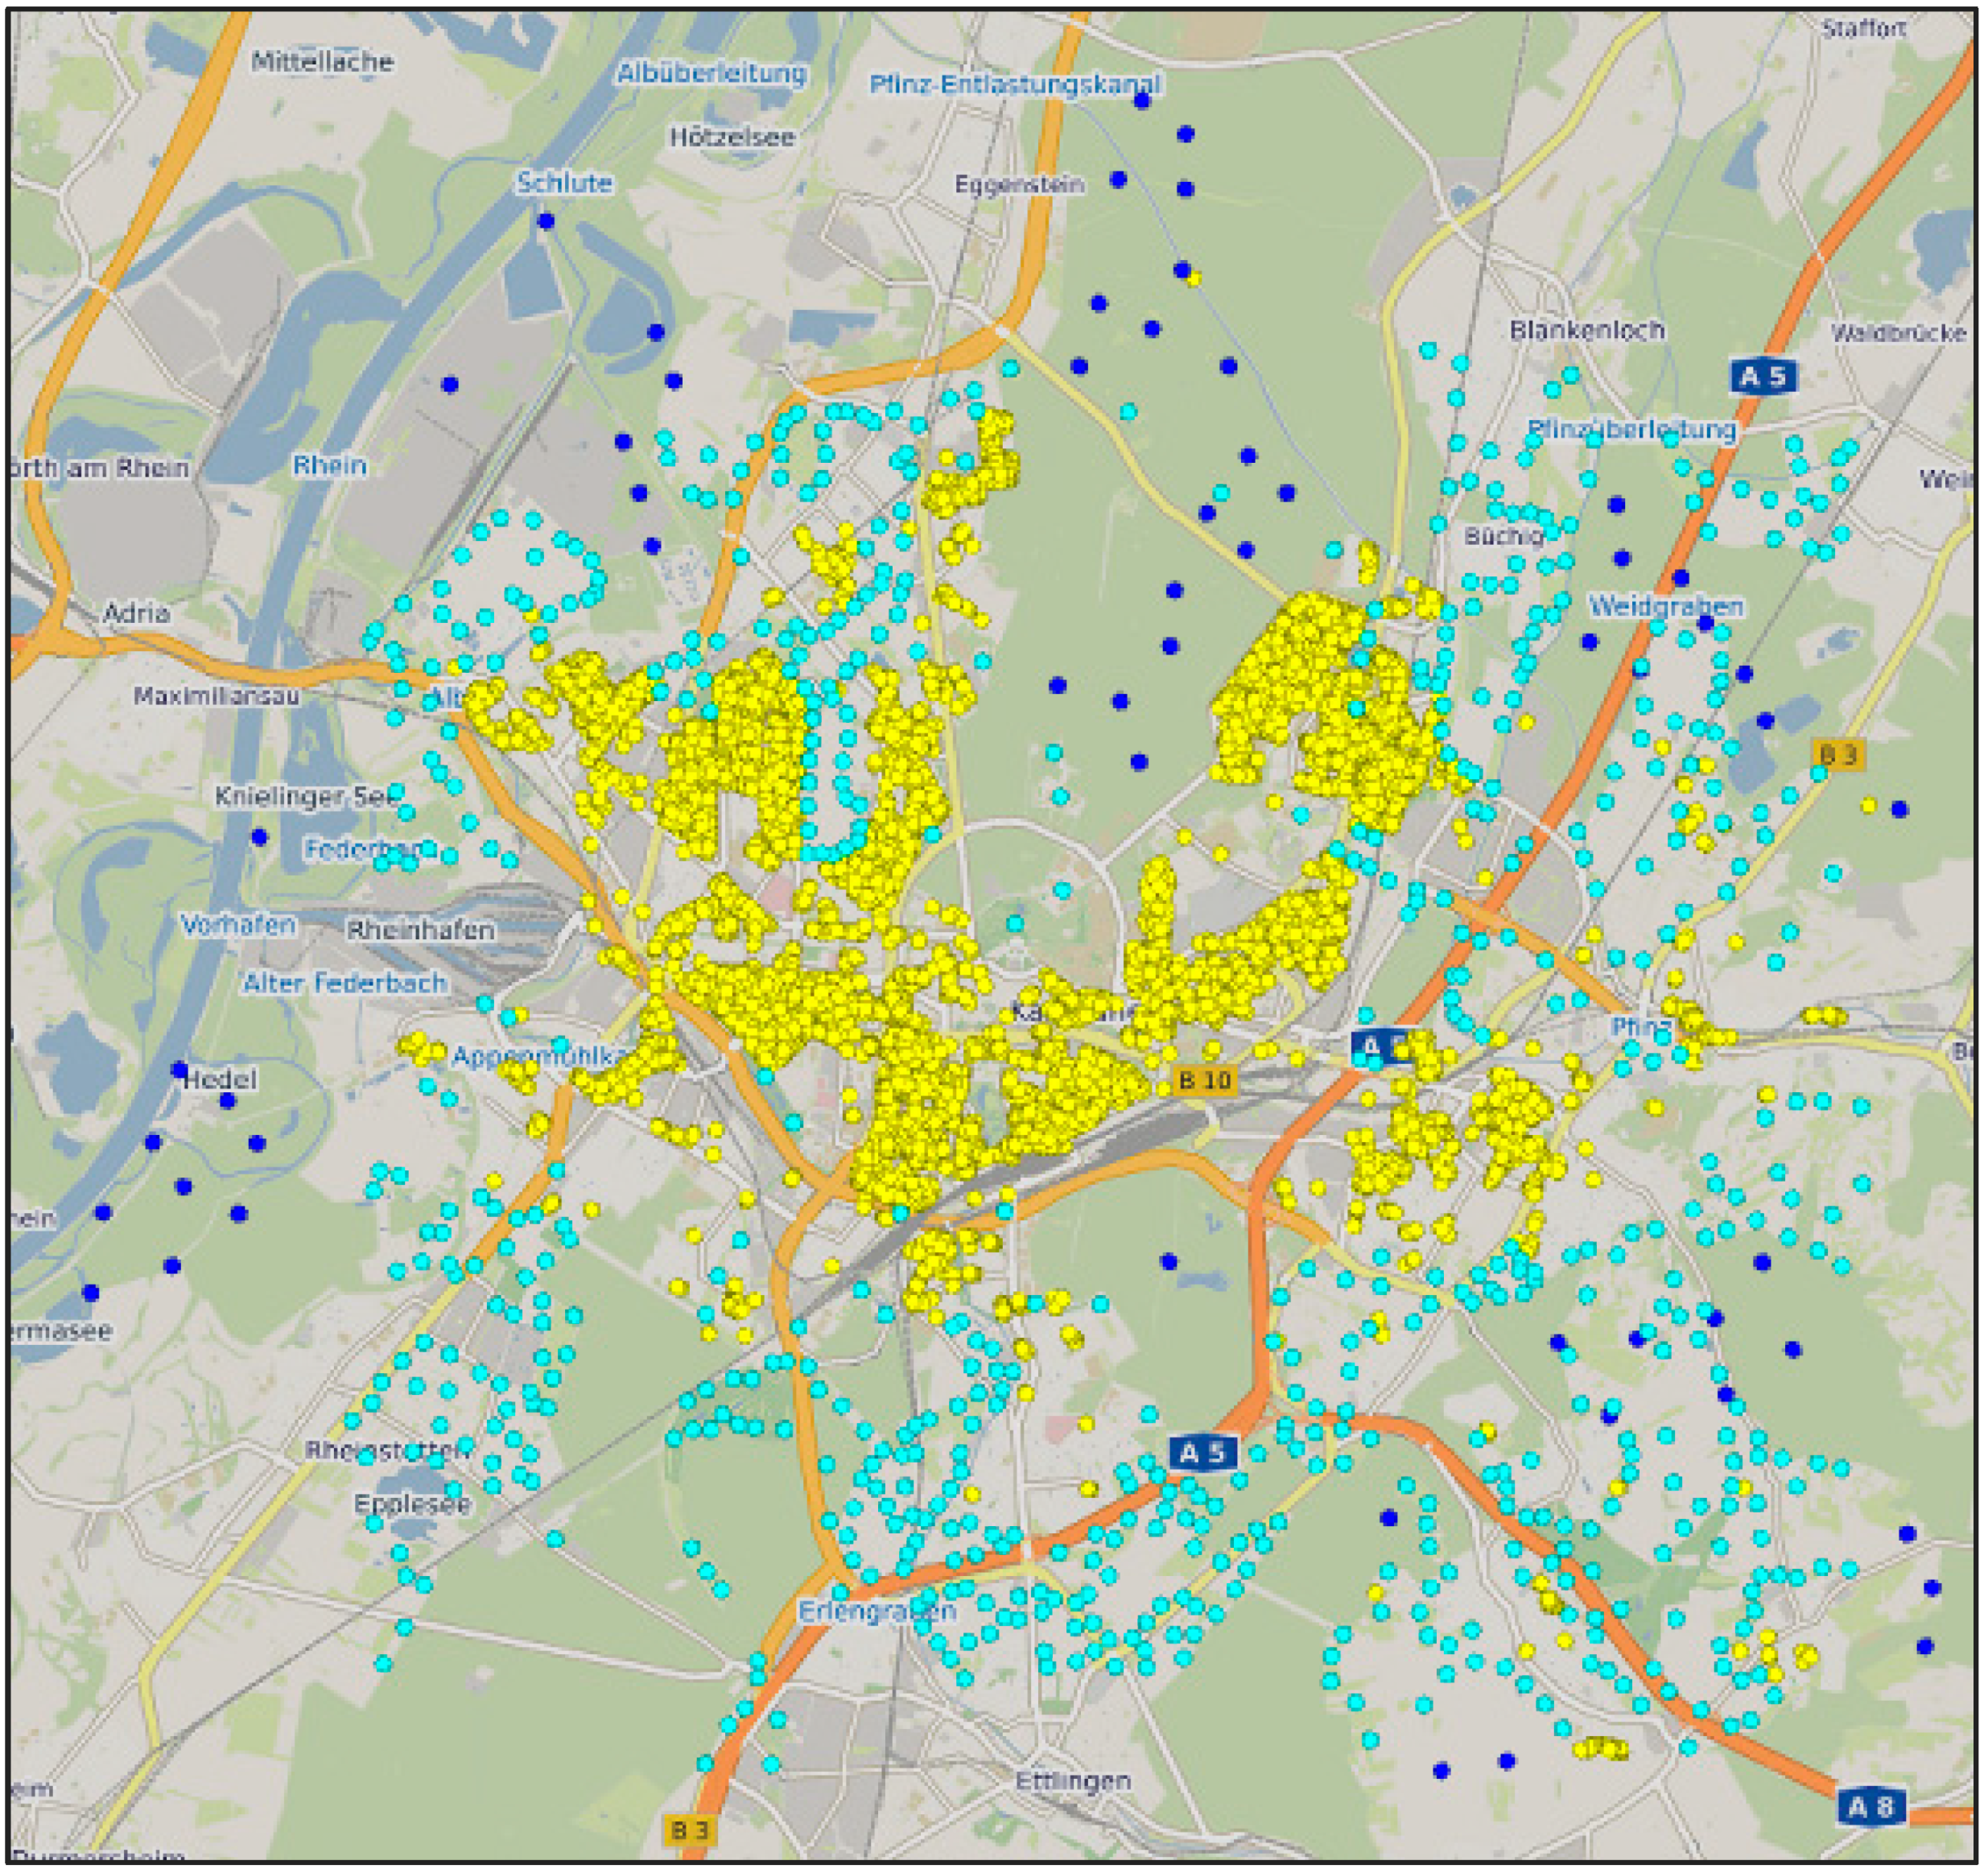
4.1. Photovoltaic Plants and Wind Turbines
To enable consideration of local preferences in the agent-based simulation, we had to provide the evaluation framework with the geographic context of potential wind turbine and photovoltaic plant locations. As no official data for such locations were available, we applied potential wind turbine locations according to the German regulations in the vicinity of Karlsruhe. As for the photovoltaic plants, potential locations were identified in every suitable area within the city—mainly in meadows and green places. Naturally, the wind turbines are located in the outer regions of the city, while the photovoltaic plants are located further within.
Figure 2 shows the locations used in the simulation in different colors (blue, cyan) in combination with the citizens’ residences (yellow).
4.2. Agent-Based Simulations of Global–Local Surveys
The survey participants are modeled as agents that vote in each survey round, globally and locally. The global voting values are generated according to a normal distribution, where the mean and standard deviation change with each survey round. In general, a rather positive global attitude towards renewable energy technologies with changing variance is assumed, interpreted as changing boundary conditions over time that influence the opinions of the participants. For this study, the mean values of the distribution functions for the global voting value for photovoltaic power were equal to or higher than the mean values in the context of voting on wind turbines. In most survey rounds, the standard deviations in the context of wind power are equal to or higher than those of photovoltaic power. This can be interpreted as a more positive attitude towards photovoltaic power, with fewer uncertainties.
In our setting, the local voting value of a participant depends on the current global voting value and the distance to the next wind turbine or photovoltaic plant. The basic idea of setting the local voting value is as follows: the closer the participant lives to the specific implemented technology, the greater the deviation from the global voting value; the higher the global voting value, the more this deviation may vary. Here, the local voting value is always equal to or smaller than the global voting value. We assume a rather negative attitude towards implementations in the immediate environment, although this attitude is less rigid if a participant is already positive in the global survey.
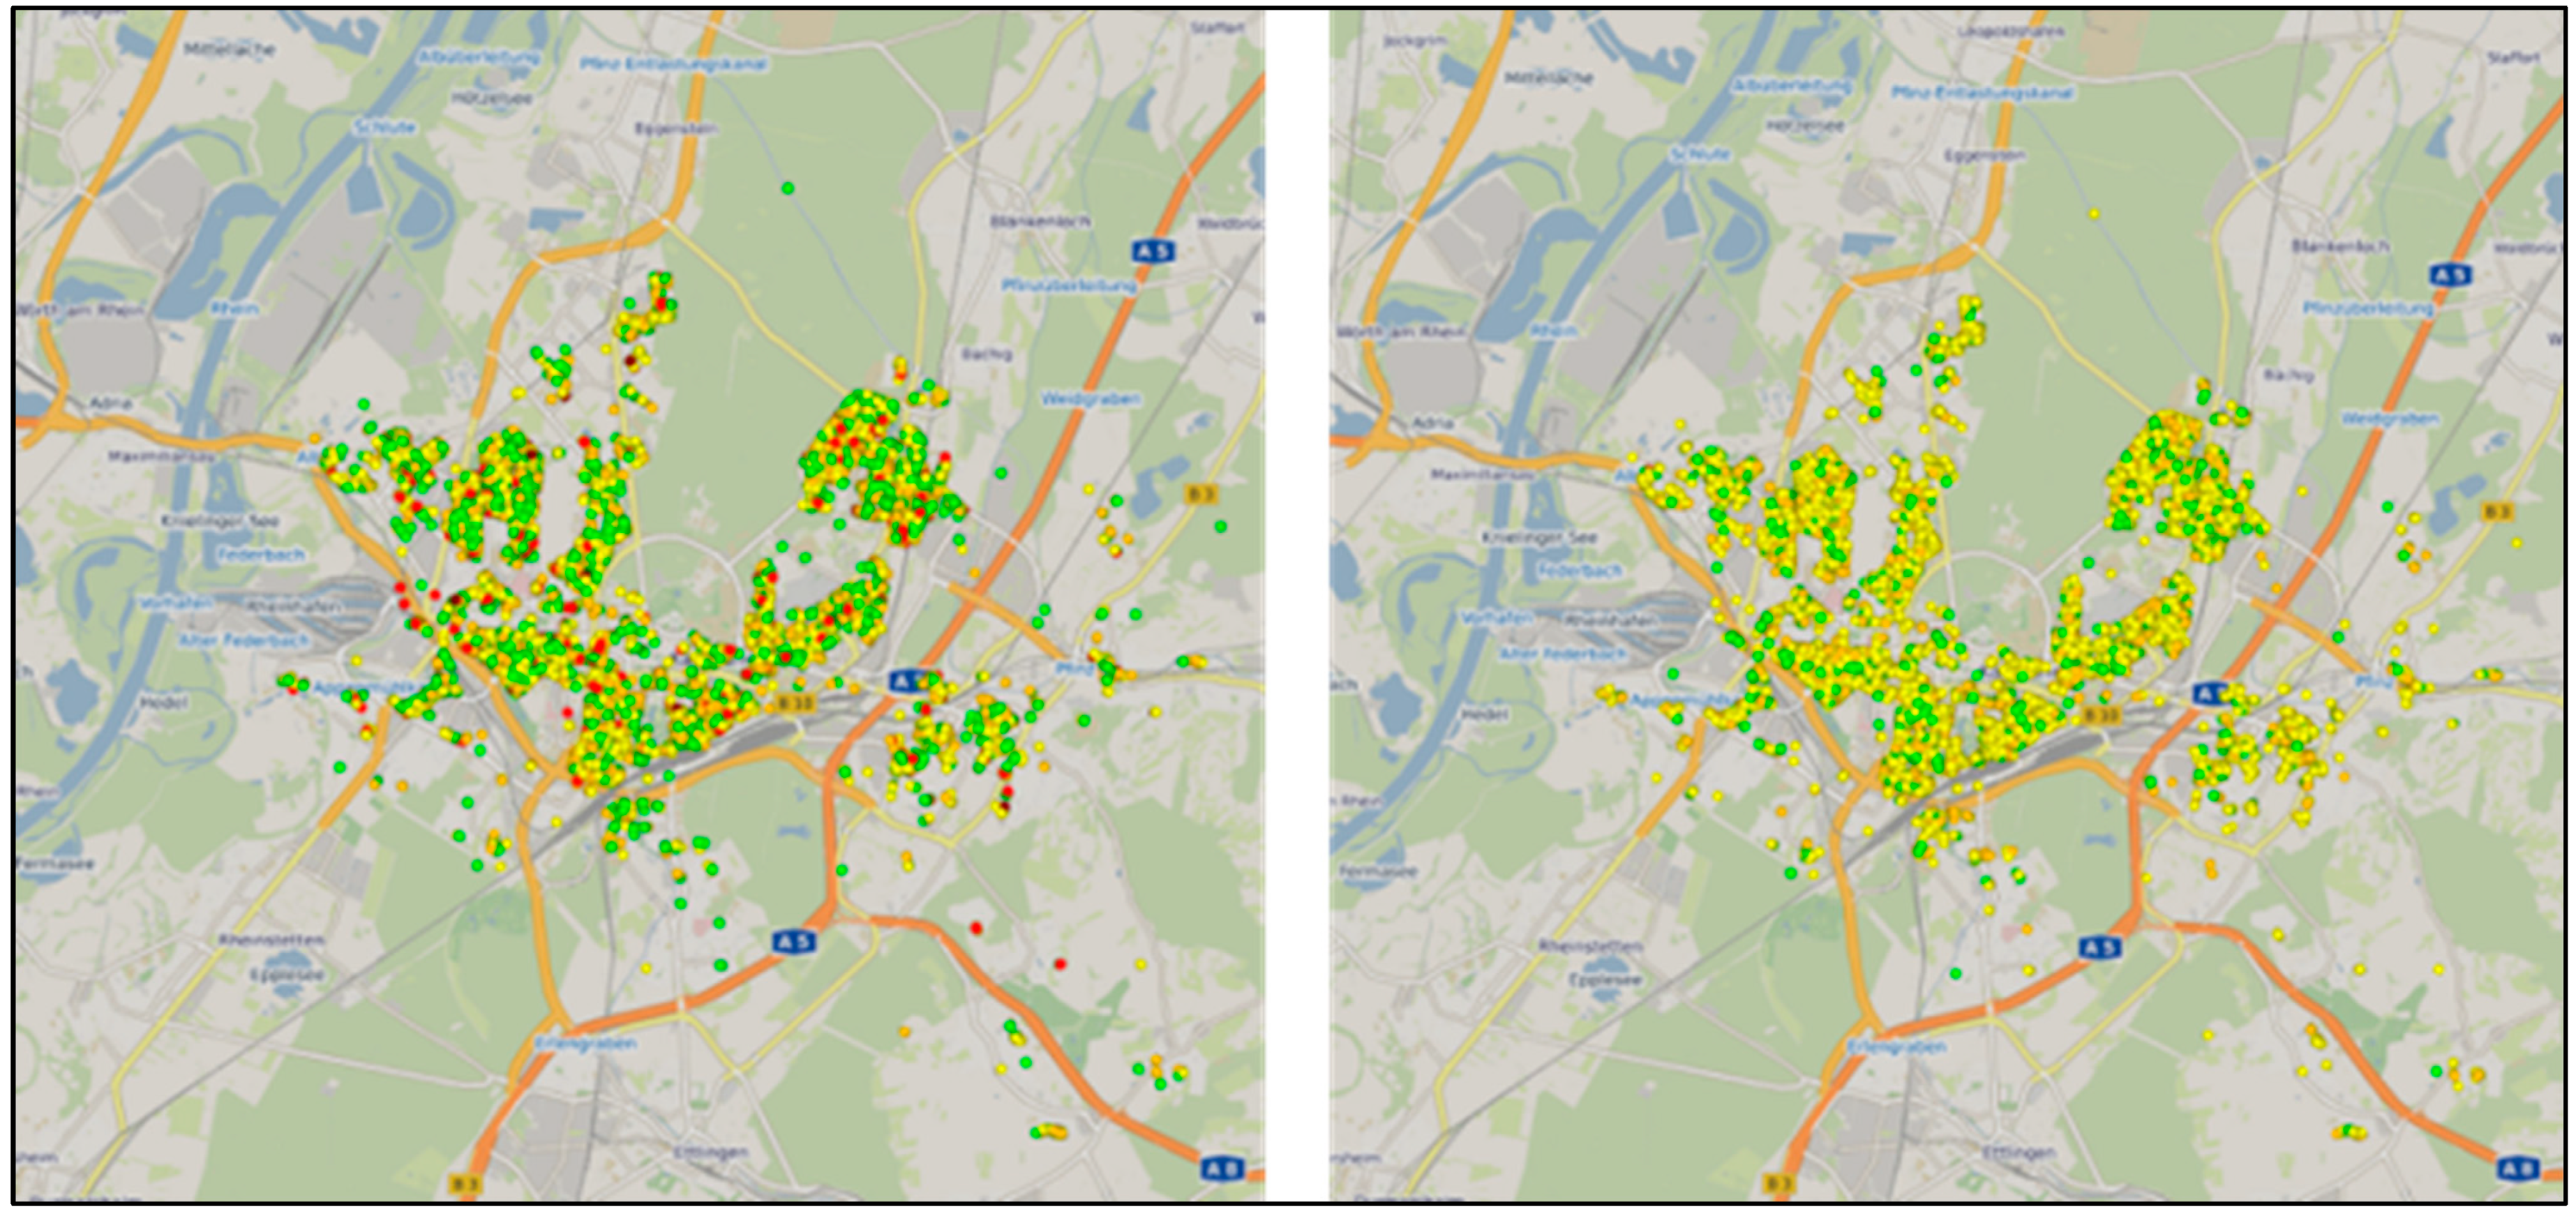
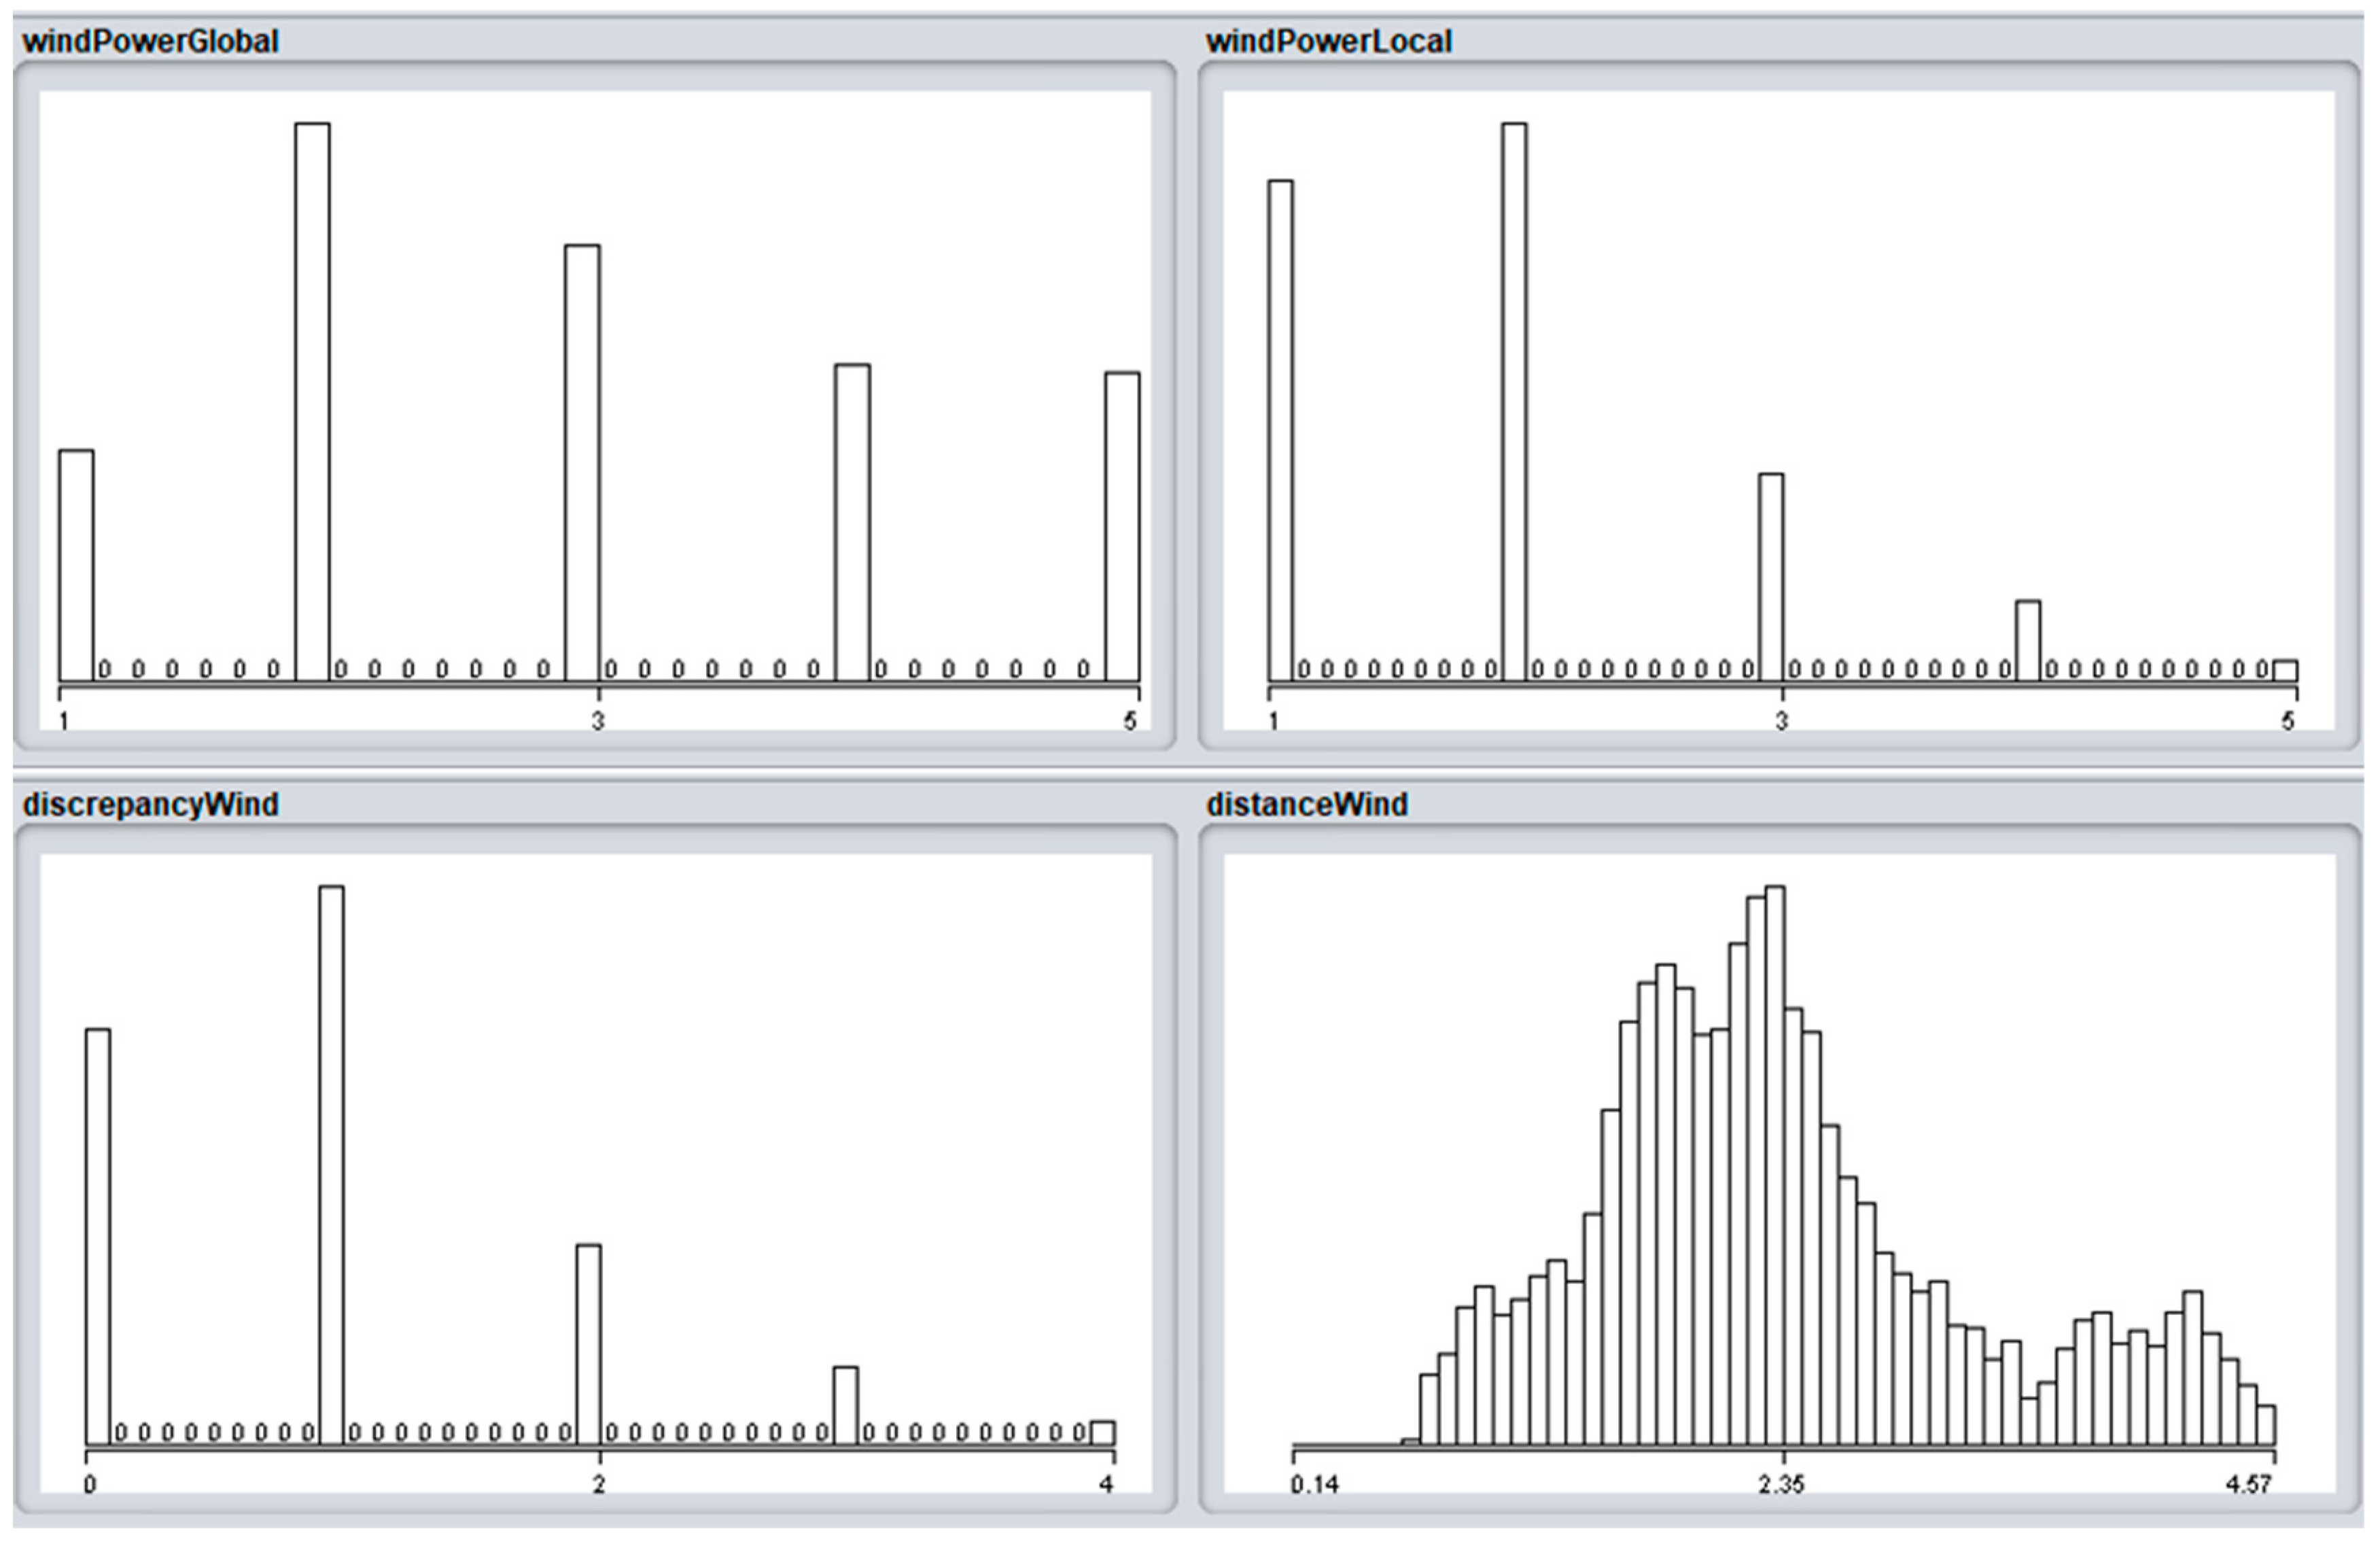
4.2.1. Global Survey
At each survey round, the general opinions of citizens are elicited in a global survey, providing an overview of these opinions with respect to both wind turbines and photovoltaic plants. In general, the attitudes are positive towards SETs but even more so towards photovoltaic plants (
Figure 3).
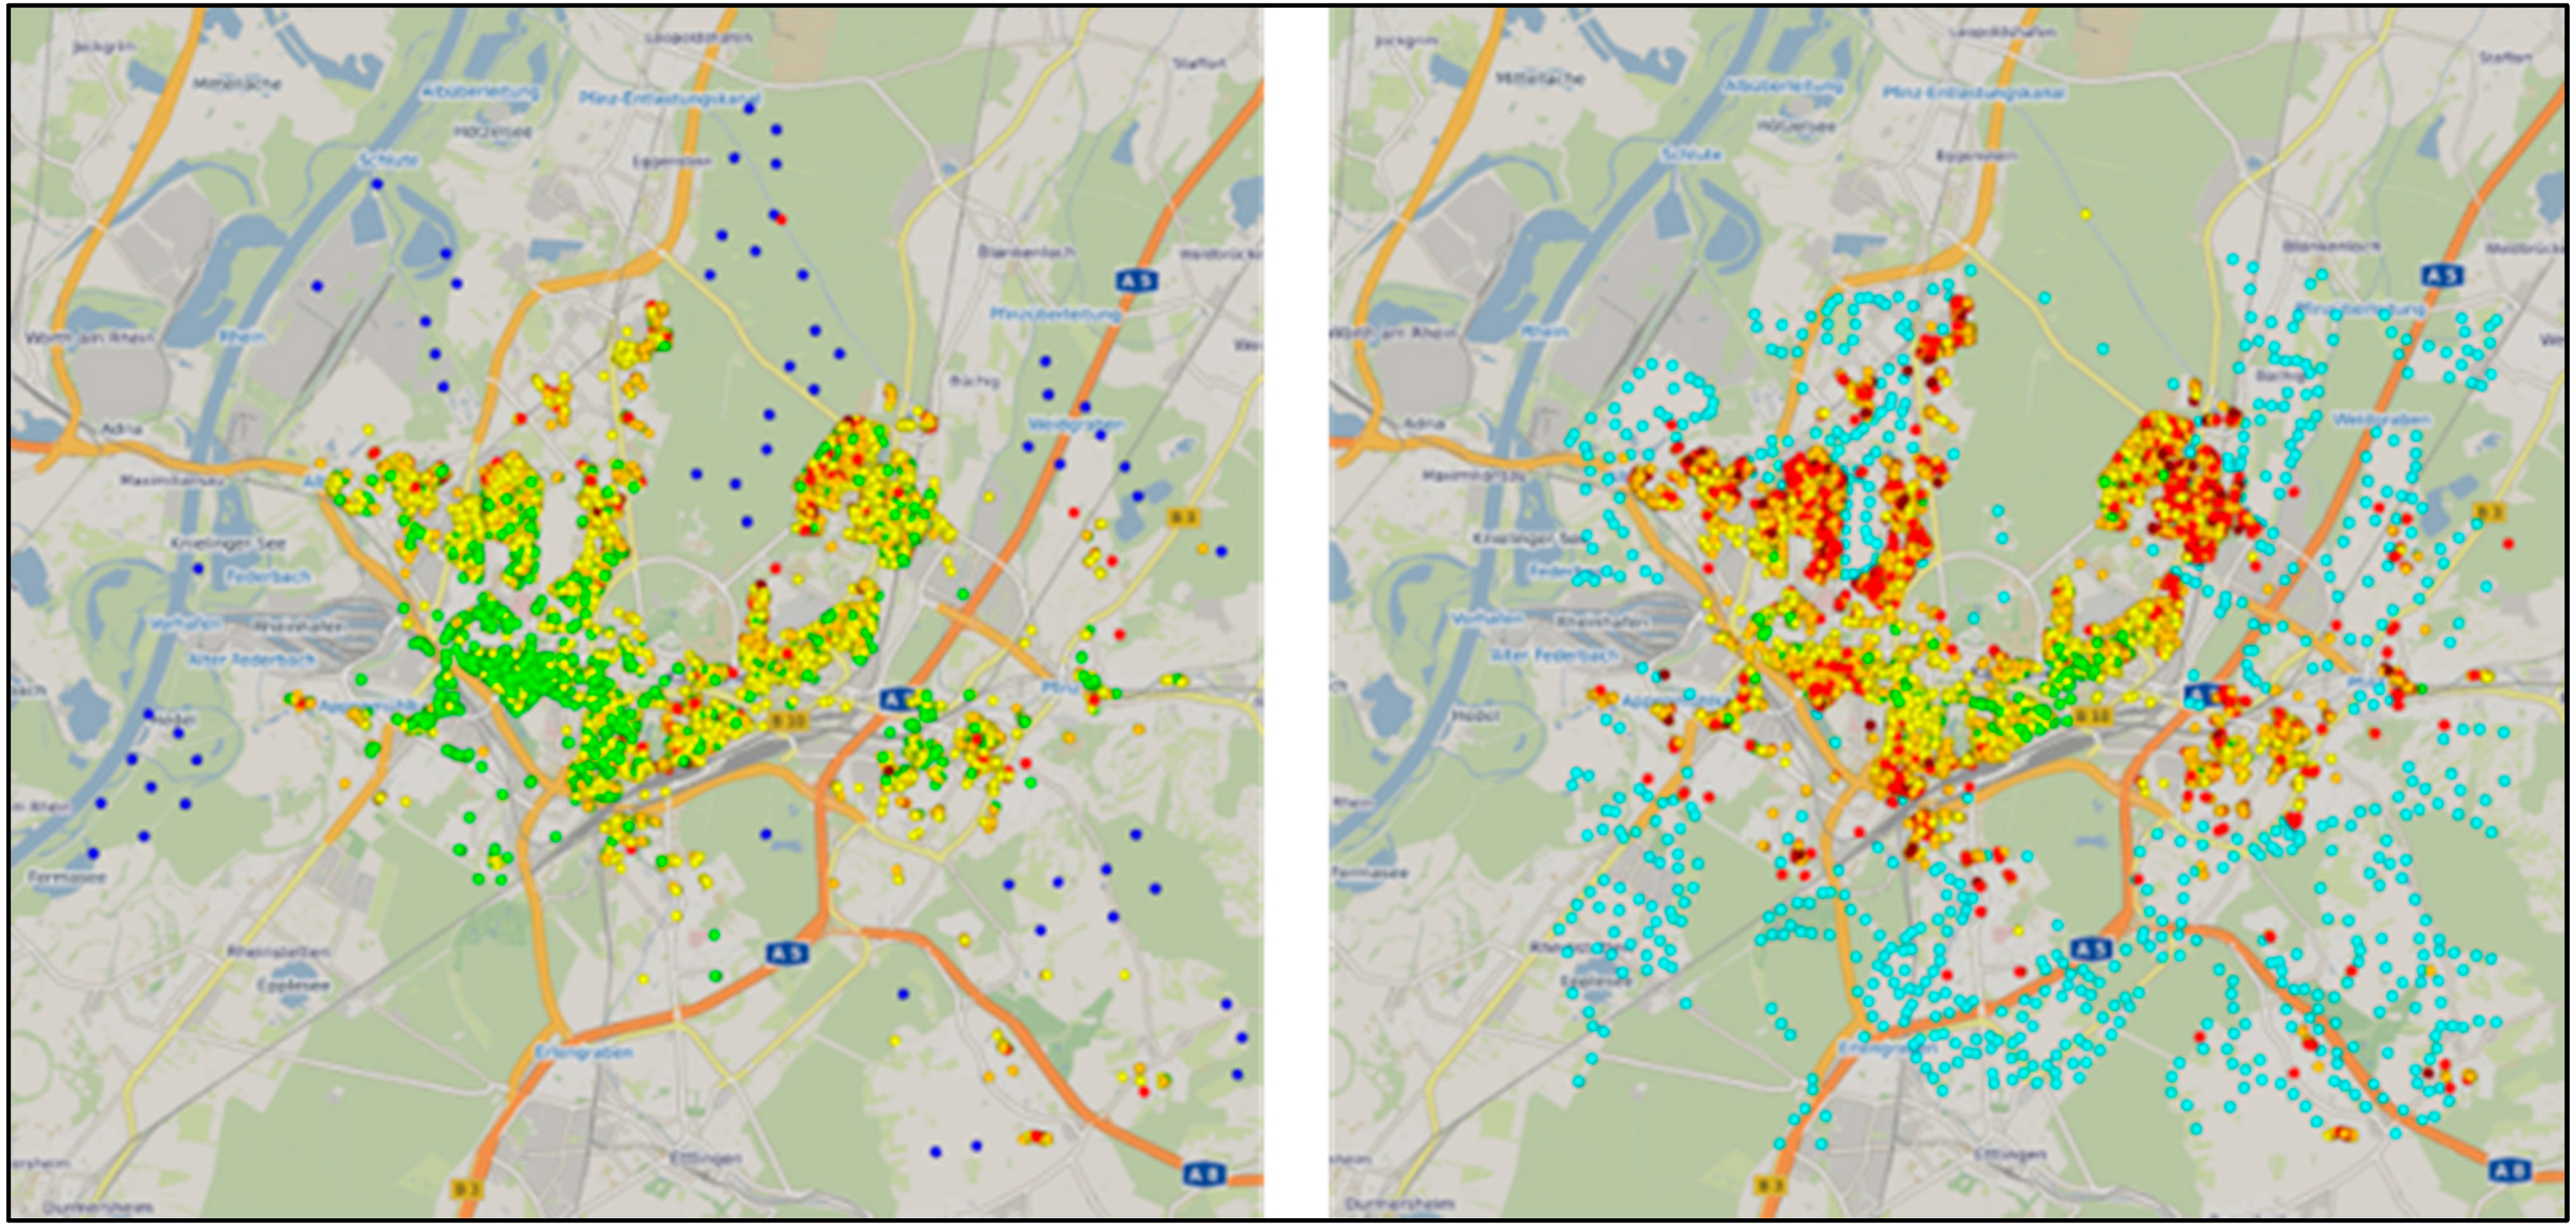
4.2.2. Local Survey
The local survey is carried out some time after the global survey, and illustrates the discrepancies that emerge when comparing global and local voting values, as modeled citizens tend to change their opinion if the respective technology is to be implemented in their immediate vicinity (
Figure 4).
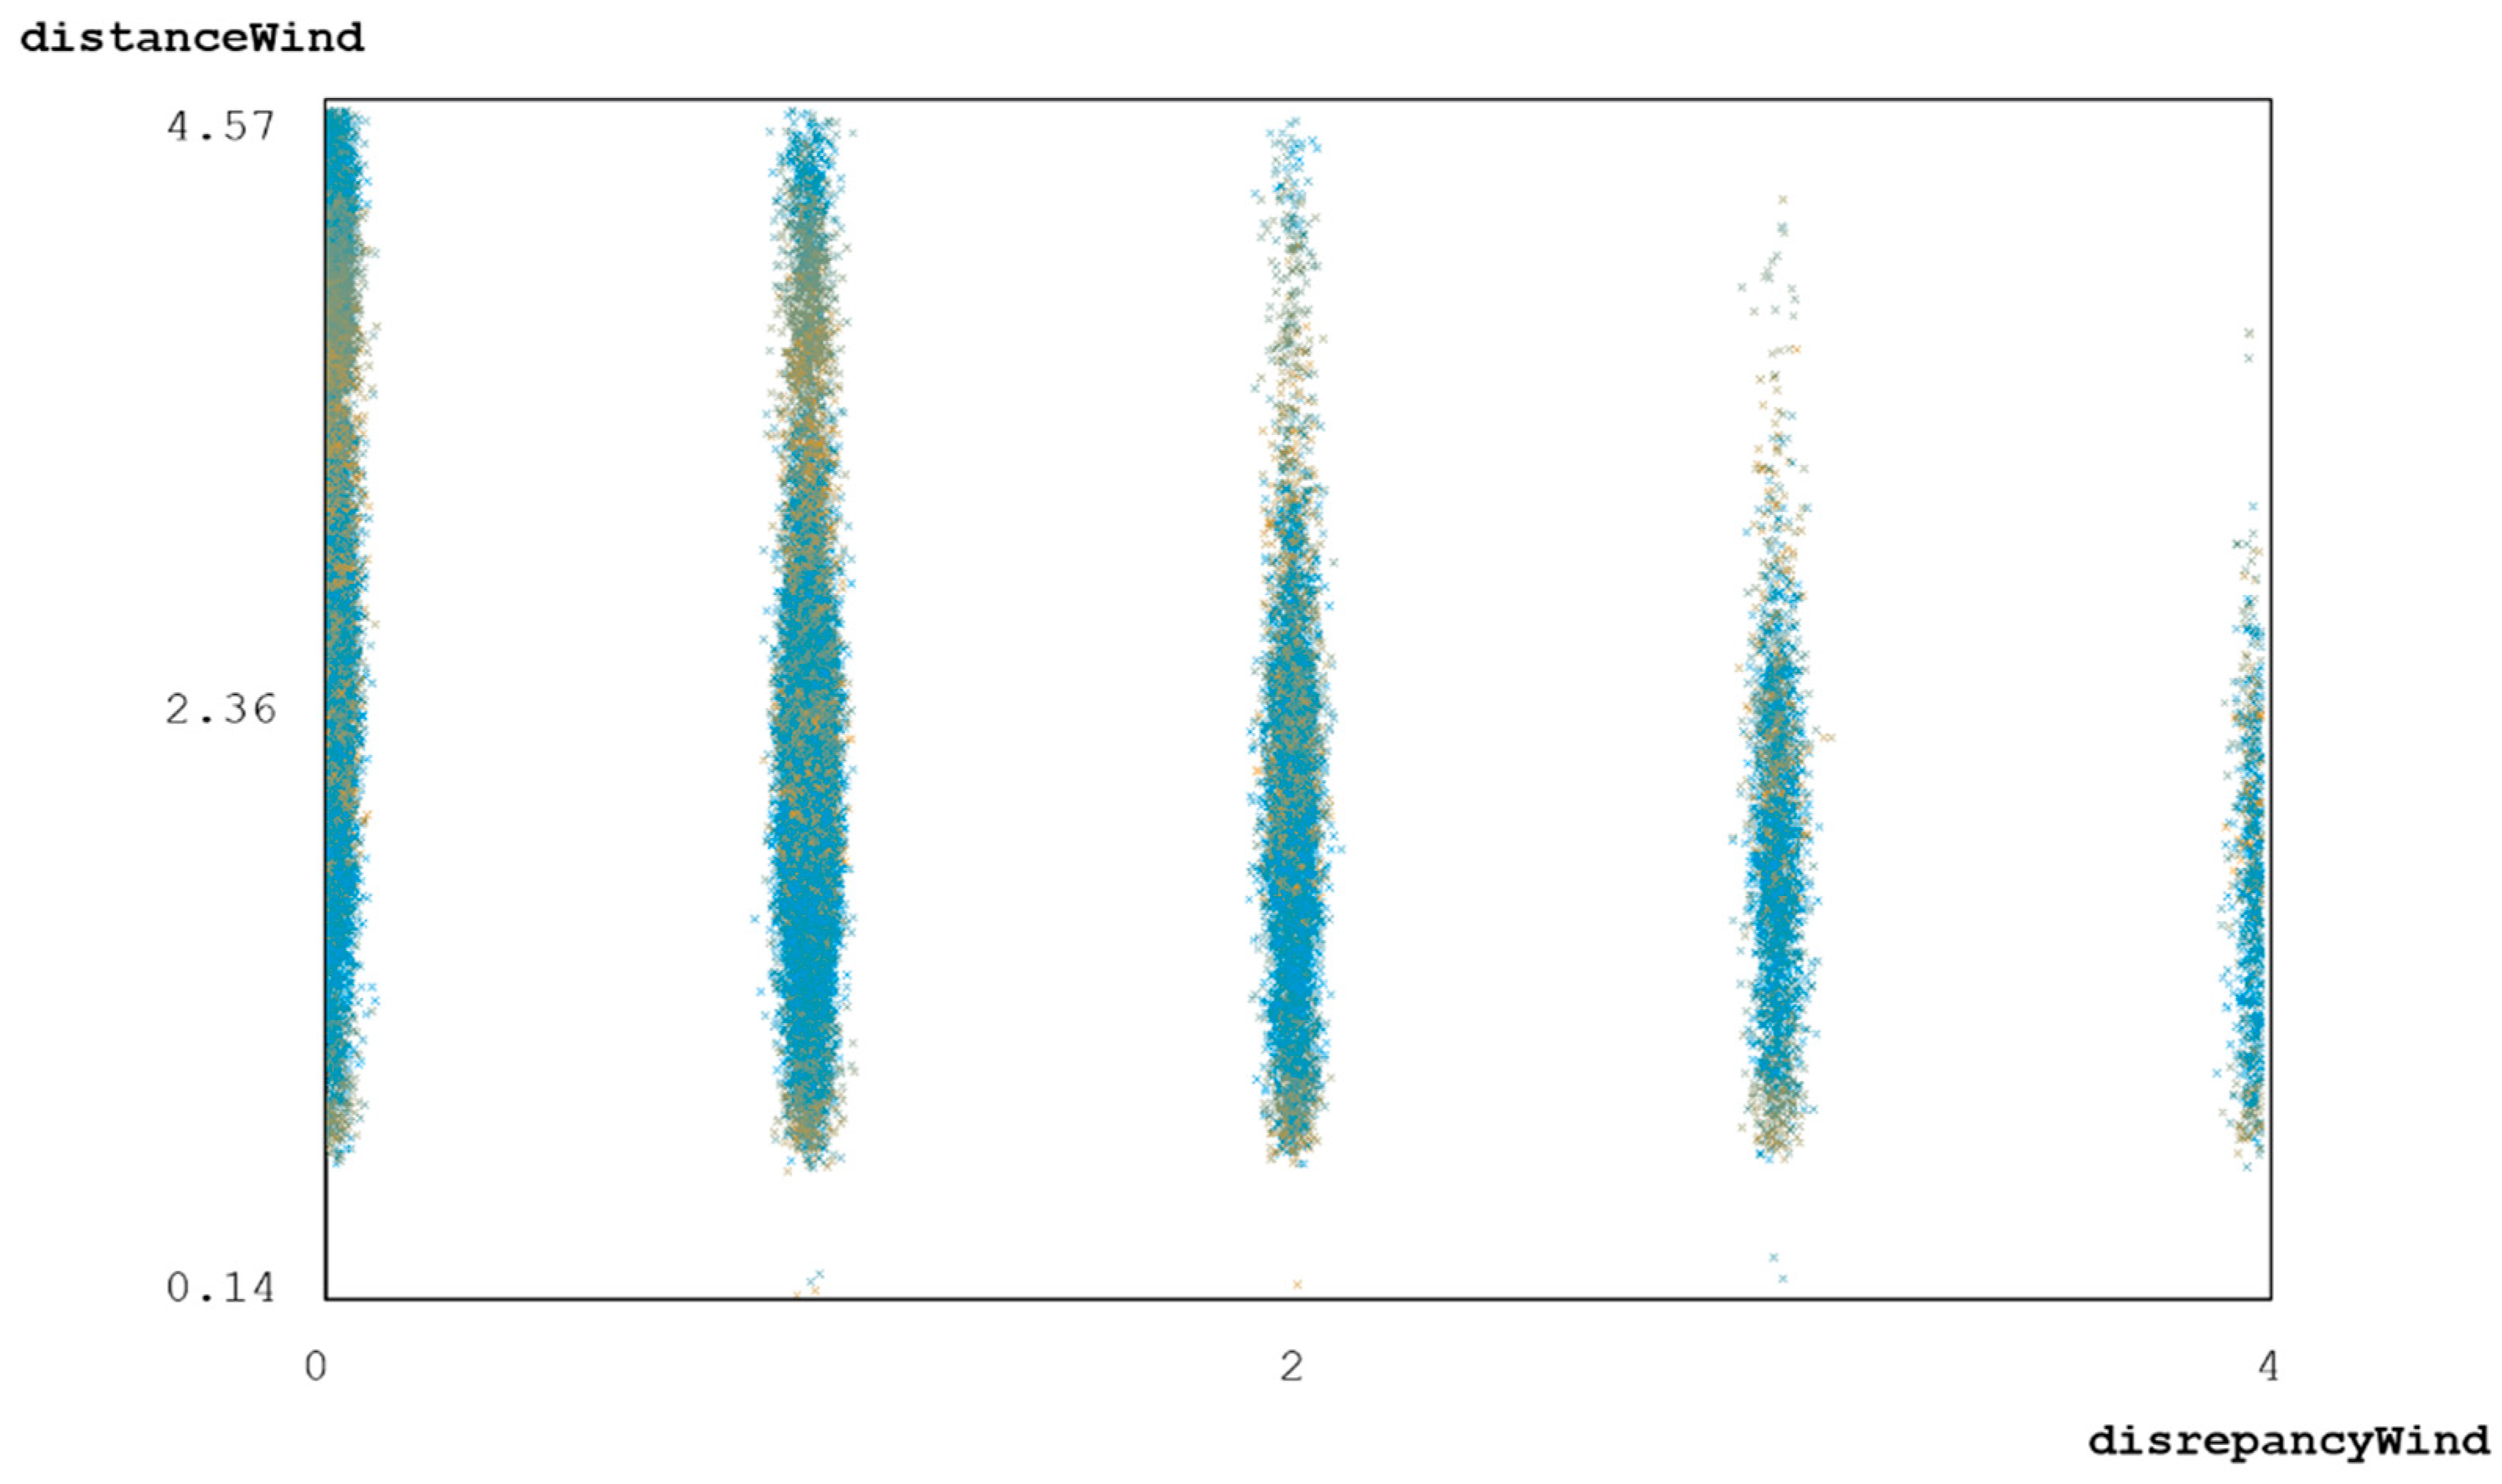
4.2.3. Statistical Analysis and MCDA
After each round of the survey, emerging discrepancies can be statistically analyzed and presented to the decision makers in various ways—e.g., as images, as illustrated above—to help them to identify the relevant factors and to better understand why citizens’ opinions differ from their general attitudes toward SETs. As we do not have access to the socioeconomic data of the different households, we solely focused on citizens’ locations to illustrate our methodology. As we have already seen, the distance to the next potential wind turbine or photovoltaic plant influences opinions on local implementation of SETs. Decision makers can now consider these insights when consolidating aggregated global and local surveys in each survey round. They could acknowledge these discrepancies and, for example, weight local surveys higher than global surveys, or rate global opinions—in this example, more positive opinions—higher, and take the discrepancies into account when weighting criterion
. Technological mixes are also implicitly associated with a particular implementation, and a high weighting of
may preclude area-wide implementations in the immediate vicinity. For this reason, we weighted global surveys higher than local surveys—in part because global attitudes toward SETs are generally positive, but favor a particular technology. In this context, further visual support can help decision makers to capture the participants’ opinions and personal prerequisites, as exemplarily provided for wind power, illustrating distributions of global and local opinions towards wind power, discrepancies, and potential distances to nearest wind turbines (
Figure 5).
Figure 6 shows that higher discrepancies tend to be associated with greater distances.
After the final round of surveys, the findings on citizens’ opinions of SETs are aggregated over time, and provide values for the criterion of the subsequent MCDA.
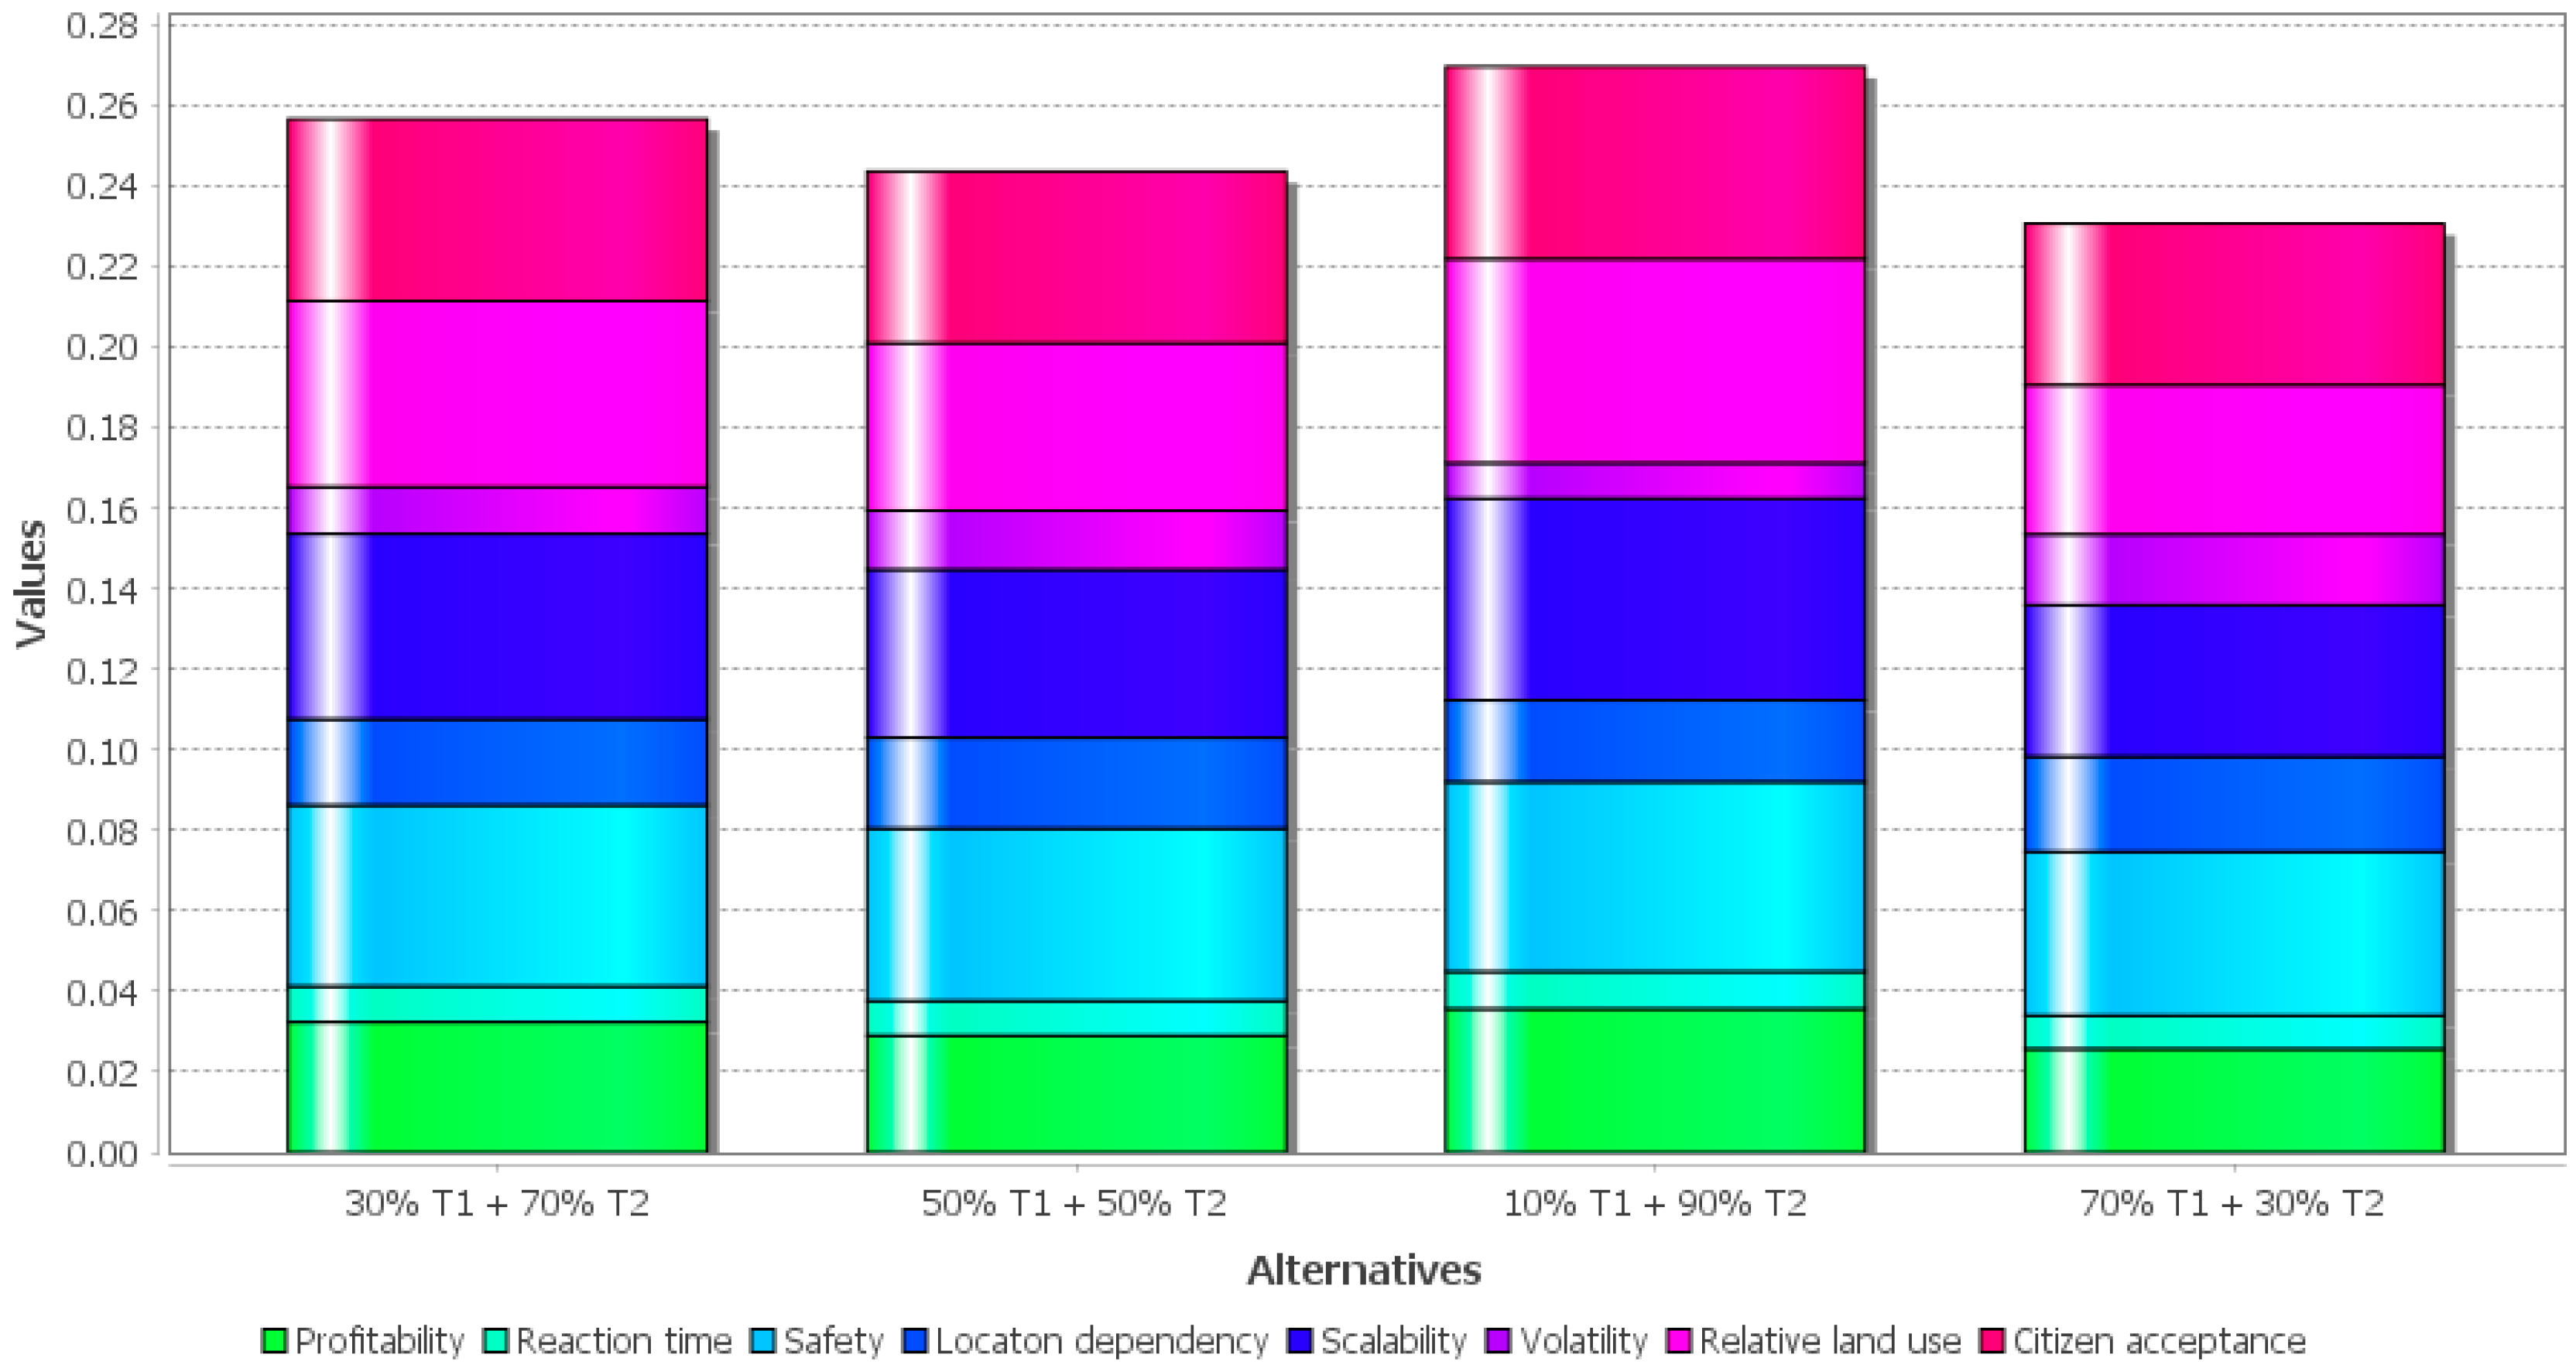
The MCDA is carried out on the basis of the decision alternatives and criteria presented in
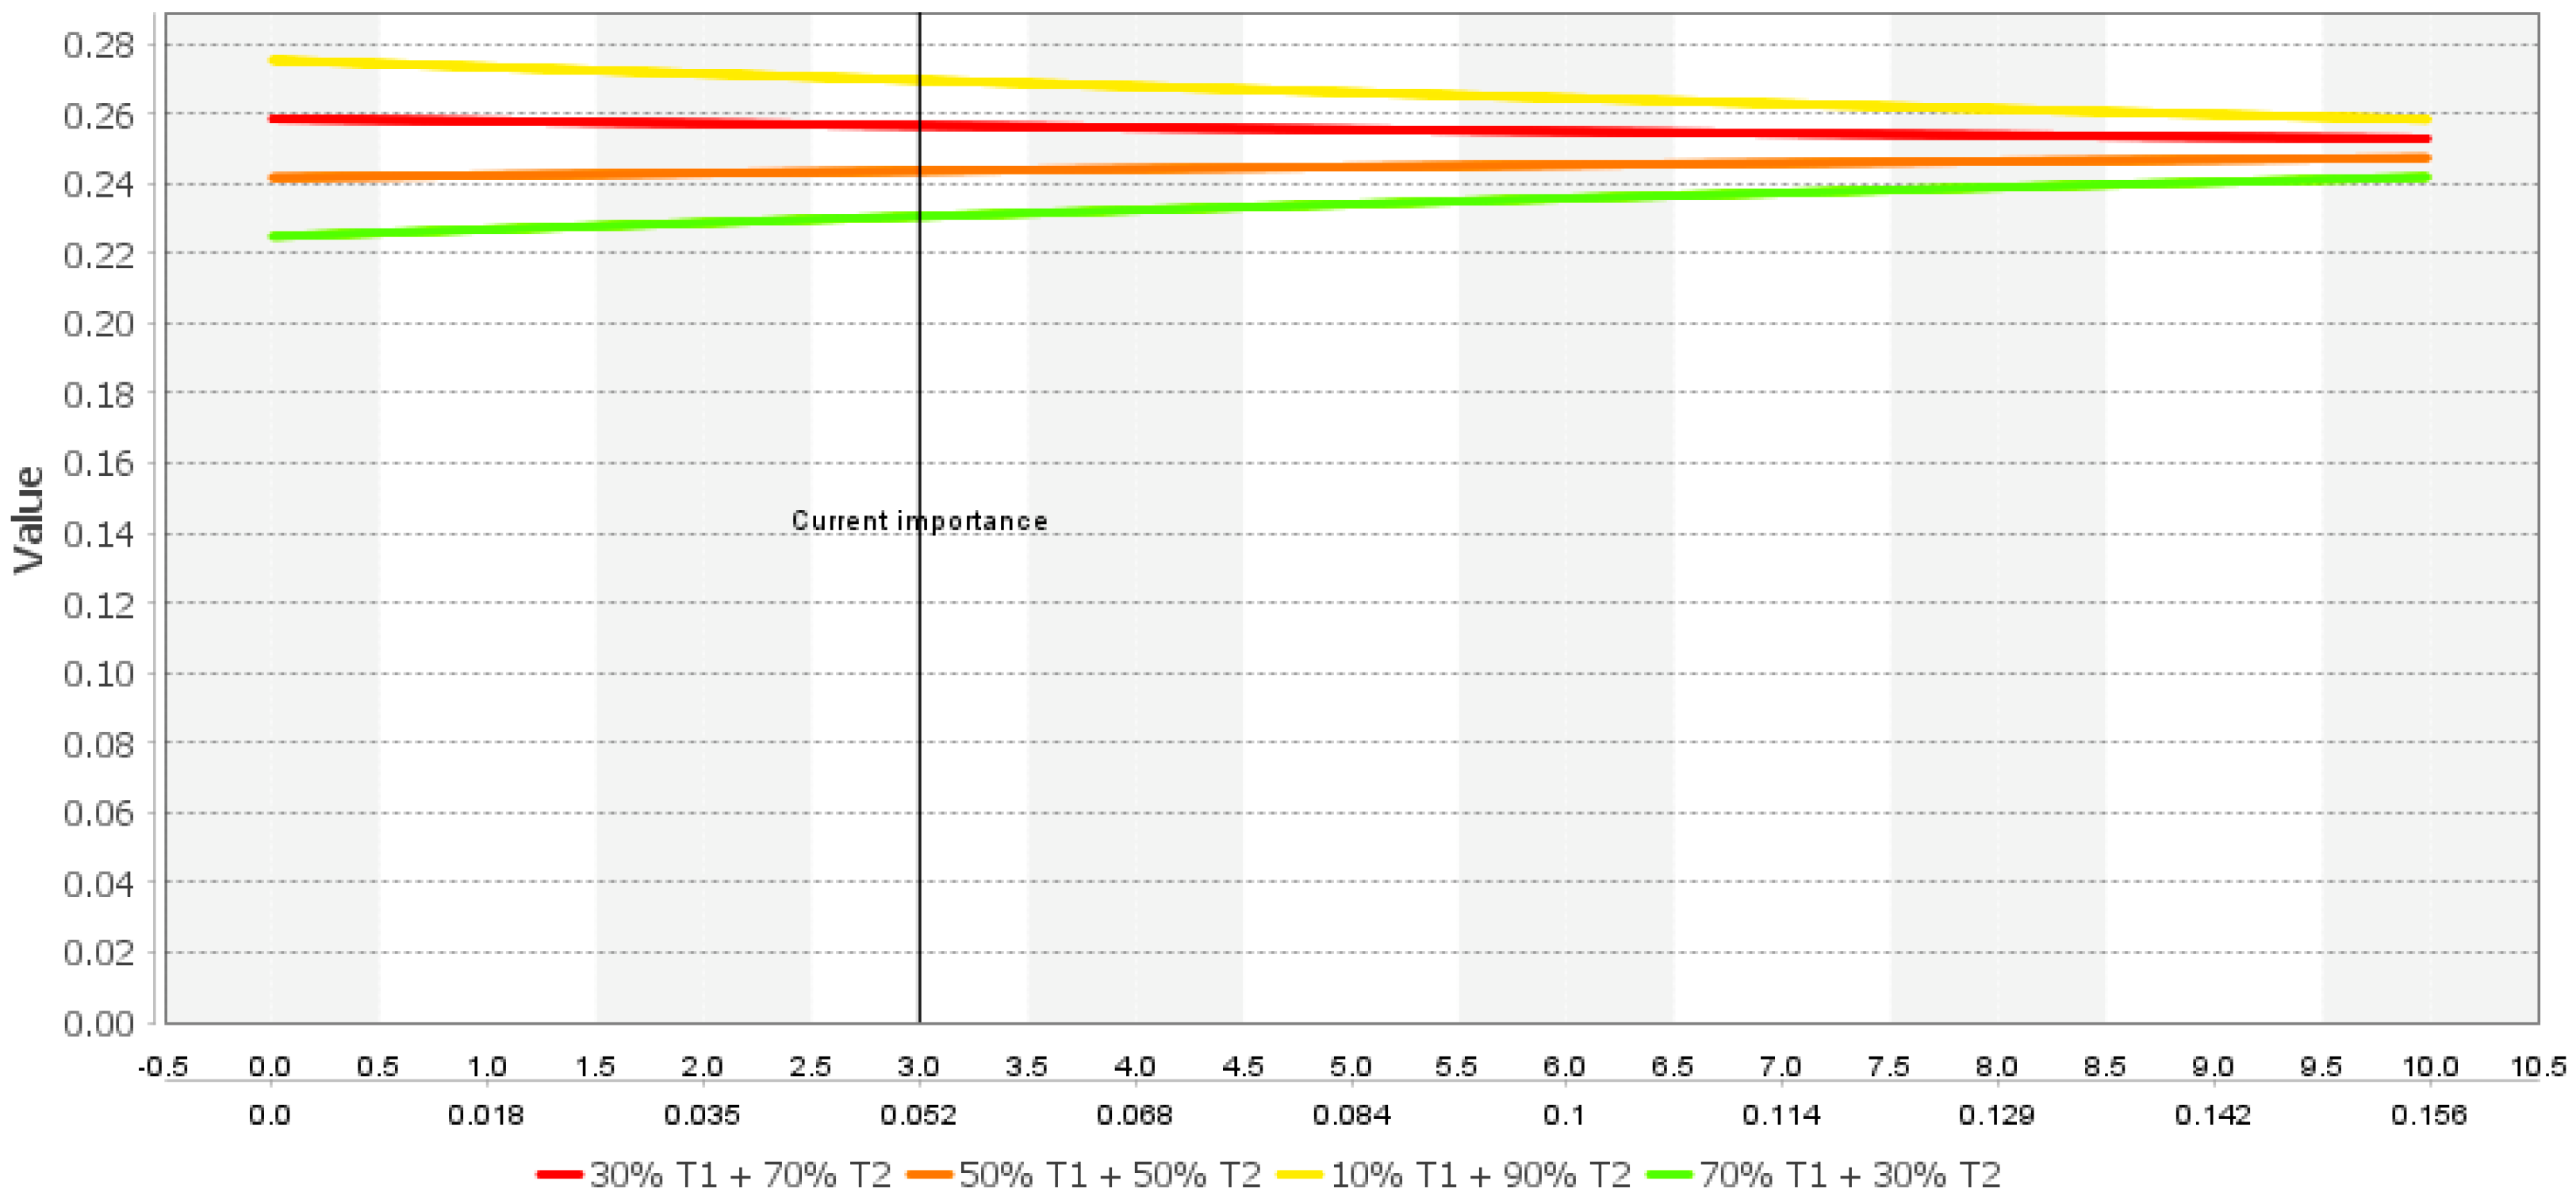
Table 2. In this study, the scores of a decision alternative with respect to a specific criterion are based on a qualitative assessment of the different technologies with regard to the criterion in question. The assessment is set out as follows: Profitability, scalability, and relative land use are significantly better rated for photovoltaics than for wind power. The reaction time and safety receive a medium-to-positive assessment—similar for both technologies, but better for photovoltaic. Location dependency is positively assessed for both technologies, but better for wind power than for photovoltaic power. Volatility is rated negatively for both technologies, with wind power scoring slightly better. Safety, scalability, relative land use, and citizen acceptance receive the highest weights in the overall assessments, followed by profitability. Reaction time, location dependency, and volatility receive the lowest weights. Each score is normalized proportionally to the sum of all existing scores. In this setting, the technological mix of 10% wind power and 90% photovoltaic power has the highest rank in the overall assessment (
Figure 7). The option with 70% wind power and 30% photovoltaic power is the least popular. In addition to the absolute rankings of the decision alternatives, the decision makers can also see the contributions of each criterion to the overall assessment.
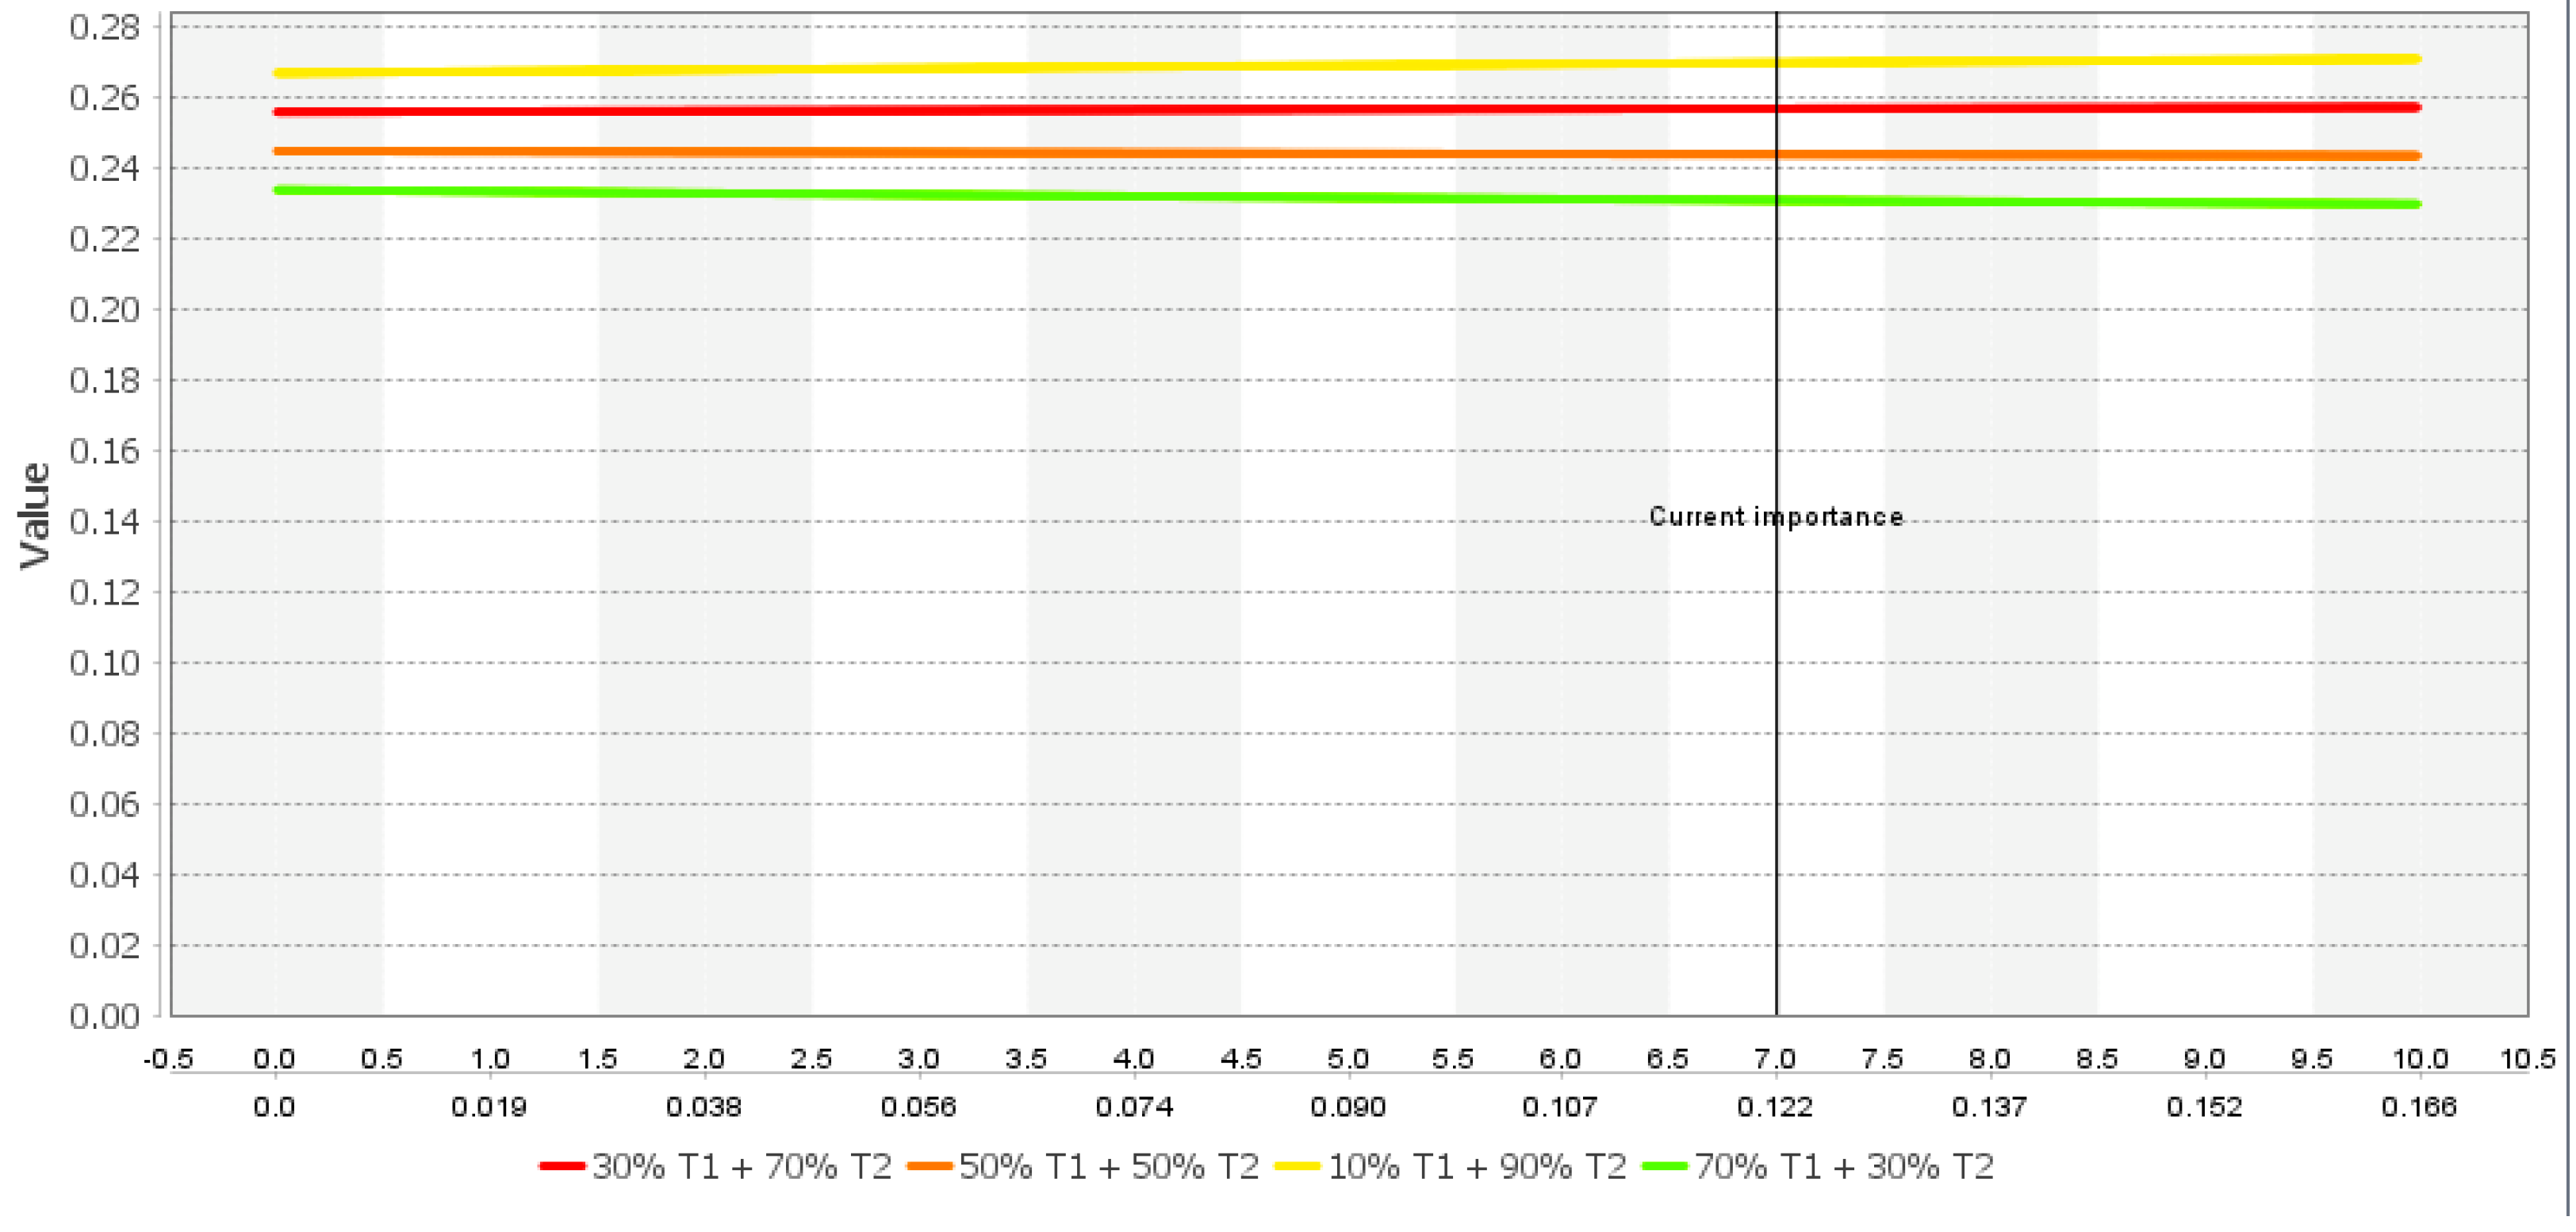
The next step is to analyze the stability of these results and their robustness against small value/weight changes. For example, changing the weighting of a criterion does not affect the ranking of alternatives. If the weighting of the criterion “profitability” were increased, the assessment of the highest ranked alternative would improve, and the assessment of the lowest ranked alternative would deteriorate; reducing the weight would have the opposite effect. If the weighting of the criterion “location dependency” were increased, the assessment of the highest ranked alternative would deteriorate, and the assessment of the lowest ranked alternative would improve; reducing the weight would have the opposite effect. The “scalability” criterion has a high weighting; reducing the weighting would worsen the assessment of the best ranked alternative and improve the assessment of the worst-ranked alternative; the same applies to the criterion “relative land use”. Changes in the weights of the criteria “reaction time”, “safety”, and “citizen acceptance” have little effect on the evaluation of the alternatives. The strongest effect when changing the weighting is observable for the criterion “volatility”; as the weighting increases, the differences in the assessments of the individual alternatives decrease.
Figure 8 and
Figure 9 illustrate analyses of the criteria “profitability” and “volatility”, respectively.
Therefore, the result is robust to changes in the weighting of individual criteria. However, changes in the weighting of the criterion “volatility” make the assessments of the decision alternatives less distinguishable.
Sensitivity analyses can also be performed with respect to technological mixes. The decision alternatives are formed from certain percentage shares of wind power plants and photovoltaic plants. The higher the percentage of wind turbines in the technological mix, the worse the corresponding decision alternative is evaluated. The evaluation of the decision alternatives thus decreases with increasing weighting of the wind turbines.
Visual support, such as that used in this study by means of a sophisticated MCDA tool, clearly helps decision makers in deciding between different technological mixes.
5. Conclusions
Regional energy system planning and the decentralized integration of sustainable energy technologies should be carried out in cooperation with the population through suitable participation and engagement formats. Although the achievement of climate goals through climate protection measures is generally highly respected, concrete regional integration of sustainable energy technology and grid expansion potentially meet resistance if implemented nearby. The question is how decision makers, such as grid planners or politicians, should deal with these ambiguities. This paper presents a novel decision support methodology for the exemplary task of integrating sustainable energy technologies, which deals with the ambiguities that arise in opinion surveys on local implementations of these technologies. The methodology includes structured double surveys to help reveal ambiguities. Moreover, the approach suggests statistical analyses to identify socioeconomic factors driving the discrepancies. Based on the additional insights gained and the multicriteria decision analysis proposed, decision makers are offered multiple possibilities to decide how to take these ambiguities into account in order to fairly consider citizen acceptance alongside other criteria. The cascading procedure to aggregate single-level surveys in multiple stages—each with the possibility for statistical analysis and specific parametrization of the aggregation—shows a structured, novel, and general way to approach similar challenges, and is therefore applicable in a wide variety of problems where ambiguities referring to a group of stakeholders may occur. The double surveys in particular serve as a procedural innovation step (especially in the context of smart cities) to make precisely these ambiguities visible and workable. The evaluation of the suggested process flow by simulation of the survey behavior of artificial stakeholders and their changes in attitude over time proved the validity and applicability of the suggested method on the one hand, and on the other showed a practicable means of evaluation when no real survey data or stakeholder participation is readily available. As is common for multicriteria decision analysis, this approach depends on the specific executing operator and, thus, can only provide the means to identify potential drivers of discrepancies. The resolution by determining weights and aggregating is subjective to the operator.
Several directions for future work are apparent. The selection of socioeconomic factors in the context of statistical analyses of discrepancies regarding dominant factors, the treatment of marginalized groups, etc., is a topic that must be deeply researched. A balanced composition of participants and the consideration of different groups each play a role, especially in the aggregation of the global and local survey results. It is essential to more closely examine how to deal with imbalances as well as, if necessary, a changing group composition. In addition to the pure information presentation of statistical analyses, methodologies need to be developed that systematically support decision makers in deriving robust decisions or alternatives from the insights gained from statistics. These issues are the subject of current research, and will be further explored in the context of real surveys and studies at the methodological level, where data privacy and data protection are considered with utmost caution when dealing with socioeconomic data. Furthermore, plain correlations such as those seen in the discrepancy maps can easily be determined. However, complex statistical analyses may be difficult to perform and present to the decision makers in a meaningful way, thus causing further difficulties as to what to infer from the given information in a specific case. The results of these analyses influence both the values of the citizen acceptance criterion and its weighting in the multicriteria decision analysis. Transferring this knowledge to the personal preferences and weightings is a complex undertaking, and of course requires further research. Furthermore, against the background of iterative surveys with a representative or fixed stakeholder group, the handling of bias and associated distortions in the results should be systematically investigated. To illustrate the added value of our methodology, we set up an agent-based simulation framework to iteratively conduct global–local surveys and generate synthetic data, based on specific participant voting behavior derived from empirical data. For future work, it would be beneficial to gain more knowledge in this respect, or to work with real data that are elicited via several structured survey rounds. In particular, information on the actual socioeconomic characteristics of a sample group of participants would help to better uncover the potential of statistical analyses in terms of discrepancies, and to improve approaches to processing the findings in order to make them useful for decision making.
Moreover, general aspects referring to multicriteria-based decision making for sustainable energy technology integration, including the selection and participation of appropriate experts and stakeholders, is the subject of current and future interdisciplinary research.


