1. Introduction
Many activities in the construction sector are labor intensive, so construction labor productivity (CLP) has a significant impact on time, cost, and quality of a construction project [
1,
2]. CLP is defined as a ratio of output (i.e., installed quantity) to input (e.g., labor work hours) or vice versa. Therefore, maximizing CLP is pivotal for enhancing the overall performance of construction projects in multiple areas, such as reducing variances from the primary plan and keeping projects on time and within budget. Therefore, construction companies are required to implement various CLP improvement strategies to enhance the level of influencing CLP factors and consequently improve CLP. In this study, a CLP improvement strategy is an individual management practice, such as a working method, tactic, or innovation, that construction managers use to improve CLP on their projects. Some examples of CLP improvement strategies include performing weekly reviews of crew compositions to ensure crew mix is per plan, providing clear instructions to craftspeople on how to complete tasks prior to execution, and scheduling regular inspections by the owner team to reduce interventions during project execution. However, budget, time, and resource constraints force construction companies to carry out only a limited number of CLP improvement strategies [
3]. Furthermore, in the complex environment of construction, CLP is affected by numerous factors that are mostly interconnected [
4,
5]. Thus, the actual impact of various factors on CLP can only be obtained using a systematic approach that models the interrelationships among them [
6]. However, most construction companies apply management practices, such as changing working times and switching the workweek, based on their managers’ experience and knowledge [
7].
Understanding factors that affect labor productivity is important for making strategic decisions and selecting appropriate CLP improvement strategies [
8]. Factors affecting CLP are multilevel, ranging from the activity level to the project, national, and global levels [
9,
10]. Therefore, different opinions of a construction company’s personnel (e.g., project managers, craft workers, foremen) should be captured to determine the importance of CLP factors for CLP improvement [
11]. To identify factors that affect CLP, previous studies integrated the perspective of different project participants through questionnaires with interview surveys and grouped the CLP factors under various categories to analyze them. For instance, Van Tam et al. [
12] identified and ranked 45 critical CLP factors out of 203 samples collected from project managers and contractors via a survey questionnaire. Their results’ analysis showed a significant difference between project manager’s and contractors’ opinions on the key factors affecting CLP. Almamlook et al. [
13] developed a questionnaire containing 30 factors affecting CLP in Libya. Their results indicated that a lack of labor supervision and the experience and skill of labor are the most significant factors affecting CLP in Libyan construction projects. Compared to CLP factors identification, very few studies have been conducted for identifying key CLP improvement strategies. According to the provided literature review, most techniques proposed for selecting key CLP improvement strategies lack the capability to quantify the strategies’ impact on CLP. However, to effectively improve CLP, the extent to which the implemented improvement strategies affect CLP needs to be known. Widely used techniques for quantifying the impact of various strategies on CLP include statistical methods such as
t-test and regression analysis [
7,
14]. The major limitation of statistical methods is their inability to capture the causal relationships among CLP factors, improvement strategies, and CLP. In addition, such methods lack the capability to consider project characteristics. However, key CLP improvement strategies differ from one project to another. Consequently, determining interrelationships among key CLP factors and strategies and determining the impact of each strategy on CLP is crucial for prioritizing appropriate CLP improvement strategies for a given project.
In order to address the mentioned research gaps, the objective of this study is to identify the most effective CLP improvement strategies and quantify their impact on CLP through a decision support model that considers the causal relationships among CLP factors as well as the project characteristics and experts’ perspective. The decision support model is developed by integrating two fuzzy multi-criteria decision making (fuzzy MCDM) methods, called fuzzy analytic hierarchy process (fuzzy AHP) and fuzzy techniques for order of preference by similarity to idea solution (fuzzy TOPSIS), with fuzzy cognitive maps (FCM). Improvement strategy selection is a decision-making problem in which various criteria, such as impact on CLP and workers’ adaptation, influence the effectiveness of selected strategies. MCDM techniques were specifically designed to mathematically solve this type of problem by providing formalized tools for dealing with multiple criteria [
15]. However, the problem of selecting improvement strategies is too complex to be understood quantitatively with numerical values since the criteria of strategy selection (i.e., implementation feasibility) are qualitative. This type of problem can be addressed by using knowledge that is imprecise and qualitative [
16]. Fuzzy MCDM incorporates MCDM methods with fuzzy set theory to resemble human reasoning by using approximate information and uncertainty to generate decisions. Hence, this study proposes the combination of two fuzzy MCDM methods—fuzzy AHP and fuzzy TOPSIS –to determine the top-ranked CLP improvement strategies. The combination of fuzzy AHP and fuzzy TOPSIS captures experts’ opinions and project characteristics and represents uncertainty and vagueness in the decision-making process of CLP improvement strategies selection without involving cumbersome mathematics [
16]. CLP is affected by both quantitative factors (e.g., temperature) and qualitative factors (e.g., team spirit of crew), and the combined effect these factors have on CLP is difficult to determine. Thus, developing a precise model for CLP might not be feasible [
17]. FCM as a knowledge representation and reasoning method originates from the combination of fuzzy logic, cognitive mapping, and neural networks to represent knowledge of systems such as a CLP environment, which are characterized by uncertainty, causality, and complex processes [
18,
19,
20,
21]. FCM depicts a CLP system in a form that corresponds closely to the way humans perceive it, through approximate reasoning and taking into account the imprecision and uncertainty of CLP factors [
22]. Ahn et al. [
19] showed the effectiveness of FCM as tool for modeling CLP since FCM considers causal relationships among CLP factors as well as the imprecision and uncertainty of CLP factors. Therefore, the proposed decision support model in this study develops an FCM model for capturing the causal relationships among CLP factors and quantifying the impact of improvement strategies.
A main contribution of this study is providing a novel decision support model that integrates the combination of fuzzy AHP and fuzzy TOPSIS, as two fuzzy MCDM methods, with FCM to prioritize CLP improvement strategies based on their impact on CLP, causal relationships among CLP factors, and project characteristics. In addition to representing uncertainty and vagueness, the combination of fuzzy AHP and fuzzy TOPSIS supports FCM modeling by reducing the number of improvement strategies required for FCM modeling with respect to project characteristics and experts’ opinions. Thereafter, FCM, by taking into account the imprecision and uncertainty of CLP factors, models the causal relationships among CLP factors in order to quantify the impact of the strategies on CLP improvement. Accordingly, the results of this study are more accurate than previous studies that used statistical methods such as t-test and regression analysis, which lack the capability to capture project characteristics and causal relationships among various factors. The decision support model is implemented on a case study of concrete-pouring activities in building projects to show how construction companies can utilize the proposed model in their projects to identify the improvement strategies that serve as the most effective management practices with respect to CLP. The results of this study will assist construction management teams in identifying the impacts of CLP improvement strategies on their projects. The contribution of this study is presenting this systematic decision support model for identifying key CLP improvement strategies and quantifying their impact on CLP, which will provide construction practitioners with a means of ranking CLP improvement strategies with respect to various criteria, including implementation feasibility and risk, adaptation of workers, and impact on CLP. These findings can assist construction managers in improving CLP for their projects in an optimum manner to reduce variances from the primary plan and keep projects on time and within budget. In addition, based on the capability of the decision support model to simulate the impact of various management practices on the CLP of specific projects prior to their implementation, construction companies can use the provided model to apply management practices that have only subtle impact on the CLP for given projects.
This article is organized as follows.
Section 2 provides a review of past research on approaches for identifying and measuring CLP improvement strategies.
Section 3 describes the framework for prioritizing CLP improvement strategies through three phases: (1) identifying factors and strategies, (2) ranking strategies and, (3) quantifying strategies’ impact on CLP (i.e., building the FCM model).
Section 4 presents and summarizes the experimental results of using the proposed decision support model to quantify CLP improvement strategies.
Section 5 presents conclusions and notes regarding future work.
2. Literature Review
While new technologies and innovations provide construction companies with opportunities to improve CLP, their influence is insignificant if improvement strategies recognized as necessary for controlling and improving CLP are not utilized first [
7]. Consequently, project managers implement a wide range of improvement strategies to increase CLP in construction projects [
6,
7,
23,
24]. The implemented strategies aim to boost CLP by changing the work system or its components [
25]. However, more than half of nonproductive work hours are caused by implementing ineffective improvement strategies since the actual impact on CLP is not evident [
26]. Thus, to achieve optimum productivity in projects, it is critical for construction management teams to identify the most effective CLP improvement strategies. Several studies have been conducted on identifying key CLP improvement strategies in the construction domain. However, they have not attempted to quantify the impact of the strategies on improving CLP. As a result, most previous studies have not provided empirical evidence to prove the effectiveness of their recommended improvement strategies. Gurmu and Aibinu [
27] used two questionnaires and developed a scoring tool to identify and prioritize construction equipment management practices that increase productivity. Kazerooni et al. [
3] developed a systemic framework for ranking CLP factors according to their importance for CLP improvement by integrating MCDM with fuzzy data clustering. They suggested various improvement strategies based on the identified key factors. Shoar and Banaiti [
28] applied fuzzy fault tree analysis method to identify critical events that cause low productivity and find appropriate response strategies with respect to the identified events. Agrawal and Halder [
29] conducted two survey questionnaires and used the RII method to gauge the perception of construction workers regarding CLP factors and practices leading to CLP improvement. Kedir et al. [
30] integrated MCDM with fuzzy agent-based modeling to analyze the implementation of different productivity improvement policies. Contrary to previous studies, Al-Rubaye and Mahjoob [
31] focused on the loss of labor productivity in Iraq by deploying cause-and-effect analysis. They identified factors that cause CLP loss and proposed various management practices to lower its impact. Kermanshachi et al. [
32] developed a system dynamics model to analyze the effects of change orders on CLP and, based upon sensitivity analysis, identified five policies to lessen these effects. Thomas et al. [
33] suggested various CLP improvement strategies for avoiding workspace congestion and increasing CLP by comparing the productivity rates measured in the field with baseline productivity rates based on historical data.
While previous studies investigated various CLP improvement strategies, only a few attempted to quantify the impact of given improvement strategies on CLP. For instance, Ghodrati et al. [
14] attempted to quantify the effectiveness of nine widely implemented management strategies such as incentive programs, training, resource scheduling, and communication to improve labor productivity. Each management strategy entails several management practices. To assess the implementation level of the management strategies, they developed a management strategy assessment index and interviewed experts from several New Zealand construction companies. They then employed multiple regression analyses and a
t-test to determine the relationships between the strategies and CLP. Shan et al. [
7] aimed to identify the effectiveness of seven pre-defined key management programs for improving CLP. Through a series of
t-tests, they examined the relationships between management programs and labor productivity. The results of their analyses showed that CLP is positively correlated to implementation of the management programs. Caldas et al. [
6] developed a statistical method and metric, called the best productivity practices implementation index for industrial projects (BPPII Industrial), for identifying key construction productivity practices and quantifying the relative importance of the identified practices. Their results indicated that projects with higher BPPII Industrial scores have a greater potential to achieve better construction productivity than was originally estimated.
The following are research gaps in the current literature of CLP improvement strategies: (1) The applied statistical methods do not consider the causal relationships among CLP improvement parameters (i.e., affecting factors and CLP). CLP factors are mostly interconnected and affect each other, so it is necessary to consider the causal relationships among the factors and strategies in order to achieve accurate values for the quantified impact of strategies on CLP. (2) Most previous studies did not consider project characteristics for selecting CLP improvement strategies. They selected the key improvement strategies based on previous research. However, CLP is a context-specific efficiency measure, because the identified factors and their degree of impact on CLP vary from project to project [
1,
4]. Hence, key CLP improvement strategies also differ from one project to another, and a systematic approach is needed to capture the project characteristics and construct the cause-and-effect relationships among CLP improvement parameters in order to identify the most effective CLP improvement strategies.
To address the mentioned research gaps, this study proposes a decision support model to assist selection and implementation of optimal CLP improvement strategies for a given project. The proposed model consists of: (1) the combination of fuzzy AHP and fuzzy TOPSIS methods in order to deal with uncertainty and vagueness in the decision-making process of selecting CLP improvement strategies and to capture experts’ opinions about the ranking of strategies regarding various criteria in order to consider project characteristics and (2) an FCM model to consider the causal relationships among CLP factors for quantifying the impact of improvement strategies on CLP and capturing the imprecision and uncertainty of CLP factors for CLP modeling. Accordingly, the proposed methodology is expected to achieve more accurate results than previous studies that utilized statistical methods to quantify the impact of CLP improvement strategies without considering the imprecision of CLP factors, causal relationships among CLP factors, and project characteristics.
3. Methodology
This study proposes a decision support model for identifying and prioritizing the most effective CLP improvement strategies by integrating fuzzy MCDM methods with FCM. Fuzzy MCDM methods, such as fuzzy AHP and fuzzy TOPSIS, are operations research tools for ranking various parameters with respect to multiple criteria in complex decision-making problems [
34]. In the problem of improvement strategy selection, fuzzy AHP is used to weight criteria, and fuzzy TOPSIS is used to rank the strategies based on the criteria. FCM is a causal cognition tool for modeling and simulating dynamic systems [
35]. In this study, FCM is utilized to quantify the impact of strategies on CLP by modeling a CLP environment.
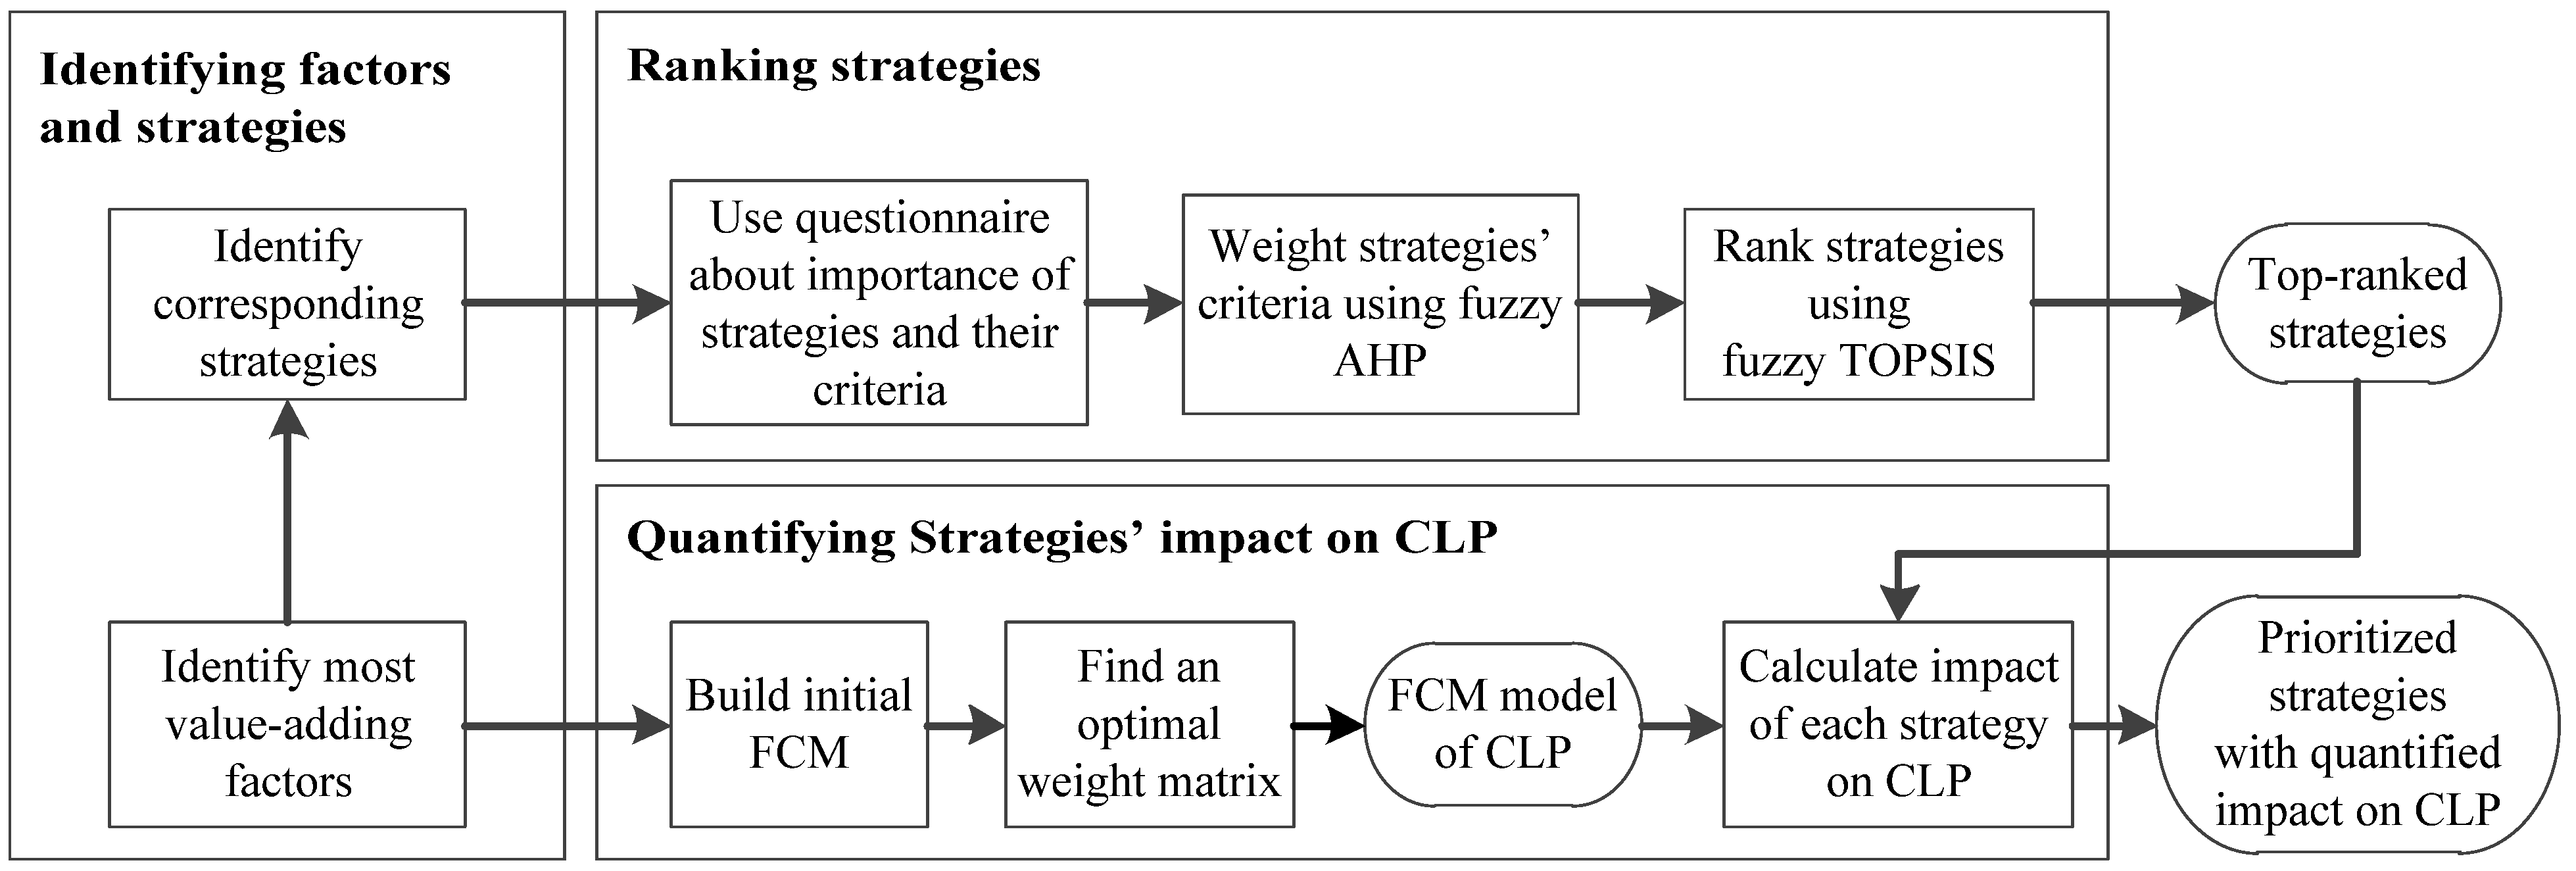
Figure 1 shows a general view of the framework for selecting CLP improvement strategies, which includes three phases: identifying factors and strategies, ranking strategies, and quantifying strategies’ impact on CLP.
In the first phase, the key CLP factors are determined based on the study carried out by Ebrahimi et al. [
36]. Then, various CLP improvement strategies that correspond to key factors (i.e., strategies that could be used to address each factor) are identified through a comprehensive background review of the literature. In the second phase, the two fuzzy MCDM methods of fuzzy AHP and fuzzy TOPSIS are integrated and used to rank the identified improvement strategies by capturing experts’ opinions of the importance of each strategy versus various criteria. In the third phase, an FCM model is developed based on the identified factors and top-ranked strategies for analyzing the effects of factors on each other and determining the impact of each strategy on CLP improvement. Finally, the most effective CLP improvement strategies are prioritized, or ranked, according to their quantified impact on CLP. Two validation approaches, structural validity and behavioral validity, are used in this study to validate the developed decision support model. The structural validity approach is utilized to evaluate the list of model components (factors influencing CLP and CLP improvement strategies) and the relationships among them. Behavioral validity of the FCM model is evaluated using the extreme conditions test, as utilized by Kumar and Yamaoka [
37], which compares the behavior of a developed model to the behavior of the real system under the same extreme conditions of input factors [
38]. According to Gerami Seresht and Fayek [
39], common validation tests such as the statistical hypothesis test are not suitable for FCM models, which simulate dynamic systems. Therefore, both utilized validation approaches compare the structure and behavior of the model with a real-world system empirically, using case studies and, theoretically, using the literature. An overview of the utilized case study is presented below.
3.1. Case Study and CLP Dataset Overview
The CLP dataset used in this research was provided from a previous study conducted by Tsehayae and Fayek [
4,
11]. They defined CLP as the ratio of units of output, expressed as installed quantity (in cubic meters), to units of input, expressed as total labor work hours, and the data were collected for concrete-pouring activities in building projects in Alberta, Canada. They studied concrete pouring in three data collection cycles between June 2012 and October 2014 in collaboration with two partnering companies. Each cycle extended over a month-long period and encompassed different weather seasons. The data were collected by documenting the value of CLP factors and CLP on a daily basis at construction sites. A total of 118 factors influencing CLP were identified and measured for a total of 92 days. Thus, the proposed decision support model in this study is developed for identifying, ranking, and implementing improvement strategies for the CLP of concrete-pouring activities in building projects. The following sections present the details of each phase of CLP improvement strategy selection by implementing them in the case study model.
3.2. Identifying Factors and Strategies
Past studies have shown that key CLP factors vary from one construction project to another [
40]. In this regard, the first step in developing a CLP model is to determine the relevant surrounding factors that affect CLP within the studied context. Accordingly, for the purpose of this research, the most value-adding CLP factors identified in Ebrahimi et al. [
36] were considered since they utilized the same empirical data that was introduced earlier. Ebrahimi et al. [
36] utilized hybrid feature selection to identify and rank a total of 19 factors as the most value-adding CLP factors.
After the most value-adding CLP factors were determined, an extensive literature review of past studies was conducted to identify various CLP improvement strategies that correspond to the identified key factors. As a result, 54 strategies with the potential to improve CLP were identified for 19 factors. The most appropriate strategy among the identified potential strategies was then determined for addressing each CLP factor using three experts involved in the project under study. As a result, 16 different strategies were identified.
Table 1 shows the factors and their corresponding improvement strategies. The linguistic descriptors of the factors are given under the factors in order to give a clear understanding of the factors’ definitions. The linguistic descriptors of F6 are categorical, and it is not possible to replace a category (e.g., columns) with another category (e.g., slabs) in the project, so no improvement strategy corresponds to this factor.
3.3. Ranking Strategies
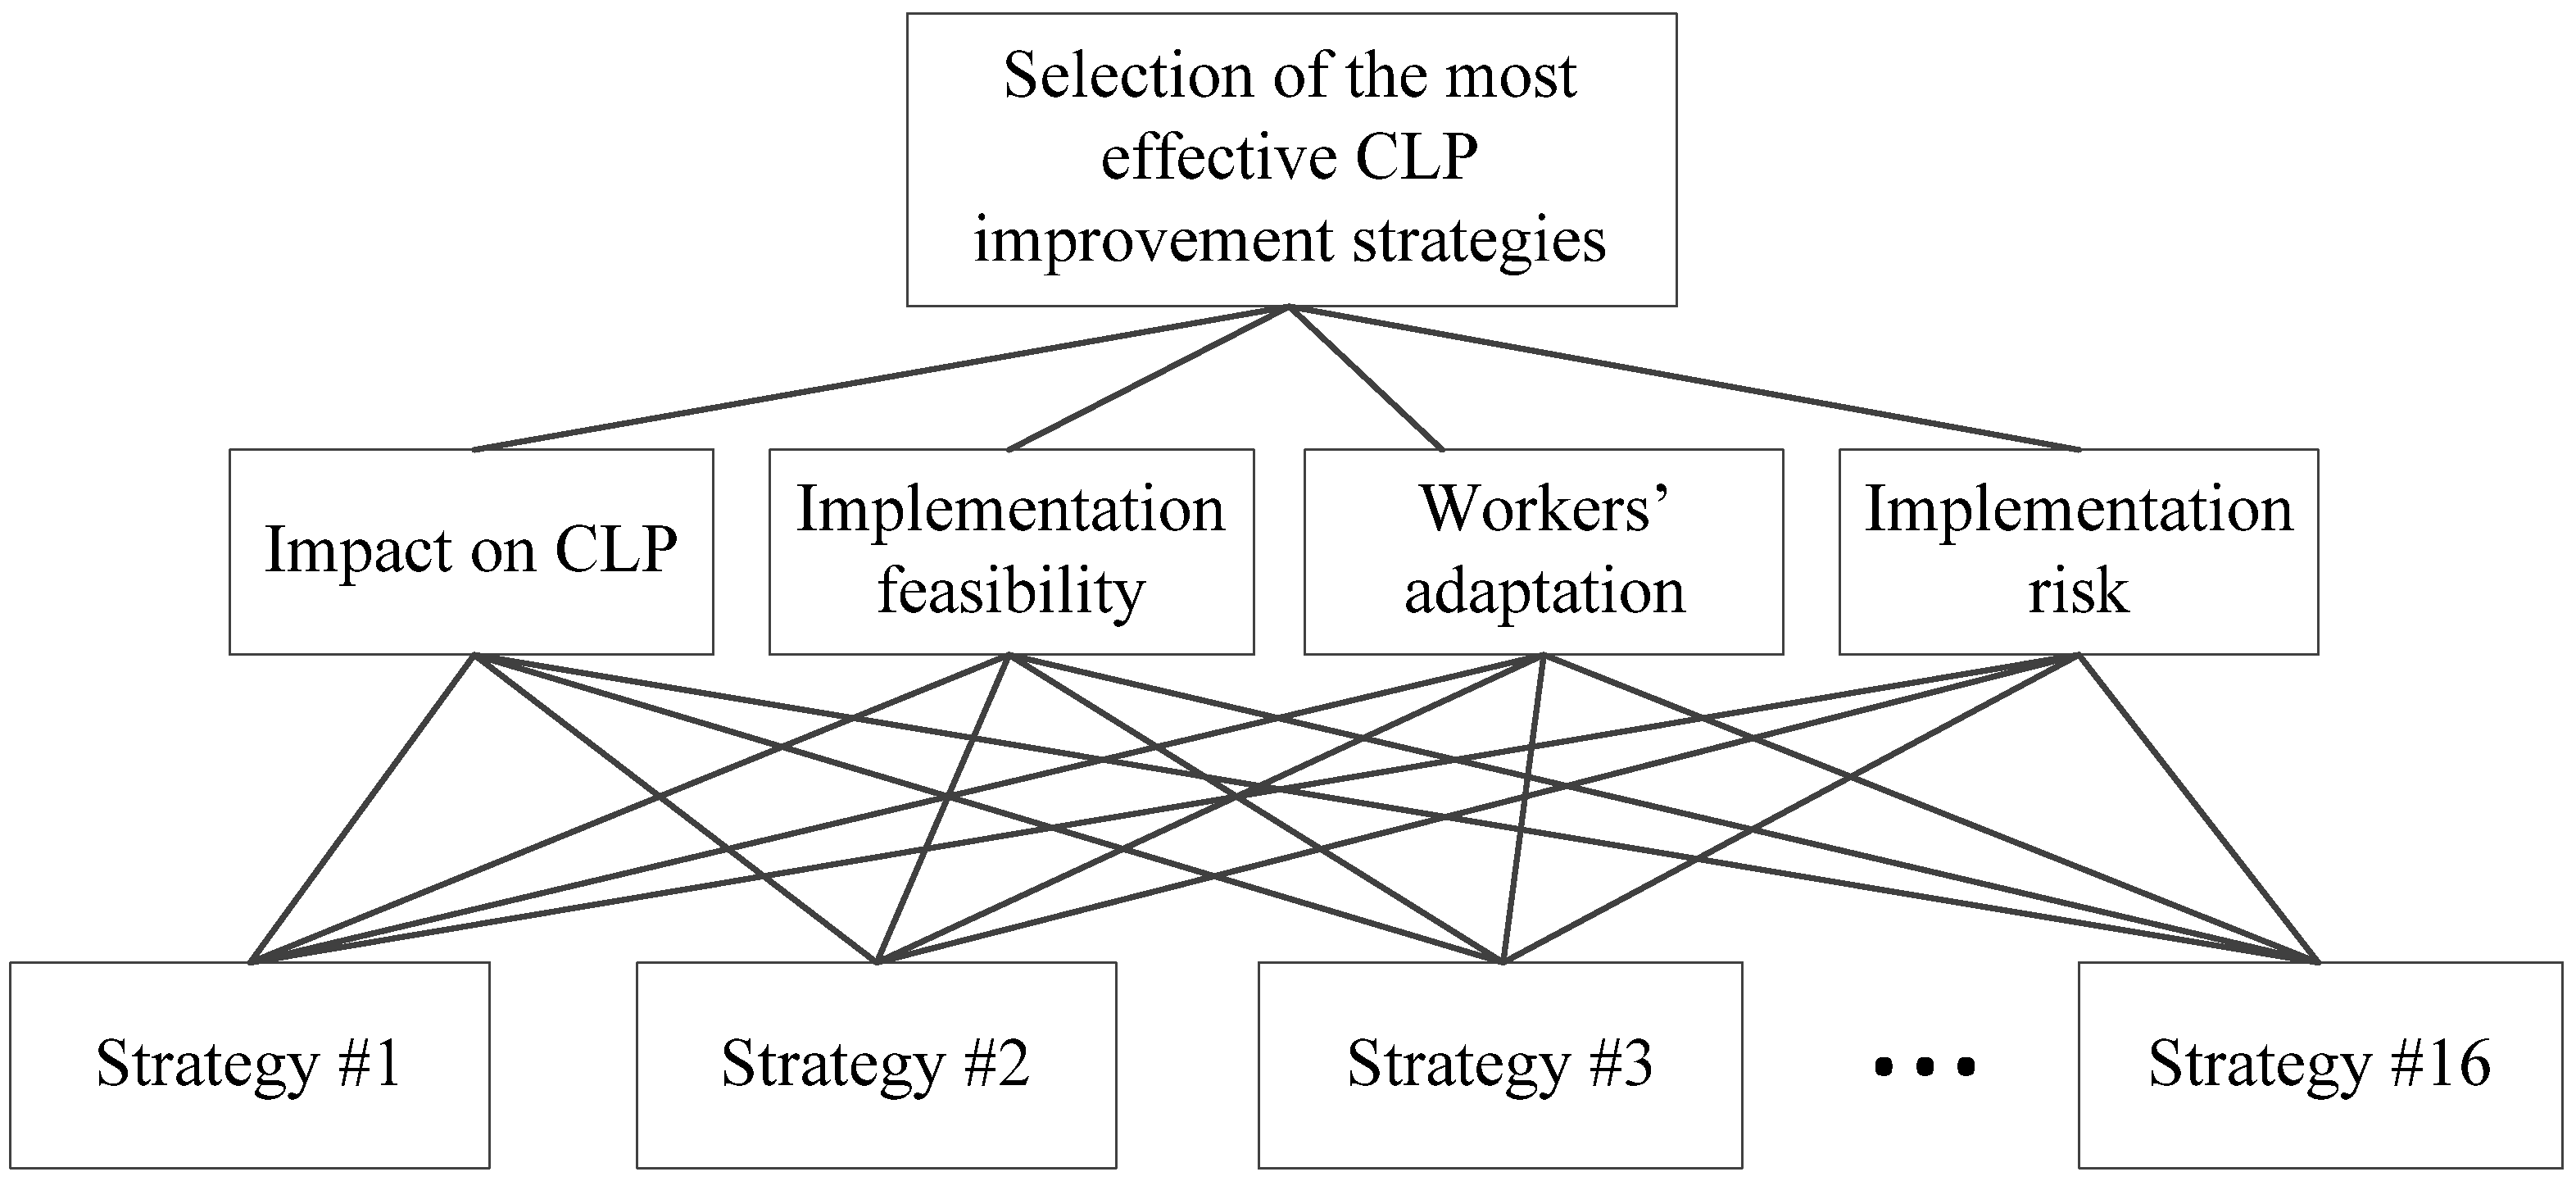
In this phase, the identified 16 strategies are ranked with respect to four strategy selection criteria (SSCs), which were identified by reviewing the current literature around strategy selection [
34,
41,
42,
43,
44] and are described as follows:
Impact on CLP (IC) is the impact of a strategy on CLP improvement in a project under study.
Implementation feasibility (IF) is the degree to which a strategy can be implemented in a project with respect to economic, technical, and scheduling constraints, including required time and cost of implementation.
Workers’ adaption (WA) is the ease with which workers can adapt to a strategy.
Implementation risk (IR) is the potential for a strategy to encounter development or deployment failure. (The term describes risks related to strategy launch.)
As stated in the introduction section, two widely used fuzzy MCDM methods—fuzzy AHP and fuzzy TOPSIS—are integrated to rank the CLP improvement strategies meeting the above criteria. The main advantages of these methods are that they mathematically represent uncertainty and vagueness in the decision-making process without involving cumbersome mathematics [
16]. According to Taylan et al. [
34], the combination of fuzzy AHP and fuzzy TOPSIS shows better performance compared to using each method separately. Accordingly, fuzzy AHP is used to determine the relative weights of SSCs based on fuzzy pairwise comparison, and fuzzy TOPSIS is applied to determine the relative importance of each strategy and rank the strategies.
Figure 2 presents the hierarchical structure of the decision-making process for CLP improvement strategy selection. Inputs of the proposed decision-making methods are provided by two questionnaire surveys, described in the next section. The following sections demonstrate the development of fuzzy AHP and fuzzy TOPSIS to identify the top-ranked CLP improvement strategies.
3.3.1. Questionnaire Surveys
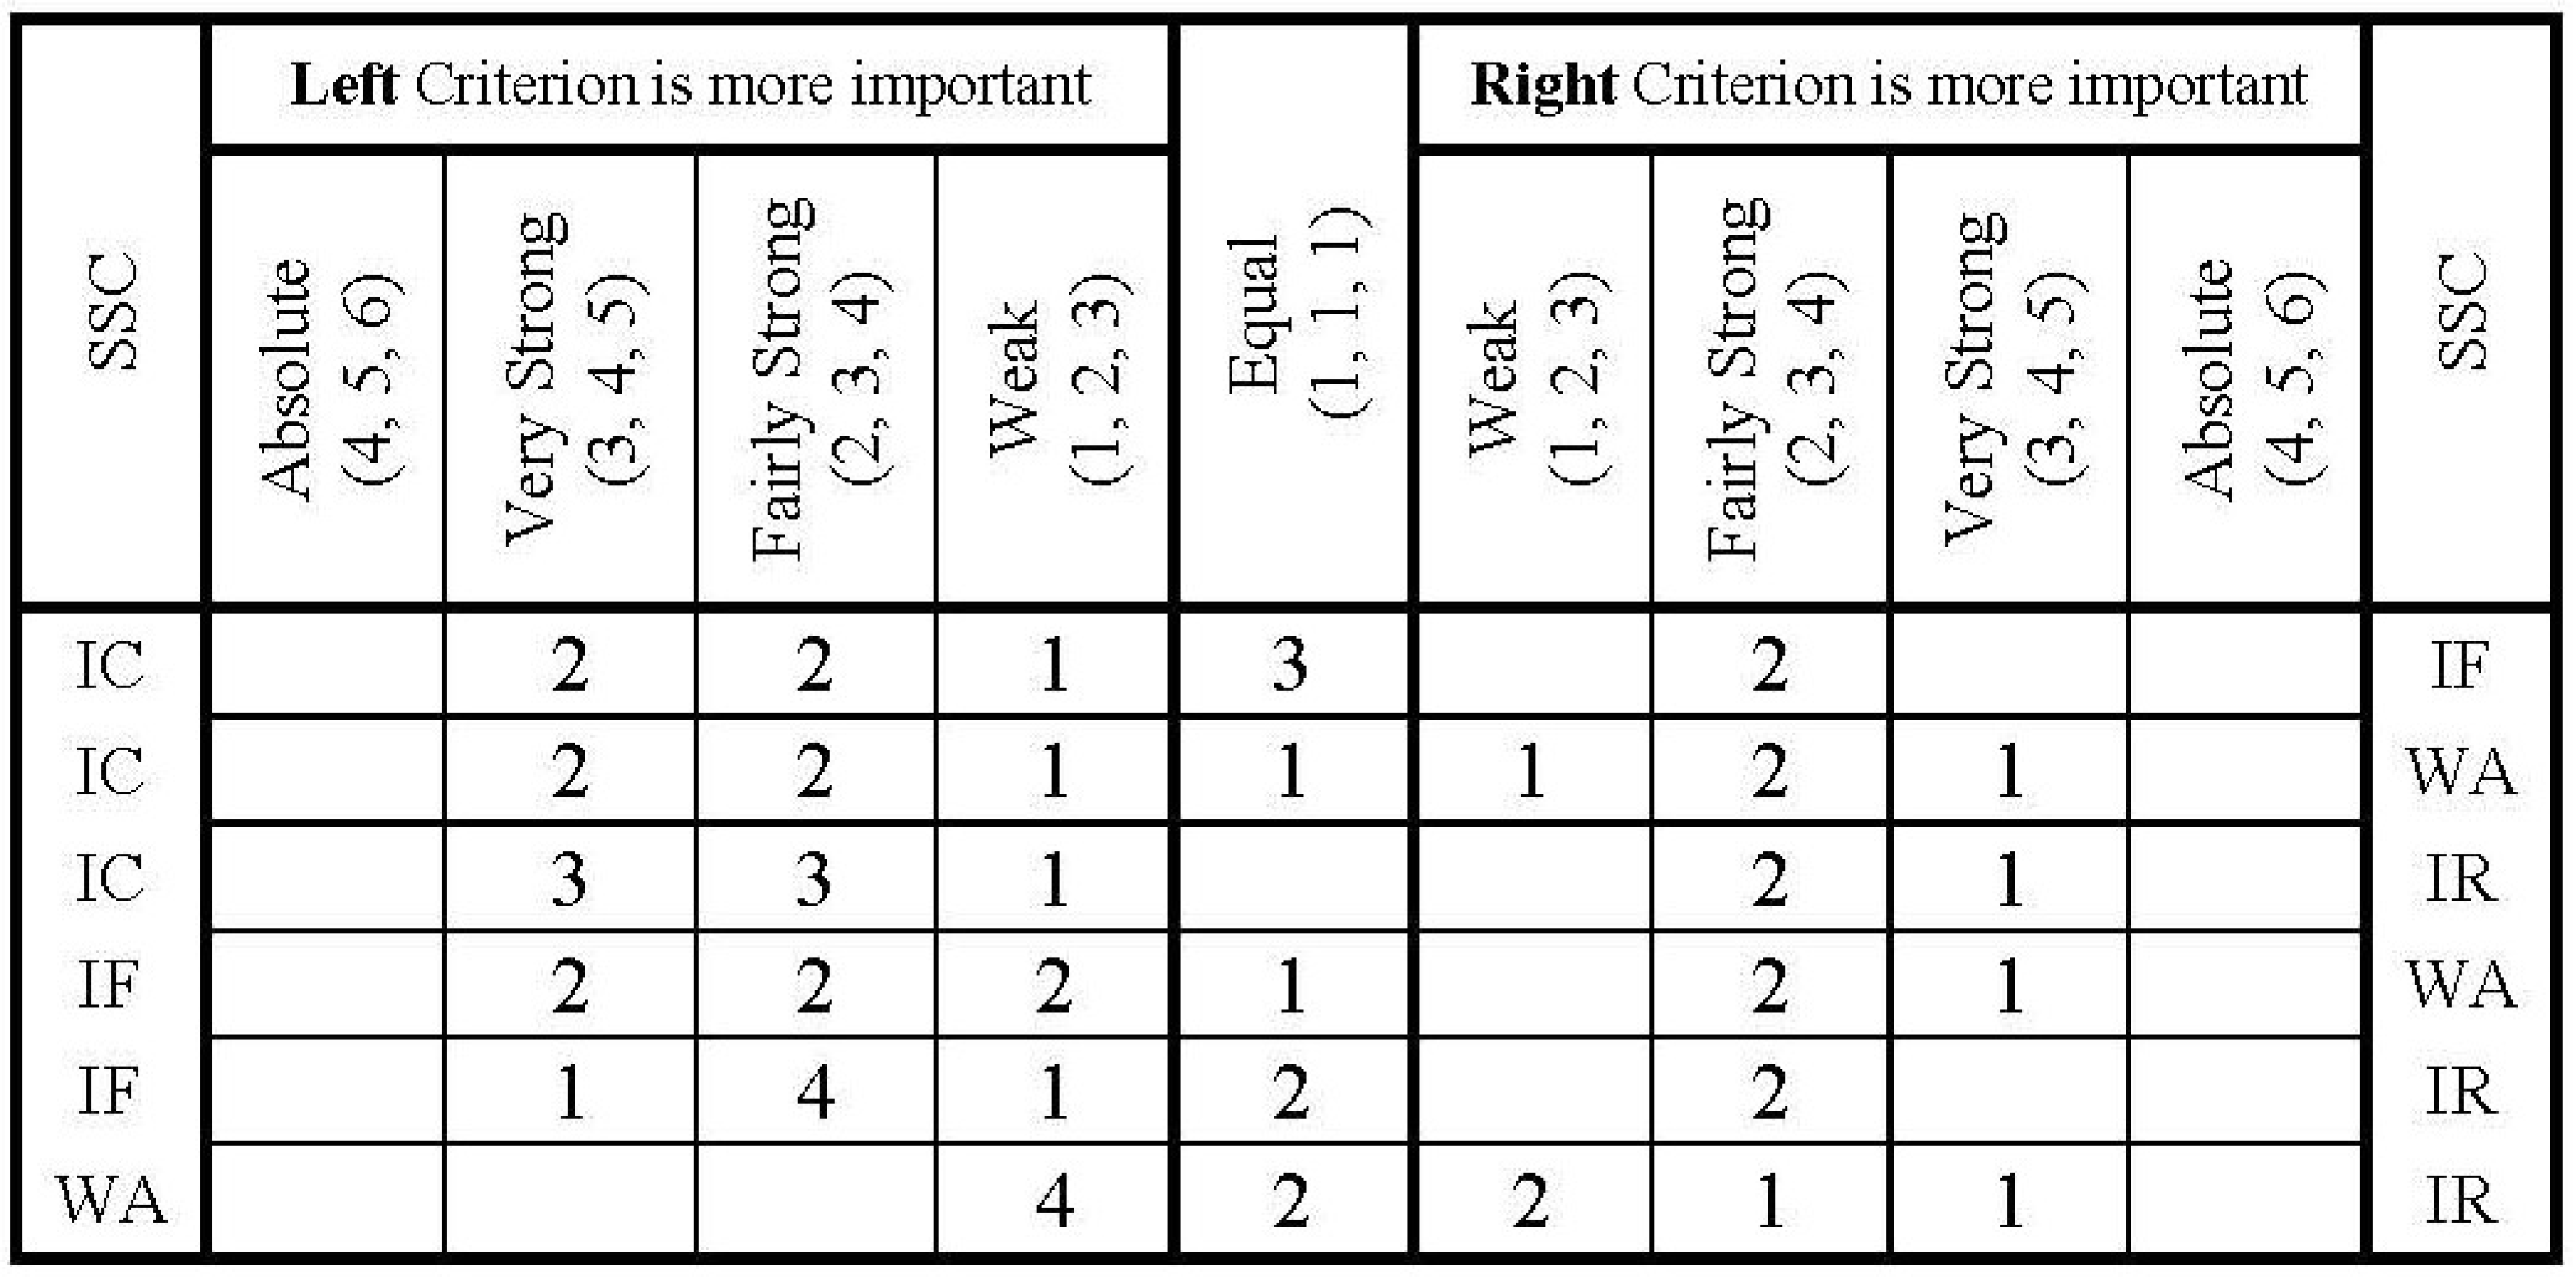
A major task in constructing the proposed model is determining the relative importance of each SSC to the final goal of selecting the most effective CLP improvement strategies. How the weights are determined can affect the outcome of the decision-making process. A well-designed weighting mechanism serves two purposes: (1) it identifies the solution that best meets the decision makers’ needs, and (2) it quantifies the differences between the solutions. Accordingly, two questionnaire surveys were designed, and 10 experts with an average of 7 years of experience in construction responded. In the first questionnaire, shown in
Figure 3, experts were asked to weight SSCs by selecting a preference term from “Equal” to “Absolute” when comparing the relative importance of one criterion to another. Similar to Efe [
43], Mathiyazhagan et al. [
44], and Kabak et al. [
45], a symmetric triangular fuzzy number (TFN) is used to represent each preference term in order to compute the SSC weights in the next phase. The numbers under the importance levels to the left of “Equal” show that the left SCC is more important than the matching SSC on the right in the same row. The numbers to the right of “Equal” show the opposite statement. For example, 4 experts indicated that the relative importance of IF to the problem of selecting CLP improvement strategies is “Fairly Strong” compared to the relative importance of IR. However, 2 experts responded that the importance of IR is “Fairly Strong” compared to the importance of IF.
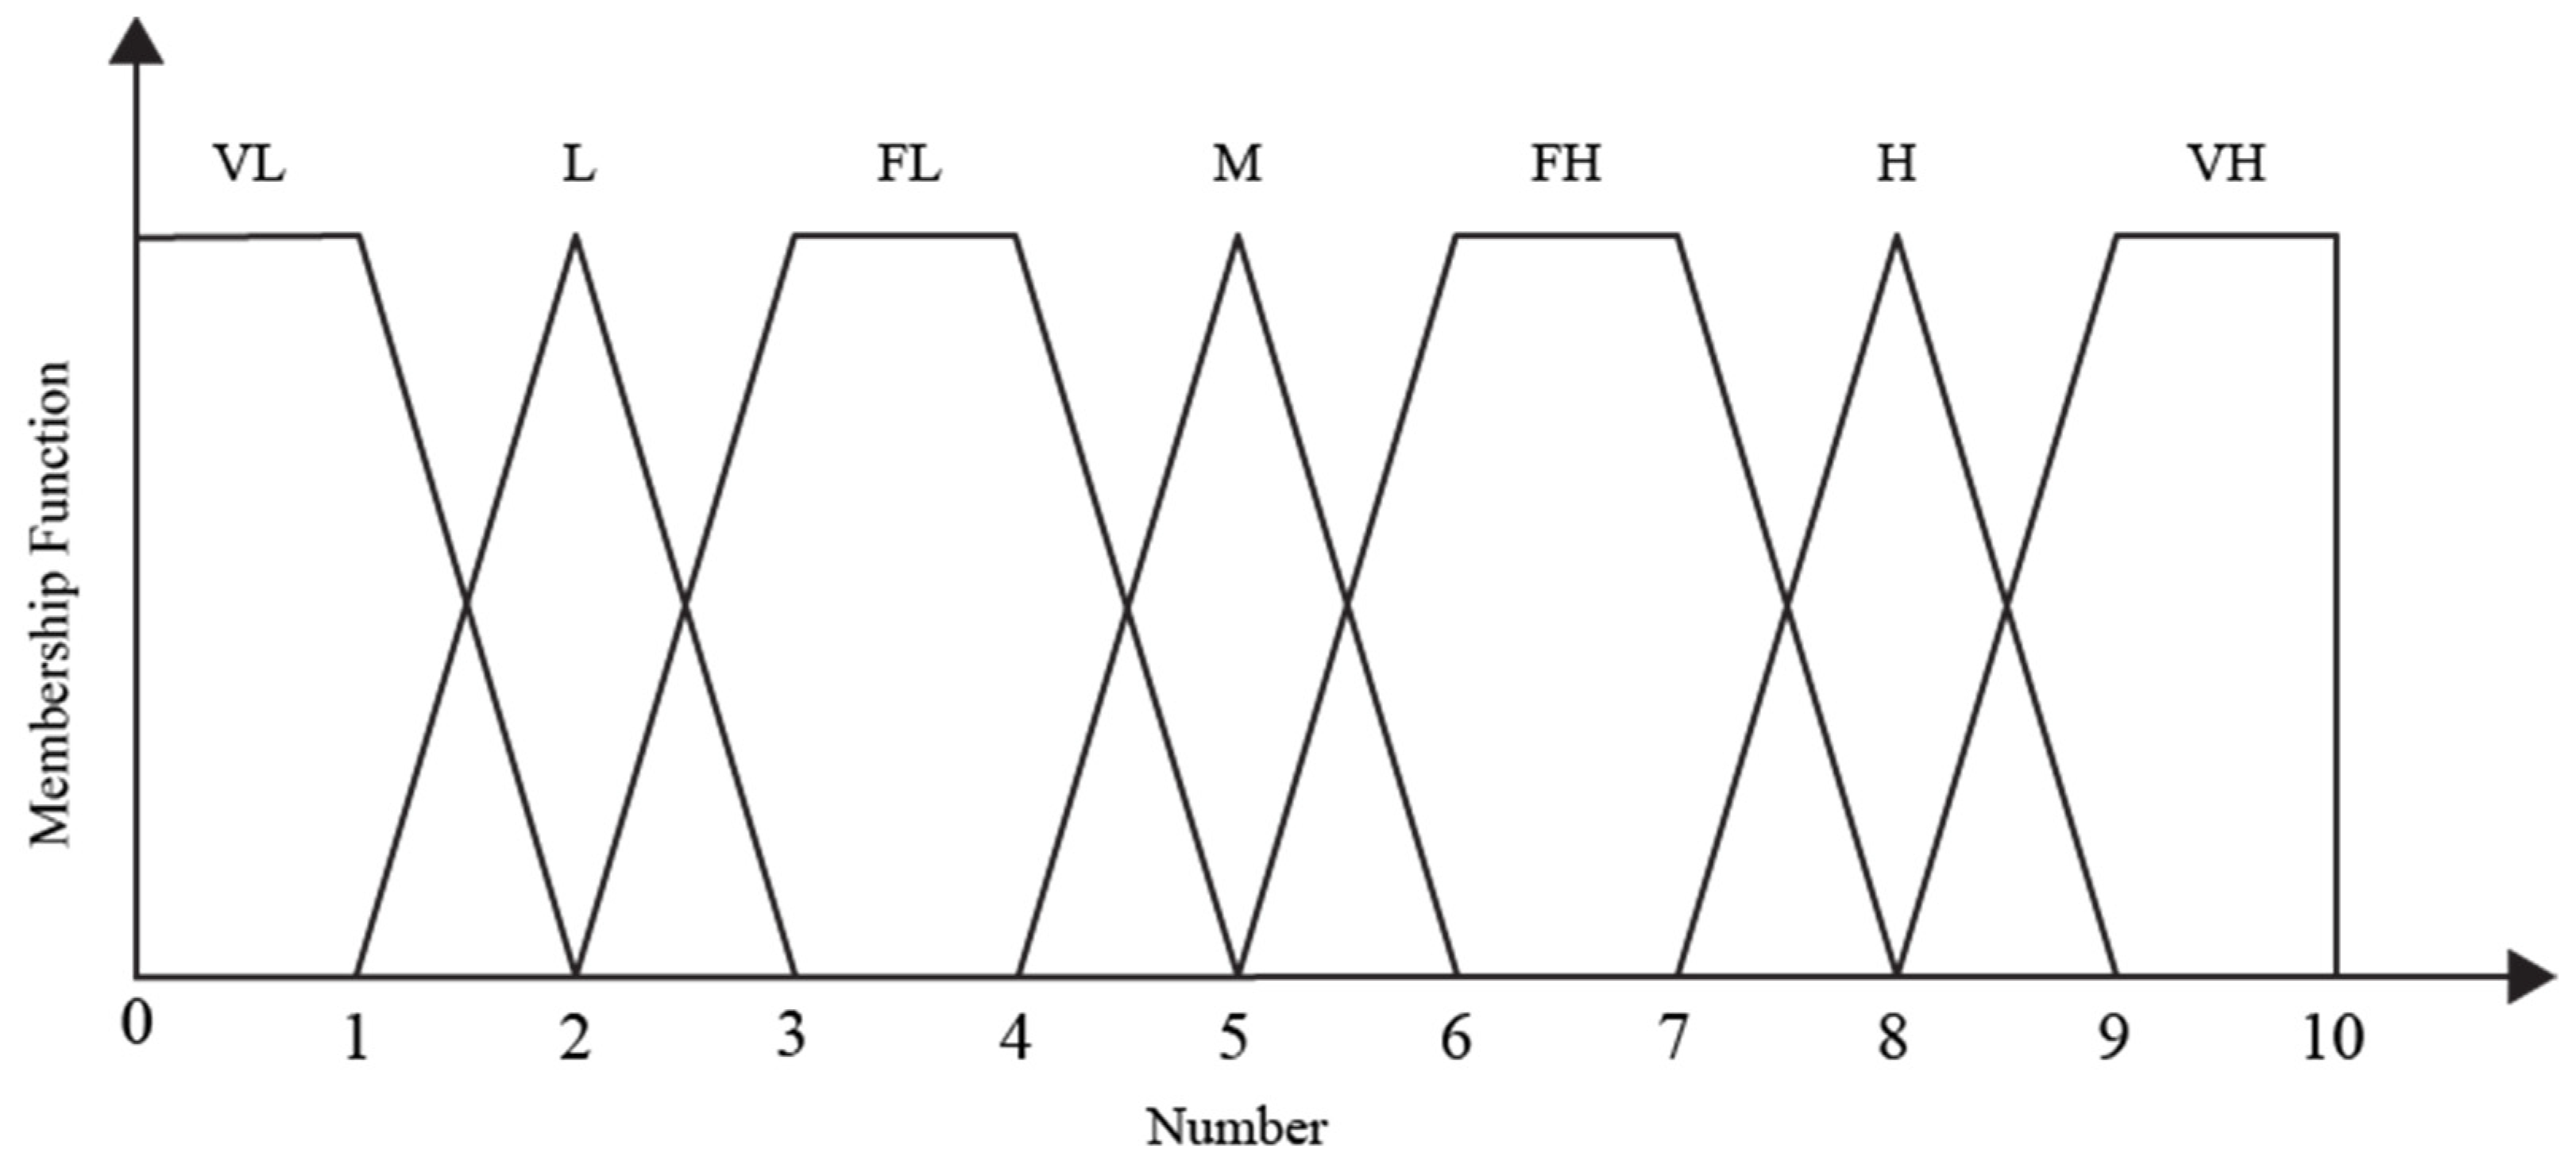
In the second questionnaire survey, the same 10 experts indicated their opinions on the importance of the selected strategies to CLP improvement with respect to SSCs. They indicated their responses using the seven-value linguistic scale presented in
Table 2.
Figure 4 shows the membership functions of linguistic terms, which are based on Özdağoğlu and Güler [
46].
3.3.2. Fuzzy AHP
AHP is a broadly applied method for determining the weights of criteria in a structured manner based on pairwise comparison [
47]. To handle subjective judgements in comparison, fuzzy sets are combined with AHP. Thus, fuzzy AHP assigns membership degrees to exact numbers in order to describe the extent to which these numbers belong to a linguistic expression. The relative weight of an SSC is assessed by processing the triangular fuzzy preference numbers elicited from the questionnaire survey in
Figure 3 through the fuzzy AHP method, in a manner similar to that presented by Perçin and Aldalou [
48]. The triangular fuzzy preference of the
th SSC over the
th SSC is shown as (
), where the parameters
,
and
denote the smallest possible value, the most promising value, and the largest possible value that describe the relative importance of the
th SSC over the
th SSC, respectively. The steps of the proposed fuzzy AHP can be described as follows.
Step 1: Calculate the fuzzy sum. The fuzzy sum value with respect to the
th SSC, which is a TFN, is defined as
Step 2: Calculate the fuzzy synthetic extent (
S). The
S value with respect to the
th SSC, which is a TFN, is defined as
where
,
,
, and
are the fuzzy synthetic extent of IC, IF, WA, and IR, which equal (0.1891, 0.3092, 0.4936), (0.1697, 0.2743, 0.4317), (0.1314, 0.2120, 0.3489), and (0.1291, 0.2046, 0.3408), respectively.
Step 3: Calculate the degree of possibility (
V). The
V value with respect to the
th SSC is defined as
where
is calculated as follows
Step 4: Calculate the relative weight of SSCs (
W). The
W value with respect to the
ith SSC is determined by normalizing
as follows
where
,
,
, and
are the relative weights of IC, IF, WA, and IR, which equal 0.324, 0.283, 0.201, and 0.192, respectively
Step 5: Assess the consistency ratio (CR). The consistency of the respondents’ pairwise comparisons in the questionnaire survey (see
Figure 3) is assessed to determine whether any re-examination of the survey pairwise judgments is required. This is performed by computing the CR of the matrix
, which includes the fuzzy preference numbers of the relative importance of each SSC versus another. Based on the approach used by Kazerooni et al. [
3], matrix
is defuzzified into two crisp matrices. The first matrix,
, includes the most promising value of the fuzzy numbers of matrix
, and the second matrix,
, includes the geometric mean of the lower and upper bounds of the fuzzy numbers. Then, the CR for matrices
and
is evaluated:
and
. Since both CRs are less than 0.1, no re-examination of the survey pairwise responses, shown in
Figure 3, is required.
3.3.3. Fuzzy TOPSIS
Fuzzy TOPSIS, as another fuzzy MCDM technique, is used for determining the relative importance of each strategy to CLP improvement. TOPSIS is one of the most widely used MCDM methods that works satisfactorily in various application areas [
49]. However, it is often difficult for decision makers to assign accurate values to alternatives for the criteria under consideration [
48]. Fuzzy TOPSIS allows decision makers to assign linguistic performance ratings to the alternatives instead of precise numbers. This method ranks CLP strategies according to their distance to the fuzzy positive-ideal solution,
, and the fuzzy negative-ideal solution,
. According to Singh et al. [
50],
can be obtained by maximizing the benefit criteria IC, IF, and WA.
can be reached by minimizing the cost criterion, which is IR. Considering a set of
decision makers as
and a set of
CLP improvement strategies as
, the steps of fuzzy TOPSIS for determining the importance of the CLP improvement strategies are given below.
Step 1: Construct the fuzzy decision matrix. The linguistic value given by the
th decision maker to each improvement strategy regarding each SSC is transformed into a trapezoidal fuzzy number as
, using the membership functions in
Table 2. The responses of the decision makers are then aggregated as
using the following detailed computations
The fuzzy decision matrix is built with rows and columns. Each cell of the matrix is shown by , which is the fuzzy number of the th strategy with respect to the th criterion.
Step 2: Compute the normalized fuzzy decision matrix. For the benefit criteria IC, IF, and WA, normalized
is computed as
where
is calculated as
For the cost criterion IR, normalized
is calculated as
where
is calculated as
Step 3: Weight the normalized fuzzy decision matrix. The weighted
is determined by following formula
where
is the weighted fuzzy number of the
th strategy with respect to the
th criterion and is depicted as
.
Step 4: Calculate the distance of each improvement strategy from
and
. First,
and
are determined by the following formulas
where
and
are trapezoidal fuzzy numbers, defined as
Then, the distance of the
th improvement strategy from
and
is calculated by
where
is the vertex distance measurement between two trapezoidal fuzzy numbers, such as
and
, that is computed by following formula
Step 5: Compute the closeness coefficient. The closeness coefficient of each CLP improvement strategy is computed by
The higher the
of the strategy, the closer to
and farther from
.
Table 3 shows the closeness coefficient of the CLP improvement strategies along with their rank compared to each other.
Based on the data in
Table 3, the average closeness coefficient equals 0.7090. Therefore, the first seven top-ranked strategies are S11, S2, S13, S7, S6, S9, and S16, which have closeness coefficients greater than the average and were selected as the most effective CLP improvement strategies for the project under study.
3.4. Quantifying Strategies’ Impact on CLP
An FCM model of CLP is developed for simulating the relationships among the most value-adding CLP factors and quantifying the impact on CLP of the selected top-ranked improvement strategies. FCM is a soft computing technique for modeling and simulating dynamic systems such as a CLP environment by mimicking the process of developing a cognitive map in a human mind [
19]. Generally, the manual process for developing an FCM is using expert knowledge to evaluate the strength of causal relationships in terms of weights using linguistic variables such as “Low”, “Medium”, and “High”. During the simulation, the value of CLP factor
at time
is calculated using Equation (19), as proposed by Papageorgiou [
51]
where
is the strength of the causal relation between two CLP factors
and
, and denoted via a causal edge from
to
;
ranges from −1 (absolute negative causality) to 0 (no causality) and 1 (absolute positive causality).
In Equation (20),
f(.) is an activation function that is formulated as sigmoid threshold function in this study
where
and
are real positive numbers that control slope and offset of the function, respectively. Higher values of
make the function more sensitive to the fluctuations of
[
20].
When no expert is available or the model contains a large number of relationships, an FCM cannot be developed through the manual process of using expert knowledge [
52]. For such cases, learning processes can be applied to automatically determine near-optimal weights for the relationships. FCM learning algorithms can be grouped into three types based on their underlying learning paradigm: (1) Hebbian-based, (2) error-driven, or (3) hybrid. Hebbian-based learning algorithms, such as nonlinear Hebbian learning (NHL), are unsupervised methods and do not require historical data. Their main drawback is their dependency on expert knowledge, since they require initial weight of causal relationships [
53]. Error-driven learning algorithms, such as the real-coded genetic algorithm (RCGA), generates weight matrices by attempting to fit the FCM model to a set of historical data. Several studies illustrated that these algorithms increase FCM robustness, functionality, and generalization abilities [
54]. Hybrid learning algorithms employ a combination of the other two types to take advantage of the fast speed and effectiveness of Hebbian-based methods and the global search and generalization ability of error-driven methods [
55].
In the proposed method, an initial FCM model is developed based on the importance of the most value-adding CLP factors, then the strength of a causal relation between two factors and is quantified by a numerical weight Three types of causal relationships among the factors exist: (1) positive causality (, which means an increase or decrease in causes the same result in ; (2) negative causality (; (3) no causality (= 0). After the strengths of all relationships are assessed, each improvement strategy is considered in the model, one at a time, in order to determine the quantitative effect of each strategy on construction productivity.
FCM Expert, developed by Nápoles et al. [
18], is used as a software platform for modeling the proposed FCM model of CLP.
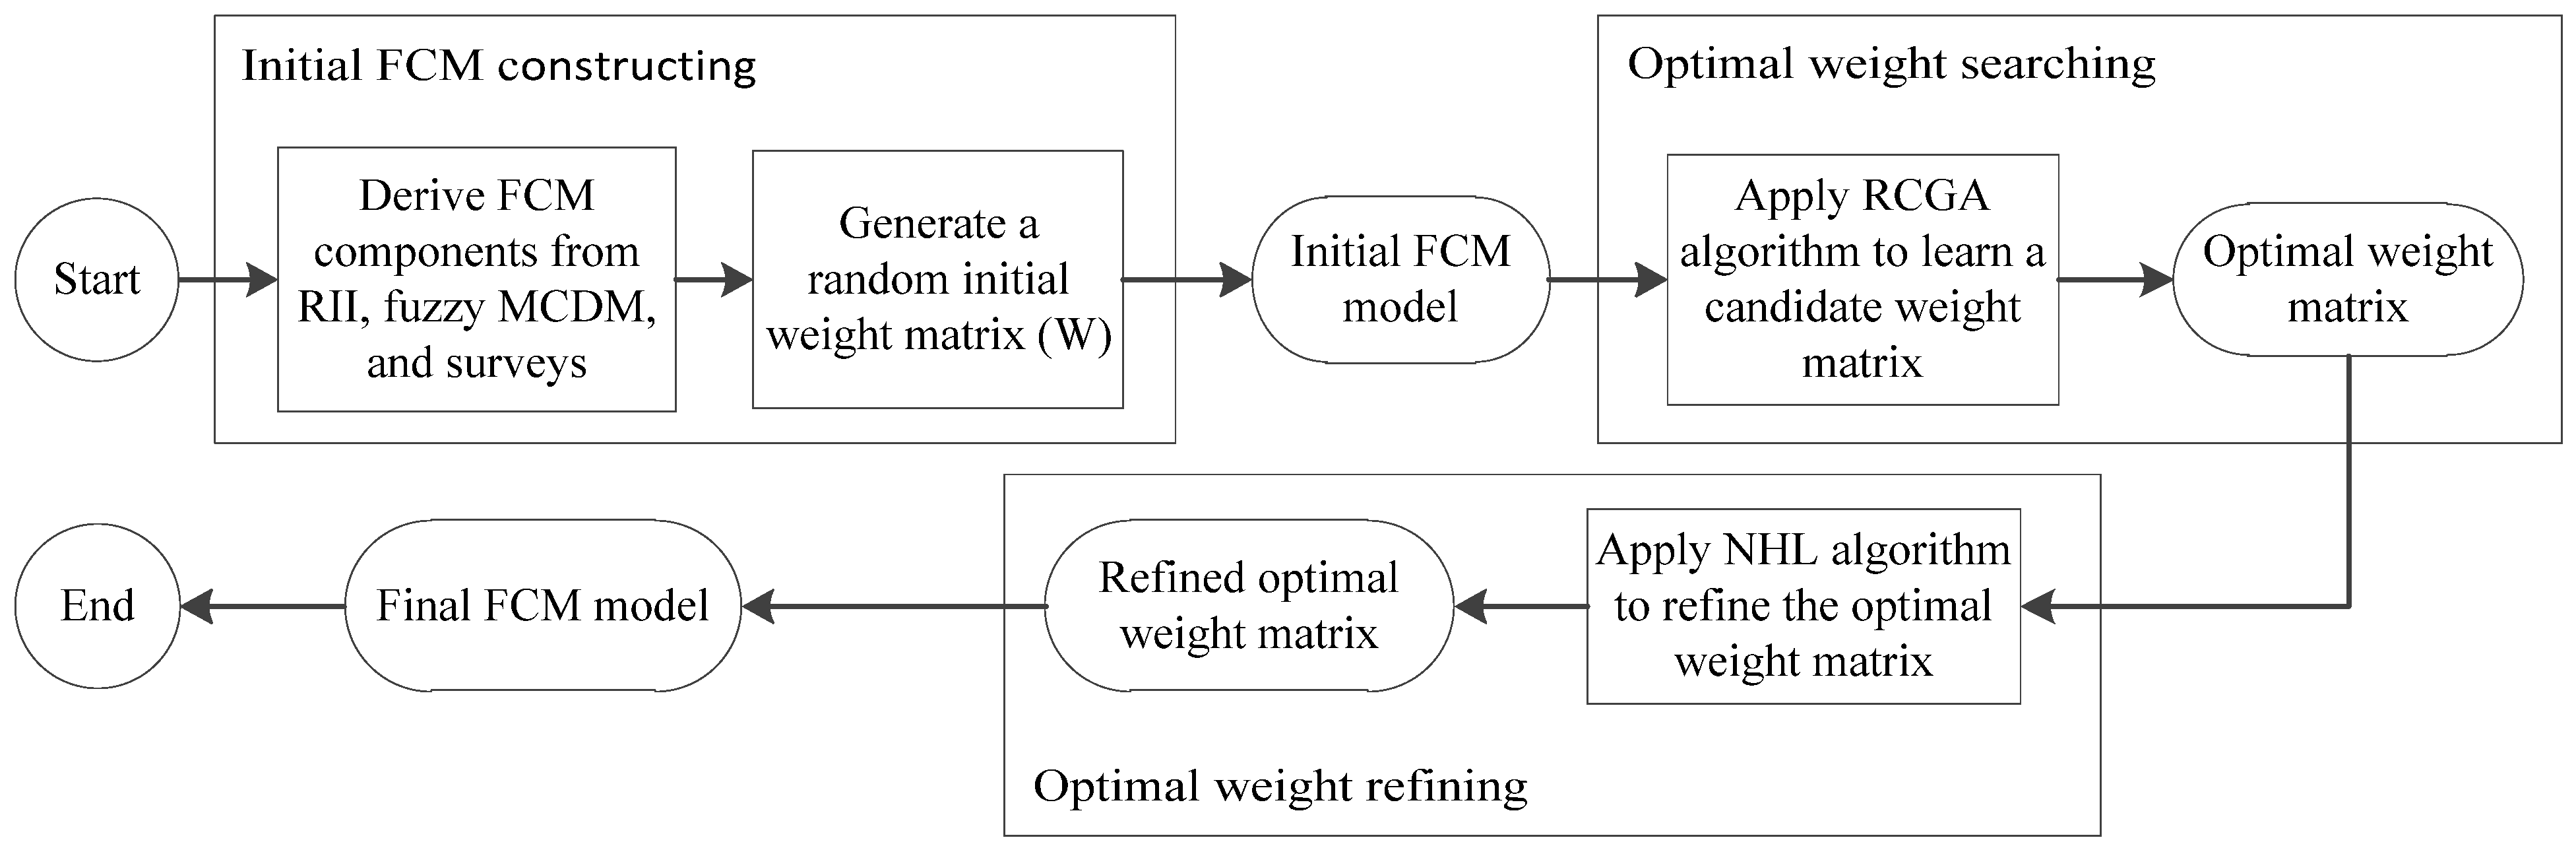
Figure 5 shows the flow chart of the proposed framework for constructing the FCM model, which consists of three major tasks, described below.
Initial FCM construction included causal relationships among the initial FCM parameters (i.e., the most value-adding factors and CLP) and initial states of the parameters according to the dataset, surveys results, and past studies.
Optimal weight searching entails applying the RCGA algorithm to find an optimal weight matrix based on its global search and generalization ability. The weight matrix comprises the causal relationships among the factors. The data used in the RCGA is based on the dataset of Tsehayae and Fayek [
4,
11] discussed in the methodology section above. For use in the FCM model, the dataset including the value of factors and CLP is normalized between 0 and 1.
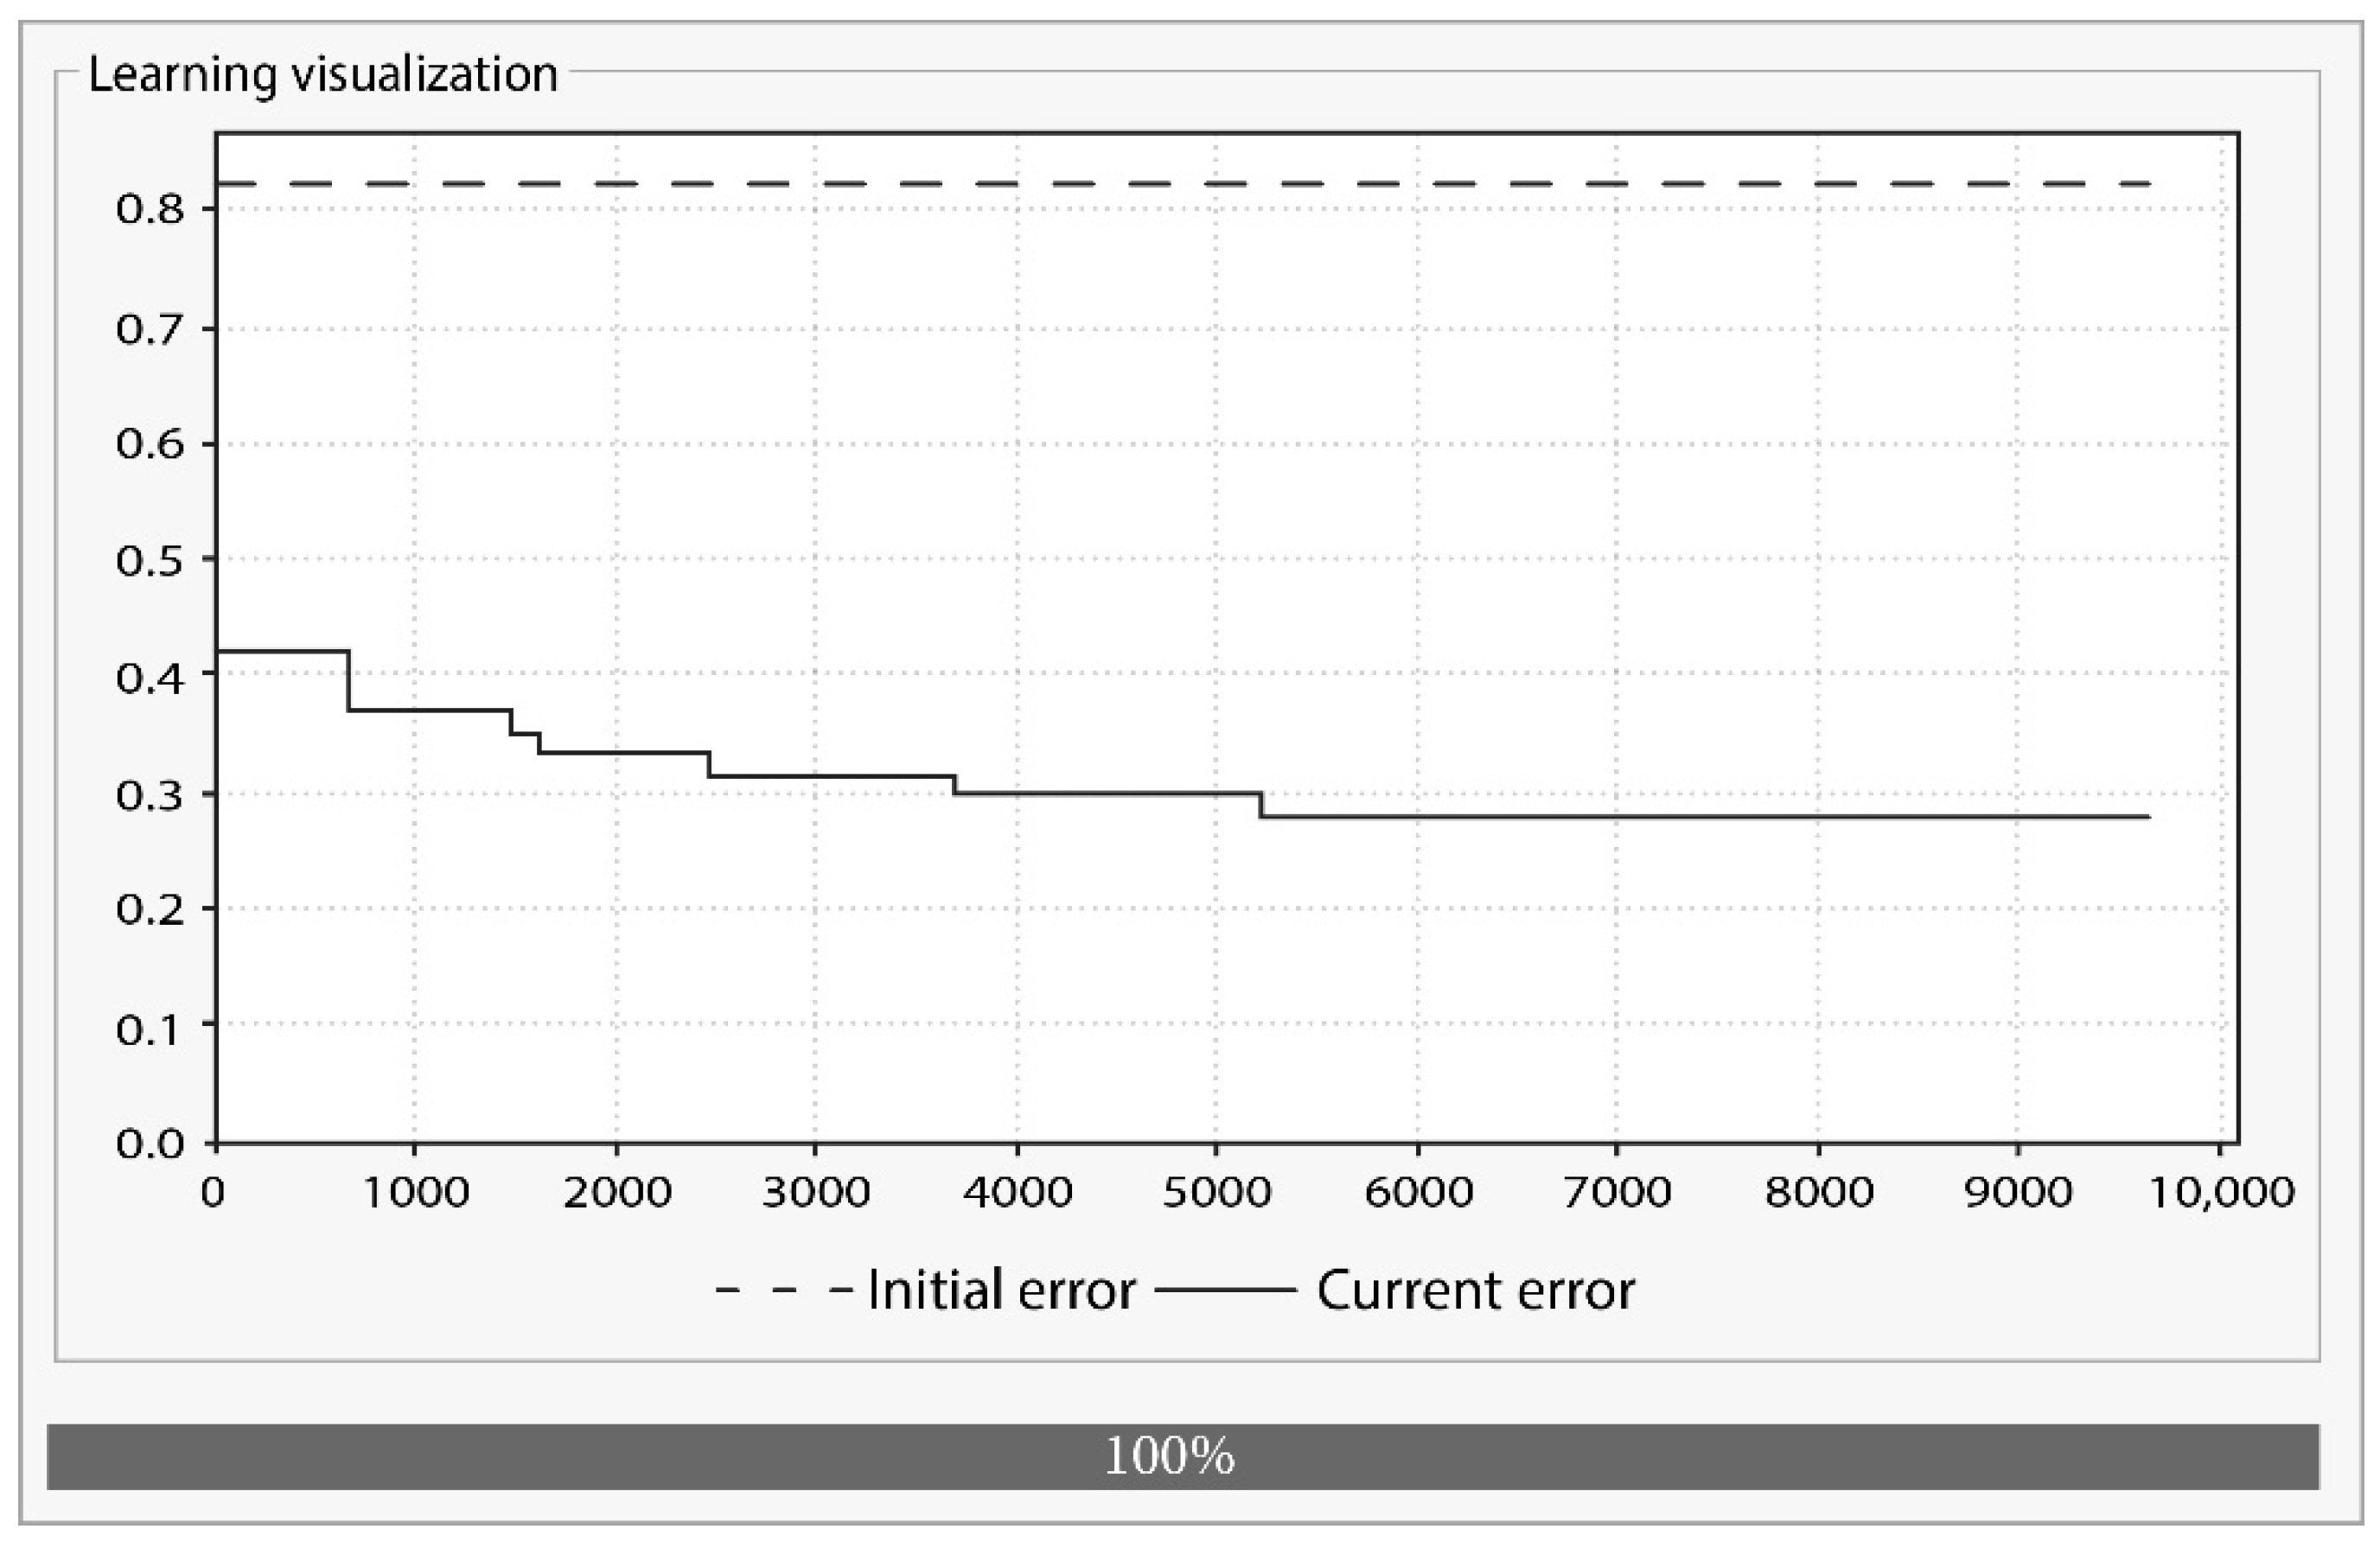
Figure 6 shows the real-time visualization of the error curve for searching the optimal weight matrix by performing 50 iterations.
Optimal weight refining applies the NHL algorithm in order to fine-tune the optimal weight matrix and get closer to the optimized structure. The output of the RCGA is used as the input of the NHL algorithm, thus, no expert knowledge is required for conducting NHL.
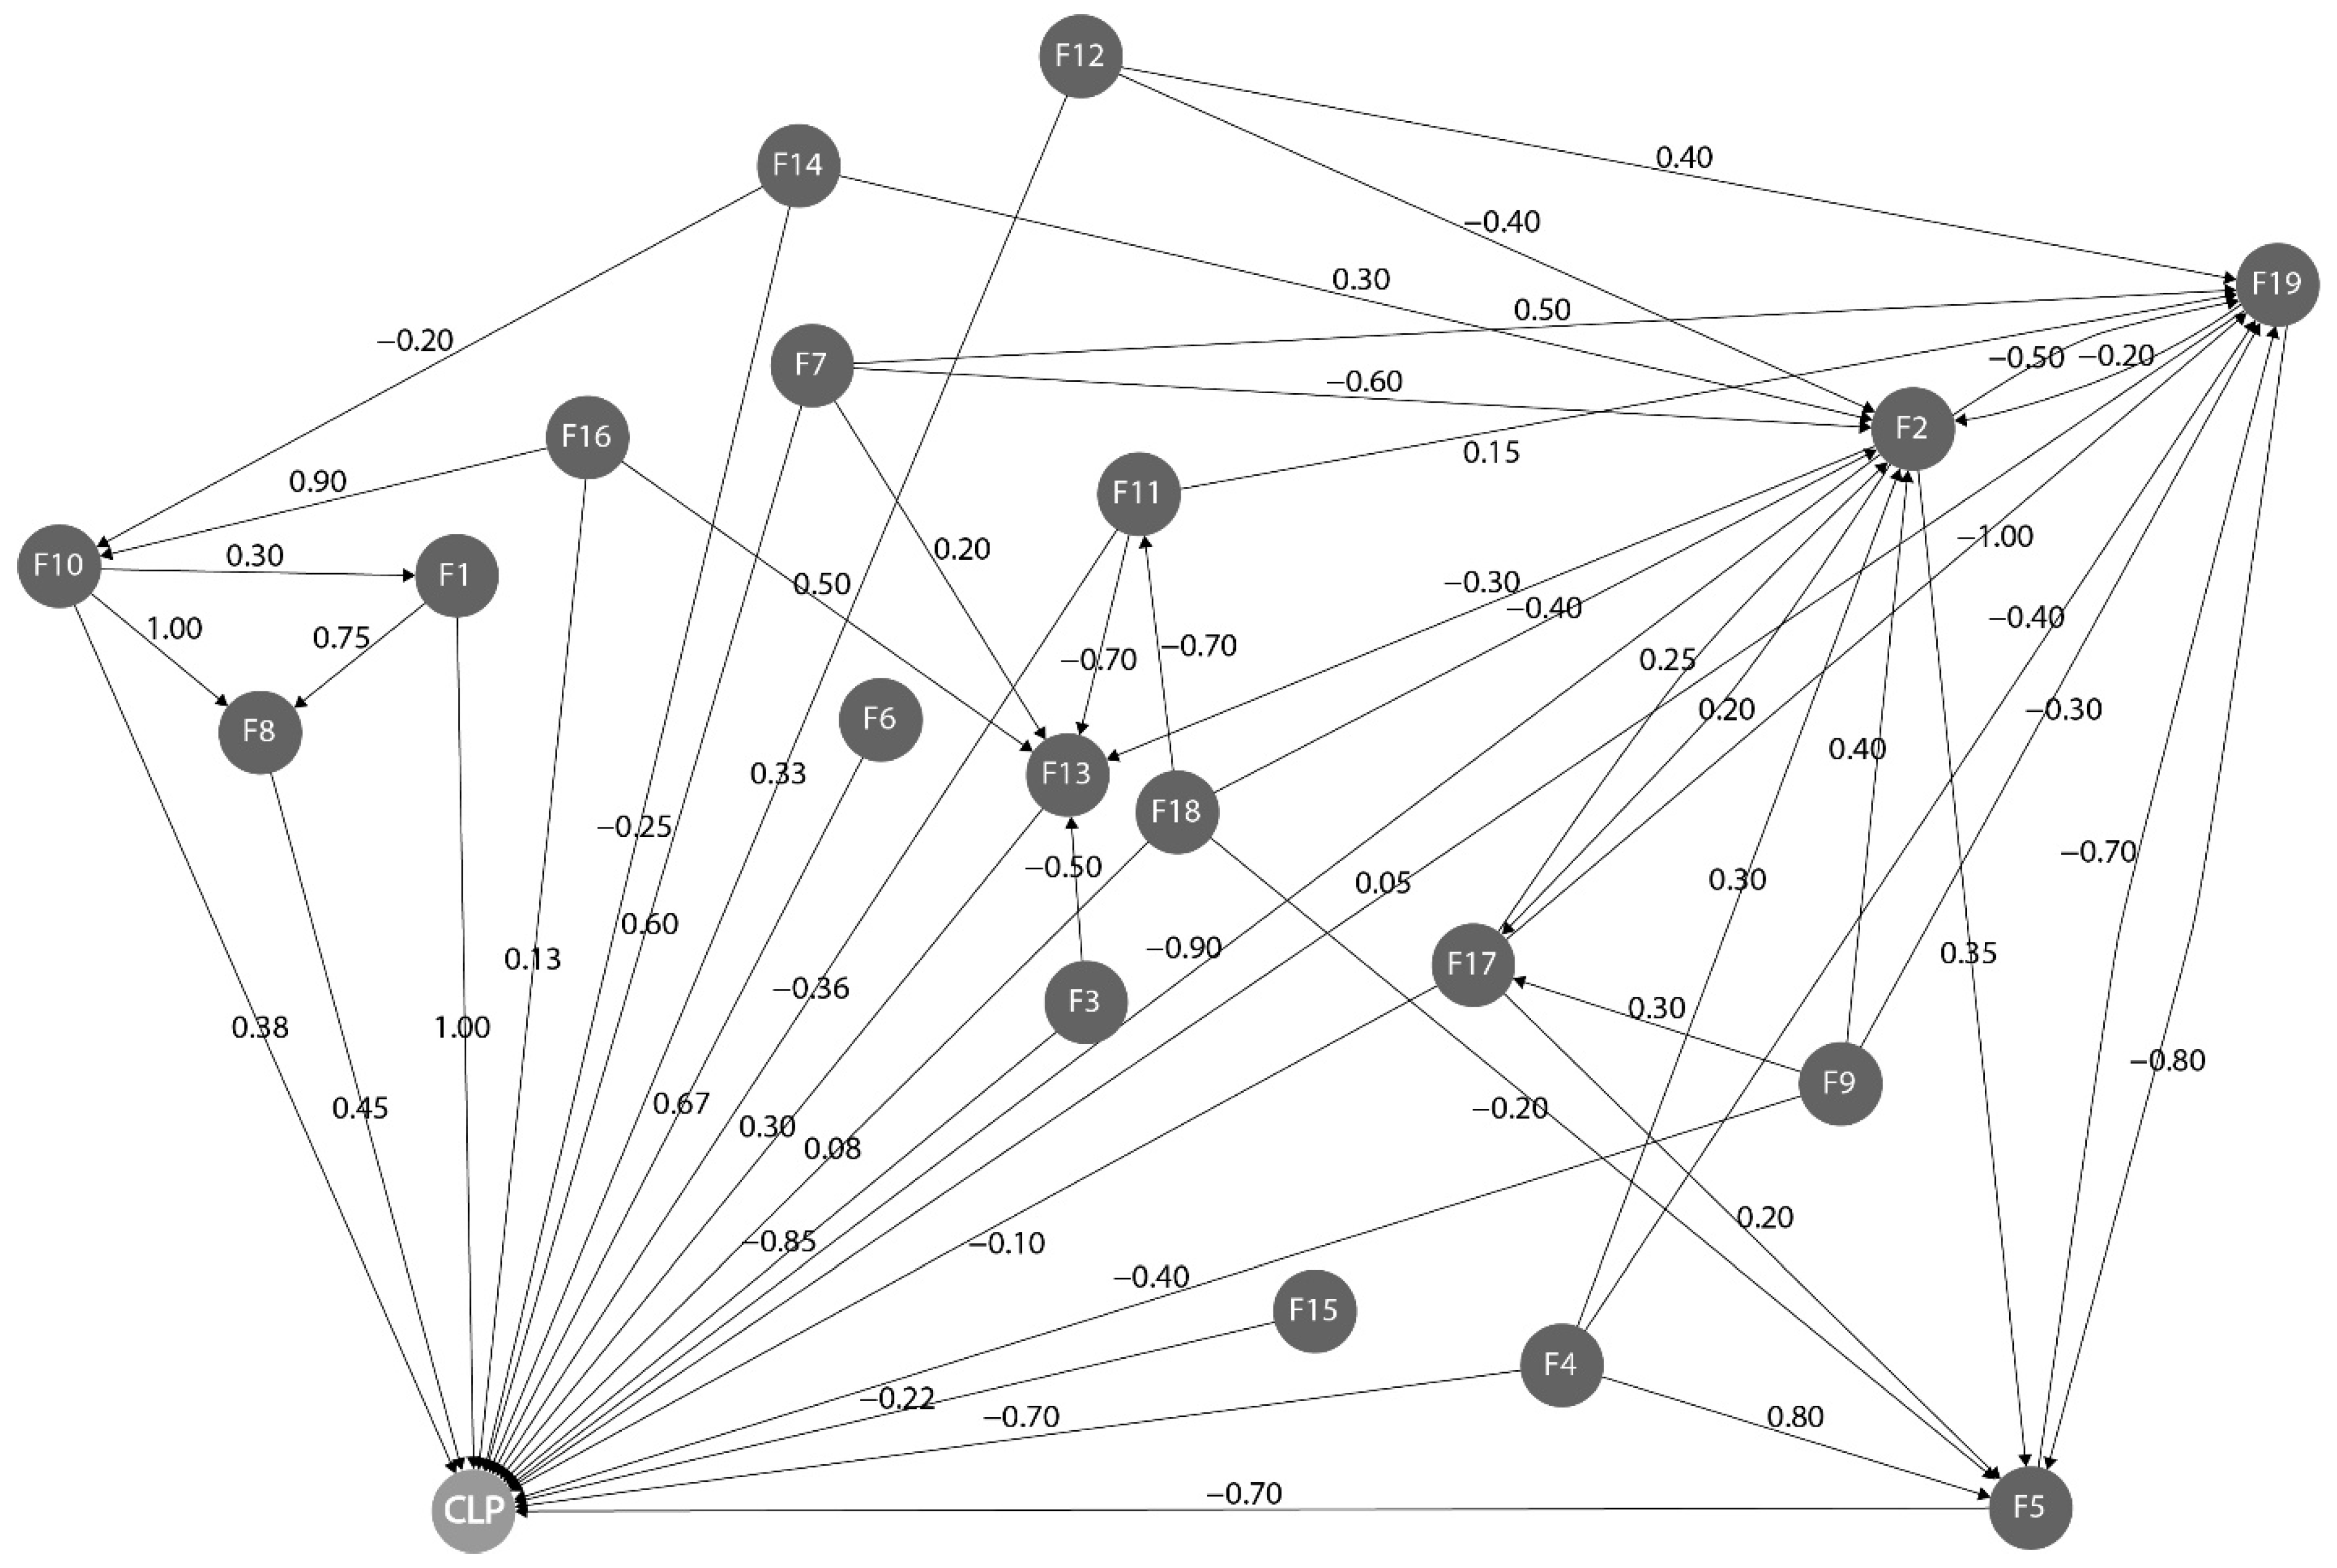
Based on the refined optimal weight matrix, the final FCM model of CLP is developed as shown in
Figure 7, F1, F2, and so on through F19 are the identified most value-adding CLP factors (listed in
Table 1), and the directions and values of the arrows demonstrate the direction and strength of causalities among the factors. For example, the strength of causality from factor 4 (F4) “Owner staff on site” toward factor 5 (F5) “Congestion of work area” is +0.8, which means F4 has a strong positive influence on F5; the strength of causality from factor 19 (F19) “Cleanliness of work area” toward factor 2 (F2) “Complexity of task” is −0.2, which means F19 has a weak negative influence on F2.
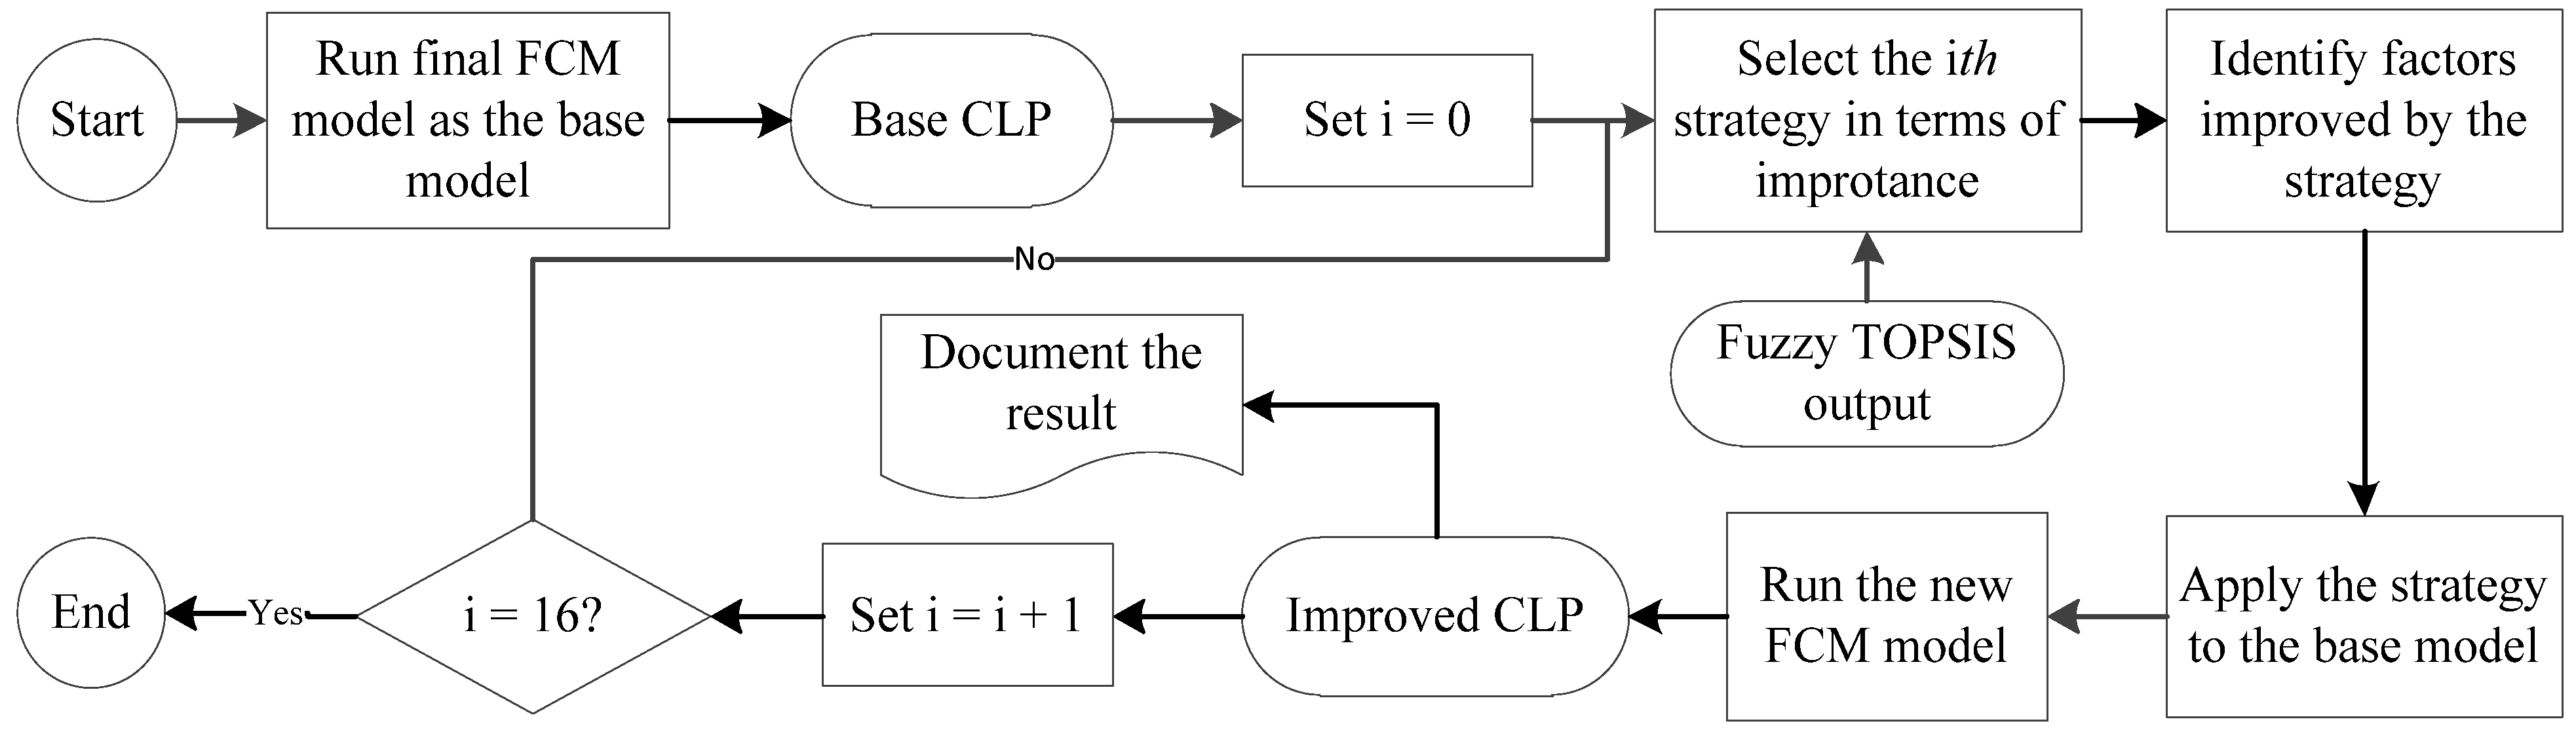
By considering the importance of improvement strategies derived from fuzzy TOPSIS, the quantified impact of each strategy on CLP is determined through the steps shown in
Figure 8.
As shown in
Figure 8, the final FCM model is run one time without applying any strategies in order to determine the base CLP that equals 0.5310 for the project under study. The base CLP is the current value of the project’s CLP. Then, a single strategy is applied to the model according to its rank as shown in
Table 3. In the case study, strategy 11, “Develop clear instructions about the equipment used to transport materials”, is selected first. The model is run and the resulting CLP is called the “improved CLP”, since it is obtained from applying the CLP improvement strategy to the FCM model. The improved CLP is 0.5452 for strategy 11. Other strategies are selected one by one according to their rank as shown in
Table 3, and their improved CLPs are determined, as shown in
Table 4.
4. Results and Discussion
The case study provided the application of the presented decision support model for identifying the most effective CLP improvement strategies and quantifying their impact on CLP for concrete-pouring activities in a building construction project. Experts’ opinions and historical data were collected to model the complex CLP environment including the relationships among the factors affecting CLP, which are mostly interconnected. According to SSC weights derived from the responses of ten experts to the questionnaire survey shown in
Figure 3, the most critical criteria for selecting CLP improvement strategies for the project under study are IC and IF, respectively. This means the first priority of the company is to implement strategies that have greater impact on CLP compared to other strategies. The second priority of the company is to implement strategies, which takes less time and involves lower costs compared to the project’s scheduled duration and budget.
In
Table 3, strategy 11, “Develop clear instructions about the equipment used to transport materials”, has the highest value of closeness coefficient. This strategy along with strategies S2, S13, S7, S6, S9, and S16 have closeness coefficients above the average. This means these strategies are the most effective CLP improvement strategies with respect to SSCs. The impact of these seven most effective strategies was quantified by developing an FCM model for CLP, implementing each strategy in the model, and determining improved CLP for each strategy. According to
Table 4, strategy 2, “Provide clear instructions to craftsmen on how to complete tasks before their execution”, improves CLP by 0.0206 and has the greatest impact on CLP. Recall that CLP is defined as the ratio of installed quantity (in cubic meters) to total labor work hours; therefore if concrete pouring requires 100 labor work hours per week, implementing this improvement strategy will increase the installed quantity of concrete by 100 × 0.0206, or 2.06 cubic meters per week. This strategy is supported by Tsehayae and Fayek [
11] and Gurmu and Aibinu [
27], whose work identified “Availability of clear work front”, “Adequate job instruction”, and “Clear readability of drawings and specifications” as top strategies for improving CLP. Strategy 6, “Train laborers to achieve the latest concrete-pouring techniques”, improves CLP by 0.0168 and is the second most effective in terms of impact on CLP. This strategy is supported by Archana Menon and Varghese [
56] and Hammad et al. [
57], who found “Training crew” and “Expanding skilled laborers” to be important strategies for improving construction productivity. Strategy 13, “Apply preventive maintenance to heating and air-conditioning systems to make sure they are in working order”, strategy 11, “Develop clear instructions about the equipment used to transport materials”, strategy 9, “Hold regular meetings with laborers about schedule and remaining tasks”, strategy 7, “Perform project team activities”, and strategy 16, “Hire cheap labor for daily housekeeping tasks”, are the next most effective strategies, improving project CLP by 0.0150, 0.0142, 0.0141, 0.0136, and 0.0101, respectively.
The proposed decision support model was evaluated using structural validity and behavioral validity, as discussed in the methodology section above. Structural validity was conducted by evaluating the list of model parameters (i.e., factors influencing CLP, CLP improvement strategies) with respect to the relevant literature and the panel of experts who completed surveys in various phases of the study. Regarding behavioral validity, behavior of the system was validated by the extreme conditions test, which compares the generated behavior of CLP in the FCM model before applying any strategies to the behavior of the real system of CLP under the same extreme conditions of CLP factors. First, the upper and lower bounds of factors and CLP need to be defined. Since the utilized dataset was normalized between 0 and 1, the upper bound for the factors and CLP is 1 and the lower bound is 0. Second, the FCM model is run twice. In the first run, factors that positively impact CLP took the extreme high value of 1, and the factors with negative impact on CLP took the extreme low value of 0. In this case, the resulting CLP was 0.984, which is close to 1, as anticipated. In the second run, positive factors took the extreme low value of 0 and negative factors took the high value of 1. The resulting CLP in this case was 0.088, which is close to 0, as anticipated. Therefore, the FCM model of CLP revealed a logical behavior when extreme values were assigned to the factors affecting CLP. Accordingly, behavioral validity of the proposed FCM model of CLP is determined.
Since CLP is affected by various interconnected factors, such as crew motivation and working conditions, it is necessary to consider the causal relationships among the factors and strategies to achieve accurate values for the quantified impact of strategies on CLP [
9]. Another issue that affects the accuracy of the quantified impact of improvement strategies is the consideration of project characteristics in modeling CLP. CLP is a context-specific efficiency measure because the identified factors and their degrees of impact on CLP vary from project to project [
1,
4]. Hence, key CLP improvement strategies also differ from one project to another. Since statistical methods such as
t-test and regression analysis lack the capability to capture project characteristics and causal relationships among various factors, considering project characteristics and causal relationships among CLP factors made the results of this research more accurate than previous studies that used statistical methods to quantify the impact of improvement strategies on CLP.
5. Conclusions
In this study, a decision support model is proposed to identify the most effective CLP improvement strategies and quantify their impact on CLP. The provided model consists of three phases, namely, (1) identifying factors and strategies, (2) ranking strategies, which includes the utilization of the two fuzzy MCDM methods of fuzzy AHP and fuzzy TOPSIS, and (3) quantifying strategies’ impact on CLP, which includes developing an FCM model of CLP in order to quantify the impact of improvement strategies on CLP. Implementation of the developed model on a case study of concrete-pouring activities in building projects was used to illustrate how construction practitioners can apply the proposed model to their projects in order to identify the improvement strategies that serve as the most effective management practices with respect to CLP. According to the case study results, the following ranked management practices were the most effective CLP improvement strategies for the project under study: (1) Develop clear instructions about the equipment used to transport materials, (2) Provide clear instructions to craftspeople on how to complete tasks before their execution, (3) Apply preventive maintenance to heating and air-conditioning systems to make sure they are in working order, (4) Perform project team activities, (5) Train laborers to achieve the latest concrete-pouring techniques, (6) Hold regular meetings with laborers about schedule and remaining tasks, and (7) Hire cheap labor for daily housekeeping tasks. These strategies are supported by previous studies that suggested similar strategies as the top management practices for improving CLP. Since CLP is a context-specific efficiency measure and CLP factors are mostly interconnected and affect each other, considering project characteristics and causal relationships among CLP factors made the results of this research more precise than previous studies that utilized statistical techniques to quantify the impact of improvement strategies on CLP. Statistical techniques such as t-test and regression analysis lack the capability to capture project characteristics and interconnections among the factors.
The contribution of this paper is providing a decision support methodology for construction companies and practitioners to solve the problem of prioritizing CLP improvement strategies and quantifying their impact on CLP by integrating two fuzzy MCDM methods, fuzzy AHP and fuzzy TOPSIS, with FCM. The combination of fuzzy AHP and fuzzy TOPSIS captures experts’ opinions and represents uncertainty and vagueness in the decision-making process of CLP improvement strategies selection without involving cumbersome mathematics. In addition, the utilized fuzzy MCDM methods support FCM by reducing the number of improvement strategies needed for FCM modeling according to various criteria including impact on CLP, implementation feasibility, workers’ adaptation, and implementation risk. The developed FCM model takes into account the imprecision and uncertainty of CLP factors as well as the causality among them. The proposed methodology considers the causal relationships among CLP improvement parameters and captures the perspective of construction experts to consider project characteristics and address existing gaps in the CLP improvement strategies literature. Therefore, the results of this research are more accurate than previous studies that used statistical methods to quantify the impact of improvement strategies on CLP without considering the project characteristics and causal relationships among CLP factors. The decision support model provided in this study can be adapted to several construction problems, such as selection of policies for maximizing crew motivation and performance. The presented model will assist construction managers in identifying the most effective improvement strategies for given projects and help them quantify how implementing various strategies impacts CLP. Therefore, construction companies will be able to simulate the impact of multiple management practices on CLP prior to their implementation in order to avoid applying management practices that have only subtle impact on CLP for given projects. Furthermore, they will be able to allocate their limited budget and resources to those strategies that most significantly improve CLP while providing a high degree of implementation feasibility, high degree of workers’ adaptation, and low degree of implementation risk. Based on the findings of this study, construction practitioners can improve the CLP of their projects significantly in order to reduce variances from the primary plan and keep projects on time and within budget.
The first limitation of this study was determining the effect of each improvement strategy on CLP without considering the existence of other strategies. However, improvement strategies are interconnected and synergy among them is expected to exist. To overcome the aforementioned limitation, future research may consider the impact of improvement strategies on each other by using simulation techniques such as fuzzy system dynamics to achieve results that are more precise. The second limitation was related to the limited number of experts that were used to carry out various phases of the developed model. In order to have more generalized and representative results, future studies may utilize a larger sample size in terms of experts. In addition, more criteria, such as impact on a company’s key performance indicators, schedule risk, and budget risk, can be considered for ranking CLP improvement strategies. Although adding more criteria increases the computational complexity of fuzzy MCDM methods and increases the time spent on survey questionnaires, the model is expected to deliver more accurate results for prioritizing improvement strategies as more criteria are considered in the strategy selection process. Adding more criteria can also increase the applicability of the proposed decision support model within a broader context, such as the selection of the most effective improvement strategies on multifactor construction productivity, which includes labor, equipment, and material.


