Article

Can People Really Do Nothing? Handling Annotation Gaps in ADL Sensor Data

by
Alaa E. Abdel Hakim
1,2,* and
Wael Deabes
1,3
1
Department of Computer Science in Jamoum, Umm Al-Qura University, Makkah 25371, Saudi Arabia
2
Electrical Engineering Department, Assiut University, Assiut 71516, Egypt
3
Department of Computers and Systems Engineering, Mansoura University, Mansoura 35516, Egypt
*
Author to whom correspondence should be addressed.
Algorithms 2019, 12(10), 217; https://doi.org/10.3390/a12100217
Submission received: 6 September 2019 / Revised: 9 October 2019 / Accepted: 12 October 2019 / Published: 17 October 2019

Abstract

:
In supervised Activities of Daily Living (ADL) recognition systems, annotating collected sensor readings is an essential, yet exhaustive, task. Readings are collected from activity-monitoring sensors in a 24/7 manner. The size of the produced dataset is so huge that it is almost impossible for a human annotator to give a certain label to every single instance in the dataset. This results in annotation gaps in the input data to the adopting learning system. The performance of the recognition system is negatively affected by these gaps. In this work, we propose and investigate three different paradigms to handle these gaps. In the first paradigm, the gaps are taken out by dropping all unlabeled readings. A single “Unknown” or “Do-Nothing” label is given to the unlabeled readings within the operation of the second paradigm. The last paradigm handles these gaps by giving every set of them a unique label identifying the encapsulating certain labels. Also, we propose a semantic preprocessing method of annotation gaps by constructing a hybrid combination of some of these paradigms for further performance improvement. The performance of the proposed three paradigms and their hybrid combination is evaluated using an ADL benchmark dataset containing more than 2.5 × 10 6 sensor readings that had been collected over more than nine months. The evaluation results emphasize the performance contrast under the operation of each paradigm and support a specific gap handling approach for better performance.

1. Introduction

Learning systems take decisions based on gathering experiences embedded in existing data [1]. However, an amount of labeled data intensely affects the performance of such systems. Learning methods are classified according to the availability of the labeled training data to supervised and unsupervised learning [2]. Acquiring complete labeled data for machine learning is regularly very challenging and prohibitive, therefore involving unlabeled data in the supervised learning process is vastly promising, since it expands the accuracy of those learning methods [3]. Moreover, a mutual hypothesis in supervised learning is that the collected labeled data represents a normal distribution of process characteristics. However, labeled datasets are frequently small due to the expensive labeling cost and/or sampling bias, which mislead the classification process and produce a non-generalized classifier [4].
Recently, hybrid learning methods that can learn from labeled and unlabeled data gained much interest hoping to construct better performing classifiers [5]. These methods can be categorized into three major approaches varying from fully supervised to unsupervised learning [6]: (1) Building an initial classifier based on a set of labeled data then use it for labeling the unlabeled data. Hereafter, a new classifier is built based on both the earlier and the new labeled data. Techniques such as a Self-Organizing Map (SOM), neural network [7] and ‘co-training’ using Naïve Bayes classifiers or Expectation Maximization (EM) are usually applied in this first approach [8]. (2) The second approach usually generates a data model using all available data by applying either a data density estimator or clustering procedure. Then, the labels are consequently applied to label entire clusters of data or estimate class densities. These class densities comprise labeling of the unlabeled data based on their relative position in the data space with respect to the originally labeled data [9]. One of the known techniques in this category is the probabilistic framework, which applies a mix of Gaussians or Parzen windows for learning [10]. (3) Both labeled and unlabeled data are processed together for creating semi or partially supervised classifier. This category is between the first and the second categories, since clustering depends on a proper similarity measure and is directed by labeled data. One of the techniques that belongs to this category is a General Fuzzy Min-Max (GFMM) neural network which iteratively processes both labeled and unlabeled data for adjusting hyper box fuzzy clusters [11]. Fairly diverse methods belong to this group are presented in [12]. Comparison between the classifiers based on only limited labeled data and those discussed above which use further unlabeled data shows the feasibility and the advances of the former techniques.
One of the well-known methods for conducting unlabeled data is the Expectation Maximization (EM) algorithm. EM handles the unlabeled data as missing data and assuming the generative model such as a mixture of Gaussians for iteratively estimating the model parameters and assigning soft labels to unlabeled examples. Applications such as text classification [13], image retrieval [14] bioinformatics [15], and natural language processing [16] widely use EM. Co-training approach [17] is another common method for integrating unlabeled data, if the data can be classified into two different sets of attributes. Instead, the transduction approach maximizes the classification margins on both labeled and unlabeled data to generate labels to a set of unlabeled data. Nonetheless, it is commonly observed that these methods could reduce performance due to abused model assumptions or sticking in local maxima [18].
However, many empirical studies show that using unlabeled data does not always improve the performance of some classifiers [1]. Thus, such facts definitely burden the deployment of semi-supervised learning in high-reliability real applications, which require more accurate performance compared with the existing supervised techniques. Therefore, it is crucial to build a safe semi-supervised classifier using unlabeled data without reducing the performance significantly [6]. The word safe means that the overall performance is not statistically considered worse than those using only labeled data. Many trials must be conducted, since the performance might be worse by exploiting more labeled data. The reason for the cruel effect of the unlabeled data is discussed in [19]. They inferred that the incorrect model assumptions are the main cause of the performance worsening since the learning process will be deceived by the wrong model assumptions. However, it is hard to create accurate model assumptions without applicable domain knowledge. Instead, methods that disagree with this belief usually use various learners to provide pseudo-labels of unlabeled data to enrich the whole data set. However, wrong pseudo-labels may confuse the learning process, but usually, data editing techniques are used to overcome this problem particularly on dense data, since these techniques trust on the data adjacent information [20].
This paper attacks the problem of studying and recognizing human activities of daily living (ADL), which is an important research issue in building a universal and smart environment. Consequently, it is crucial to build semantically rich models permitting knowledge in real time of which activity is performed by an occupant living in a smart home, from semantically poor sequences of observed binary events. Moreover, the main objective of this work is to find the best way to handle annotation gaps in the raw input human activity data. Therefore, we investigate the problem of unlabeled data from different perspectives using proposed annotation gaps handling paradigms. We look at the annotation gaps as unknown data that need to be used in a way that assists performance improvement. First, in paradigm #1, these gaps are treated as a source of confusion and removed. In the second paradigm, all gaps are classified as a unique “Unknown” class. The third paradigm characterizes the gaps by their encapsulating classes. This paradigm is inspired by observed input data pattern repetition depending on preceding and consequent activities. Finally, the first and the third paradigms are combined in a preprocessing stage to exploit some prior knowledge about the physical nature of the ground truth activities for further performance improvement. Experimentally based on a real smart home dataset, the proposed three paradigms are applied to evaluate the effect of each of them on different activity recognition metrics.
The rest of this paper is organized as follows: in Section 2, an overview of the used classifier, Hidden Markov Model, is presented. In Section 3, the problem of annotation gaps with the reasons behind are discussed. The proposed annotation gap handling paradigms are detailed in Section 4. The experimental setup is explained, and the evaluation results are discussed in Section 5 and Section 6, respectively. Finally, the paper is concluded in Section 7.

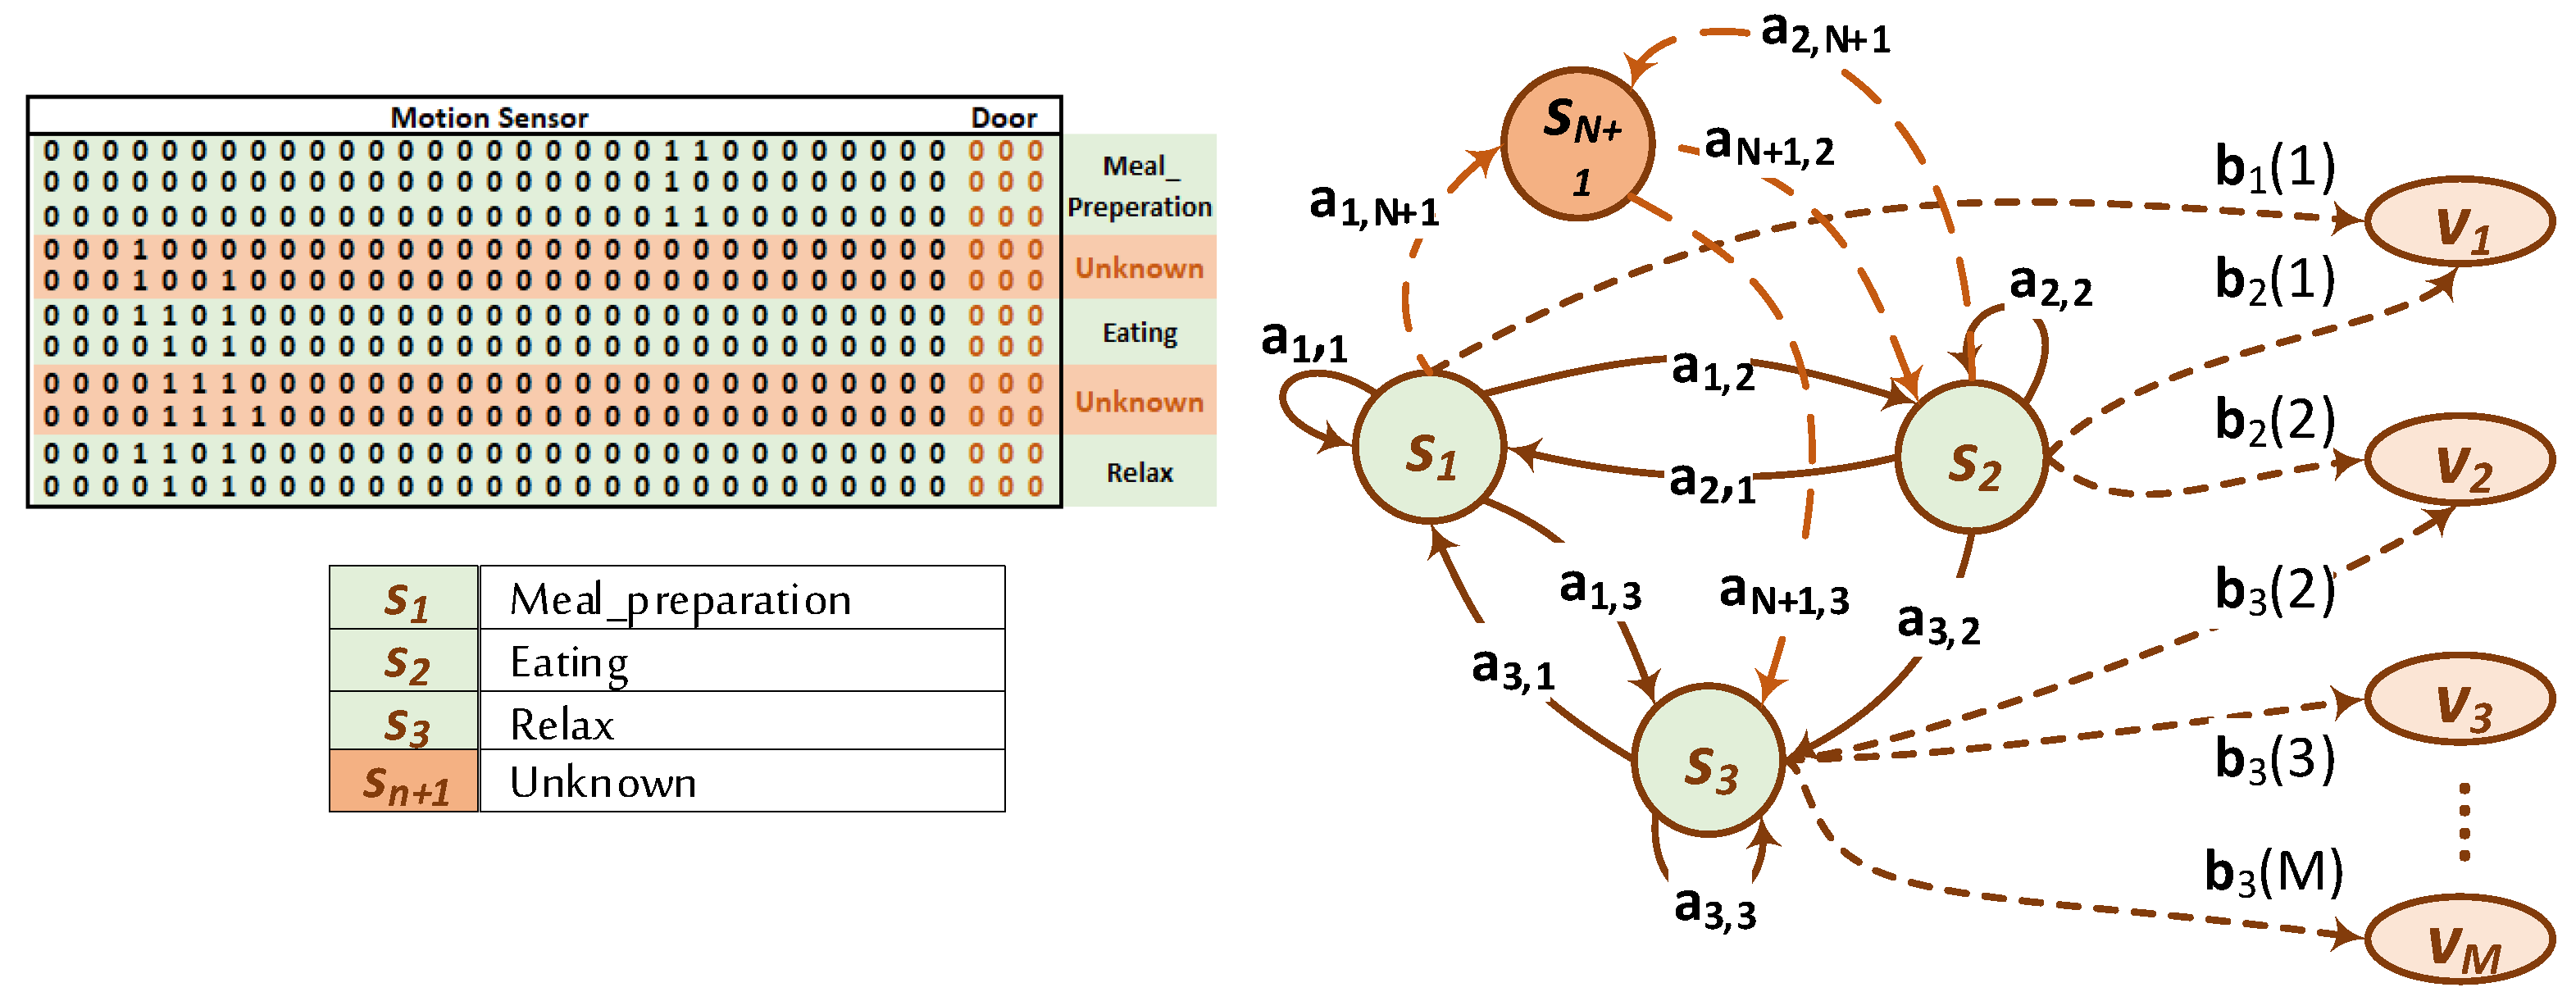
2. Hidden Markov Modeling of Activity Recognition

Currently, many mathematical models for activity recognition system have been developed, such as Hidden Markov Model (HMM) [21], Bayesian Network [22], Fuzzy Systems [23] and Neural Network [24]. Each model has its features and benefits. However, none of them can be assured to be entirely accurate, truthful, and totally free of error. However, HMM represents the most activity recognition model that is easy to develop and deploy.
HMM is one of the simplest forms of the Dynamic Bayesian Networks (DBNs), where it has one discrete hidden and observed nodes per segment. When dealing with spatio-temporal information, the accuracy of the HMMs is superior. Therefore, most of the activity recognition literature is based on HMMs. The main components of the HMM are represented by 5-tuple λ = ( S , V , A , B , π ) as follows [25]:
  • S = s 1 , s 2 s N is the set of the hidden states, N is the number of the states. The active state at a time instant, t, is q t . In the activity recognition model considered herein, the states represent the conducted activity in this specific instant, t;
  • V = v 1 , v 2 , v M is the set of observable events and M is the number of observation events. The observable events in our case are the sensor readings;
  • A = a i j is the state transition probability distribution, where a i j = P [ q t + 1 = s j | q t = s i ] , 1 i , j N ;
  • B = b j ( k ) is the observation event probability distribution for state s j where b j ( k ) = P [ v k a t t | q t = s j ] , 1 j N , 1 k M ;
  • π = { π 1 , π 2 π N } is the set of initial state probability distribution where π i = P [ q 1 = s i ] , 1 i N .
Figure 1 shows the structure of an HMM. For illustration purposes, only three activities along with two gaps are shown. The annotated activity transitions are represented by solid arcs, a i j , while the activity gaps are dimmed out.
For modeling the activity recognition problem by HMM, any activity is represented by a sequence of hidden states. At any time t, the user is assumed to be at one of these states and each state releases events with certain observation event probabilities b j ( k ) . In the following time slot, t + 1 , the system goes to another state, resulting in another activity, according to the transition probabilities between the states a i j . During the training phase, an annotated dataset is used to calculate the transition and observation event probabilities, transition, and emission models respectively, by solving decoding problem, i.e., estimating the most expected state sequence that achieves the events [26]. In the classification stage, the estimated transmission and emission models are used to estimate hidden states, which are the sought activities.

3. Annotation Gaps

At the core of activity recognition systems, multi-modal data, which is acquired by various sensors, represents the main ingredient for recognition algorithms. Typically, sensors are installed around target premises or house to “continuously” monitor the household activities. These sensors are physically installed in locations, which guarantee a collection of data assisting activity recognition algorithms. To provide such assistance, collected data must achieve a tradeoff between distinction and compactness. In other words, the collected data should be as compact as possible to get rid of any reading redundancy [27]. Yet, the collected readings should contain data that can be used to clearly distinguish between different activities. Types of sensors, readings resolution, installation positions, and operation environments usually contribute to the achievement of such tradeoff.
Used sensors may be visual, such as cameras of different modalities, or non-visual such as temperature and motion sensors. The scope of this paper is handling the data acquired by non-visual sensors. Typically, non-visual sensors provide digital and/or analog readings 24/7. The richness of such data could be an advantage in many cases and a source of challenge in other cases [27]. One of the challenges created by the big data size shows up in feeding such data into supervised learning-based frameworks. In particular, getting a ground truth label for every single instance in the acquired data is an extremely exhaustive process, if not impossible. This is because of the dependence on common manual labeling procedures.
A human annotator finds difficulties in giving a crisp activity label to each single reading instance due to several reasons such as the following:
  • There is a usual delay between acquisition and annotation. This results in missing specific labels of some activities.
  • By nature, many activities lack clear in-between boundaries determining their beginnings and their ends.
  • A household himself/herself is often the annotator. He/She usually gives labels to activities on fuzzy basis depending on his/her memory of the starts and the ends of the activities. Supported by the aforementioned annotation delay, this leads to consequent annotation inaccuracy.
All these factors lead the annotator to leave some unlabeled gaps surrounded by well-determined activity readings. For training processes, these gaps represent a source of modeling inaccuracy. Since it is extremely difficult to avoid the creation of such label gaps in the training data, we investigate various approaches to handle them during the training process. In the next section, we propose three different paradigms to handle these gaps.

4. Gap Handling Paradigms

In this section, we explain the proposed paradigms for dealing with existing annotation gaps in the acquired sensor data.

4.1. Gap Removal

In this paradigm, all unannotated data are dropped. In this case, the transition model will look at the input activities as if they are connected sequences. The input data will turn out to be a compressed version, which truncates the unannotated readings and consider the human subject in an idle state that is not taken into consideration for model building. Figure 2 shows an example of the input data after the application of this approach. In this case, the HMM model parameters are modified as follows:
a i j = 0 ; s j = N u l l , 1 i N
where s j = N u l l indicates an annotation gap. Similarly,
b j ( k ) = 0 ; s j = N u l l , 1 k M
The transition and emission models are re-estimated after normalizing both the state transition and the observation event probability distributions according to the conditions of Equations (1) and (2), respectively.

4.2. A Unique Label for Gaps

Unannotated data can be generated as a result of one of two cases: (1) undefined or idle user activities, (2) lack of ground truth provided by the human annotation. It is expected that removing these unlabeled data gaps, as illustrated in the previous approach, will work with the first case. However, the second case is common because of the difficulty of annotating all the collected sensor data. This difficulty comes from the fact that most of the annotators are usually the residents themselves, who find the annotation of such huge-size sensor data a boring and a time-wasting process. In this case, dropping these unannotated data does not only block valuable information from the classification, but it will also cause “confusion” and miss-training to the modeling process as well.
Therefore, to reflect the existence of some unknown activities between the annotated ones to the transition model, we give all these unannotated labels a single universal one, called “unknown”. This “unknown” activity is plugged into the model exactly the same as any ordinary activity. In this case, the ground truth activity labels, N, are increased by one. In other words, the training process is designed for N + 1 and s N + 1 is the “Do-Nothing” label, as follows:
S p 2 = s 1 , s 2 , , s N , s N + 1 ; s N + 1 = U n k n o w n
where S p 2 is the state space of paradigm #2. Figure 3 illustrates inserting this new unknown state into the HMM state space. It is considered in estimation of both transition and the emission models of the HMM.

4.3. Distinct Interactivity Labels

A close look at the raw sensor readings gives an intuition of presence of some repeated pattern depending on the preceding and the posterior confirmed activities. These patterns can be considered to be identifying signatures of their encapsulating activities. For example, Table 1 shows exemplar readings captured from a real activity recognition test-bed which contains several 34 digital sensors. In the left half of the table, the preceding activity is “Sleeping”, while the consequent activity is “Bed_to_Toilet”. The right half shows similar sample readings for the same two activities but with reversed order. Existence of repeated patterns in sensor readings in both cases is clear. However, while the sensor readings in the first gap is oscillating between 0x0001 and 0x292D, readings of 0x0001, 0x2FA0, and 0x3459 repeatedly shows up in the second gap. This implies that not only the gap’s encapsulating activities, but also their order, produce distinguishing signatures for the observable events within the gaps.
Inspired by this argument, we treat the gaps in this paradigm as distinguishing signatures of the encapsulating activities. This kind of gap handling may help identification of the encapsulating activities, since successful identification of such gaps guides identification of the encapsulating activities.
Theoretically, the number of interactivity labels equals square of the number of activities. However, practically, the matrix of the interactivity labels is sparse. This sparsity nature is inherited from the zero-probability links of the HMM state diagram. This means that the added states to the state diagram will not necessarily equal N 2 .
This procedure leads to reformulation of the HMM model parameters by increasing the cardinality if the state space, as follows:
| S p 3 | = N + N * ; N * N 2
where S p 3 is the state space of paradigm #3. Therefore, the state space cardinality of this paradigm is increased from N in paradigm #1 and from N + 1 in paradigm #2. All consequent transition and emission models are re-estimated accordingly. Figure 4 shows a graphical illustration of the operation of this paradigm.

5. Experimental Setup

The main objective of this work is to find the best way to handle annotation gaps in the raw input human activity data. We set up our evaluation experimentation to highlight the effect of each of the proposed three paradigms on different activity recognition metrics. In Section 5.1, the used dataset for evaluation are described. In Section 5.2, we illustrate the procedures, which we followed in the evaluation process and the used metrics.

5.1. Dataset

The proposed method is applied on a dataset collected from the WSU-CASAS smart home project [28]. The set consists of more than 2.5 M sensor readings for a single female household for the whole day (24 h) over more than nine months. Thirty-four sensors are distributed all over the house. There are 31 binary motion sensors plus 3 door-closure binary sensors. The placement of these sensors inside the house is shown in Figure 5. In addition to sensor readings and timestamps, manual annotation is carried out to the data to label current household’s activities by its ground truth labels. There are nine ground truth labels representing nine activities. For evaluation, we use the annotation gaps that already exist in the dataset. We do not create our own annotation gaps. Therefore, the annotation gaps used for evaluation is completely unbiased and reflect typical realistic annotation behavior.
The readings of the sensors are represented by a 34 bits binary code V i , where i is the observation instance. Some examples explaining the structure of these codes are shown in Table 2. Bits from v 0 i to v 30 i represent the 31 motion sensors while the bits in the range v 31 i v 33 i denote the 3 door-closure sensors.

5.2. Evaluation Procedures and Metrics

As illustrated in Section 5.1, the input sensor dataset is semi-annotated manually. The main objective of an activity recognition system is to achieve high recognition rates. The recognition performance is affected by different factors. In HMM-based models, the succession of states and the length of each state directly influence both the transition and emission models. This gives special importance to the length of the sampling time interval, Δ t . In particular, if the sampling time interval is much longer than the activity duration, some activities may be lost and not reflected to the transition model. On the other side, if it is too small, repetition overhead will be increased during the HMM model estimation affecting the state transition distribution. Therefore, a tradeoff is needed. However, the recall-precision pairs are highly dependent on both Δ t and the activities’ duration. This means that changing Δ t to obtain a generalized stable recall-precision analysis such as ROC that is globally applicable to any activity pattern is questionable. Therefore, reaching a general recommendation of the best sampling interval in terms of the intervals of the sensor readings is the best investigation outcome rather than building a conclusion on an activity pattern-dependent outcome. Therefore, we opted to investigate the most proper value of Δ t independently of the underlying activity duration. For the used dataset, the average activity interval between sensor readings is about 11 s. We tested different values for Δ t and found that an interval of 7 s gives a good basis for all paradigms. Therefore, we recommend using Δ t values between 50 % and 65 % of the average sensor inter-reading intervals. This sampling rate guarantees a relatively “succinct” coverage of almost all the recorded readings.
We resampled the input sensor readings using Δ t = 7 s. Then, we applied the Viterbi algorithm to estimate the emission and transition models. The size of the generated samples exceeded 2 M samples. 60% of these samples were used as the training dataset for model estimation. The remaining 40% were used to evaluate the performance.
Since the main investigation target of the proposed paradigms is the activity recognition performance, we considered four major recognition evaluation metrics. Specifically, we used recall, accuracy, precision, and specificity metrics for this purpose.
Recall measures the fraction of the correctly recognized instances of an activity to the total number of the retrieved instances of this specific activity, as shown in the following equation:
R e c a l l = T P T P + F N
where T P equals the number of true positives and F N equals the number of false negatives.
The Precision metric is used to quantify the positive predictive values of recognizing an activity.
P r e c i s i o n = T P T P + F P
The closeness of the total retrieved activities to the true recognition values is measured by the Accuracy.
A c c u r a c y = T P + T N T P + T N + F P + F N
where T N and F P are the number of true negatives and false positives, respectively.
Finally, the True Negative Rate (TNR), or Specificity, quantifies how specific the classifier is, with respect to the other activities. In other words, how much the activity does not influence other activities when they are classified.
S p e c i f i c i t y = T N T N + F P

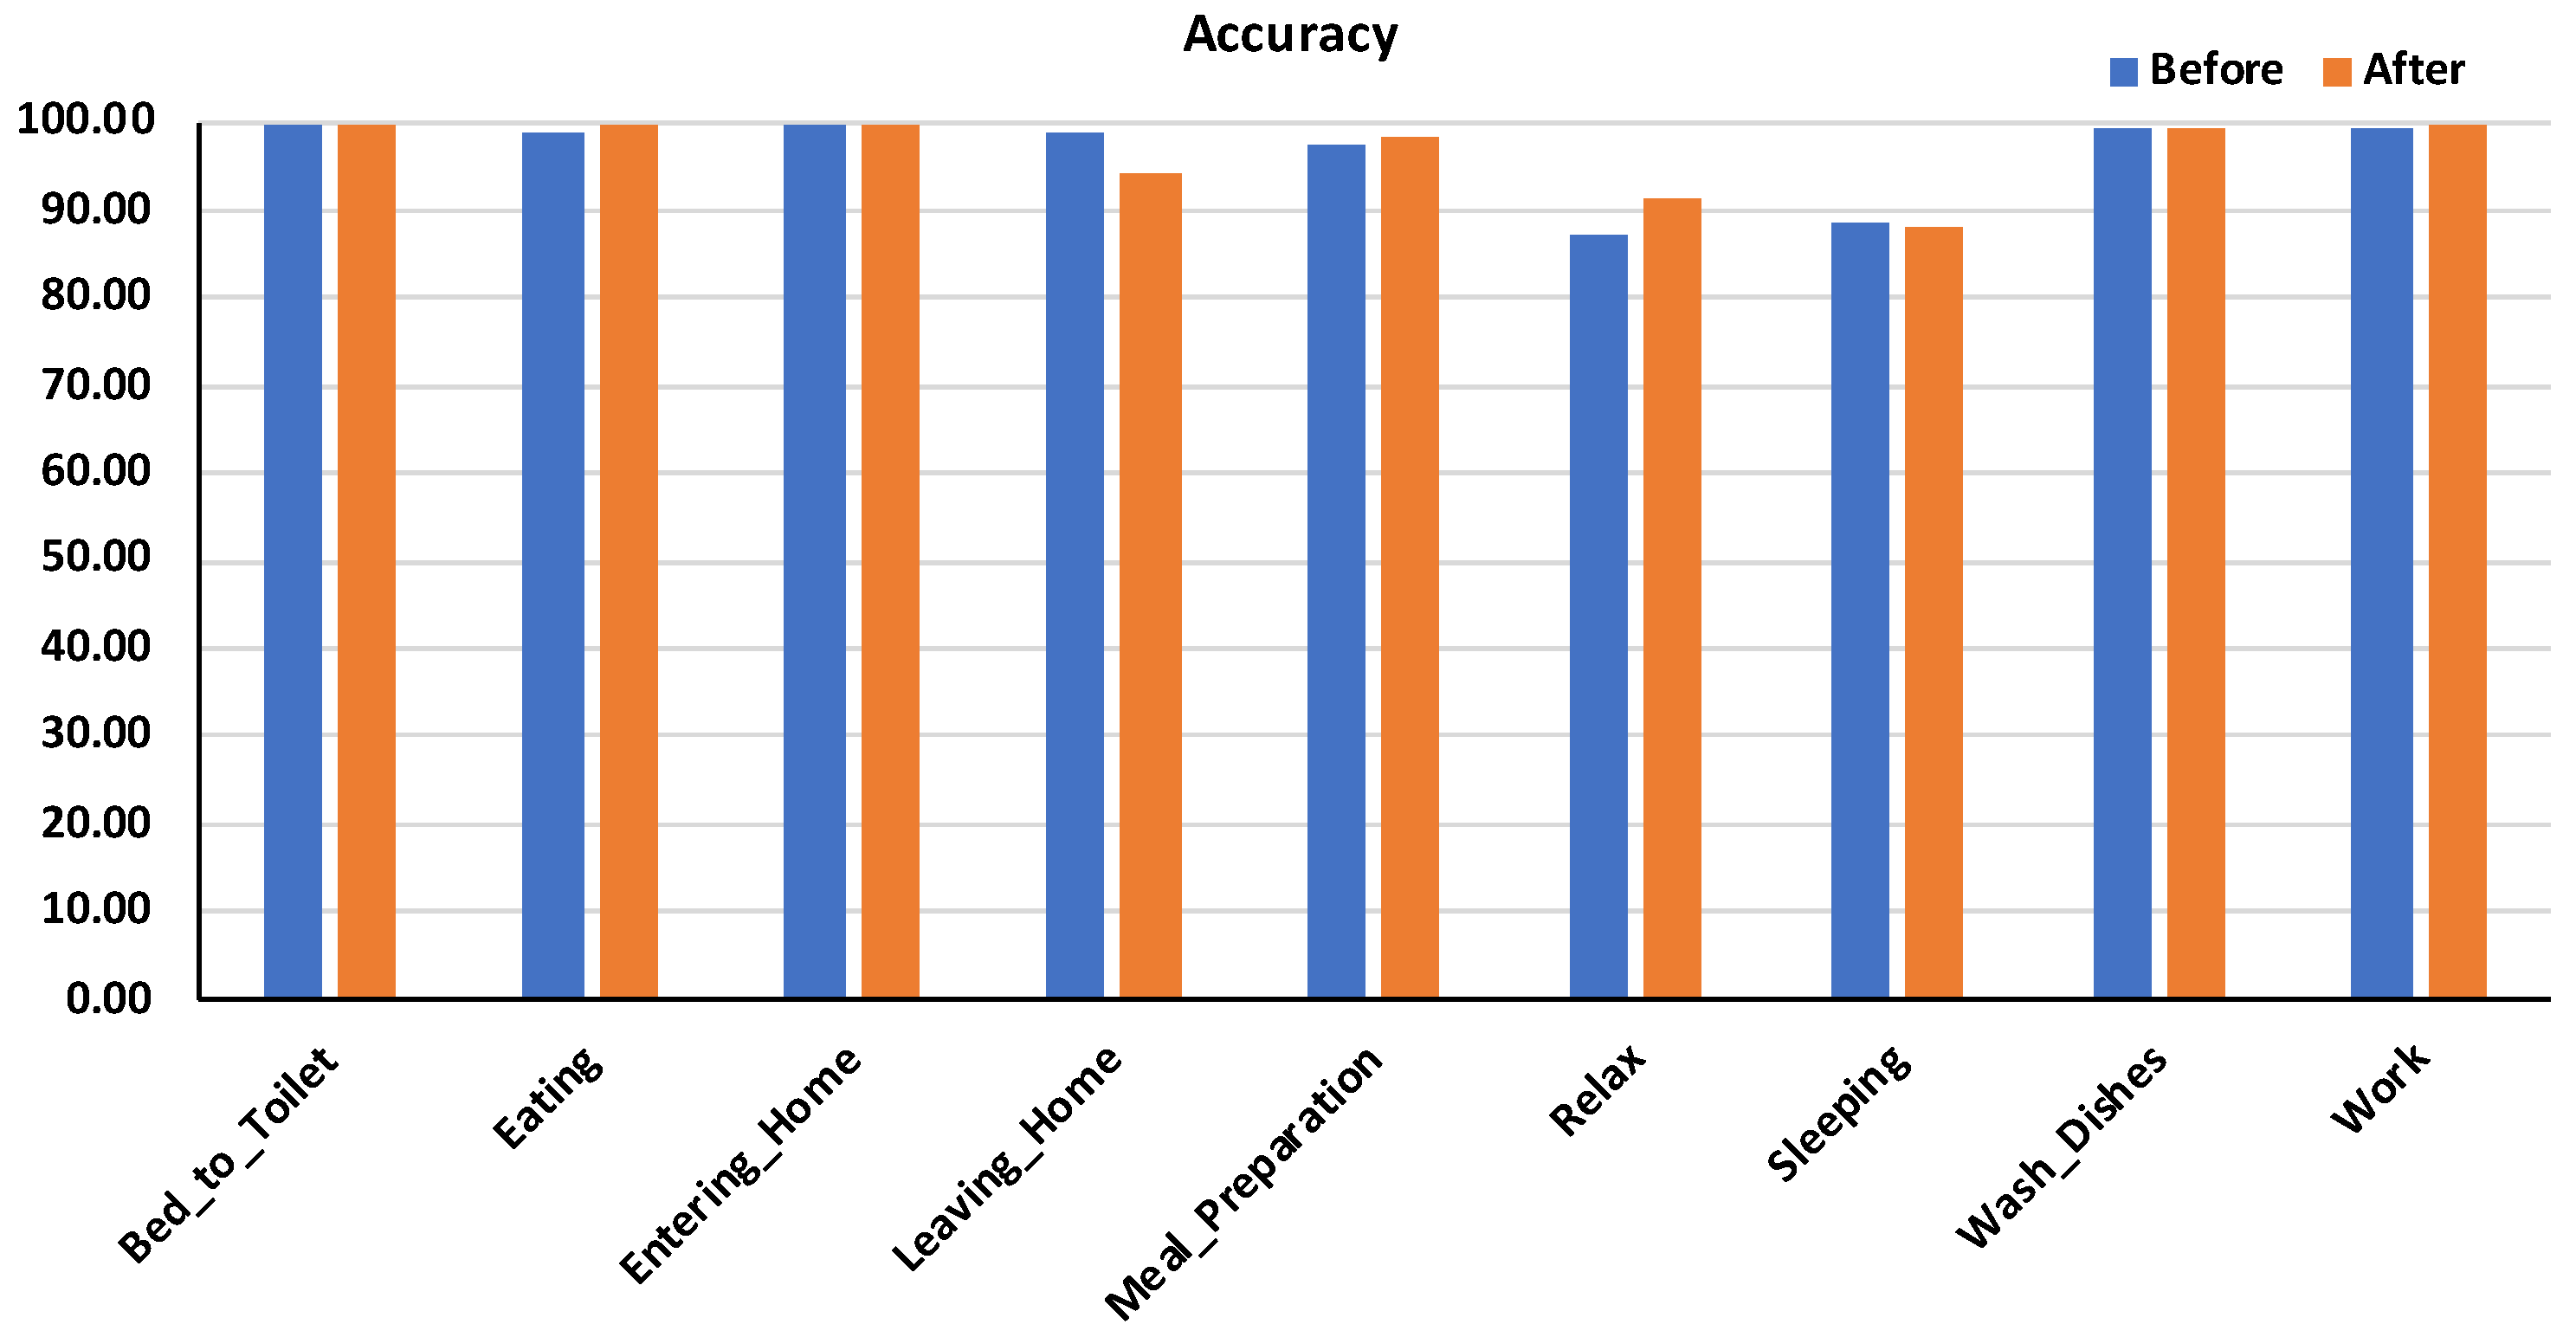
6. Results and Discussion

Handling the annotation gaps (unlabeled data) in the raw input human activity data is a challenging task. We proposed three paradigms from different perspectives to investigate the best way to handle this unlabeled data. To evaluate and quantify the performance of the proposed paradigms, we used the aforementioned four metrics with the evaluation dataset for every single activity.
Figure 6 shows the recall values. As for paradigm #1, removing all annotation gaps, it shows high recall values in three activities: Leaving-Home, Sleeping, and Meal-Preparation. For the Meal-preparation and Sleeping activities, the differences between the recall values of the three paradigms are not so big. However, for the Leaving-Home activity, the superiority of paradigm #1 is obvious. In fact, this is a logical behavior. In particular, if we think about the core operation of this paradigm, we see that the interactivity annotation after the Leaving-Home activity is usually removed. This is because the human annotator does not have an ‘out-of-home’-like label. Therefore, he/she usually leaves all input readings between the Leaving-Home and the consequent activity, which is Entering-Home blank. Paradigm #1 by nature omits these gaps resulting in a ‘certain’, yet logical, sorted order correlation between the Leaving-Home and the Entering-Home activities. In contrast to the other two paradigms, they give some label to the in-between gaps separating these two activities. Since the used dataset is for a single household, ideally there should be no readings between these two activities except sensors noise. The given label for this gap, either it is an Unknown label as in paradigm #2 or Leaving-Entering as in paradigm #3, easily gets confused with other ‘idle-similar’ activities. This argument is supported by investigating the top matches to the Leaving-Home activity under the operation of the two paradigms. The top classification of the Leaning-Home activity under paradigms #2 and #3 is Sleeping. The Sleeping activity relatively conforms with the gap after Leaving-Home property of being idle till the beginning of the following activity.
To overcome this drawback, we suggest to extend the annotation of such kinds of activities to the successive one; or to create a new dedicated label for these specific gaps, e.g., Out-of-Home, as shown later in this section.
Paradigm #2 does not have a bold improvement except for activities which have low repeatability of their successor activities, e.g., Wash-Dishes.
The precision values show similar behavior to recall’s with slight differences, as shown in Figure 7. Therefore, the same preceding discussion applies to this measure.
For the accuracy and specificity metrics shown in Figure 8 and Figure 9 respectively, all paradigms show high performance in slight superiority of paradigm #3. The only case in which paradigm #3 achieves noticeable improvement is with the Sleeping activity. This is because of the repeatability nature of the successor activity, which is the Bed-to-Toilette activity. Giving a unique label to the intermediate input between these two activities supports correct recognition decision.
We developed an auxiliary preprocessing procedure to aid the model estimation and classification of HMM. Some erroneously missing annotations can be obviously restored. For example, as mentioned earlier, the annotation gap between activities such as Leaving_Home and Entering_Home is not logic, since it is obviously known that any recorded sensor readings between these two activities is erroneous. Therefore, the two activities should be adjacently connected. It is expected that eliminating this gap by extending the preceding Leaving_Home activity is hypothetically better for recognition performance. Activity extension in this specific case may be better than complete gap removal, as extension will reflect practical activity duration. Paradigm #3 blindly handles all such cases by giving these kinds of gaps unique labels. Nonetheless even if this gap is assigned a unique label, it will be very similar to idle-tended activities, e.g., Sleeping and Relax. When this semantic preprocessing step is performed, a hybrid combination of paradigm #3 and paradigm #1, with slight modification by extension of the preceding activity rather than complete removal of the gap, is created. Yet, paradigm #3 is applied for all gaps.
To investigate the effect of this hybrid paradigm, we use the aforementioned four metrics for comparison with paradigm #3 as the best of the two ingredients of this hybrid paradigm. Figure 10, Figure 11, Figure 12 and Figure 13 show comparison between paradigm #3 and the hybrid paradigm. The direct improvement effect appears in the recall of the Leaving_Home activity, Figure 10. This is natural because it is the preprocessed activity. The improvement burst is achieved with the precision values, Figure 11. The reason behind this large improvement for almost all activities is that the presence of obviously redundant annotation gap between Leaving_Home and Entering_Home causing unnecessary confusion to the model estimation process for almost all other activities. When this gap has been removed, the model became “more certain” about the other activities. The remaining two metrics exhibit slight improvement in one of the idle-tended activities, Relax, as a result of getting rid of this confusing gap.
From this discussion, we can defend the success of paradigm #3 in improving the performance of semi-supervised statistical and learning-based activity recognition systems. If there is a room for annotation gap semantic preprocessing to deal with obvious scenarios, it will be a good addition that pushes performance improvement.

7. Conclusions

We addressed the problem of annotation gap existence in input sensor readings of ADL systems. We investigated three paradigms for handling these gaps. The first paradigm drops the non-annotated gaps from the training data. The second paradigm gives all the instances belonging to these gaps a unique unknown or do-nothing label. Inspired by some repeated patterns in these gaps, the third paradigm attributes every gap by its preceding and successor activities. A hybrid combination of a modified version of the first and the third paradigms was proposed by semantic preprocessing of some annotation gaps. The major comparison criterion between the proposed three paradigms is their impact on the overall activity recognition performance of the adopting supervised recognition model. An HMM was used as the adopted learning model for evaluation purposes. Evaluation results showed the superiority of the third paradigm over the other two paradigms in most cases. Furthermore, a noticeable performance improvement is achieved, if proper semantic preprocessing is conducted. The failure cases of the third paradigm were with gaps whose similar successor activities. The failure cases can be exploited to guide optimal sensor assignment and allocation processes.

Author Contributions

Conceptualization, A.E.A.H. and W.D.; Methodology, A.E.A.H. and W.D.; Software, A.E.A.H.; Validation, A.E.A.H. and W.D.; Formal Analysis, A.E.A.H.; Investigation, W.D.; Resources, W.D.; Data Creation, A.E.A.H. and W.D.; Writing—Original Draft Preparation, A.E.A.H. and W.D.; Writing—Review and Editing, A.E.A.H. and W.D.; Visualization, A.E.A.H. and W.D.; Project Administration, A.E.A.H. and W.D.; Funding Acquisition, A.E.A.H. and W.D.

Funding

This work was funded by the National Plan for Science, Technology and Innovation (MAARIFAH)—King Abdulaziz City for Science and Technology—the Kingdom of Saudi Arabia, award number (13-ENE2356-10).

Acknowledgments

The authors would like to thank the—King Abdulaziz City for Science and Technology—the Kingdom of Saudi Arabia, (Grant number: 13-ENE2356-10).

Conflicts of Interest

The authors declare no conflict of interest.

Abbreviations

The following abbreviations are used in this manuscript:
ADLActivities of Daily Living
SOMSelf-Organizing Map
EMExpectation Maximization
ANNArtificial Neural Networks
GFMMGeneral Fuzzy Min-Max
CANNCapacitance Artificial Neural Network
HMMHidden Markov Model
TNRTrue Negative Rate

References

  1. Li, Y.F.; Zhou, Z.H. Towards making unlabeled data never hurt. IEEE Trans. Pattern Anal. Mach. Intell. 2015, 37, 175–188. [Google Scholar] [CrossRef] [PubMed]
  2. Weber, N. Unsupervised Learning in Human Activity Recognition: A First Foray into Clustering Data Gathered from Wearable Sensors. Ph.D. Thesis, Radboud University, Nijmegen, The Netherlands, 2017. [Google Scholar]
  3. Trabelsi, D.; Mohammed, S.; Chamroukhi, F.; Oukhellou, L.; Amirat, Y. An unsupervised approach for automatic activity recognition based on Hidden Markov Model regression. IEEE Trans. Autom. Sci. Eng. 2013, 10, 829–835. [Google Scholar] [CrossRef]
  4. Toda, T.; Inoue, S.; Tanaka, S.; Ueda, N. Training Human Activity Recognition for Labels with Inaccurate Time Stamps. In Proceedings of the 2014 ACM International Joint Conference on Pervasive and Ubiquitous Computing: Adjunct Publication, Seattle, WA, USA, 13–17 September 2014; pp. 863–872. [Google Scholar]
  5. Yoon, J.W.; Cho, S.B. Global/Local Hybrid Learning of Mixture-of-Experts from Labeled and Unlabeled Data. In Proceedings of the International Conference on Hybrid Artificial Intelligence Systems, Wroclaw, Poland, 23–25 May 2011; Springer: Berlin/Heidelberg, Germany, 2011; pp. 452–459. [Google Scholar]
  6. Tan, Q.; Yu, Y.; Yu, G.; Wang, J. Semi-supervised multi-label classification using incomplete label information. Neurocomputing 2017, 260, 192–202. [Google Scholar] [CrossRef]
  7. Dara, R.; Kremer, S.; Stacey, D. Clustering unlabeled data with SOMs improves classification of labeled real-world data. In Proceedings of the 2002 International Joint Conference on Neural Networks, Honolulu, HI, USA, 12–17 May 2002; Volume 3, pp. 2237–2242. [Google Scholar]
  8. Lee, Y.S.; Cho, S.B. Activity recognition with android phone using mixture-of-experts co-trained with labeled and unlabeled data. Neurocomputing 2014, 126, 106–115. [Google Scholar] [CrossRef]
  9. Pentina, A.; Lampert, C.H. Multi-Task Learning with Labeled and Unlabeled Tasks. In Proceedings of the 34th International Conference on Machine Learning, Sydney, Australia, 6–11 August 2017; Volume 70, pp. 2807–2816. [Google Scholar]
  10. Chawla, N.V.; Karakoulas, G. Learning from labeled and unlabeled data: An empirical study across techniques and domains. J. Artif. Intell. Res. 2005, 23, 331–366. [Google Scholar] [CrossRef]
  11. Gabrys, B.; Bargiela, A. General fuzzy min-max neural network for clustering and classification. IEEE Trans. Neural Netw. 2000, 11, 769–783. [Google Scholar] [CrossRef] [PubMed]
  12. Cohn, D.; Caruana, R.; McCallum, A. Semi-supervised Clustering with User Feedback. Constrained Clust. Adv. Algorithms Theory Appl. 2003, 4, 17–32. [Google Scholar]
  13. Kowsari, K.; Brown, D.E.; Heidarysafa, M.; Meimandi, K.J.; Gerber, M.S.; Barnes, L.E. HDLTex: Hierarchical Deep Learning for Text Classification. In Proceedings of the 2017 16th IEEE International Conference on Machine Learning and Applications (ICMLA), Cancun, Mexico, 18–21 December 2017. [Google Scholar]
  14. Vrigkas, M.; Nikou, C.; Kakadiaris, I.A. A Review of Human Activity Recognition Methods. Front. Robot. AI 2015, 2, 28. [Google Scholar] [CrossRef]
  15. Szilágyi, L.; Medvés, L.; Szilágyi, S.M. A modified Markov clustering approach to unsupervised classification of protein sequences. Neurocomputing 2010, 73, 2332–2345. [Google Scholar] [CrossRef]
  16. Goutte, C.; Déjean, H.; Gaussier, E.; Cancedda, N.; Renders, J.M. Combining labelled and unlabelled data: A case study on fisher kernels and transductive inference for biological entity recognition. In Proceedings of the 6th Conference on Natural Language Learning, Taipei, Taiwan, 31 August–1 September 2002. [Google Scholar]
  17. Goldman, S.A.; Zhou, Y. Enhancing Supervised Learning with Unlabeled Data. In Proceedings of the 17th International Conference on Machine Learning, Stanford, CA, USA, 29 June–2 July 2000; Volume 3, pp. 327–334. [Google Scholar]
  18. Seeger, M. Learning with labeled and unlabeled data. In Encyclopedia of Machine Learning; Sammut, C., Webb, G.I., Eds.; Springer: Boston, MA, USA, 2001. [Google Scholar]
  19. Cozman, F.G.; Brazil, S.P.; Cohen, I. Unlabeled Data Can Degrade Classification Performance of Generative Classifiers. In Proceedings of the Fifteenth International Florida Artificial Intelligence Research Society Conference, Pensacola, FL, USA, 14–16 May 2002; pp. 327–331. [Google Scholar]
  20. Wu, X. Incorporating large unlabeled data to enhance em classification. J. Intell. Inf. Syst. 2006, 26, 211–226. [Google Scholar] [CrossRef]
  21. Liisberg, J.; Møller, J.K.; Bloem, H.; Cipriano, J.; Mor, G.; Madsen, H. Hidden Markov Models for indirect classification of occupant behaviour. Sustain. Cities Soc. 2016, 27, 83–98. [Google Scholar] [CrossRef] [Green Version]
  22. Oliver, N.; Horvitz, E. A Comparison of HMMs and Dynamic Bayesian Networks for Recognizing Office Activities. In Proceedings of the International Conference on User Modeling, Edinburgh, UK, 24–29 July 2005; pp. 199–209. [Google Scholar]
  23. Banerjee, T.; Keller, J.M.; Skubie, M. Building a framework for recognition of activities of daily living from depth images using fuzzy logic. In Proceedings of the 2014 IEEE International Conference on Fuzzy Systems (FUZZ-IEEE), Beijing, China, 6–11 July 2014; pp. 540–547. [Google Scholar]
  24. Bourobou, S.; Yoo, Y. User Activity Recognition in Smart Homes Using Pattern Clustering Applied to Temporal ANN Algorithm. Sensors 2015, 15, 11953–11971. [Google Scholar] [CrossRef] [PubMed] [Green Version]
  25. Rabiner, L.R. A Tutorial on Hidden Markov Models and Selected Applications in Speech Recognition. Proc. IEEE 1989, 77, 257–286. [Google Scholar] [CrossRef]
  26. Aggarwal, J.; Ryoo, M. Human activity analysis: A review. ACM Comput. Surv. 2011, 43, 16:1–16:43. [Google Scholar] [CrossRef]
  27. Abdel-Hakim, A.E.; Deabes, W.A. Impact of sensor data glut on activity recognition in smart environments. In Proceedings of the 2017 IEEE 17th International Conference on Ubiquitous Wireless Broadband (ICUWB), Salamanca, Spain, 12–15 September 2017. [Google Scholar]
  28. Datasets from WSU CASAS Smart Home Project. Available online: http://ailab.wsu.edu/casas/datasets/ (accessed on 20 March 2017).
Figure 1. Graphical representation of the used HMM for activity recognition. Annotated events are represented by solid-circle states. Annotation gaps are shown in dimmed circles.
Algorithms 12 00217 g001
Figure 2. Paradigm #1: Annotation gaps are removed completely from the training data.
Algorithms 12 00217 g002
Figure 3. Paradigm #2: Annotation gaps are assigned a unique “Unknown” label under state s N + 1 .
Algorithms 12 00217 g003
Figure 4. Paradigm #3: A new state is created for each annotation gap and stamped by its ordered encapsulating activities in order.
Algorithms 12 00217 g004
Figure 5. Sensor placement inside the experimental environment [28].
Algorithms 12 00217 g005
Figure 6. Recall values of the proposed three paradigms.
Algorithms 12 00217 g006
Figure 7. Precision evaluation of the proposed paradigms.
Algorithms 12 00217 g007
Figure 8. Accuracy values of the proposed paradigms. Note the improvement of Sleeping recognition with paradigm #3, which characterizes the encapsulating activities. This achieves some degree of distinction from other idle-tended activities such as Relax.
Algorithms 12 00217 g008
Figure 9. Specificity values of the proposed three paradigms.
Algorithms 12 00217 g009
Figure 10. Comparison of recall values of paradigm #3 before and after applying semantic preprocessing. Note the big improvement that is achieved with the preprocessed activity Leaving_Home.
Algorithms 12 00217 g010
Figure 11. Comparison of precision values of paradigm #3 before and after applying semantic preprocessing. Burst improvements are achieved with almost all activities, since a considerable source of confusion has been got rid of.
Algorithms 12 00217 g011
Figure 12. Comparison of accuracy values of paradigm #3 before and after applying semantic preprocessing.
Algorithms 12 00217 g012
Figure 13. Comparison of specificity values of paradigm #3 before and after applying semantic preprocessing.
Algorithms 12 00217 g013
Table 1. Interactivity sensor readings in the annotation gaps.
Sleeping Bed_To_Toilet
BinaryHex BinaryHex
00000000000000000000000000000000010x000000001Unknown 00000000000000000000101111101000000x000002FA0Unknown
00000000000000000000101001001011010x00000292D 00000000000000000000000000000000010x000000001
00000000000000000000000000000000010x000000001 Sleeping
00000000000000000000101001001011010x00000292D
00000000000000000000101001001011010x00000292D Bed_To_Toilet
00000000000000000000000000000000010x000000001 00000000000000000000101111101000000x000002FA0Unknown
Bed_To_Toilet 00000000000000000000000000000000010x000000001
Sleeping
Sleeping
00000000000000000000000000000000010x000000001Unknown Bed_To_Toilet
00000000000000000000101001001011010x00000292D 00000000000000000000000000000000010x000000001Unknown
00000000000000000000000000000000010x000000001 00000000000000000000101111101000000x000002FA0
Bed_To_Toilet 00000000000000000000101111101000000x000002FA0
Sleeping
Sleeping
00000000000000000000000000000000010x000000001Unknown Bed_To_Toilet
00000000000000000000000000000000010x000000001 00000000000000000000110100010110010x000003459Unknown
00000000000000000000000000000000010x000000001 00000000000000000000110100010110010x000003459
00000000000000000000101001001011010x00000292D Sleeping
00000000000000000000000000000000010x000000001
00000000000000000000101111101000000x000002FA0 Bed_To_Toilet
Bed_To_Toilet 00000000000000000000110100010110010x000003459Unknown
00000000000000000000000000000000010x000000001
Sleeping Sleeping
00000000000000000000101001001011010x00000292DUnknown
00000000000000000000101001001011010x00000292D Bed_To_Toilet
00000000000000000000000000000000010x000000001 00000000000000000000000000000000010x000000001Unknown
00000000000000000000000000000000010x000000001 00000000000000000000000000000000010x000000001
00000000000000000000000000000000010x000000001 00000000000000000000110100010110010x000003459
00000000000000000000000000000000010x000000001 00000000000000000000000000000000010x000000001
Bed_To_Toilet Sleeping
Table 2. Exemplar codes of sensor readings. Thirty-one bits are assigned by motion sensors, and three bits by door-closure sensors.
Motion SensorDoor
0000000000000000000001100000000 010
0000000000000000000001000000000 110
0001001000000000000000000000000 001
0001000000000000000000000000000 111
0001001000000000000000000000000 000
0001101000000000000000000000000 000
0000101000000000000000000000000 010
0000111000000000000000000000000 110
0000111100000000000000000000000 000

