1. Introduction
With the increasingly fierce market competition and the diversified demand of customers, the traditional large-scale lot production mode of manufacturing industry has been gradually replaced by production modes such as multi-variety and small-quantity. The decrease of production batches leads to frequent changeover operations during the production process, which affects the overall performance of the production system.
As an important link in the production process, changeover refers to the process of converting machines in a production line from producing one kind of product to another, involving complex knowledge processing operations such as programming, debugging and inspection. Reference [
1] suggests that the changeover time has significant impacts on productivity, lead time, work-in-process inventory and quality. Therefore, it is necessary to improve the level of quick changeover.
Because the changeover process involves a lot of complicated manual work, it cannot be completely replaced by artificial intelligence and automation equipment; it still needs to rely on a high-quality production team. In addition, the changeover task is easy to decompose and suitable for operators to complete through cooperation, so the changeover operation requires a high degree of human–machine collaboration and human–human collaboration. On account of the cost of skill training, the skills possessed by operators are usually complementary [
2], and the cooperative changeover method is often used as a way to shorten the changeover time and balance the workload. However, frequent cooperative line-changing would affect the work of too many workers. Therefore, cooperative changeover could not improve the performance of production systems in all scenarios. Additionally, the effectiveness of cooperative changeover depends on the production scenario and the degree of cooperation. For example, with the same cooperative changeover mode, the effect in a production scenario where new products are introduced frequently will certainly differ from the effect in a production scenario where mature products are mass-produced. Starting from this problem, this paper divides cooperative changeover into four modes according to the degree of cooperation: non-cooperation, cooperation for mature products, cooperation for new products and total cooperation. The effects of different cooperative changeover modes on the production system are then studied in various production scenarios. The purpose of this research is to offer managers some quantitative suggestions, so that they can decide which cooperative changeover mode should be adopted in a certain production scenario.
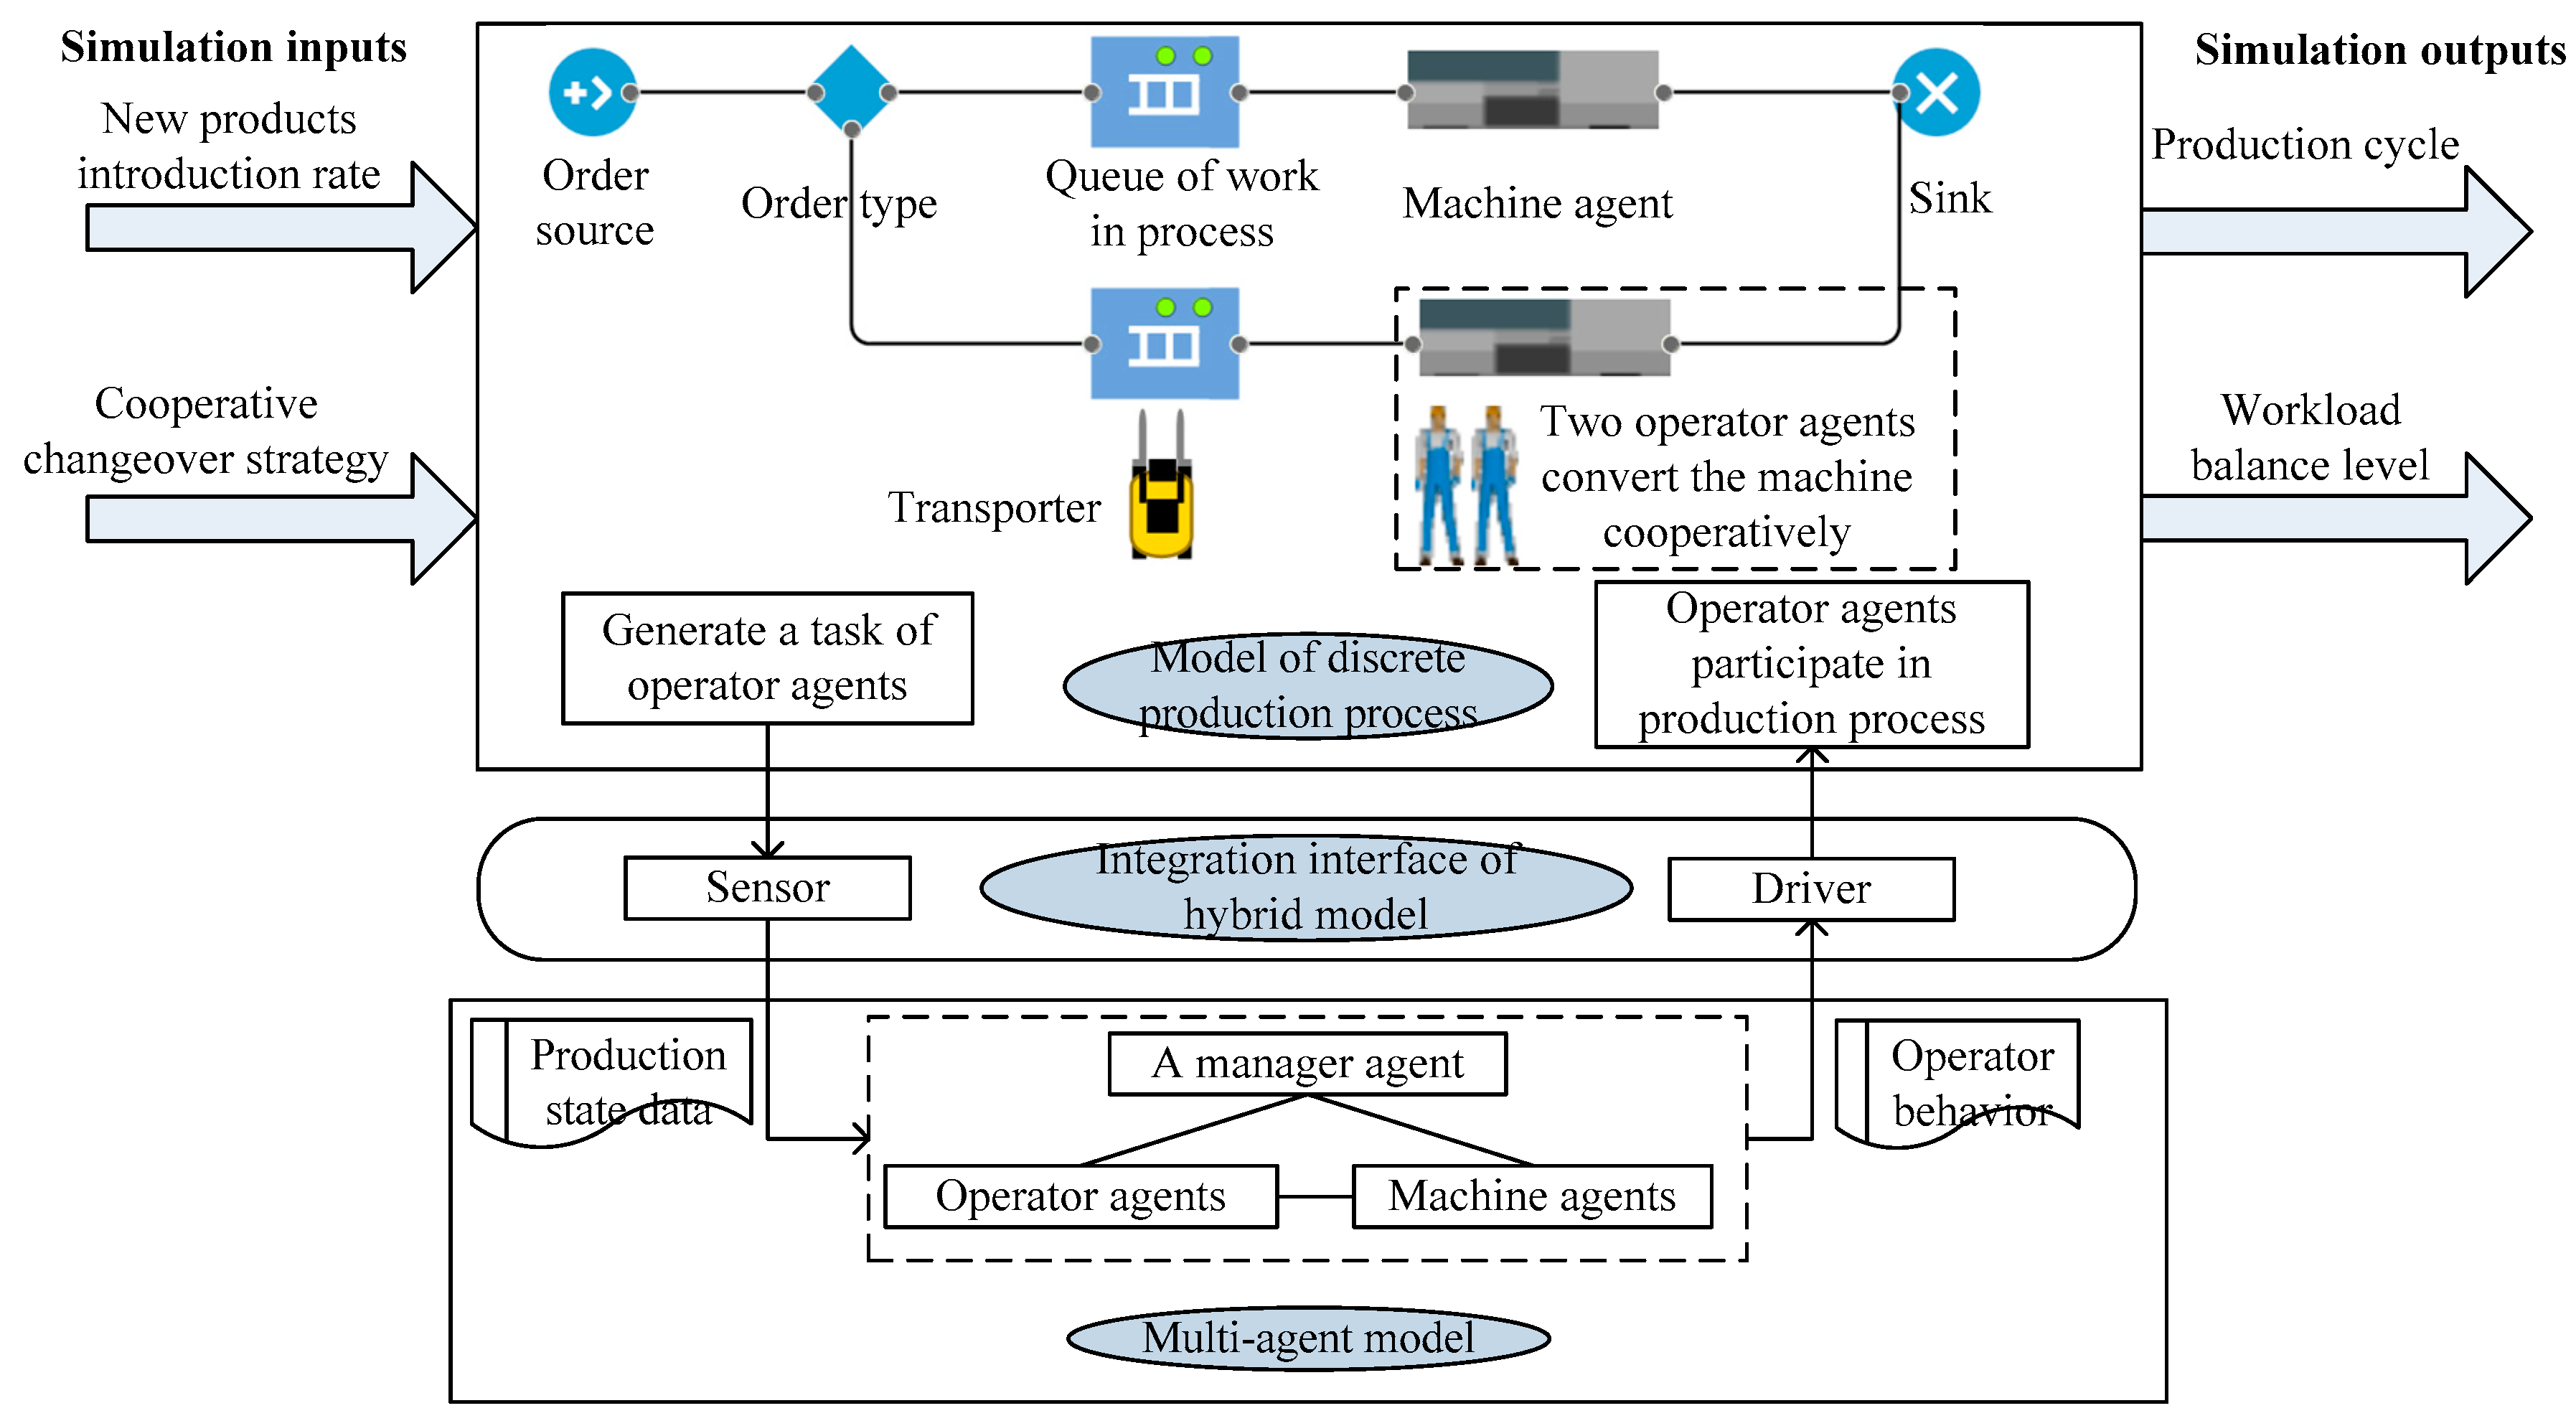
In addition, the method used to conduct research is another important problem. Given that the production process contains a large number of stochastic, discrete events and nonlinear relationships, and operators are active and collaborative, simulation is considered to be the most effective research method. To describe the operators with autonomy and cooperativity in the production system, it is suitable to use the Agent-Based Simulation (ABS) method [
3]. The production team can be constructed into a multi-agent system by the ABS method, describing the cooperative changeover behavior of operators [
4]. On the other hand, the whole production process has the characteristics of discrete-event system [
5], therefore a single ABS modeling method is not suitable for describing the entire production process. Considering these two factors, this paper proposes a hybrid modeling method consisting of multi-agent systems and discrete events.
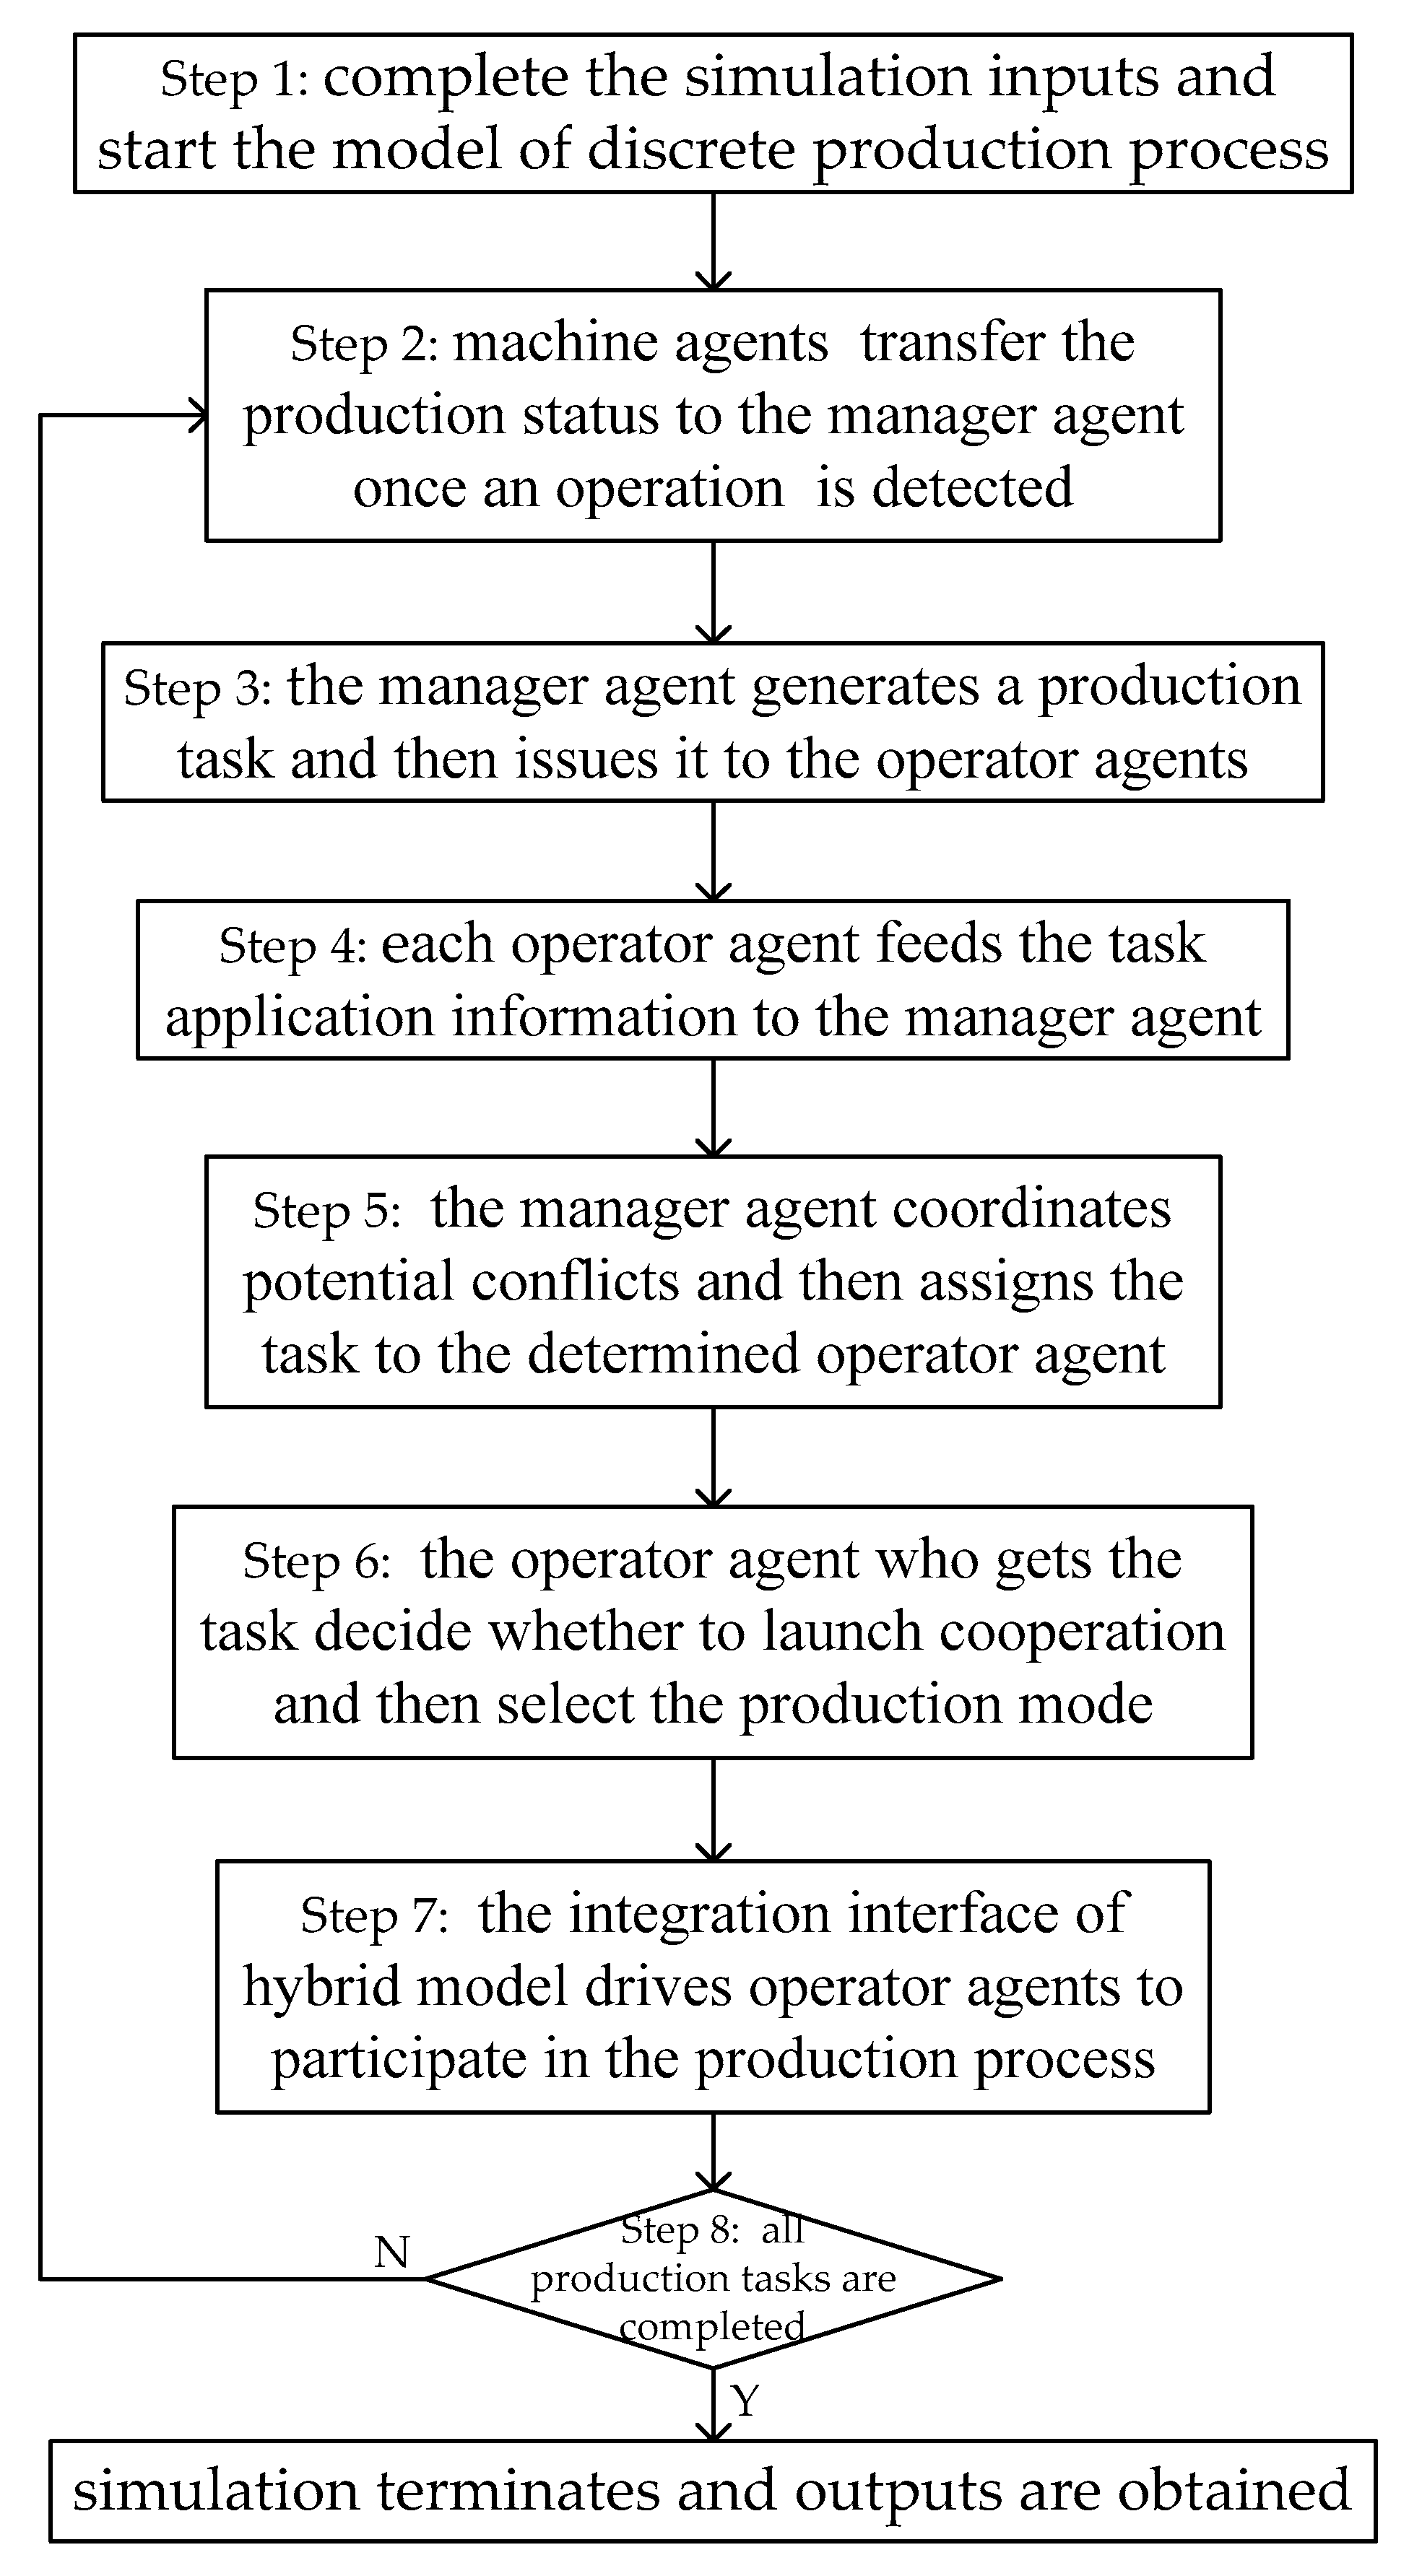
To sum up, this study is done for the purpose of solving two problems: (1) how to construct a hybrid simulation model of a production system to support the simulation study of different cooperative changeover strategies in various scenarios and (2) in a certain production scenario, what kind of cooperative changeover mode is more suitable.
2. Related Work
In collaborative systems where at least a portion of tasks for a job can be performed simultaneously, worker cooperation may help increase the average task speed or labor productivity. Therefore, the cooperative behavior is often used as an organizational driver to improve the performance of production systems. Qin et al. [
6] have regarded cooperation as a kind of worker flexibility which can increase the adaptability of production systems in fluctuating production environments by improving quality and motivation, as well as reducing productivity loss and work fatigue. Yauch [
7] has pointed out that cooperation can help teams generate new ideas and insights, and is one of the team attributes needed to promote agile manufacturing. Therefore, the cooperative changeover can improve system performance through flexibility, agility, etc., especially for the multi-variety and small-quantity manufacturing environment. In addition, some empirical studies of manufacturing companies have also demonstrated the positive impact of cooperation on system performance. Zhang et al. [
8] have conducted empirical research on 317 firms and have found that cross-functional cooperation within a plant significantly contributes to the mass customization capability. According to the coopetition theory, Liu et al. [
9] have conducted empirical research on 26 high-tech companies and have found it is crucial for managers to motivate cooperation when hyper competition emerged given that cooperation helps turn the harm of competition to the benefit.
The current research on the worker assignment with cooperative mode is mainly implemented by constructing a mathematical model, which is solved by using mathematical programming or optimization approaches. Buzacott [
10] have used queueing models to analyze the performance of cooperative teams and have found that the mean job completion time is shorter for teams than for individuals. Wang et al. [
11] have proposed a worker assignment model with flexibility and cooperation, which was solved by the improved NSGAII algorithm. The results show that the cooperative model is superior to the non-cooperative one in terms of makespan and maximum worker load by focusing productivity on bottlenecks. Kuo and Liu [
12] have dealt with an operator assignment problem, in which inter-cell manpower transfer was taken into consideration, solved by a two-phase methodology. The empirical results show that there is an opportunity to save manpower when inter-cell manpower transfer is allowed. Celano et al. [
13] have proposed a worker assignment model of assembly U-lines of which the objective was to minimize the total conveyor stoppage time. When a worker was not able to complete an operation, help from frontal and downstream workers was allowed and several help policies between workers were proposed. The genetic algorithm was used to solve the model, and the results could guide managers to adopt what strategies with different workstation lengths and walking speeds. In these mathematical models, operators are considered as production resources, and cooperation among operators is regarded as a multi-resource scheduling problem. This type of modeling ignores the autonomy and cooperative behavior among operators, so it is difficult to reflect the actual cooperative process.
The discrete-event simulation method is another important method to analyze the manufacturing process. This method can construct a production process model based on the information, such as product process routes and the facility layout, and describe the randomness and discrete events in the process accurately and conveniently. Bokhorst et al. [
14] have proposed two cooperation modes in production cell: Load-oriented Cooperation and Resource-oriented Cooperation. The discrete-event modeling method was used to analyze the impacts of the two cooperation modes on system performance. The main experimental conclusion is that the maximum effect of load-oriented cooperation is higher than that of resource-oriented cooperation. Yue et al. [
15] have used the discrete-event modeling method to build a simulation model of workshop with double resource constraints. Considering the learning and forgetting effect of workers, they have studied the effects of the multi-functionality level, the pattern of skill overlaps and the distribution of skills on production efficiency at different product life cycles. Nembhard and Prichont [
16] have used the discrete-event modeling method to study the impacts of different cross-training levels on production efficiency at different rotation intervals. Simulation results show that shorter intervals perform better overall, and the combination of high multi-functionality with long rotation intervals provides the lowest productivity. However, the production system model constructed by the discrete-event simulation method is unable to reflect the characteristics of the initiative and cooperation of operators, resulting in a large error of the model [
17].
The agent-based modeling method is good at describing the individual-level behavior and strategies, and has been rapidly developed and widely used in manufacturing these years [
18]. Wang et al. [
19] have proposed a framework for smart factories, which constructed physical resources such as machines, products and transportation equipment into agents, and have provided a negotiation mechanism for multi-agent systems. Four proposed strategies, which can avoid the deadlock problem, have been combined and used in simulation experiments and have effectively improved the production efficiency. Xiang and Lee [
20] have put forward a multi-agent production system consisting of order agents, job agents, machine agents, work center agents, etc., and have combined an ant colony intelligence with coordination mechanisms of agents to optimize production scheduling. The experimental results show that the proposed adaptive mechanism is better than the rule-based mechanism in many measurements. From the above researches, it can be found that it is difficult to clearly describe the temporal sequence and overall logic of the production process by simply using multi-agent systems to simulate production systems.
Therefore, some scholars have made some useful explorations in combining these two modeling methods to simulate a collaborative system. Qiu et al. [
21] have used the hybrid modeling method to simulate the cooperative maintenance behavior of the workers in production cells. The results indicate that the failure time of machines generated by adopting the cooperative maintenance strategy is shorter than that of the independent maintenance strategy. Zhang et al. [
22] have constructed a human–machine integrated model of manufacturing cells using the hybrid modeling method, and have compared different methods of organizational division of labor in the changeover process. The results indicate that adopting the independent changeover and the cooperative changeover together has better performance than only adopting the specialized changeover or the independent changeover in terms of workload balance and system stability. Liraviasl et al. [
23] have proposed a framework for reconfigurable manufacturing systems, based on the hybrid modeling method, which allows flexible modeling of any new production scenario or system layout. In addition, each agent can work with other agents according to the specific rules, which are modifiable when the manufacturing system is facing changes in production requirements. Ferjani et al. [
24] have used the hybrid modeling method to construct the simulation model of the demand fluctuation manufacturing system and have integrated the fatigue model in operator agents. Then the effects of the number of operators and the number of operators' skills on production efficiency and operator fatigue levels have been studied. The results indicate that increasing the number of operators' skills can shorten the average production time, and the fatigue level of the operator is the lowest when both the number of personnel and the number of skills are the highest.
According to the literature reviews, we can see that multi-agent systems can reflect the initiative, autonomy and cooperativity of operators. Additionally, the production process described by using discrete-event modeling method can reflect the temporal sequence and integrity of the production process. Considering the research objective of this paper, we will use the hybrid modeling method to study the cooperative changeover behavior of a production team.
4. Changeover Behavior of Operator Agents
4.1. Time Consumption of the Changeover Operation
To improve the efficiency for operators to conduct the changeover operation cooperatively, the changeover tasks are divided into multiple subtasks according to their process characteristics. Then two operators can be reasonably assigned according to the operational characteristics of the subtasks. There are two ways to assign subtasks. The first one is to distribute the subtasks to the two operators with approximately equal workload and both operators will perform their subtasks independently. In this way, serial workflows can be transformed into parallel workflows. The second one is letting two operators work together to complete subtasks. For changeover tasks, these two ways need to be combined. The calculation equations of time consumption for conducting changeover operation independently and cooperatively are respectively introduced as follows.
The phases in the first way to assign subtasks are defined as the parallel production phases, and the phases in the second way are defined as the interactive production phases. It is assumed that a changeover task has parallel production phases and interactive production phases.
Equation (2) describes the time consumption generated by operator and operator to complete the changeover operation cooperatively. In the equation, represents the time consumption for the operator to independently complete the first part of the subtasks of the i-th parallel production phase; represents the time consumption for the operator to independently complete the second part of the subtasks of the i-th parallel production phase; represents the time consumption for the operator and operator to complete subtasks of the j-th interactive production phase together.
Equation (3) describes the time consumption generated by operator to complete the changeover operation independently. In the formula, the two-part subtasks of parallel production phases are completed serially by the operator , and represents the time consumption for the operator to complete subtasks of the j-th interactive production phase independently.
With Equations (2) and (3), the time consumption of the changeover operation during simulation can be calculated.
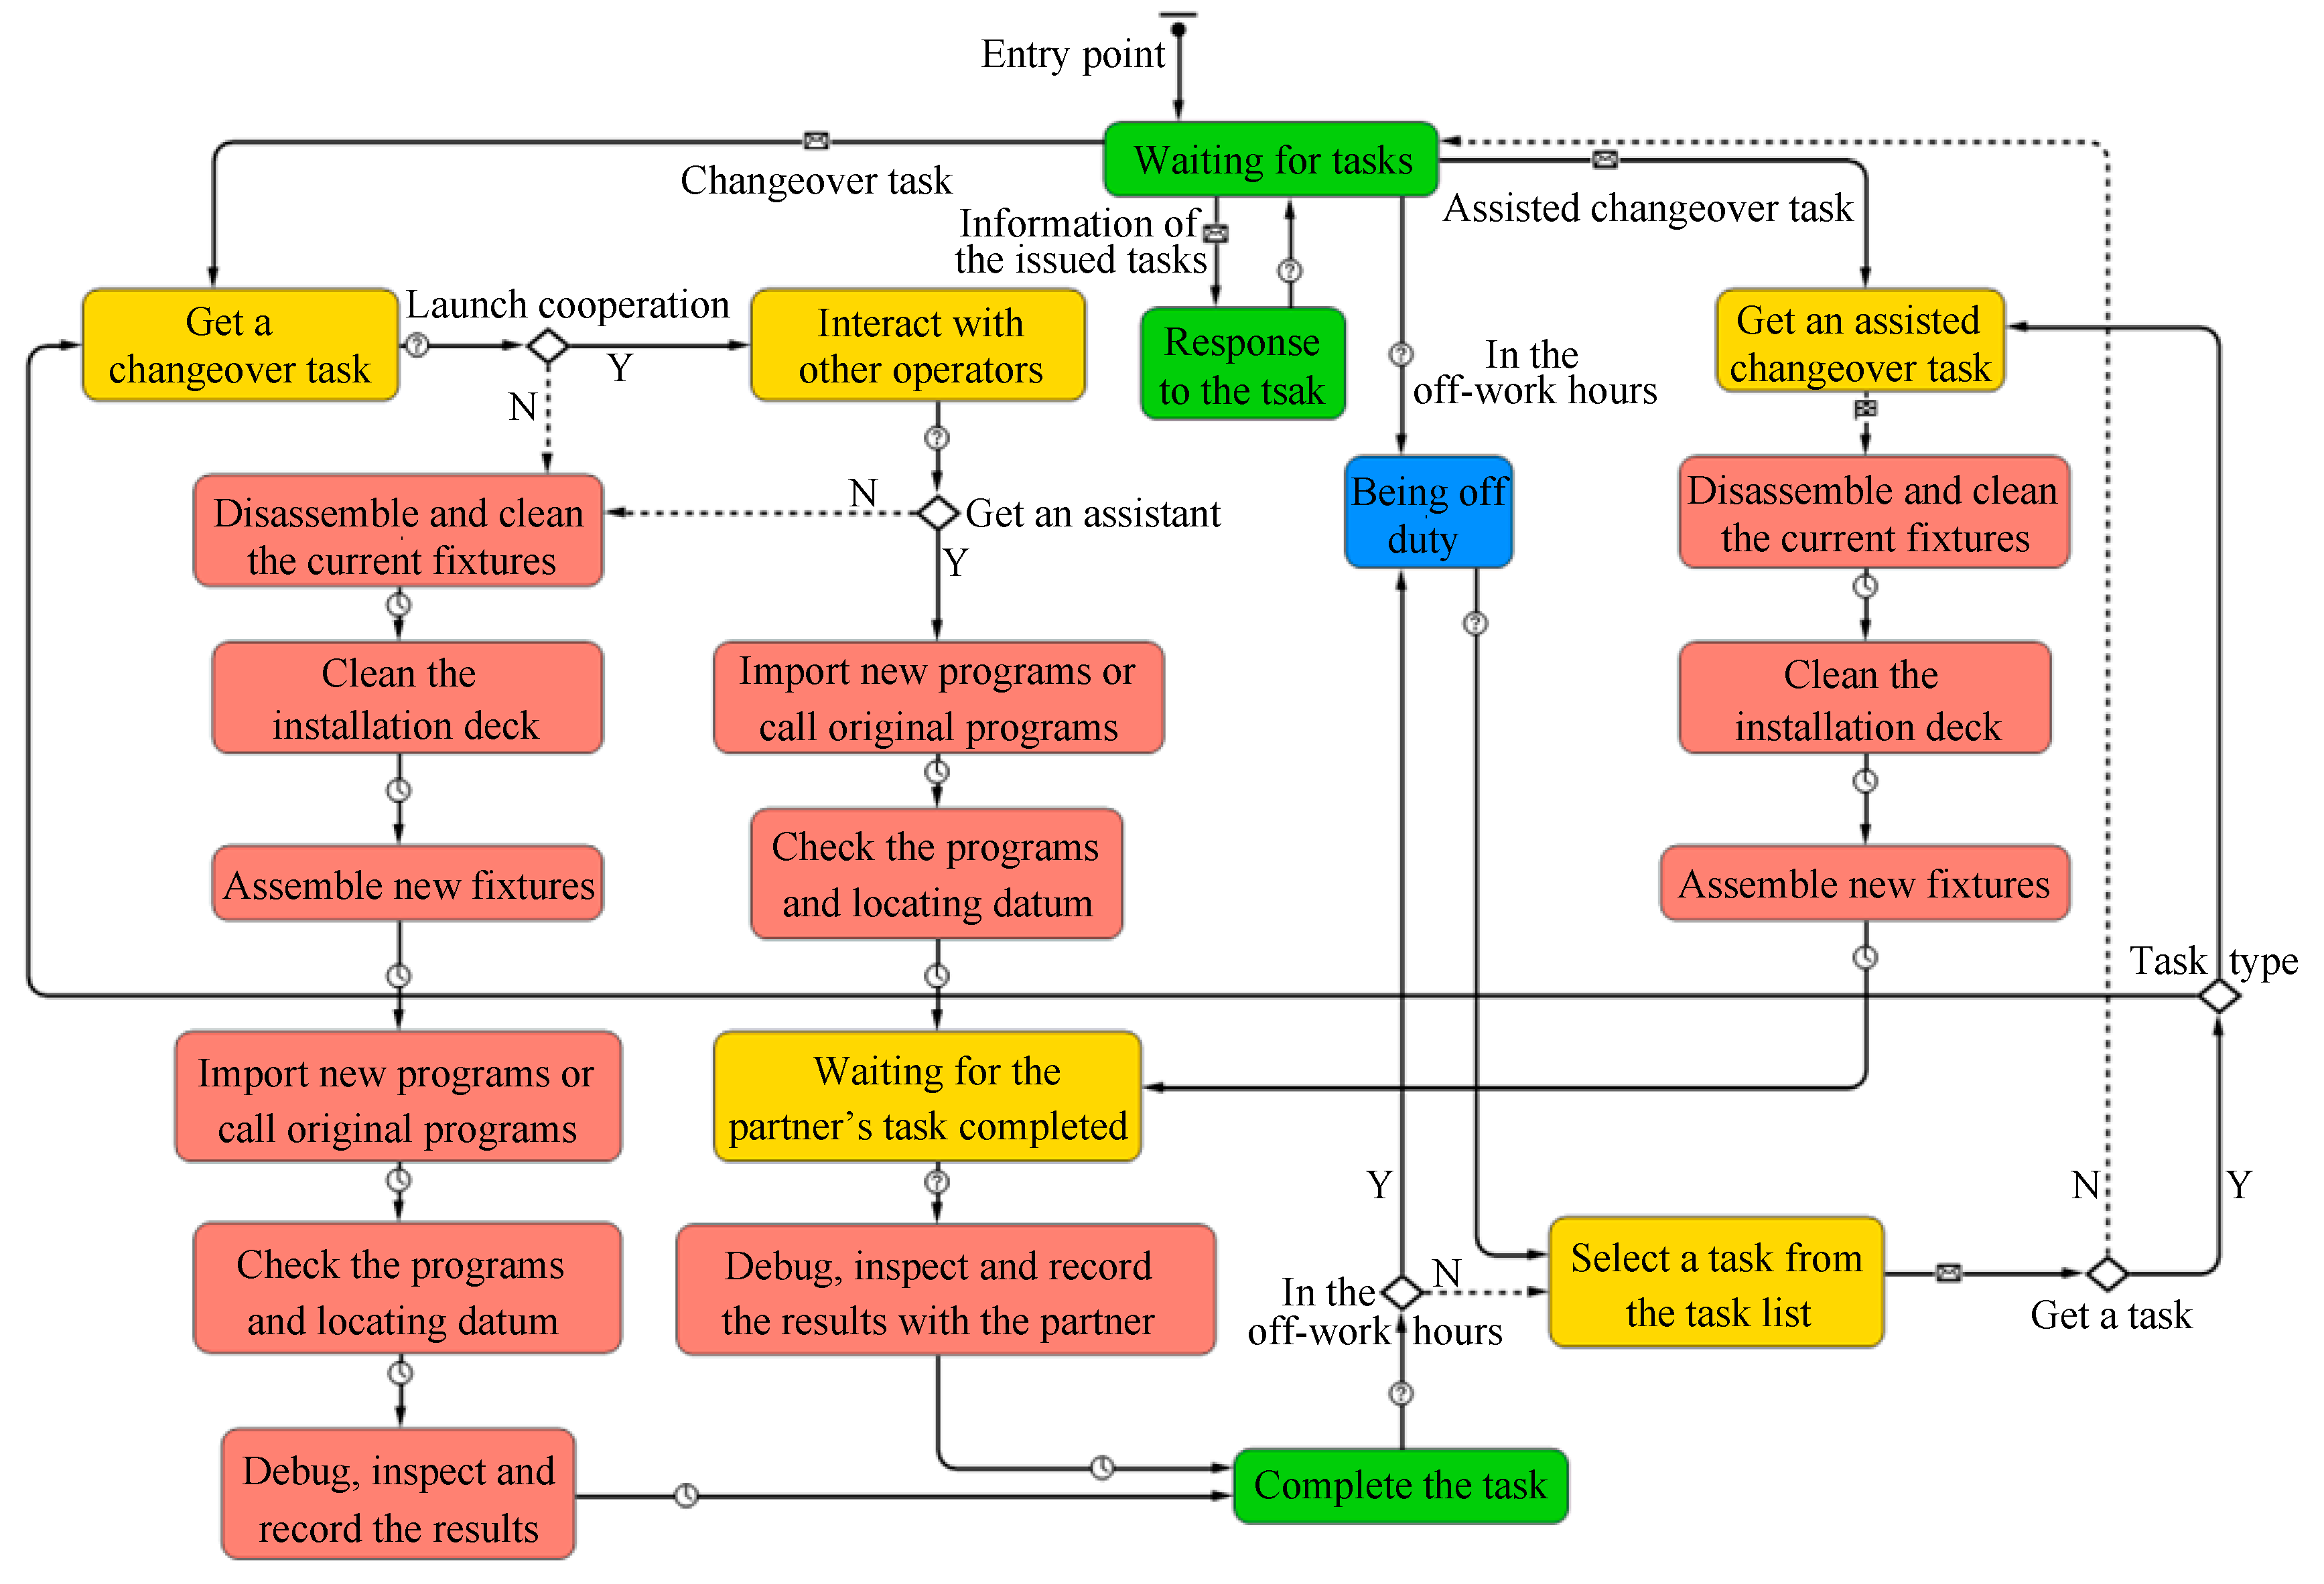
4.2. State Chart of Operator Agents
The state chart is used to describe the autonomous and collaborative behavior of operator agents during the changeover process. The state chart of operator agents’ changeover behavior according to the process of the changeover operation is shown in
Figure 3. The figure shows that a changeover task can be divided into a parallel production phase and an interactive production phase. In the parallel production phase,
includes importing new programs or calling original programs, checking programs and checking the locating datum;
includes disassembling and cleaning the current fixtures, cleaning the installation deck and assembling new fixtures. In the interactive production phase,
includes debugging, inspecting and recording the results. It is assumed that the information transfer between agents is instantaneous in this model.
The entry point of state chart is the “waiting for tasks” state. After receiving information of the issued tasks from publishers, the operator is transited to the “response to the task” state. The publishers of changeover tasks are managers, while the assisted changeover tasks are published by operators. If the operator master the skills required for the task, the “Agree” message will be fed back to the publisher from the operator, otherwise the feedback message is “Reject”. Then the operator is transited to the “waiting for tasks” state.
The publisher should make a judgment after all the feedback messages are collected. If there is more than one “Agree” feedback message, the task assignment will be completed according to the conflict coordination mechanism, and the “task confirmation” message will be sent to the selected operator; if all the feedback messages are “Reject”, the type of the task will be judged next. If the task is a changeover task, it will be added to the task list by the manager; if the task is an assisted changeover task, the operator as the publisher will conduct the changeover operation directly and independently.
The selected operator will get the task and move to a new state according to the task’s type once the “task confirmation” message is received from the publisher.
Taking the changeover task as an example, the operator will decide whether to launch cooperation with the operators in the “waiting for tasks” state according to the cooperative changeover strategy and production status information. (1) If the operator who has launched cooperation gets an assistant, then the operator as the initiator will begin to perform the subtask and the operator as the assistant will get an assisted changeover task and begin to perform the subtask . Once both the subtasks have been completed, the two operators start to perform the subtask together. As the whole task is completed, both the operators enter the “complete the task” state. (2) If the operator cannot get any assistant or there is no need to launch cooperation at all, the operator will begin to perform all the subtasks independently. As the task is completed, the operator enters the “complete the task” state.
If there are any tasks in the task list that the operator masters the required skills, the operator will select a task according his or her preference.
The operator in the “complete the task” state needs to check whether the current moment is in the off-work hours. (1) If “No”, the operator will select a task from the task list according to his or her skills and selection preference, and then submit the task application to the manager. (2) If “Yes”, the operator will be transited to the “being off duty” state at first, and not to the “select a task from the task list” state until the simulation clock runs to work time.
Whether the operator can get the task depends on the manager’s feedback. (1) If “Yes”, the operator is transited to a new state according to the task type. (2) If “No”, the operator is transited to the initial "waiting for tasks" state.
5. Case Study
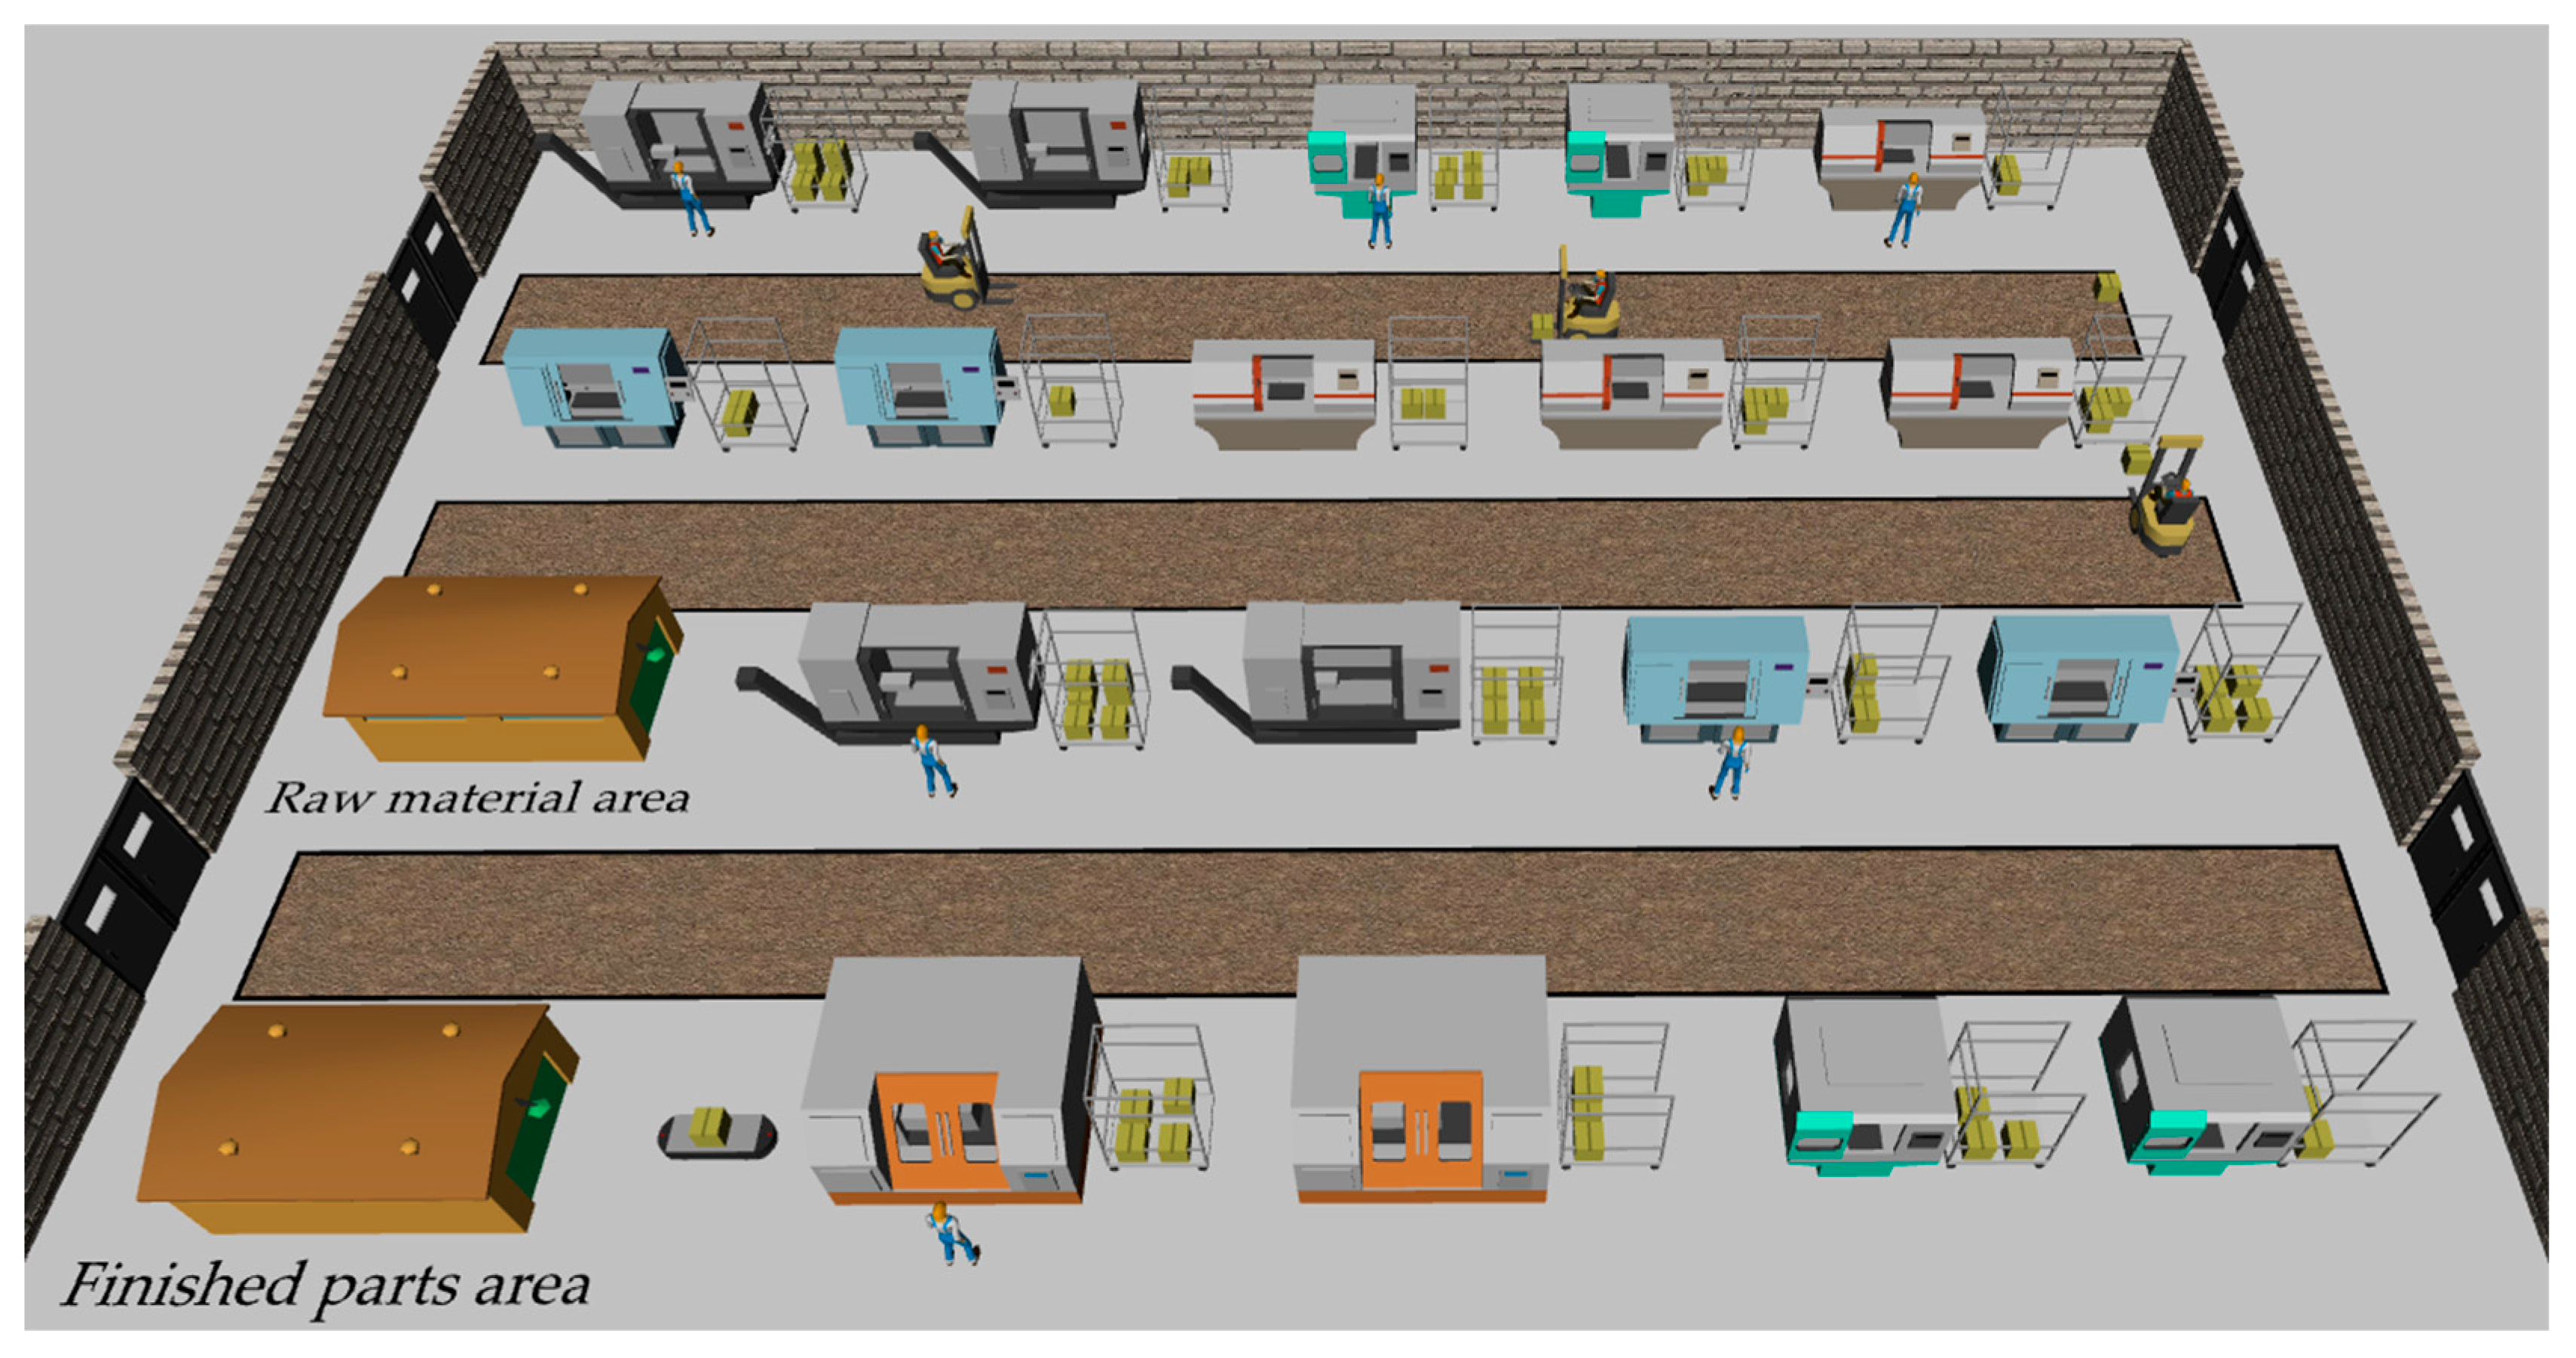
We apply the proposed hybrid simulation method to the study of cooperative changeover strategies of a certain production cell which adopts a multi-variety and small-quantity production mode. The production cell, where three types of parts denoted as TC (Transmission Case), EC1 (Engine Cylinder) and EC2 (Engine Case) are produced, is equipped with 18 numerical control machines denoted as M1 to M18, 6 operators denoted as O1 to O6, and automated transportation equipment. In response to market demand, new parts are often introduced into the cell.
Due to the frequent changeover operations and new parts introduction, changeover has become a bottleneck in the production process. Therefore, there is an urgent need to select suitable cooperative changeover strategies in manufacturing environments with different new parts introduction levels. To meet this need, the simulation model of the production cell is established using the hybrid modelling method proposed in this paper. Then the influence of the cooperative changeover strategies on the production cell is quantitatively studied with new parts introduction considered, thus helping the manager make the most effective decisions.
5.1. Basic Information of Production Cell
In this case, operators need to conduct the loading, unloading, and changeover operations during the production process. (1) When a machine is idle and there is at least one part to be machined in its queue, the first part needs to be loaded before machining. (2) Every part needs to be unloaded after machining. (3) When converting a line from running one type of parts to another, changeover operations of machines need to be conducted. The loading and unloading time of parts and changeover time of machines are both subject to normal distributions, and the machining time is constant. The loading and unloading skills for the same type of machines are universal, but the changeover skills for machines are related to the process characteristics of the parts. The assumptions and rules in the simulation model are shown in
Table 1.
Table 1 shows that parts of types TC and EC1 can be processed simultaneously, while parts of EC2 can only be processed separately due to machine constraints in the process route. The simulation software Anylogic 7.1.2 is selected to build the hybrid model of the production cell. The secondary development such as the cooperative changeover behavior of operator agents is programmed in Java language. The 3D view of the model developed is shown in
Figure 4.
Table 2 shows the personnel skills configuration of the production cell. Each operator has two loading and unloading skills with different skill levels and two assisted changeover skills with different skill levels. Additionally, Operators O2, O3 and O5 have the whole changeovers skills for specific machines. An operator with the required assisted changeover skill can conduct the line-changing operation for a machine cooperatively with another operator who has the required whole changeover skill, but cannot conduct the changeover operation for the machine separately. In
Table 2, LN
Sx(d
1) denotes the level d
1 for the Sx-class skill of loading and unloading, W
My(d
2) denotes the level d
2 for the whole changeover skill of machine My, and A
Mz(d
3) denotes the level d
3 for the assisted changeover skill of machine Mz.
Table 3 shows the distributions of time taken by operators with Skill Level 5 to complete changeover subtasks of six machines. The first set of data in each table cell consists of the mean value and standard deviation of the time required for the subtasks of mature parts, and the second one is for the subtasks of new parts. The skill level is gradually increased from 1 to 9, and the difference of mean value between adjacent levels is 5% and the difference of standard deviation is 2%. Because the operators do not have enough experience in the tasks of the new parts, the time consumption of the new parts tasks is significantly higher than that of the mature parts tasks, especially for the changeover tasks, which are closely related to the production process of parts.
Table 4 shows the distributions of time taken by operators with assistants of different skill levels to complete subtask
of six machines.
5.2. Experimental Schemes
28 historical orders of the production cell are taken to form an order sequence. Four different new parts introduction rates of 0, 25%, 50% and 75% are set, which respectively represent four production scenarios: (1) only producing mature products, (2) small-scale introduction of new products, (3) middle-scale introduction of new products, and (4) large-scale introduction of new products.
To analyze the impact of different cooperative changeover strategies on evaluation indicators of the production cell in different production scenarios, we combine four cooperative changeover strategies and four production scenarios to obtain 16 experimental schemes of E1 to E16, as shown in
Table 5. According to the descriptions of the four kinds of cooperative changeover strategies, E1 is the same as E9, and E5 is the same as E13. The simulation outputs are statistically analyzed after running each simulation experiment 20 times.
5.3. Results and Discussion
5.3.1. Workload Balance Level
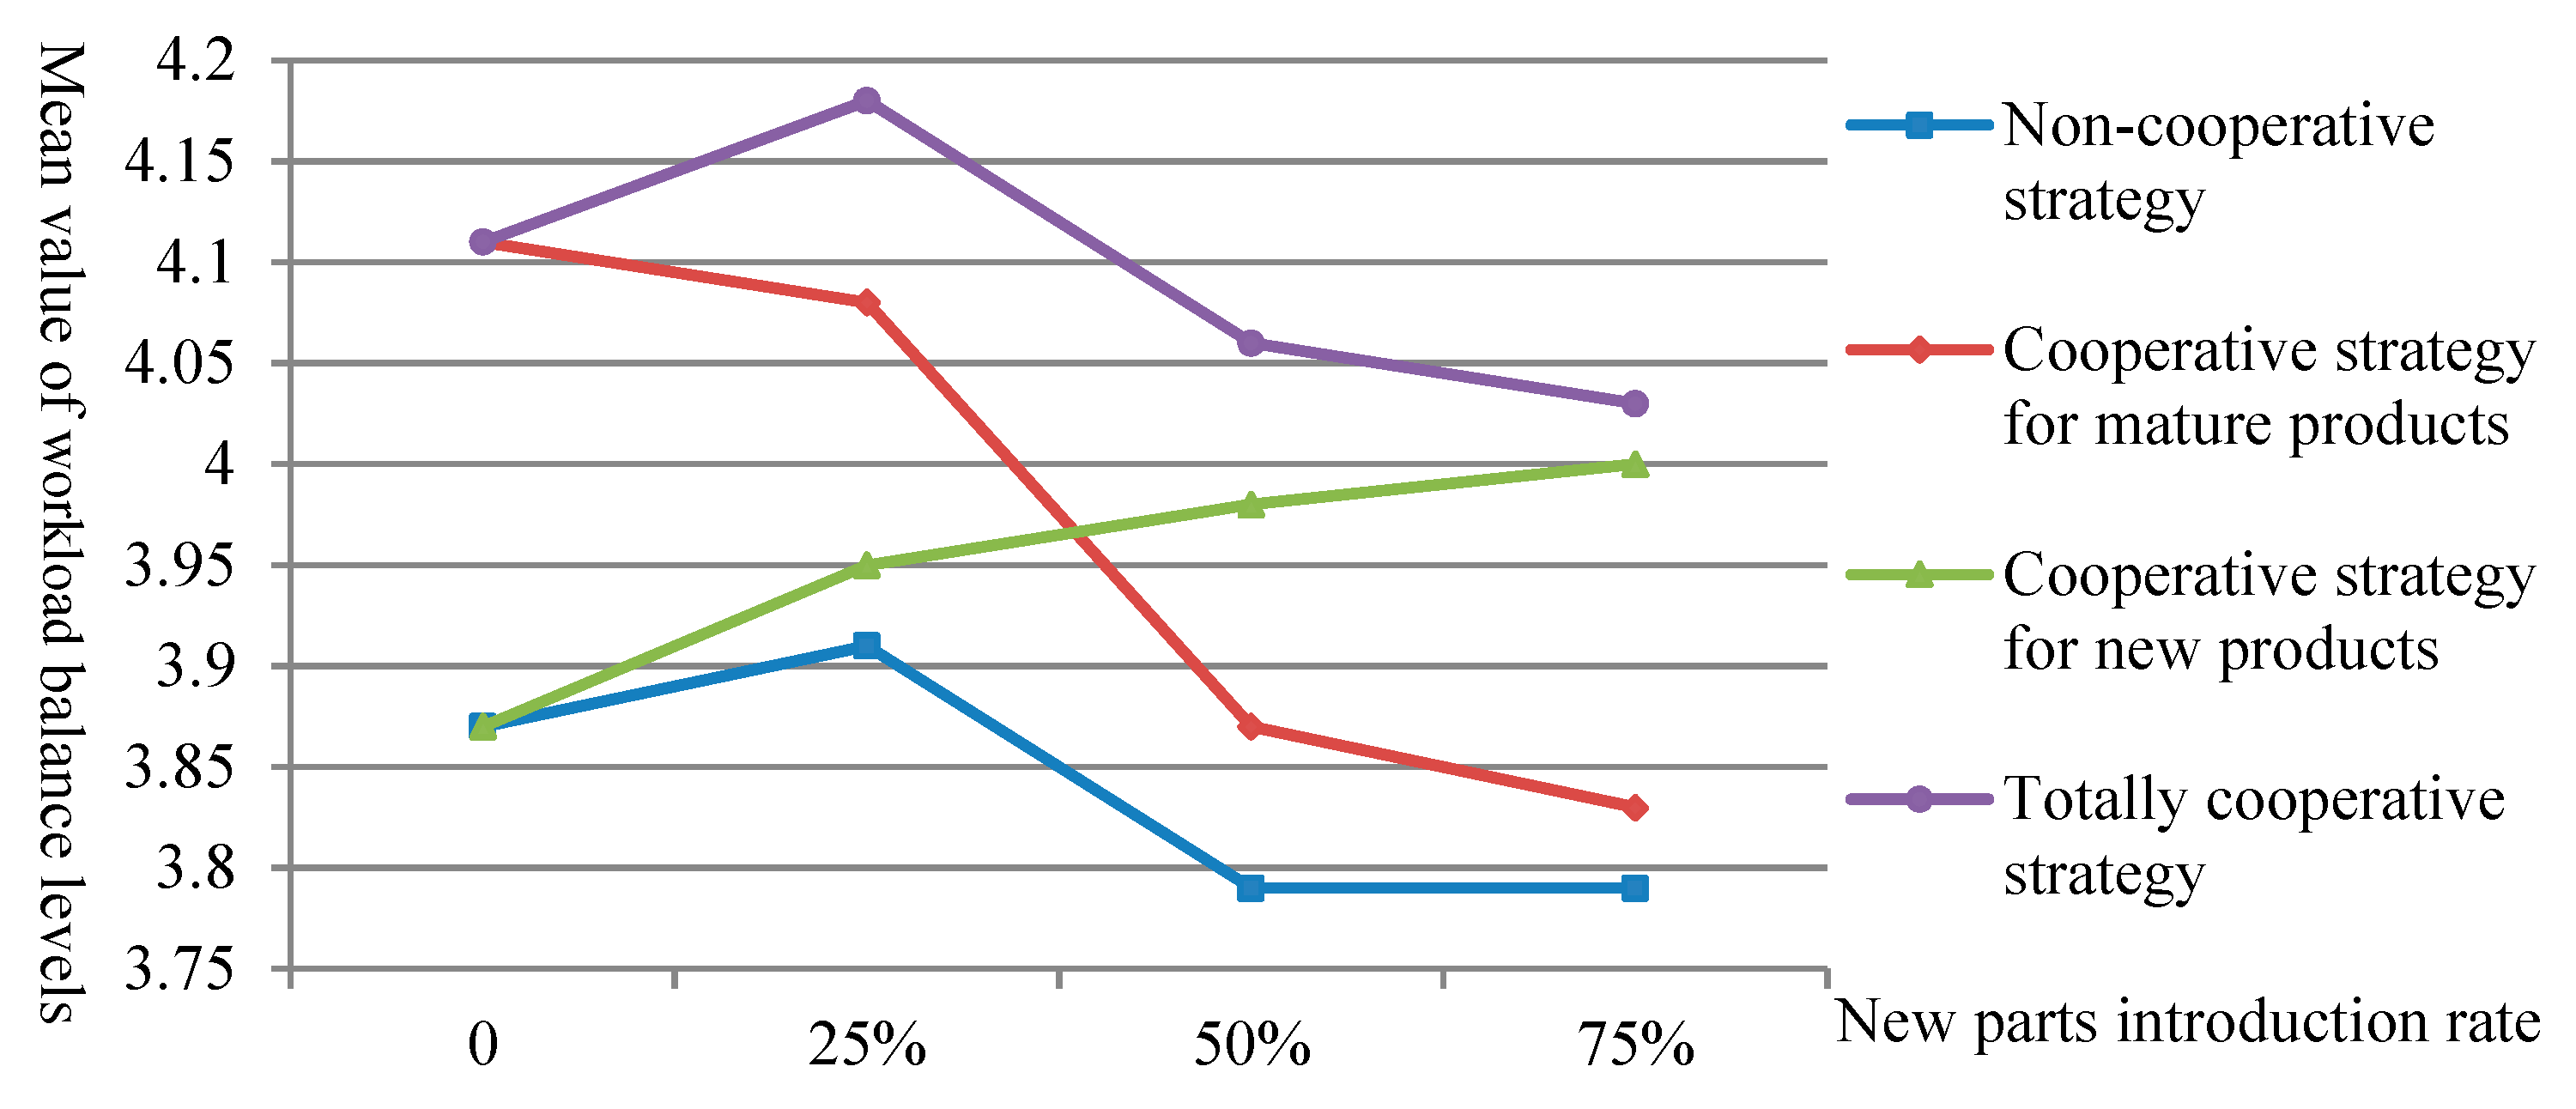
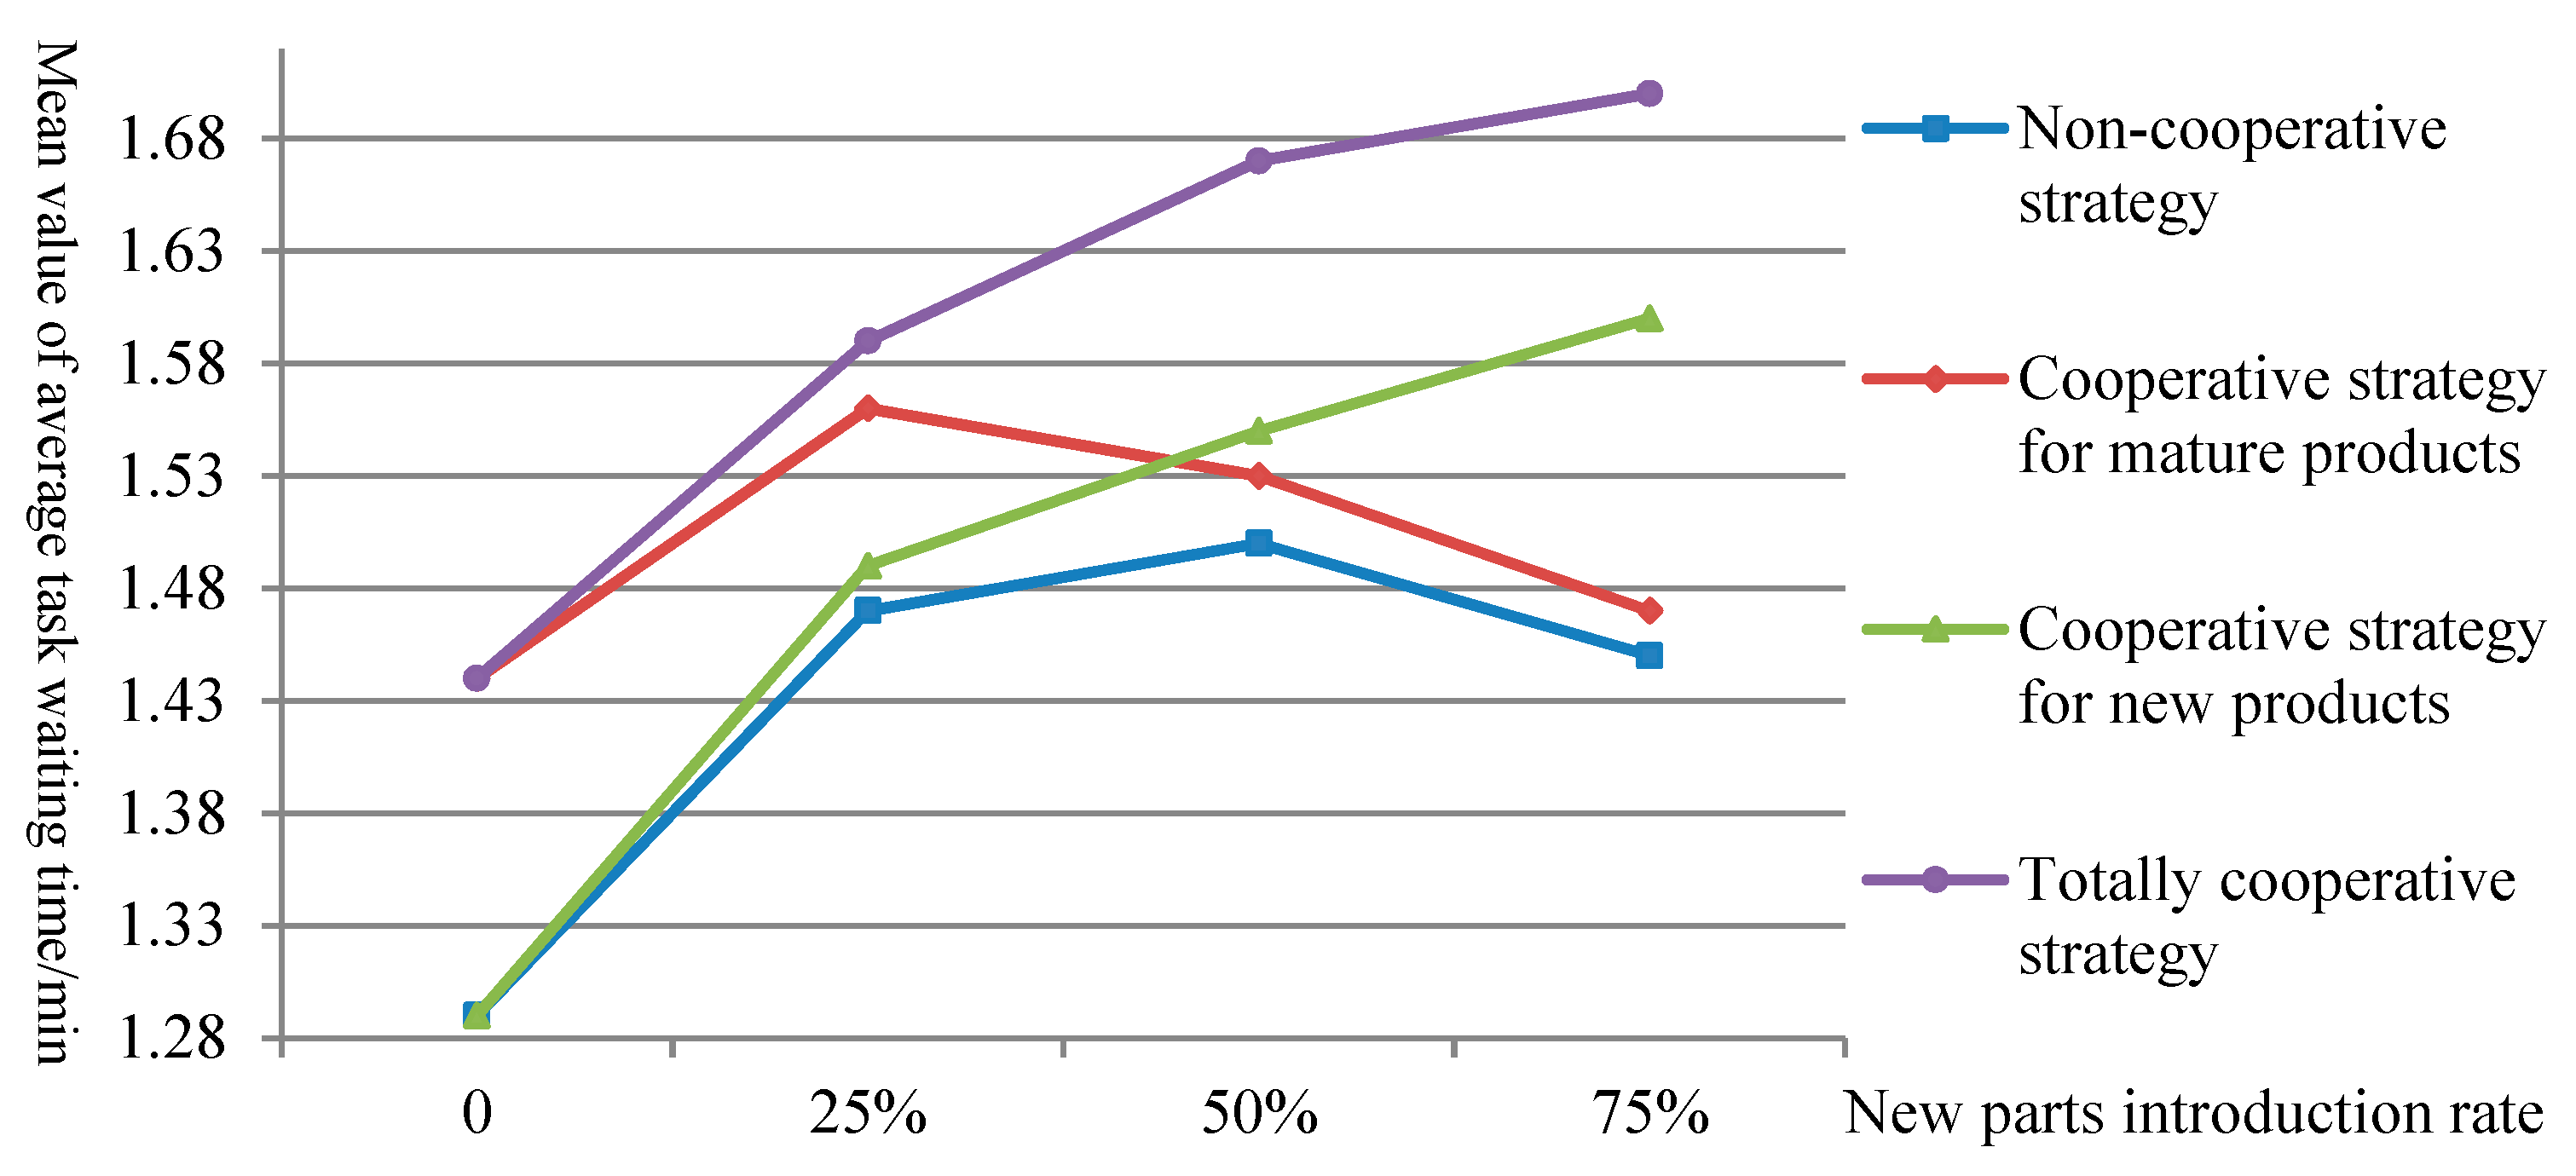
The mean values of workload balance levels obtained by adopting four strategies in four production scenarios are shown in
Figure 5. It can be seen that the non-cooperative strategy has the lowest workload balance level in all production scenarios, while the totally cooperative strategy has the highest one. In addition, the relationship between workload balance level and new parts introduction rate is negative when using the cooperative strategy for mature products and positive when using the cooperative strategy for new products.
To analyze the reasons for the above results, the average cooperation rates of the changeover tasks under different conditions are calculated, as shown in
Table 6. The Pearson correlation analysis is then implemented to obtain the correlation between the average cooperation rate of changeover tasks and the workload balance level in each production scenario, as shown in
Table 7. The analysis results show that in the four production scenarios, the cooperation rate of the changeover tasks and the workload balance level are significantly positively correlated, which means the cooperative changeover is an effective way to balance the workload. Therefore, the degree of preference for cooperation by changeover strategies determines the level of workload balance. Because the preference degree for cooperation by the cooperative strategy for mature products or by the cooperative strategy for new products is greatly affected by the new parts introduction rate, the workload balance level presents monotony.
5.3.2. Production Cycle
The mean values of production cycles under different conditions are shown in
Table 8. It can be seen that when only producing mature products, the production cycle obtained by adopting the non-cooperative strategy is the shortest. With the increase of the new parts introduction rate, the shortest production cycle is obtained by adopting the cooperative strategy for new products, and the longest is obtained by adopting the non-cooperation strategy.
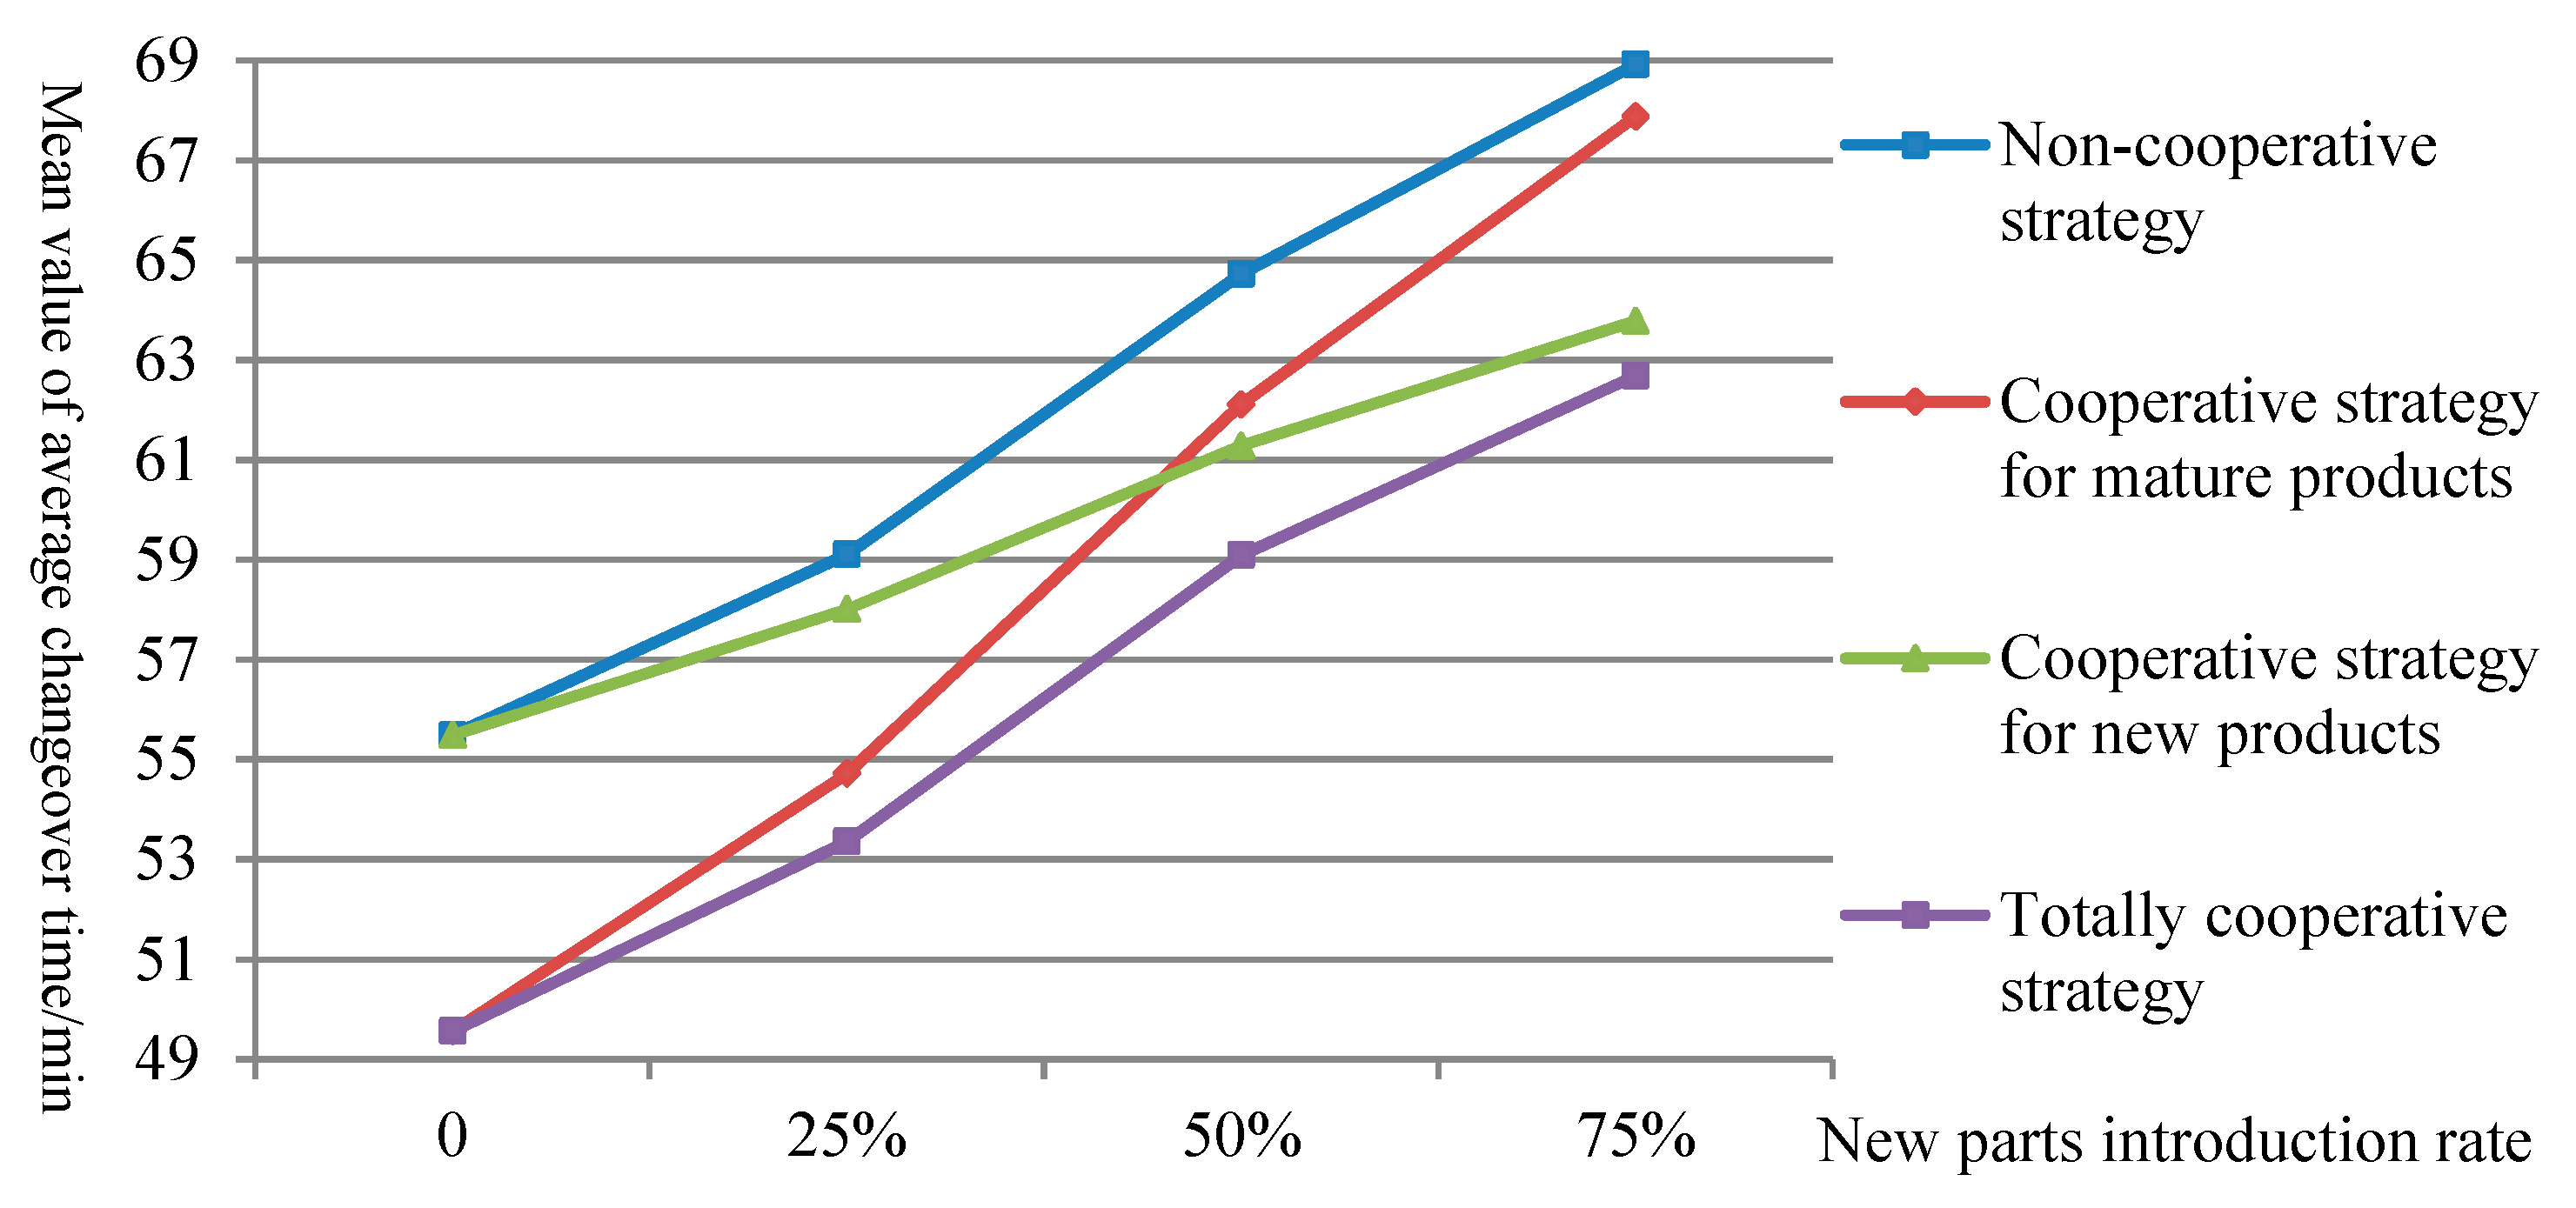
To further analyze the impact of the cooperative changeover strategy on the changeover process, the mean values of both average changeover time and average waiting time for loading and unloading tasks during the changeover process under different conditions are compared. The results are shown in
Figure 6 and
Figure 7, respectively. Referring to the results in
Table 6, we can find that the cooperative mode can reduce the time consumption of the changeover task. At the same time, due to the addition of one operator in the line-changing tasks, the waiting time for other tasks during the changeover process is increased.
For the purpose of verifying whether there are significant differences in the mean values of production cycles by adopting different strategies in each production scenario, hypothesis test analysis is conducted using the experimental data in
Table 8. The results are shown in
Table 9, where
,
,
and
respectively denote the mean values of production cycles when adopting non-cooperative strategy, cooperative strategy for mature products, cooperative strategy for new products and totally cooperative strategy. In addition, the new parts introduction rate is r.
When Strategy A has a significant advantage over Strategy B, it can be considered that Strategy A is superior to Strategy B in a statistical sense. According to the test results, when only mature products can be produced, the production cycle obtained by adopting the non-cooperative strategy has a significant advantage; when the new products are introduced in small quantities, the production cycle obtained by adopting the cooperative strategy for new products has a significant advantage; when medium or large quantities are introduced, the production cycle, obtained by adopting the cooperative strategy for new products or the totally cooperative strategy, has a significant advantage.
5.3.3. General Discussion
The two sections above provide management advice for production systems that focus on a single indicator. For production systems that focus on the above two indicators, when only mature products can be produced, both the totally cooperative strategy and the non-cooperative strategy are satisfactory strategies. On the other hand, when new products are introduced in small quantities, the three strategies, except the cooperative strategy for mature products, are all satisfactory strategies. However, when new products are introduced in medium or large quantities, the totally cooperative strategy is the optimal one among the four strategies.
The experimental results show that the effectiveness of cooperative changeover is indeed related to the degree of cooperation and the new products introduction rate. According to the results of this study, the managers of production systems can choose the optimal or satisfactory cooperative strategy according to the production scenario and their objectives.
At present, the research on cooperative behavior of operators in production systems mainly adopts mathematical programming, optimization approaches, single discrete-event simulation, or single agent-based simulation. However, the production system models established by above research methods inappropriately simplify the actual production process, resulting in a large deviation in the experimental results. The hybrid modeling method proposed in this paper can solve this problem, and the effectiveness and practicability of the hybrid method are verified.
6. Conclusions
In the multi-variety and small-quantity manufacturing environment, changeover operation occurs frequently. The changeover time has a significant impact on productivity, lead time, work-in-process inventory and product quality. Cooperative changeover method is often used as an organizational driver to shorten the changeover time and balance the workload. To study the influence mechanism of cooperative changeover strategy on the performance of production system under different proportions of new product introduction, this paper introduces a hybrid modelling method consisting of multi-agent systems and discrete events to construct the simulation model of production system, proposes four kinds of cooperative changeover strategies, and describes the cooperative changeover behavior of operator agents in detail. The proposed simulation method is applied to a production cell where 16 experimental schemes obtained by combining four strategies and four production scenarios are simulated and compared. Then, the selections of cooperative changeover strategies in different production scenarios are summarized. However, the number of experimental schemes implemented in this paper is still limited, and only satisfactory solutions can be obtained. There is still a large space for strategic optimization. In response to this deficiency, the future research will further enrich the cooperative strategies of the production team from the perspective of the adaptability of operator agents, and further subdivide production systems and operators, thus providing more precise cooperative changeover schemes for managers.


