3.1. Nano-Indentation Measurements
Areas where the indentations were performed are marked with a rectangle in the BSE images of each sample, as shown in
Figure 8a,
Figure 9a and
Figure 10a for S1, S2 and S3, respectively. The elastic modulus of each area measured by nano-indentation was plotted according to its position (X–Y) to give an elastic modulus map, as shown in
Figure 8b,
Figure 9b and
Figure 10b for S1, S2 and S3, respectively.
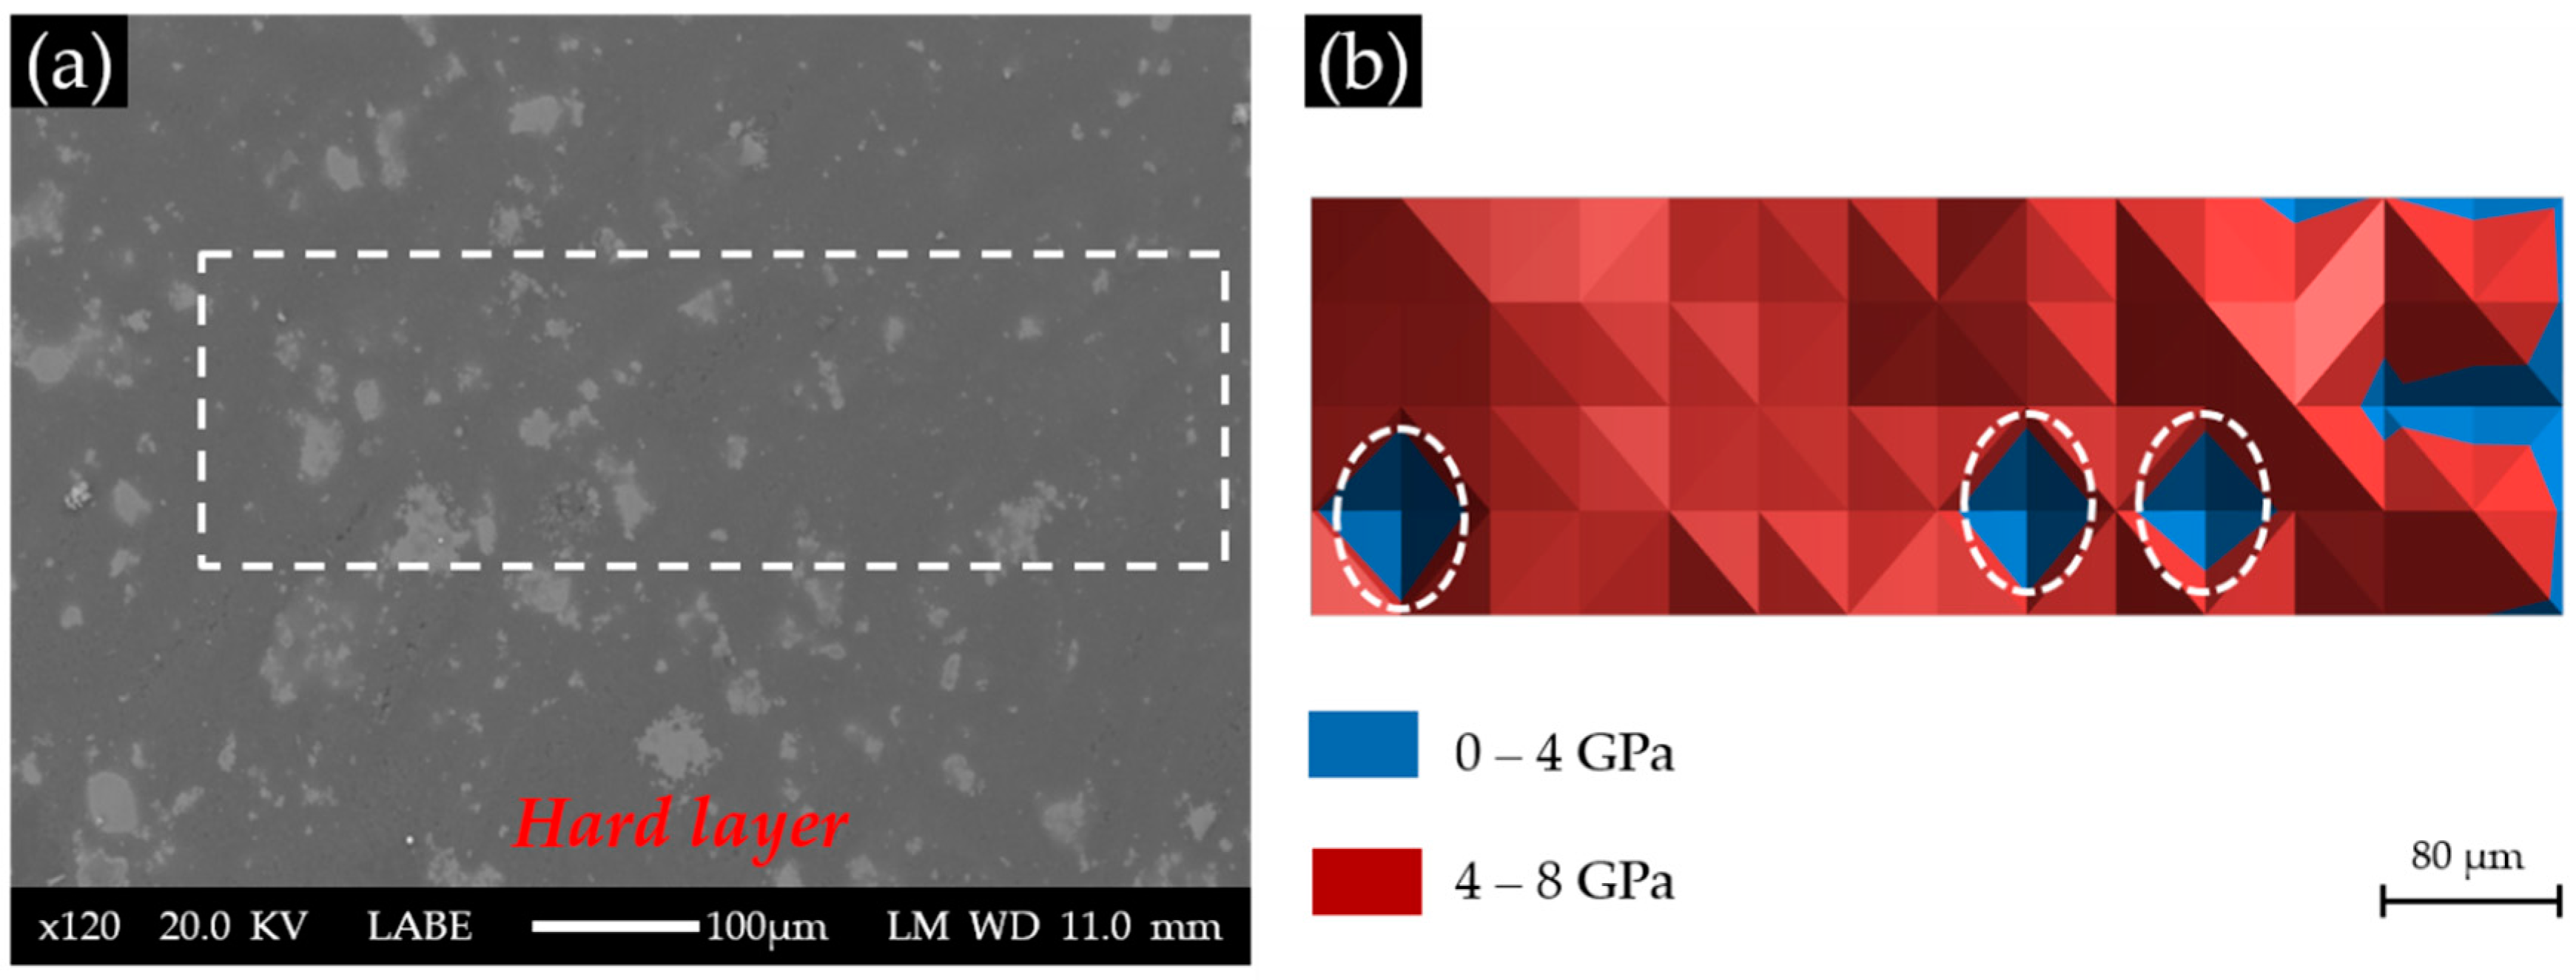
According to the BSE image of Sample S1 with a Ca(OH)
2 paste addition of 1 g, as shown in
Figure 8a, the surface of the cross-section of the hard layer was generally uniform except for some areas with a higher grey scale level. These brighter areas were thought to have more products that reflect the electron beams from the SEM. As shown in
Figure 8b, most of the indented areas of this sample had elastic moduli ranging from 4 to 8 GPa, while several areas located on the right had elastic moduli below 4 GPa. Notably, the three areas marked with circles are the invalid indents due to surface defects. Apparently, the elastic modulus of the areas composed of the calcium alkali silicate found in this sample (S1) was much lower than those reported in the literature ranging from about 20 GPa to about 30 GPa [
17]. This was probably because too little calcium was available in the system to form a stiffer calcium alkali silicate, since a higher calcium content usually leads to the formation of a calcium alkali silicate with a higher elastic modulus [
18]. This calcium alkali silicate with low calcium content may form directly by the interaction of alkali silicate with calcium or by the further interaction of alkali silicate with existing calcium alkali silicate [
19], given the abundant presence and free transport of alkali silicate through the uncovered surface in S1.
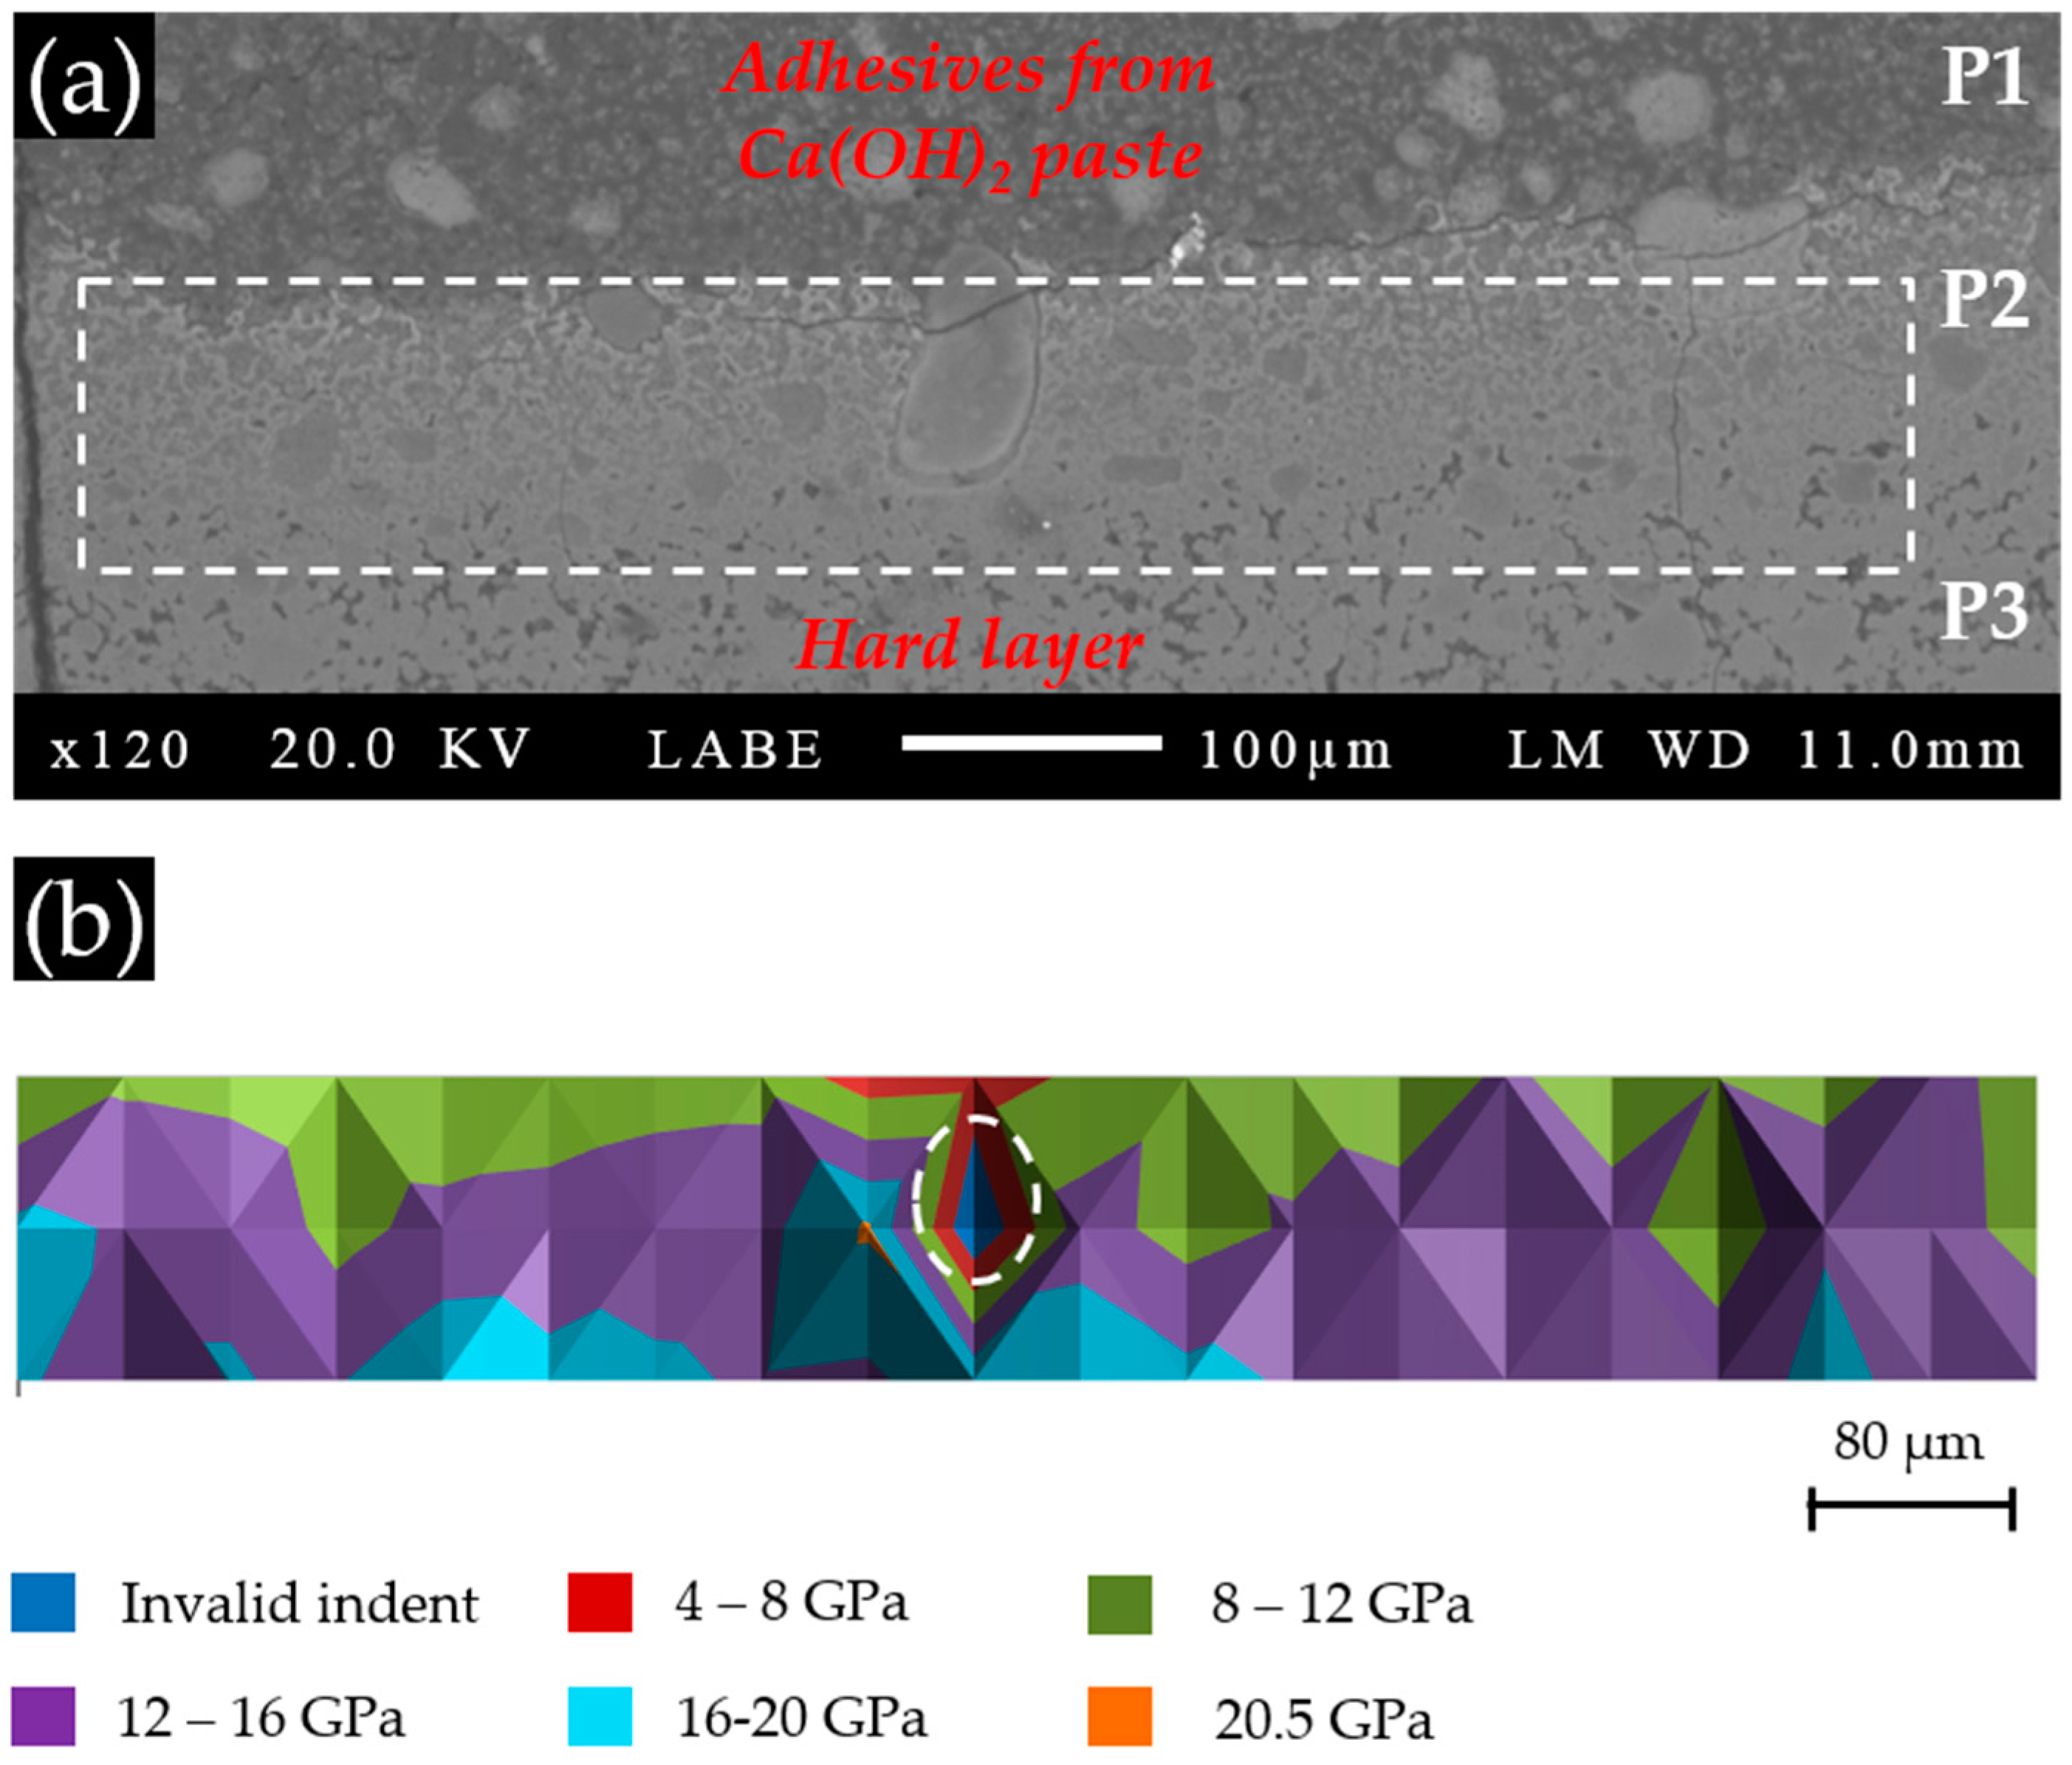
As shown in
Figure 9a, the whole region of the hard layer in Specimen S2 can be divided into three parts according to their different grey scale levels: (1) the dark part at the top (P1), where rare product was available to reflect electron beams: this part was located at the region of the Ca(OH)
2 paste attached to the hard layer; (2) the intermediate part (P2), which was located at the transition zone of the bright part (the hard layer) with the dark part (the adhesives); (3) the bright part, completely located at the hard layer, at the bottom (P3), where large amounts of calcium alkali silicate were present. Therefore, combining with the location of the hard layer shown in
Figure 6, P1 was from the Ca(OH)
2 paste; P2 was located at surface of the hard layer in contact with the Ca(OH)
2 paste; P3 was completely located at the hard layer closer to the slurry layer than the others. The grid of indentations on this sample is indicated with the rectangle in
Figure 9a.
The nano-indentation results of the areas in Sample S2 are shown in
Figure 9b. The first row of indents, located near the border between the hard layer and the region of adhesive, had low elastic moduli ranging from 8 to 12 GPa, indicating that the calcium alkali silicate present at this place was either weak or rare. The second row had, in general, higher values of elastic moduli compared to the first row, ranging from 12 to 16 GPa. This was possibly caused by a more densified structure present in the second row. The third row had slightly higher values of elastic moduli ranging from 12 to 20 GPa. This was probably caused by the formation of a stiffer calcium alkali silicate at this location, since this region appeared to be as equally densified as the second row according to their similar grey scale levels from the BSE images. The area marked with a circle corresponds to an invalid indent.
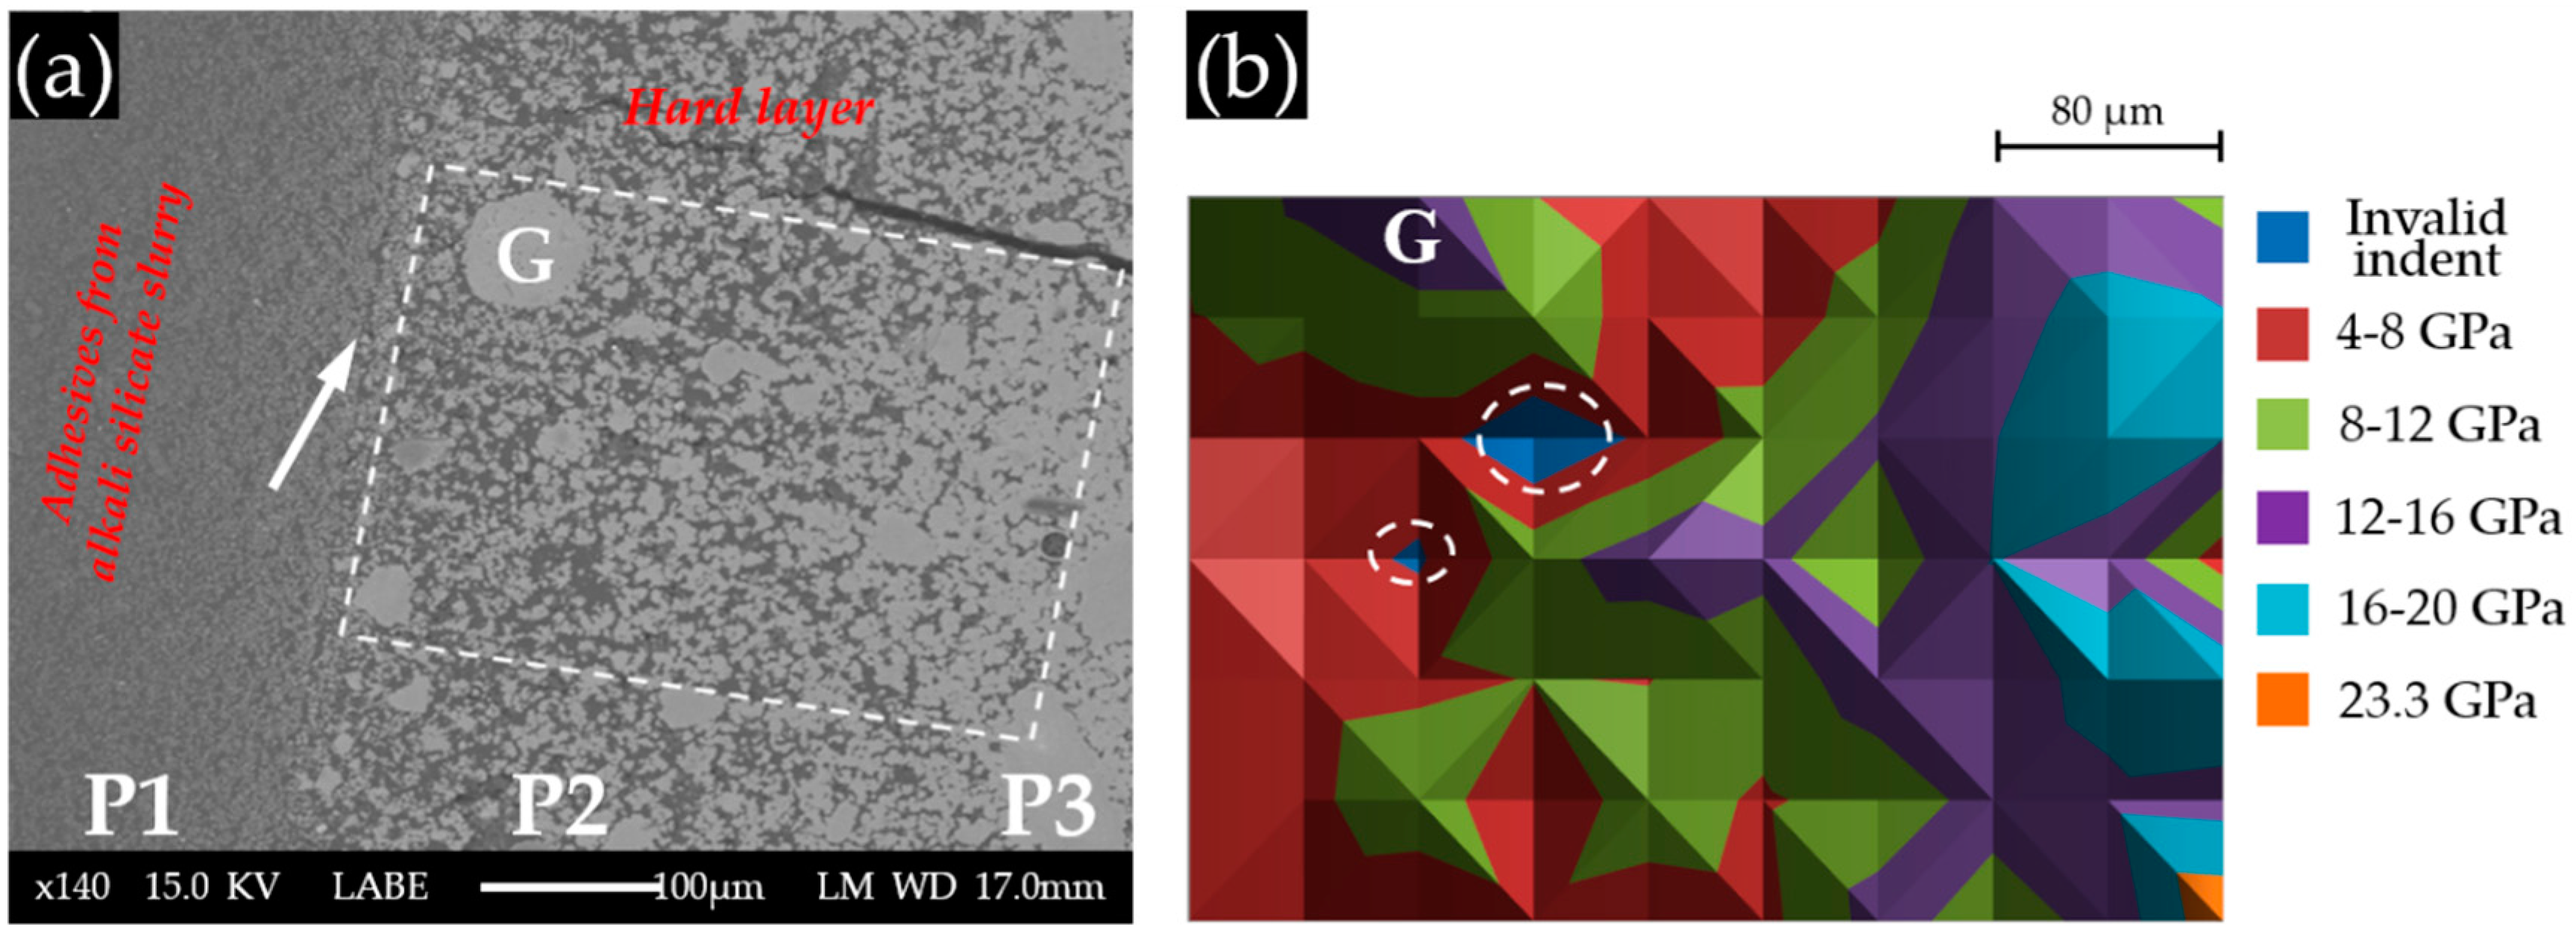
The BSE image of Sample S3 with a Ca(OH)
2 paste addition of 10 g is shown in
Figure 10a. Obviously, three parts can be differentiated according to their grey scale level. (1) P1 has the lowest grey scale level, suggesting that it is porous. Furthermore, the large difference in appearance between P1 and the other parts, as well as the observation during sample collection indicates that P1 was located at the region of the adhesive from the alkali silicate slurry. Its border with the hard layer is marked with an arrow in
Figure 10a; (2) P2 was located at the hard layer. An increasing amount of calcium alkali silicate appeared as groups constituting a less porous, but disorganized structure in this region. This disorganized appearance of calcium alkali silicate in groups (the largest is indicated in
Figure 10a by “G”), as the product of the interaction between alkali silicate and calcium, confirmed our hypothesis that neither alkali silicate nor calcium was well dispersed at their interface given that no shaking or stirring was applied to the mixture; (3) P3 was located at the region of the hard layer, further away from the border of the hard layer and the adhesives than the other two parts. Obviously, P3 contained the most calcium alkali silicate among these three parts leading to the formation of a more densified structure. Unlike the appearance of P2, the calcium alkali silicate in P3 was present as a continuous phase rather than as groups, implying that the availability of alkali silicate and calcium was sufficient enough to ensure the development of such a continuous phase of calcium alkali silicate. Pores were still visible in P3, but with a decreased amount and size compared to P2. Interestingly, the groups of calcium alkali silicate in P2, particularly the one marked with “G” in
Figure 10a, had a comparable grey scale level to that of the continues phase in P3. This implies that the porosity of the areas from P2 and P3 were almost the same. Therefore, combining with the location of the hard layer given in
Figure 6, P1 was located at the adhesives from the slurry layer; P2 was located at the hard layer in contact with the alkali silicate slurry; P3 was located at the hard layer and further away from the alkali silicate slurry than the others.
The nano-indentation results of Sample S3 with a Ca(OH)
2 paste addition of 10 g are shown in
Figure 10b. The grid of indents were located within P2 and P3. Based on the results shown in
Figure 10b, three layers can be differentiated from left to right according to their variation in elastic moduli. (1) The first layer from the left, located within the region of P2, had values of elastic moduli ranging from 4 to 8 GPa. As shown in the BSE image, the region where the first layer was located had a porous structure resulting in low values of the elastic moduli. However, the group of calcium alkali silicate marked with “G” had a higher elastic modulus ranging from 12 to 16 GPa than its neighbors in P2; (2) The second layer from the left with the values of elastic moduli ranging from 8 to 12 GPa was located at an intermediate place between P2 and P3, where more calcium alkali silicate was present and less pores were found; (3) The third layer was fully within the territory of P3, which was the most densified region of this sample, having the values of elastic moduli ranging from 12 to 20 GPa. The two areas marked with circles are the invalid indents.
This distribution of the elastic moduli suggested the possible relationship between elastic modulus and the grey scale level and the local porosity. Indeed, the higher the grey scale level, the lower the local porosity of the indented areas, resulting in a higher value of the elastic modulus. In other words, it seems that the local porosity dominantly determined the elastic moduli of the areas composed of calcium alkali silicate in this sample.
3.2. Elemental Composition Analysis
The elemental composition of each indented area measured by EDS was expressed as the calcium to silica mole (Ca/Si) ratio and the alkali to silica mole ((Na + K)/Si) ratio. Thereafter, the Ca/Si ratios of each indented area were plotted against its position (X–Y):
- (a)
Figure 11a for S1 (with a Ca(OH)
2 paste addition of 1 g);
- (b)
Figure 12a for S2 (with a Ca(OH)
2 paste addition of 5 g);
- (c)
Figure 13a for S3 (with a Ca(OH)
2 paste addition of 10 g).
Besides, the Ca/Si ratio and (Na + K)/Si ratio of all of the indented areas are plotted in
Figure 11b,
Figure 12b and
Figure 13b to reveal the elemental composition of the calcium alkali silicate from S1, S2 and S3, respectively.
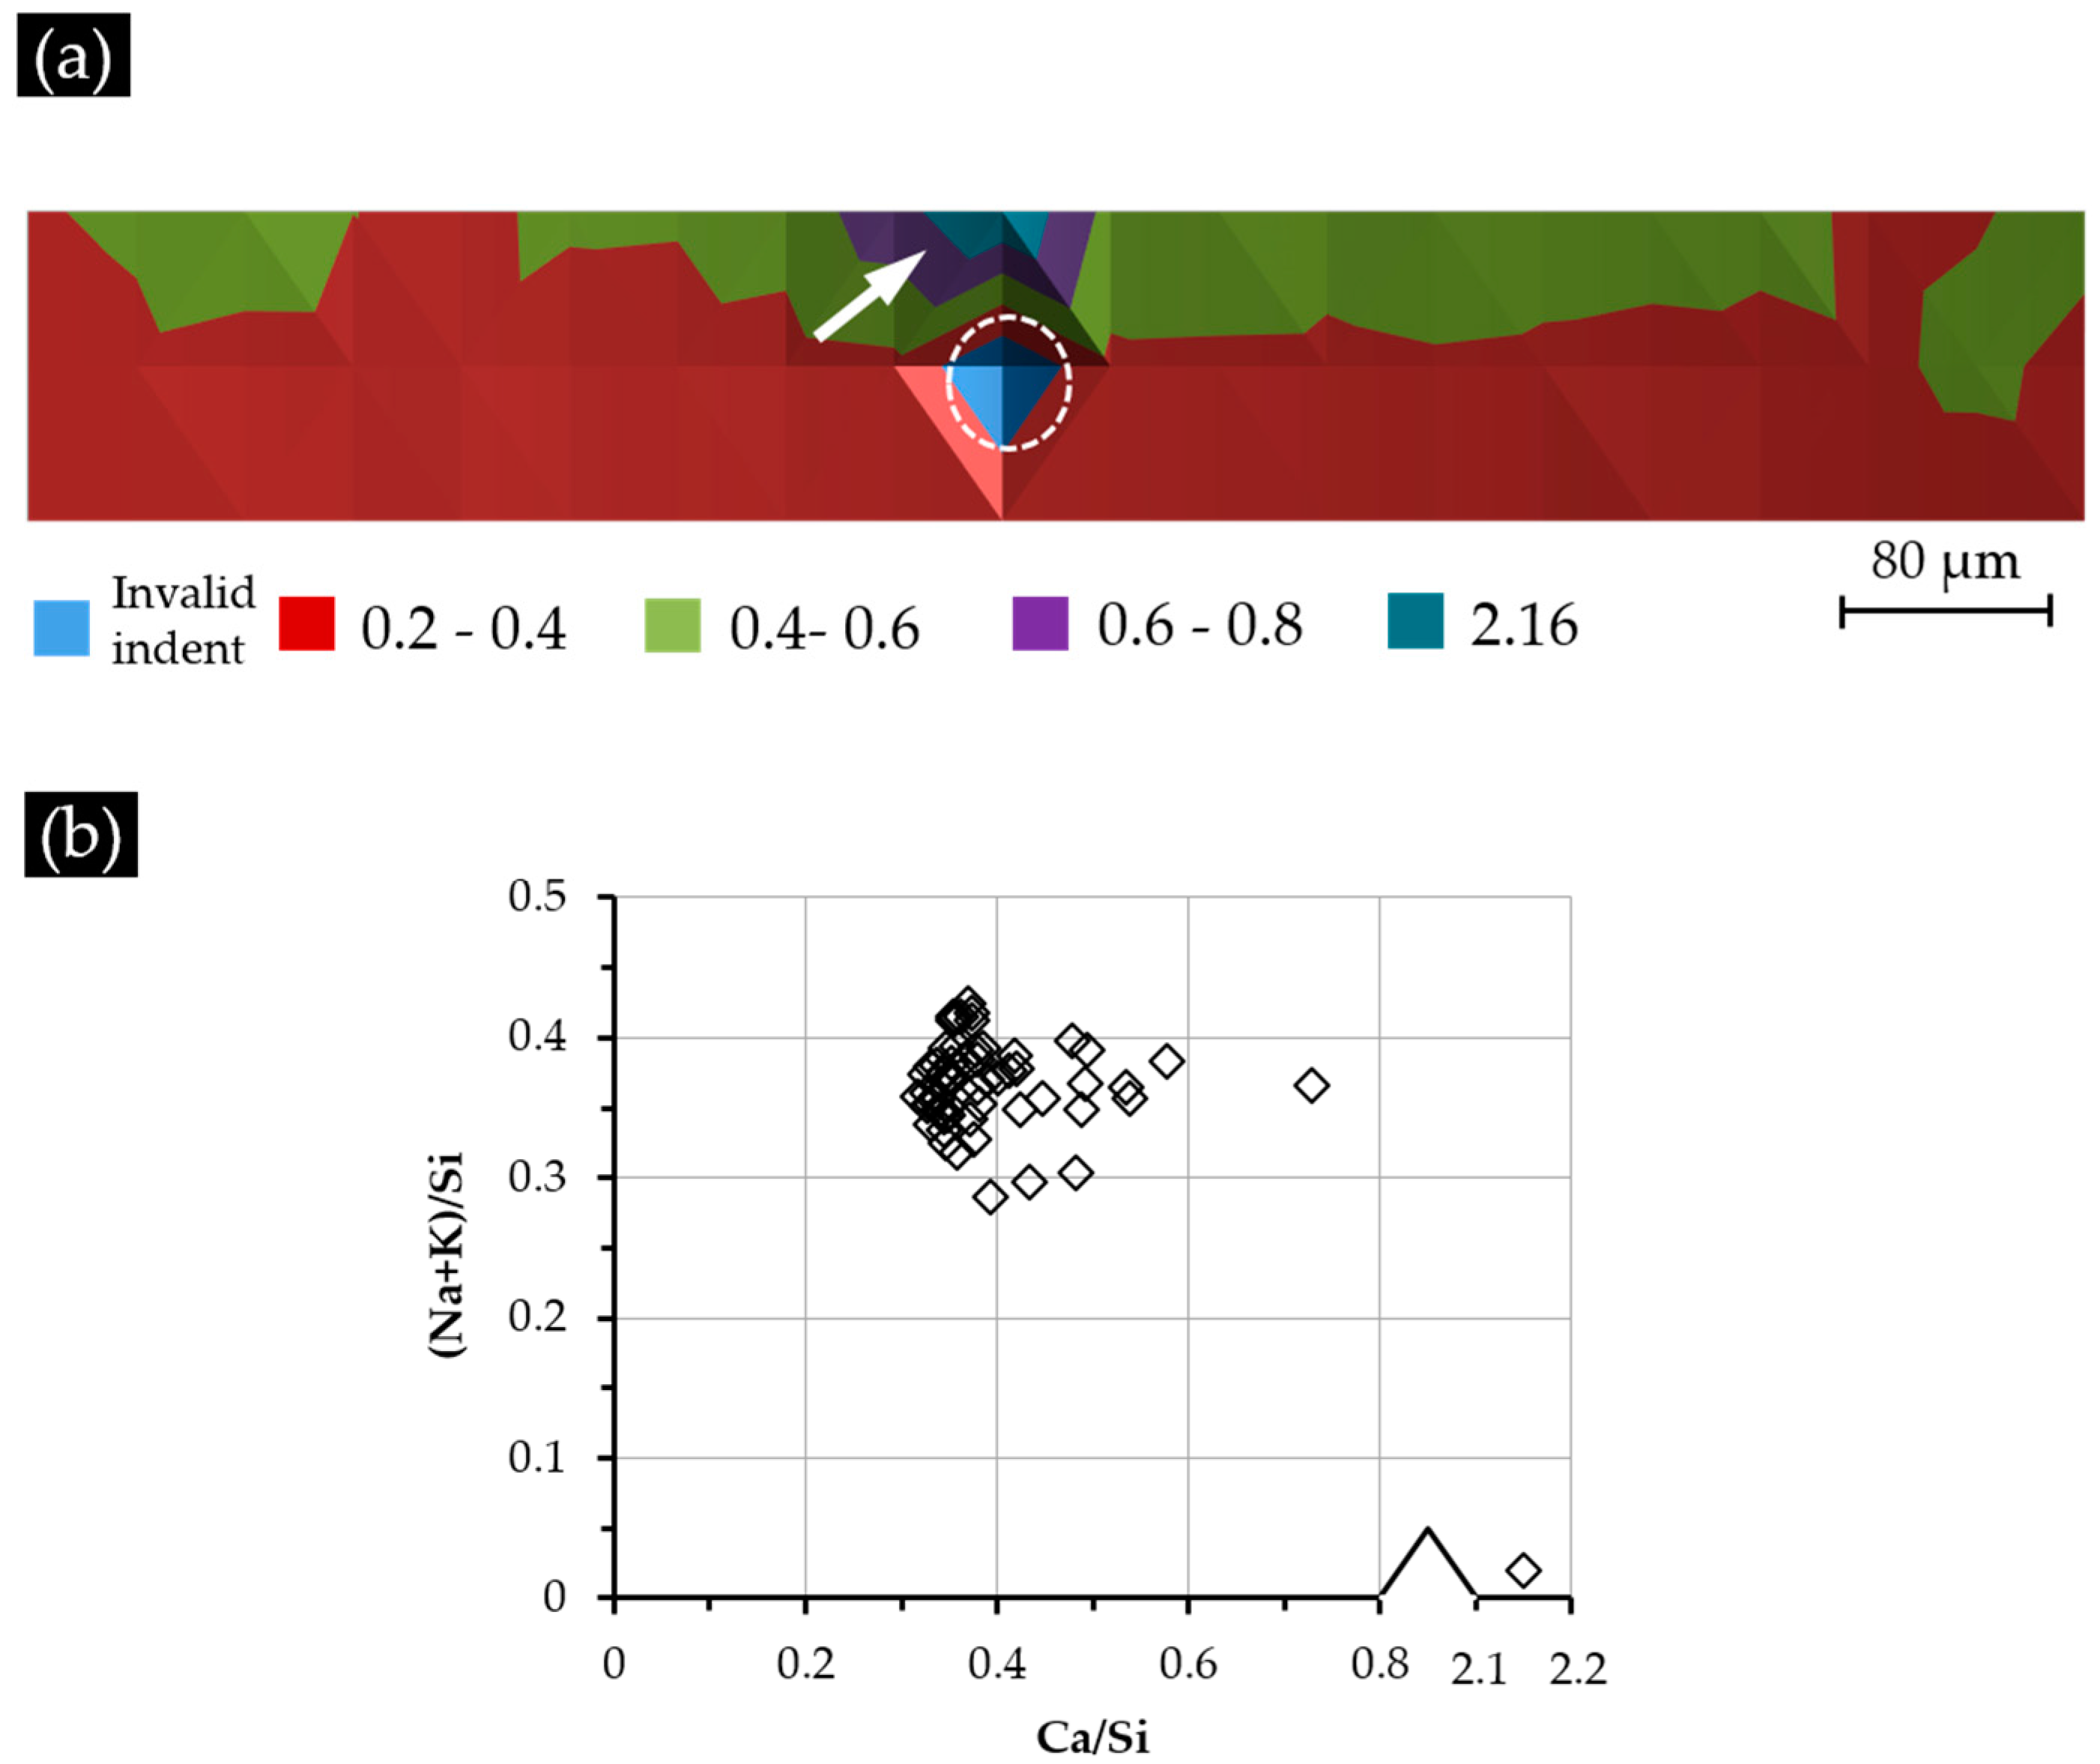
The Ca/Si ratio variation of the indented areas of Sample S1 is shown in
Figure 11a. Most of the indented areas show a Ca/Si ratio of less than 0.30, except two, which had a higher Ca/Si ratio ranging from 0.30–0.40 and whose locations are indicated with arrows in
Figure 11a. Regardless of these two areas, nearly half of the areas had a Ca/Si ratio ranging from 0.10–0.20, and the others had a Ca/Si ratio ranging from 0.20–0.30. The locations of three invalid indents are marked with three circles; the elemental compositions of these areas were excluded from the results accordingly. Similar to its corresponding nano-indentation results given in
Figure 8, the distribution of the Ca/Si ratio does not show any typical pattern indicating a generally homogeneous distribution of calcium and silicon in the hard layer of S1.
As shown in
Figure 11b, the indented areas of S1 had the Ca/Si ratio ranging from 0.12–0.33 and the (Na + K)/Si ratio ranging from 0.05–0.45. Moreover, most of the areas (81%) had the Ca/Si ranging from 0.15–0.25, and 86% of the indented areas had the (Na + K)/Si ratio ranging from 0.20–0.30. This elemental composition of the calcium alkali silicate was comparable to the ASR product found within the crack of an aggregate [
20], where silicate is abundant while little calcium can be expected. Actually, considering the surface of the alkali silicate slurry in the system of S1 not being completely covered by the added calcium shown in
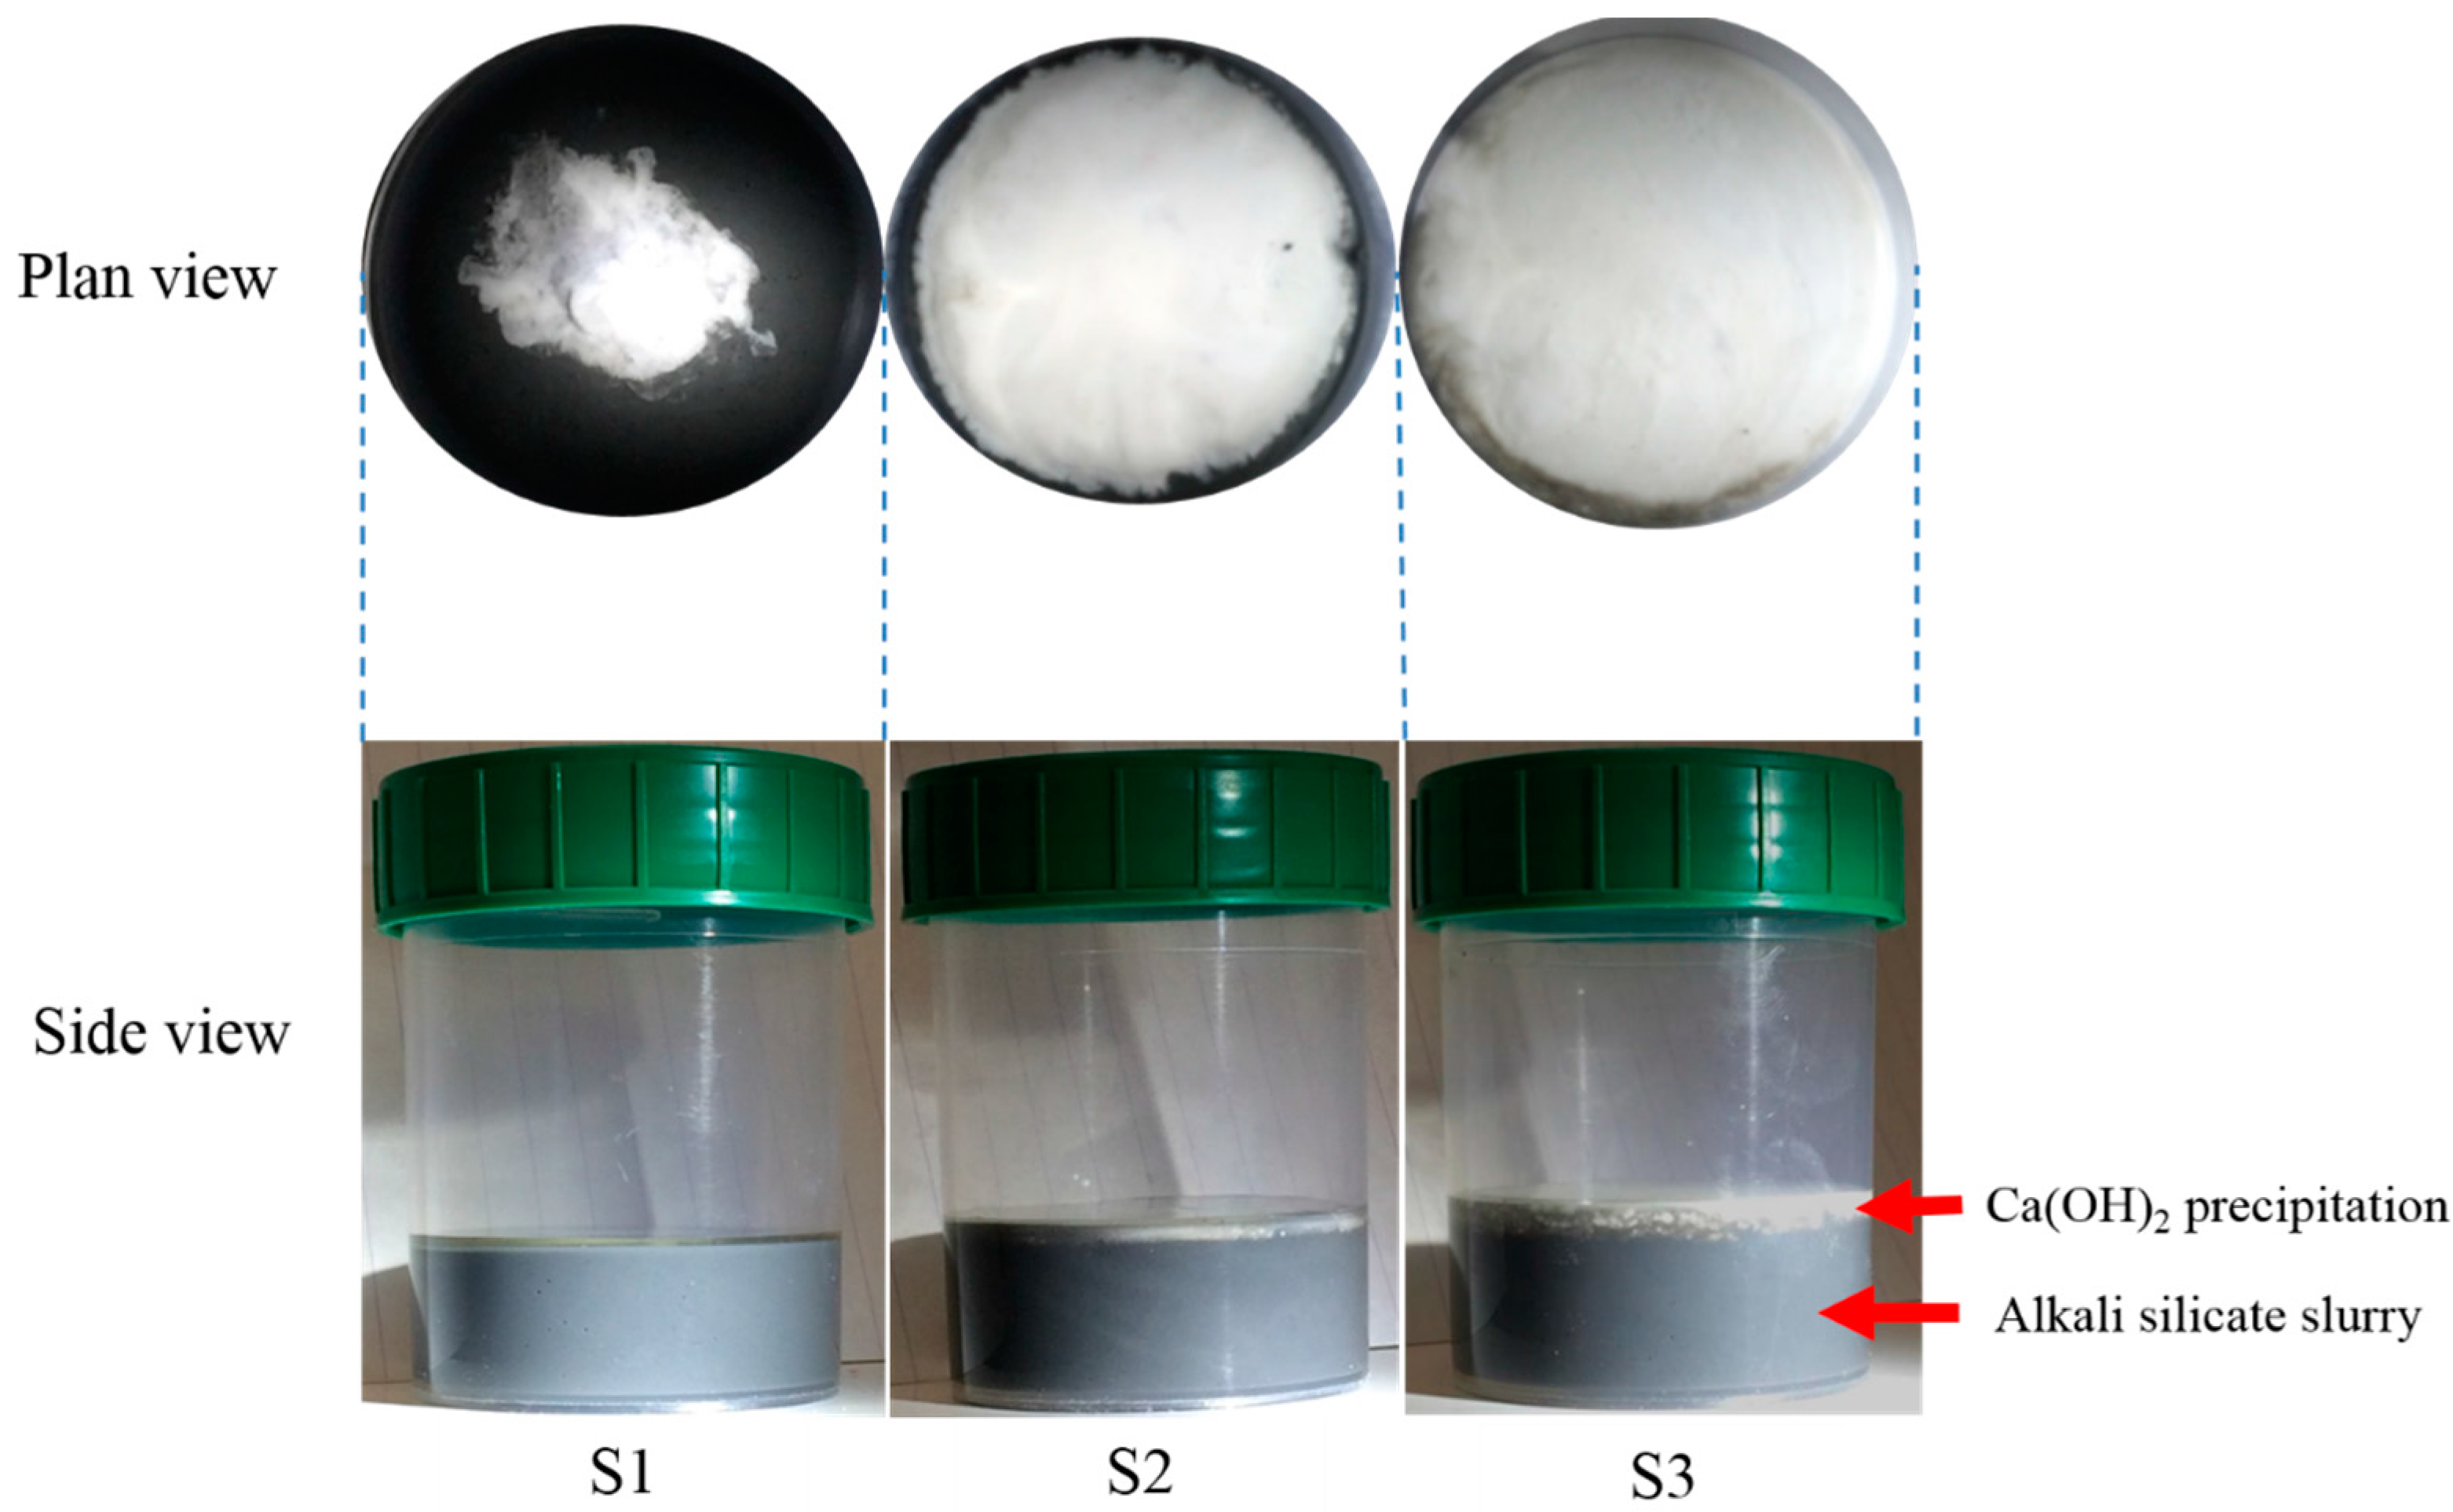
Figure 5, the free transport of alkali silicate can be expected to ensure the availability of silicate to react with the added calcium as much as possible.
As shown in
Figure 12a for Sample S2 with a Ca(OH)
2 paste addition of 5 g, most of the areas near the border of the hard layer with the adhesives at the top had high values of the Ca/Si ratio ranging from 0.40–0.60, except for two areas with the Ca/Si ratio of around 0.72 and 2.15, which are indicated with an arrow in
Figure 12a. The areas from the second and the third rows of indents had a lower Ca/Si ratio ranging from 0.20–0.40. This decreasing trend of the Ca/Si ratio when getting away from the border of the hard layer and the adhesives was caused by the presence of Ca(OH)
2 in the region of the adhesives. The location of this Ca(OH)
2 was expected to be near the area with a Ca/Si ratio of 2.15, since calcium alkali silicate alone cannot give such a high value of Ca/Si ratio [
21]. Clearly, the presence of additional Ca(OH)
2 near the surface of the hard layer can increase the amount of calcium available for its interaction with alkali silicate to form a calcium alkali silicate with a high Ca/Si ratio. This is the reason for the areas from the first row showing a higher Ca/Si ratio than the others. Notably, the influence of this effect faded as the areas got further away from the adhesives containing Ca(OH)
2, resulting in the decreased Ca/Si ratio of the areas in the second and the third rows. The location of the invalid indent is marked with a circle.
As shown in
Figure 12b, most of the areas (93%) had a Ca/Si ratio ranging from 0.30–0.50, and 83% of the areas had a (Na + K)/Si ratio ranging from 0.30–0.40. Comparing with the results of S1, clearly the areas from S2 had generally a higher Ca/Si ratio resulting from the addition of more calcium or, more specifically, the presence of Ca(OH)
2 in the adhesives.
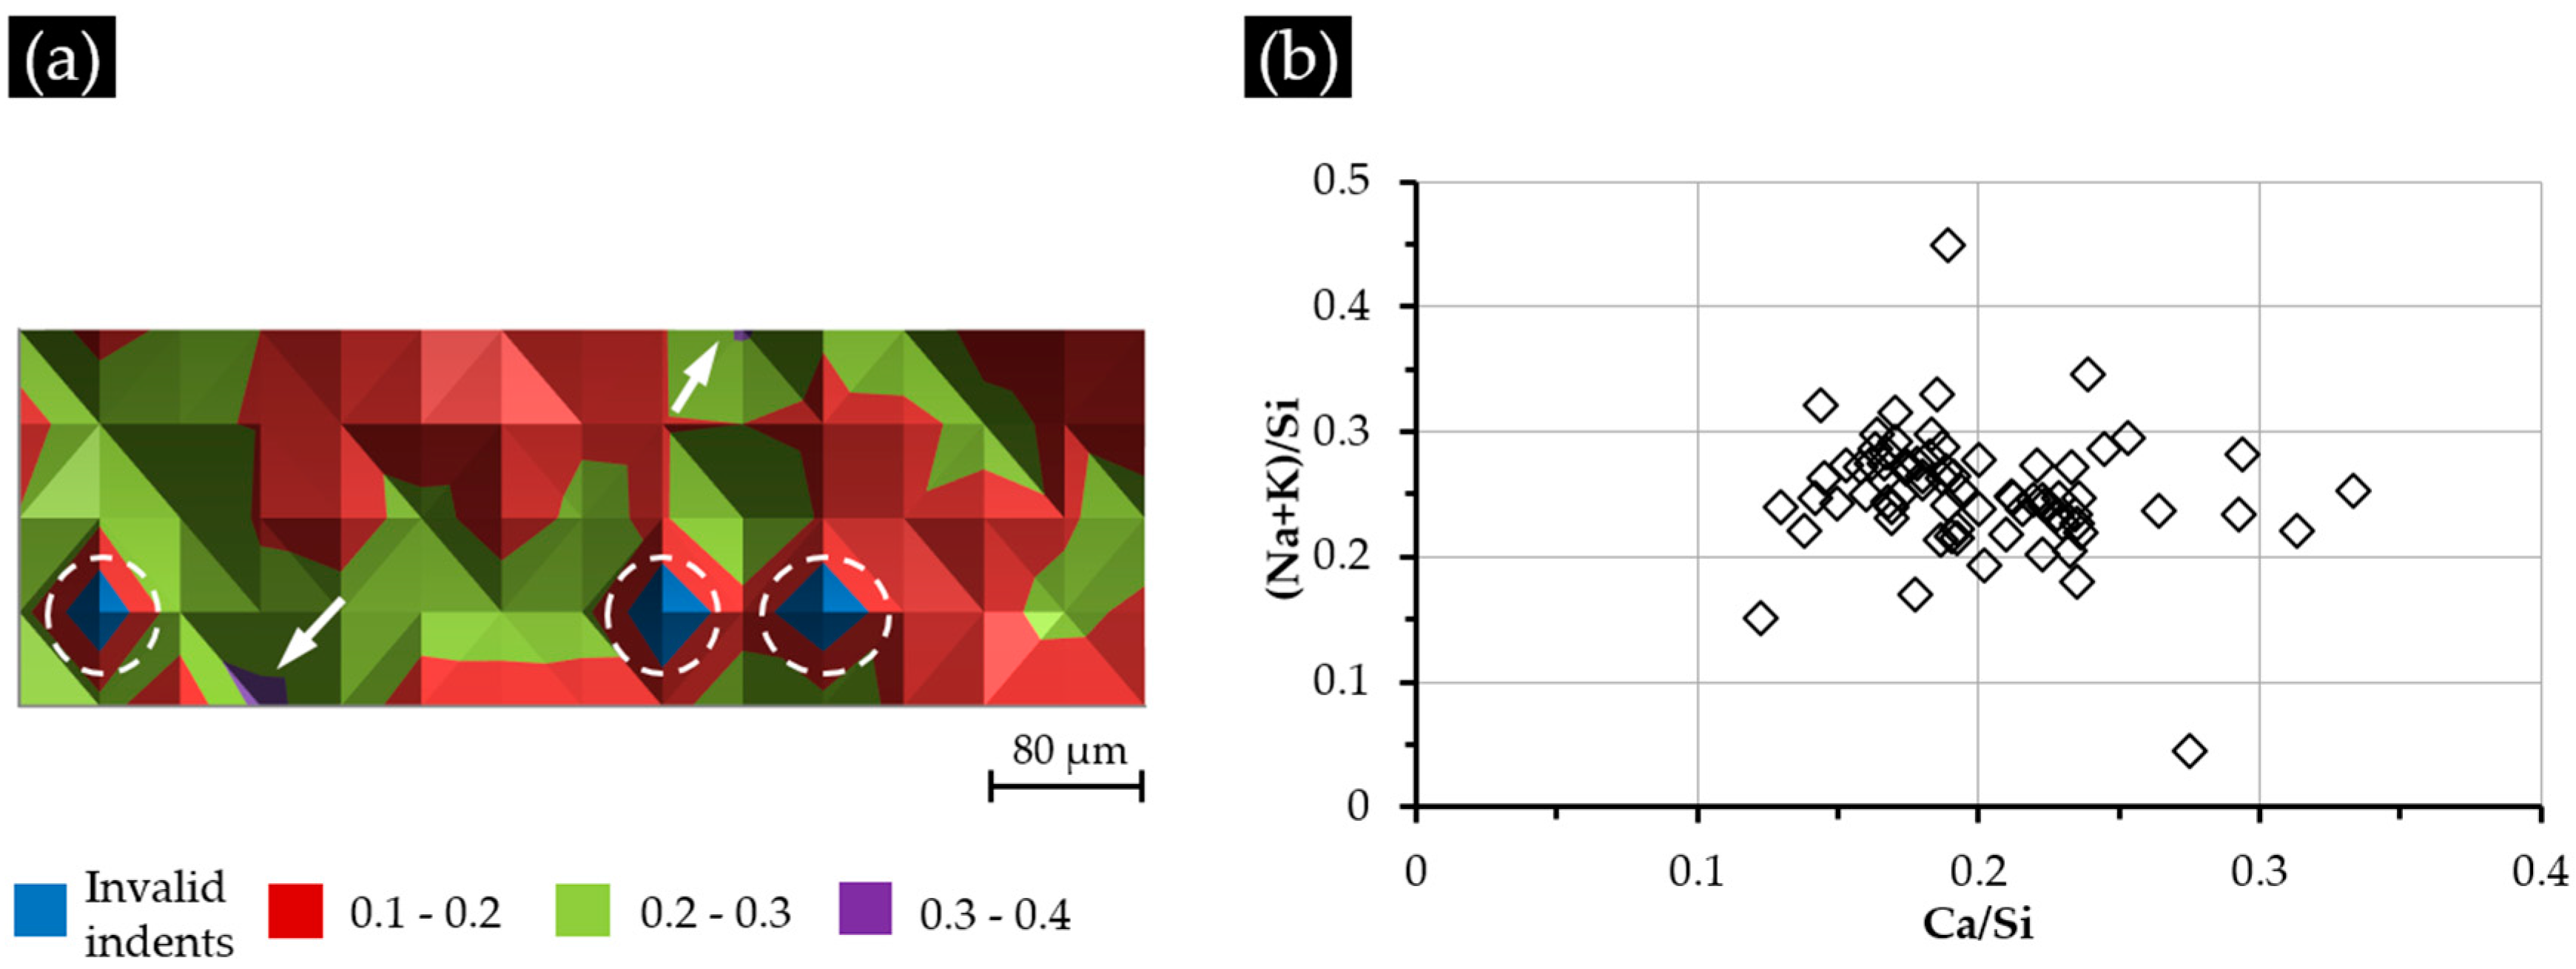
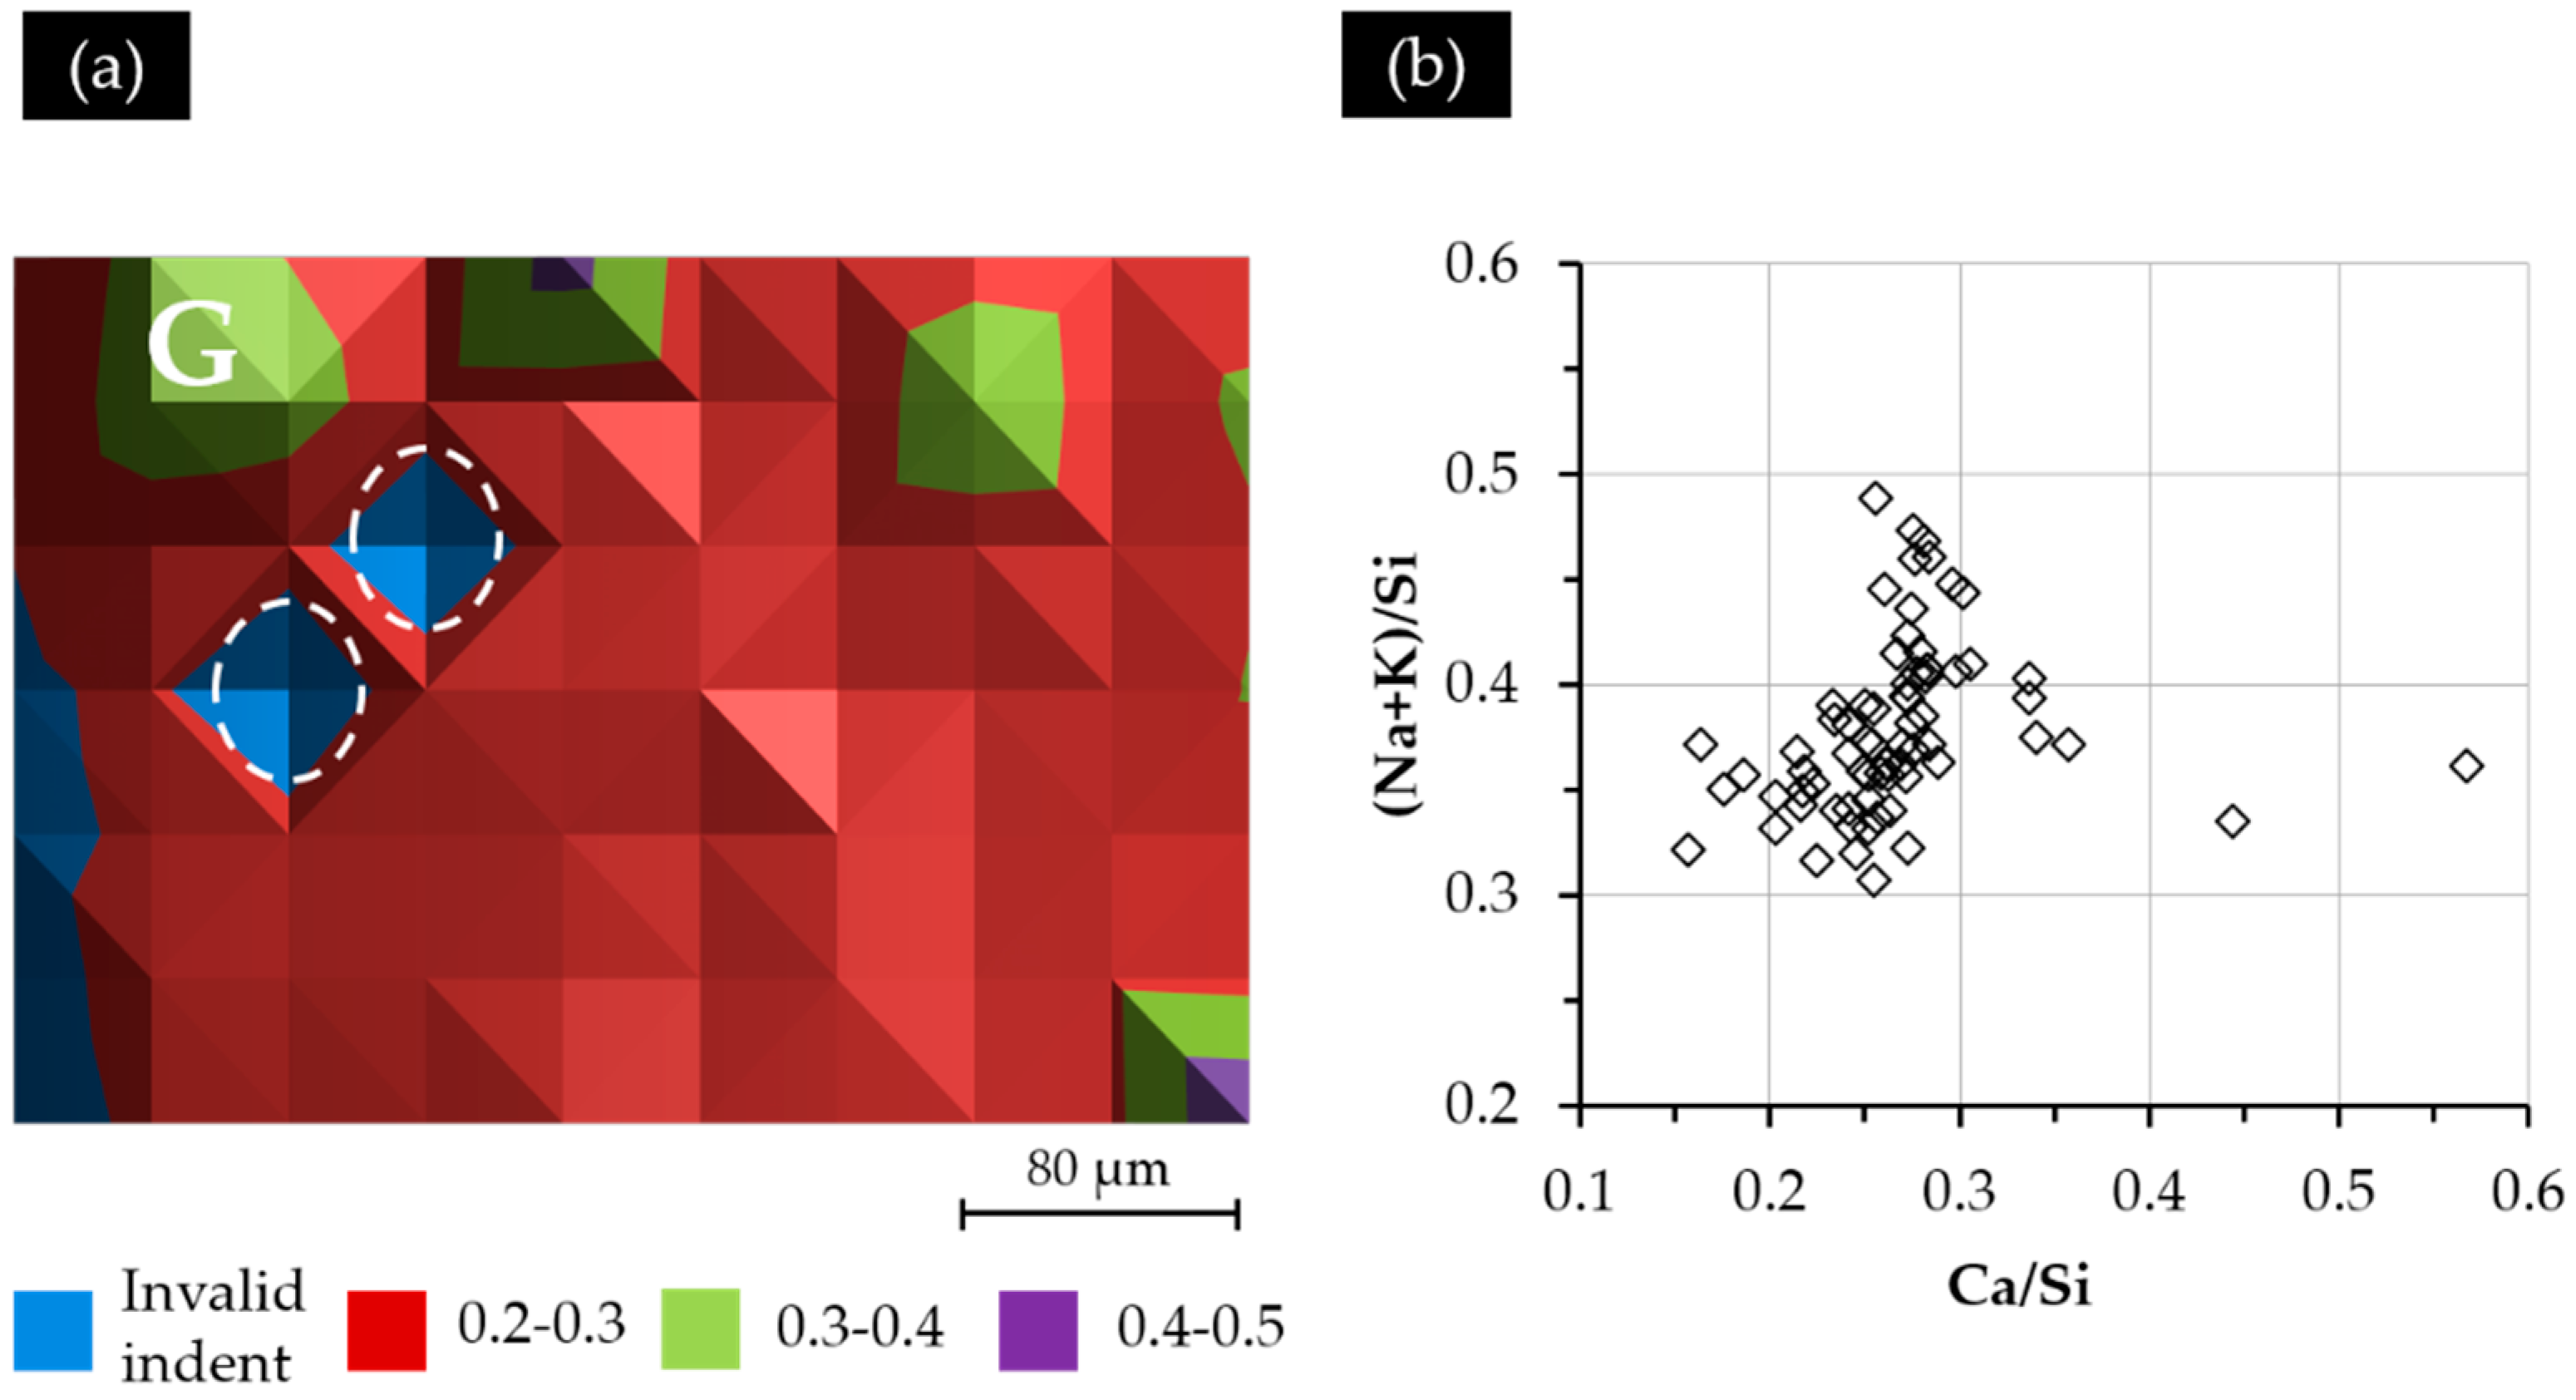
The Ca/Si ratio variation of the indented areas from Sample S3 is shown in
Figure 13a. Generally speaking, the distribution of the Ca/Si ratio of the indented areas did not show any typical pattern except several “islands” with a higher Ca/Si ratio, as well as the areas near the border of the hard layer and the adhesives having a lower Ca/Si ratio. Notably, the location of the area indicated with “G” in
Figure 13a having a higher Ca/Si ratio than its neighbors is consistent with the one indicated with “G” in
Figure 10 having a higher elastic modulus and higher grey scale level than its neighbors. This indicates that both a higher Ca/Si ratio and a more densified structure in this region contributed to the higher elastic modulus of this region. The location of the invalid indent is marked with a circle.
According to
Figure 13b, most of the analyzed areas (84%) had a Ca/Si ratio ranging from 0.20–0.30; some areas had a higher Ca/Si ratio ranging from 0.30–0.40; while one area had a Ca/Si ratio of about 0.44; 84% of the areas had a (Na + K)/Si ratio varying from 0.30–0.40.
Comparing all of the results with the ones of Brouxel [
22], the calcium alkali silicate constituting the hard layer from S1 in this study had a similar Ca/Si ratio and (Na + K)/Si ratio as the reaction rim, which was located at about 50 μm from the aggregate surface; the calcium alkali silicate constituting the hard layer from S2 had a similar Ca/Si ratio and (Na + K)/Si ratio as the reaction rim, which was located at about 80 μm from the aggregate surface; the calcium alkali silicate constituting the hard layer from S3 had a similar Ca/Si ratio and (Na + K)/Si ratio as the reaction rim, which was located at about 60 μm from the aggregate surface. Besides, for the ASR gel [
23], the one formed at the place closer to the cement paste than the aggregate has a higher Ca/Si ratio; the one formed at the place closer to the aggregate than the cement paste has a lower Ca/Si ratio. Therefore, presumably, the calcium alkali silicate from S1 can be considered as the product formed close to the aggregate surface; the calcium alkali silicate from S2 can be considered as the product formed close to the cement paste; the calcium alkali silicate from S3 can be considered as the product formed at an intermediate place between the former ones.
Regarding the situation in S2 and S3, notably, the hard layer from S2 (less calcium was added) was composed of calcium alkali silicate with a higher Ca/Si ratio; while the hard layer from S3 (more calcium was added) was composed of calcium alkali silicate with a lower Ca/Si ratio. However, this cannot be considered as contradictory, since the region from S2 was located close to the Ca(OH)2 paste, where Ca(OH)2 was abundantly present, while the region from S3 was located close to the alkali silicate slurry, where little Ca(OH)2 was present. Therefore, the Ca/Si ratio of the hard layer was more influenced by its location after the complete coverage of the alkali silicate slurry, i.e., a higher Ca/Si ratio when it is close to the calcium and a lower Ca/Si ratio when it is close to the alkali silicate.
3.3. Elastic Modulus vs. Elemental Composition
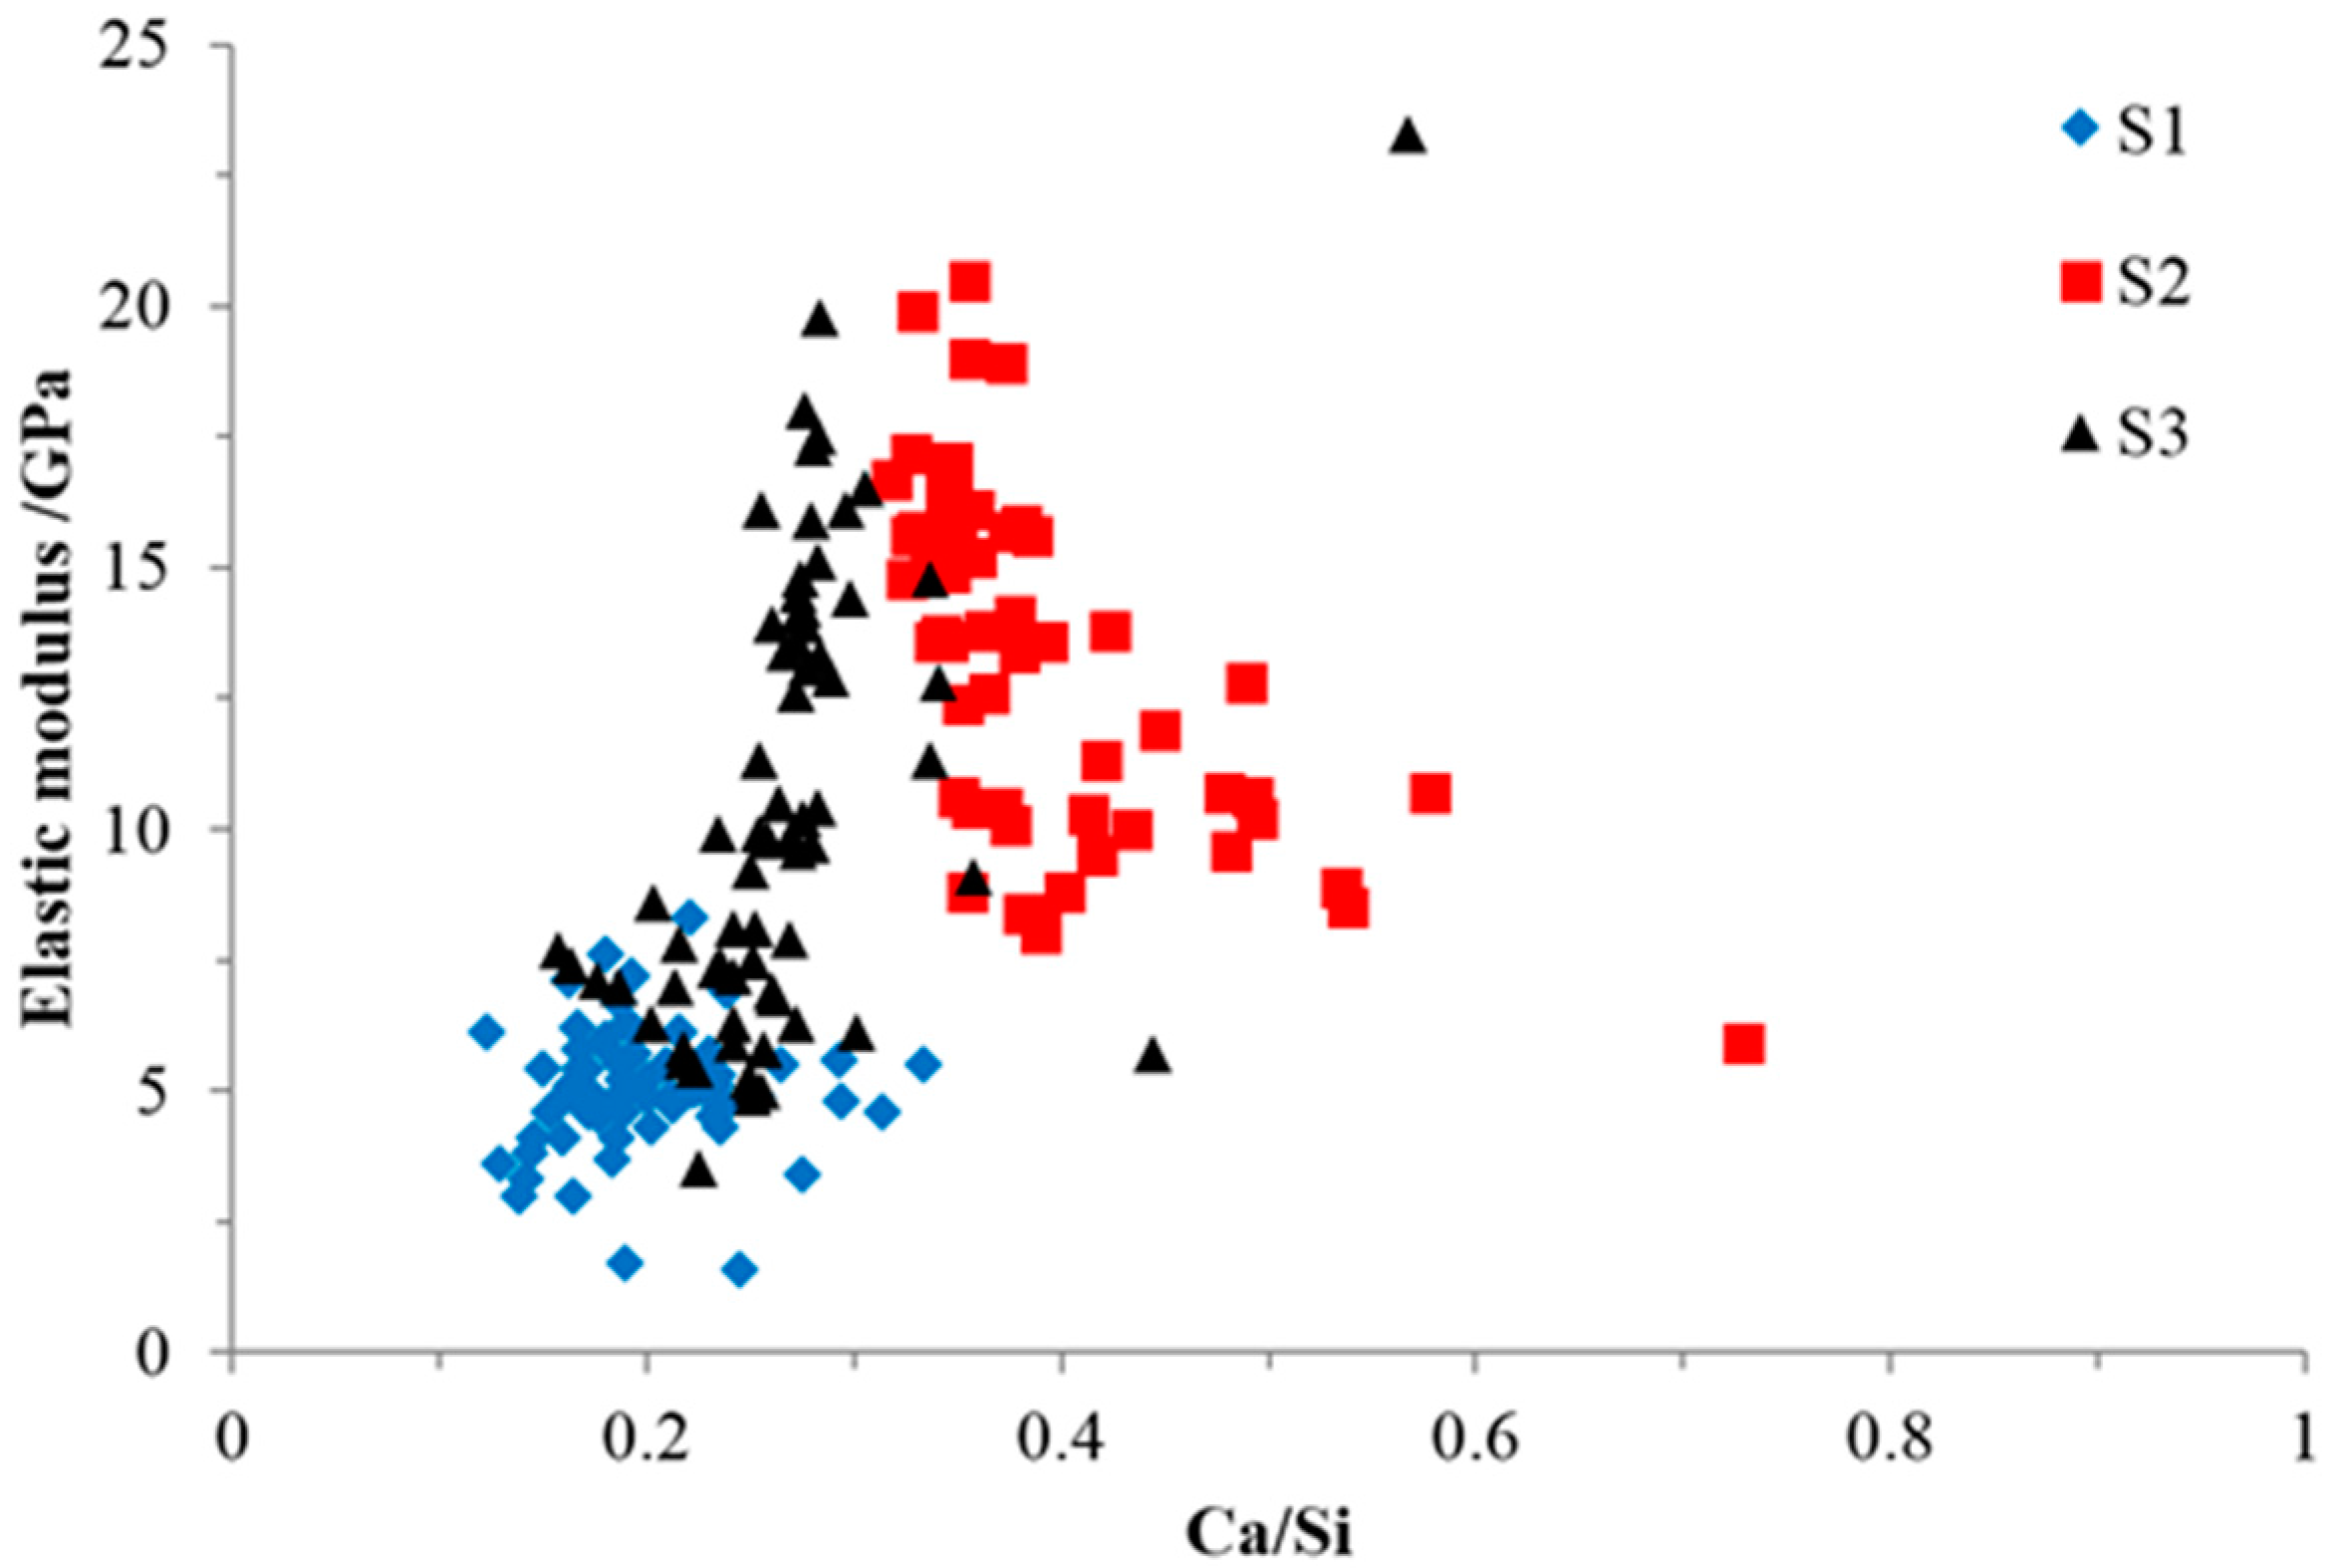
The elastic modulus and Ca/Si ratio of all of the indented areas are plotted in
Figure 14 to investigate their relationship.
As shown in
Figure 14, the general relationship between the elastic modulus and the Ca/Si ratio of the indented areas from all of the samples was consistent with the previous research [
18,
24] stating that the elastic modulus increased with the increase of the Ca/Si ratio. This was due to the formation of a more complex and interlinked silica network of calcium alkali silicate [
25] encouraged by an increased amount of calcium. In S1, calcium was too sparse to ensure its continuous interaction with alkali silicate to form the calcium alkali silicate with a high Ca/Si ratio and elastic modulus, especially given that alkali silicate was sufficiently supplied through the uncovered surface of the slurry layer (shown in
Figure 5) for its interaction with existing calcium alkali silicate, as well [
19]. In S2, due to the greater presence of Ca(OH)
2 in the adhesives attached to the hard layer, more calcium was available to be incorporated into the silicate network and to form a calcium alkali silicate with a higher Ca/Si ratio and elastic modulus.
However, it should be noted that the influence of the Ca/Si ratio on the elastic modulus is different from sample to sample. Therefore, ANCOVA analysis was performed to evaluate the influence of other factors, e.g., porosity, on the relationship between the Ca/Si ratio and the elastic modulus within each sample and for all of the samples. A level of significance of 0.05 was used. The results of the analysis for all of the samples show that the amount of diversity of the elastic modulus determined by the Ca/Si ratio is 62.7%; the rest is determined by other factors, including porosity. For the analysis of each sample, the amount of diversity of the elastic modulus determined by the Ca/Si ratio in S1 is 0.5%. For S2, the amount of diversity of the elastic modulus determined by the Ca/Si ratio is 46.4%, while for S3, it is 27.7%. This indicates that the influence of other factors on the relationship between the elastic modulus and the Ca/Si ratio is the highest in S1 and the lowest in S2. This featured phenomenon can be explained as follows.
As shown in
Figure 9b and
Figure 12b for S2, the areas with the Ca/Si ratio higher than 0.40 were located near the interface of the hard layer with its adhesives, where a porous and weak structure was expected. Hence, the elastic moduli of these areas were low even though the calcium alkali silicate here had a higher value of the Ca/Si ratio. Simply stated, it was the porosity that predominantly determined the elastic modulus in this region rather than the Ca/Si ratio. At the same time, as shown in
Figure 10b and
Figure 13b for S3, the areas with higher Ca/Si ratio of about 0.30 having a densified structure were located far away from the border of the hard layer with its adhesives. Hence, these areas had higher elastic moduli resulting from the higher Ca/Si ratio and the lower local porosity. Moreover, the relatively concentrated points from S1 in
Figure 14 implied that the pore distribution is uniform and that a similar porous structure can be speculated in the whole region, given a concentrated distribution of the Ca/Si ratio.
It should be noted that the variation between the depth of indentation and the interaction volume of SEM [
26] could influence the results of this study. Besides, the impregnation of epoxy filling the capillary pores of the samples during the preparation of the samples for nano-indentation and SEM-EDS analysis could also have some influence. However, without impregnation, it would be very difficult to investigate the mechanical properties of the samples obtained from the simulated calcium-alkali-silicate system in this study.
3.4. Discussion of the Elastic Modulus of the Hard Layer and Expansive Pressure in ASR
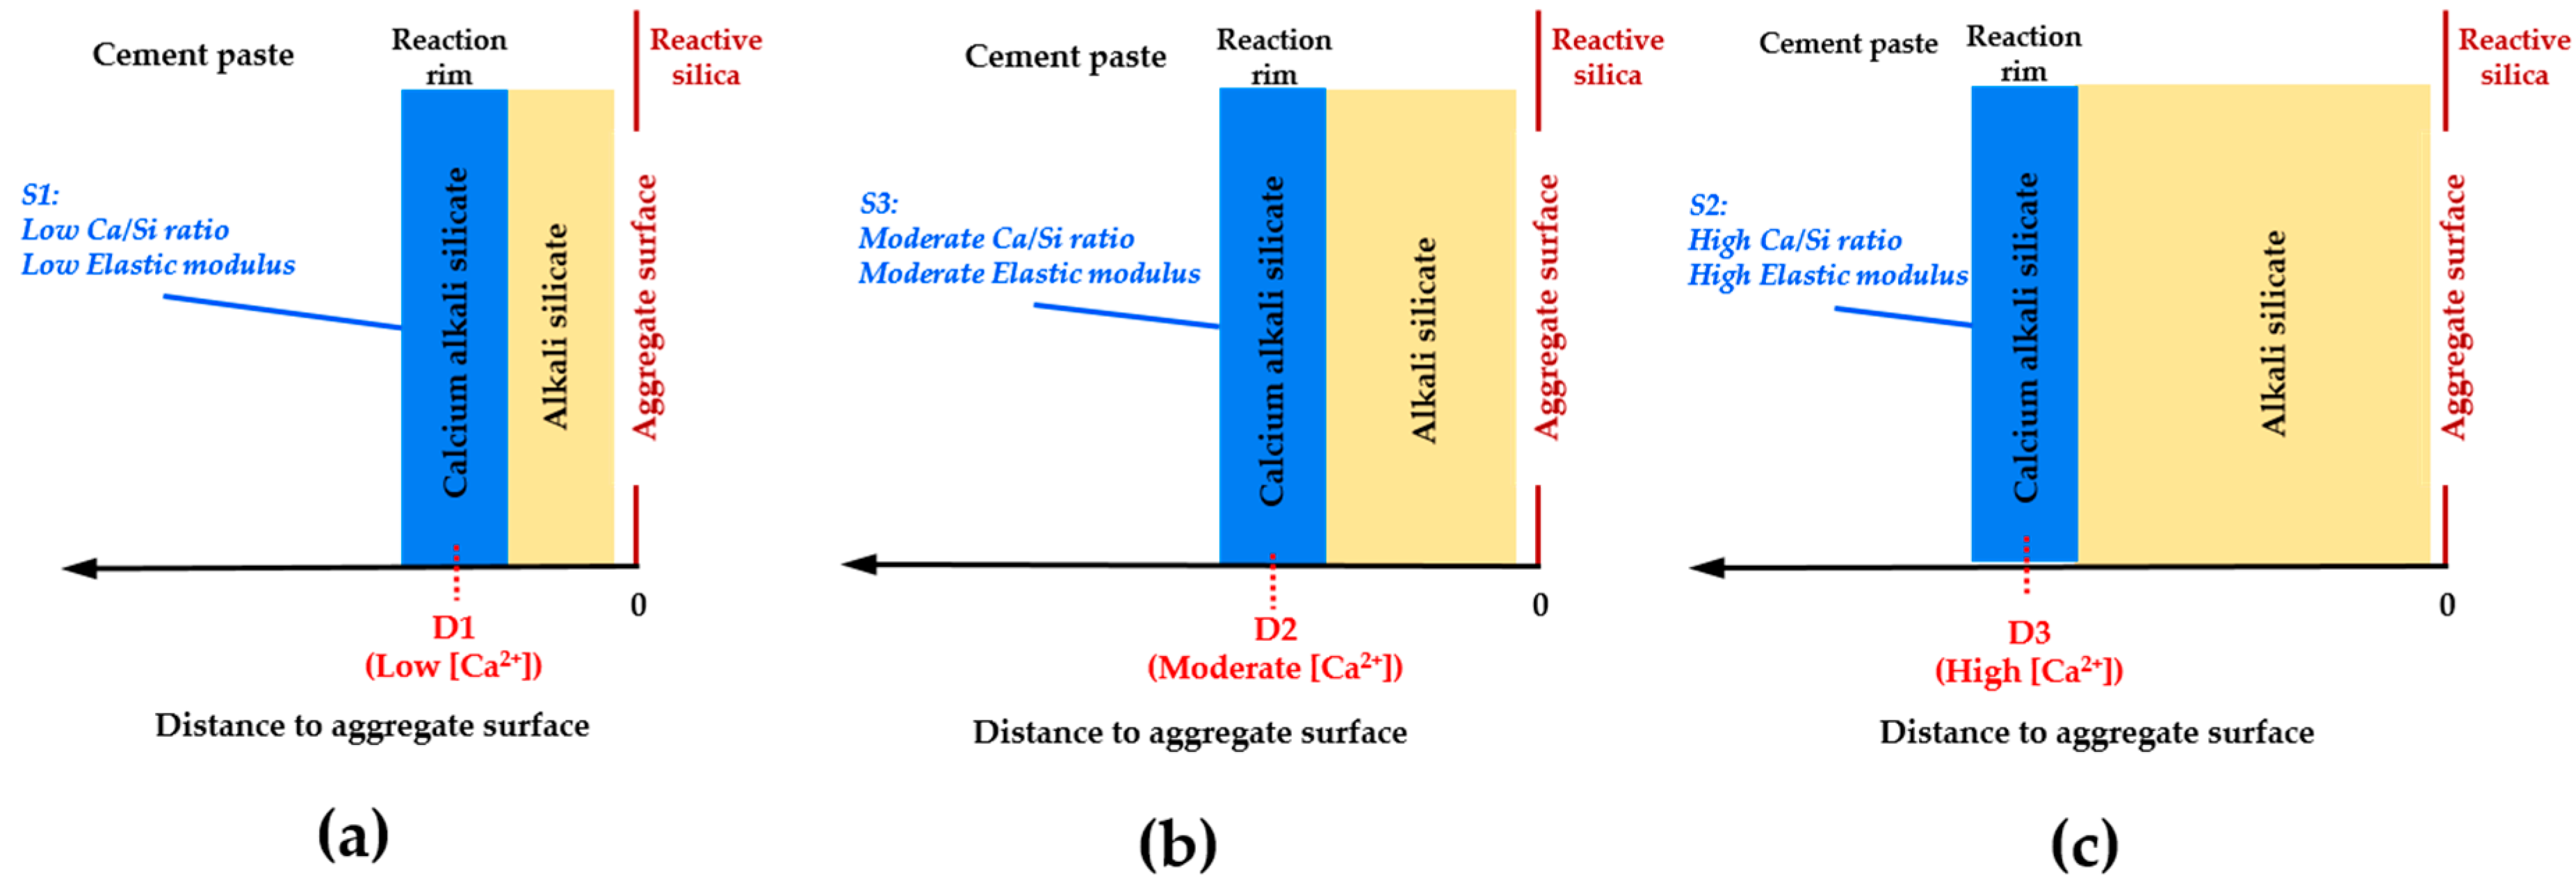
As stated in
Section 3.2, the calcium alkali silicate constituting the hard layers from the three systems can represent the calcium alkali silicate formed at different places, where different amounts of calcium are available for interaction with alkali silicate resulting in the different Ca/Si ratios of the formed calcium alkali silicate: the calcium alkali silicate with a low Ca/Si ratio obtained from S1 can be considered to be formed close to the aggregate surface, where little calcium, while abundant alkali silicate are present; the calcium alkali silicate with a high Ca/Si ratio obtained from S2 can be considered to be formed close to the cement paste, where abundant calcium, while little alkali silicate are present; the calcium alkali silicate with a moderate Ca/Si ratio obtained from S3 can be considered to be formed at an intermediate place.
Based on the results of the present study, the calcium alkali silicate with a low Ca/Si ratio from S1 had a low value of the elastic modulus. This implies that this kind of calcium alkali silicate can make up the reaction rim, which is formed close to the aggregate surface where little alkali silicate is present, as shown in
Figure 15a. Alternatively, the calcium alkali silicate with a high Ca/Si ratio from S2 had a high value of the elastic modulus. This implies that this kind of calcium alkali silicate can make up the reaction rim, which is formed close to the cement paste when a large amount of alkali silicate is present, as shown in
Figure 15c. Furthermore, the calcium alkali silicate with a moderate Ca/Si ratio from S3 had a moderate value of the elastic modulus, implying the formation of the reaction rim at an intermediate position compared to the former situations shown in
Figure 15b. This provides evidence to explain why the damage caused by ASR often happens around the aggregate rather than in the hardened cement paste. Notably, for the situation where the damage of ASR happens within the aggregate, the reaction rim (the hard layer in this study) can form at the opening of the crack to the cement paste and behave similarly. This means that the alkali silicate present in the interior of the crack interacts with the calcium coming from the pore solution of the cement paste to form calcium alkali silicate blocking the opening of the crack to the cement paste, as shown in
Figure 16a–c.
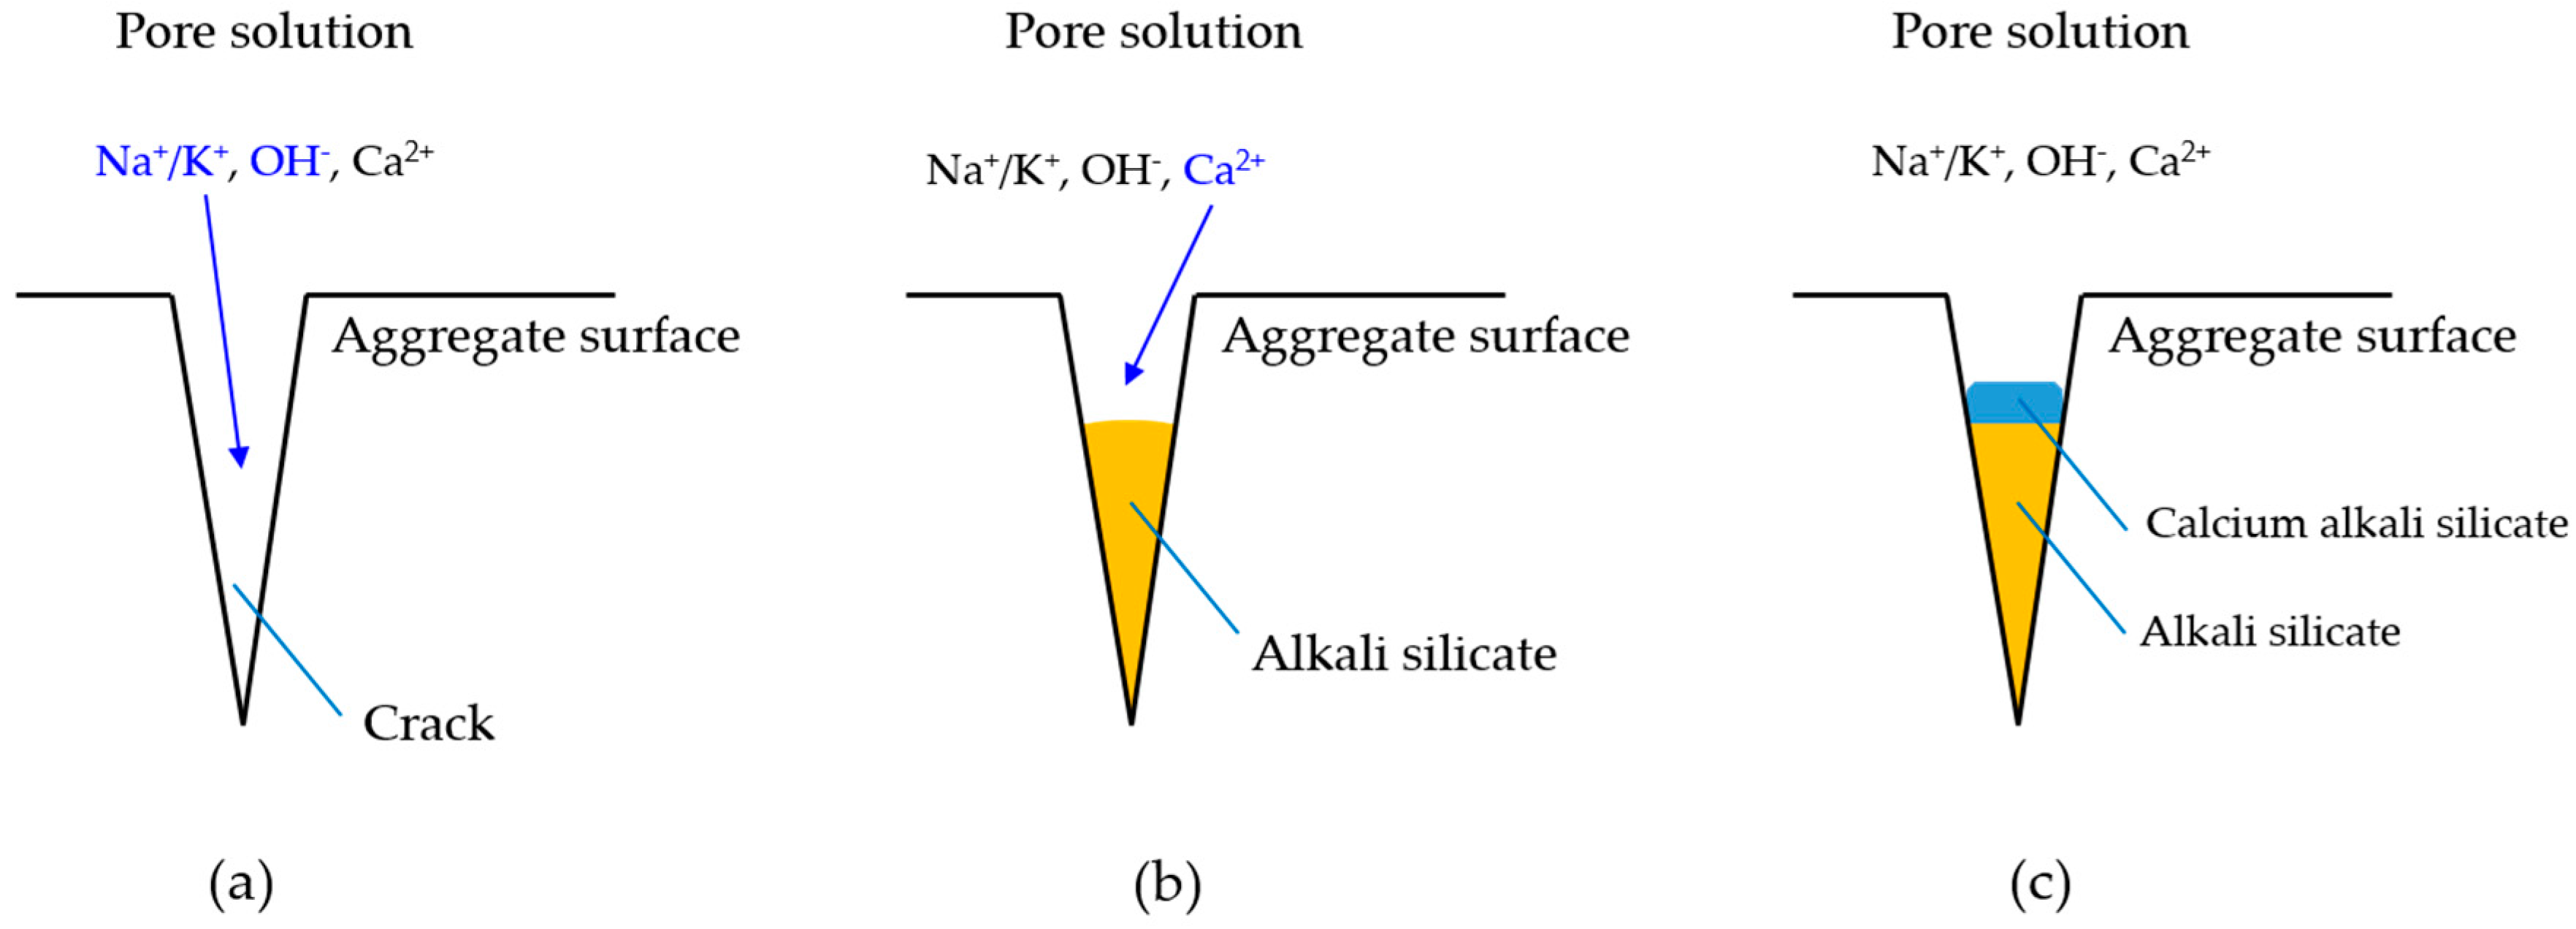
3.5. Further Discussion
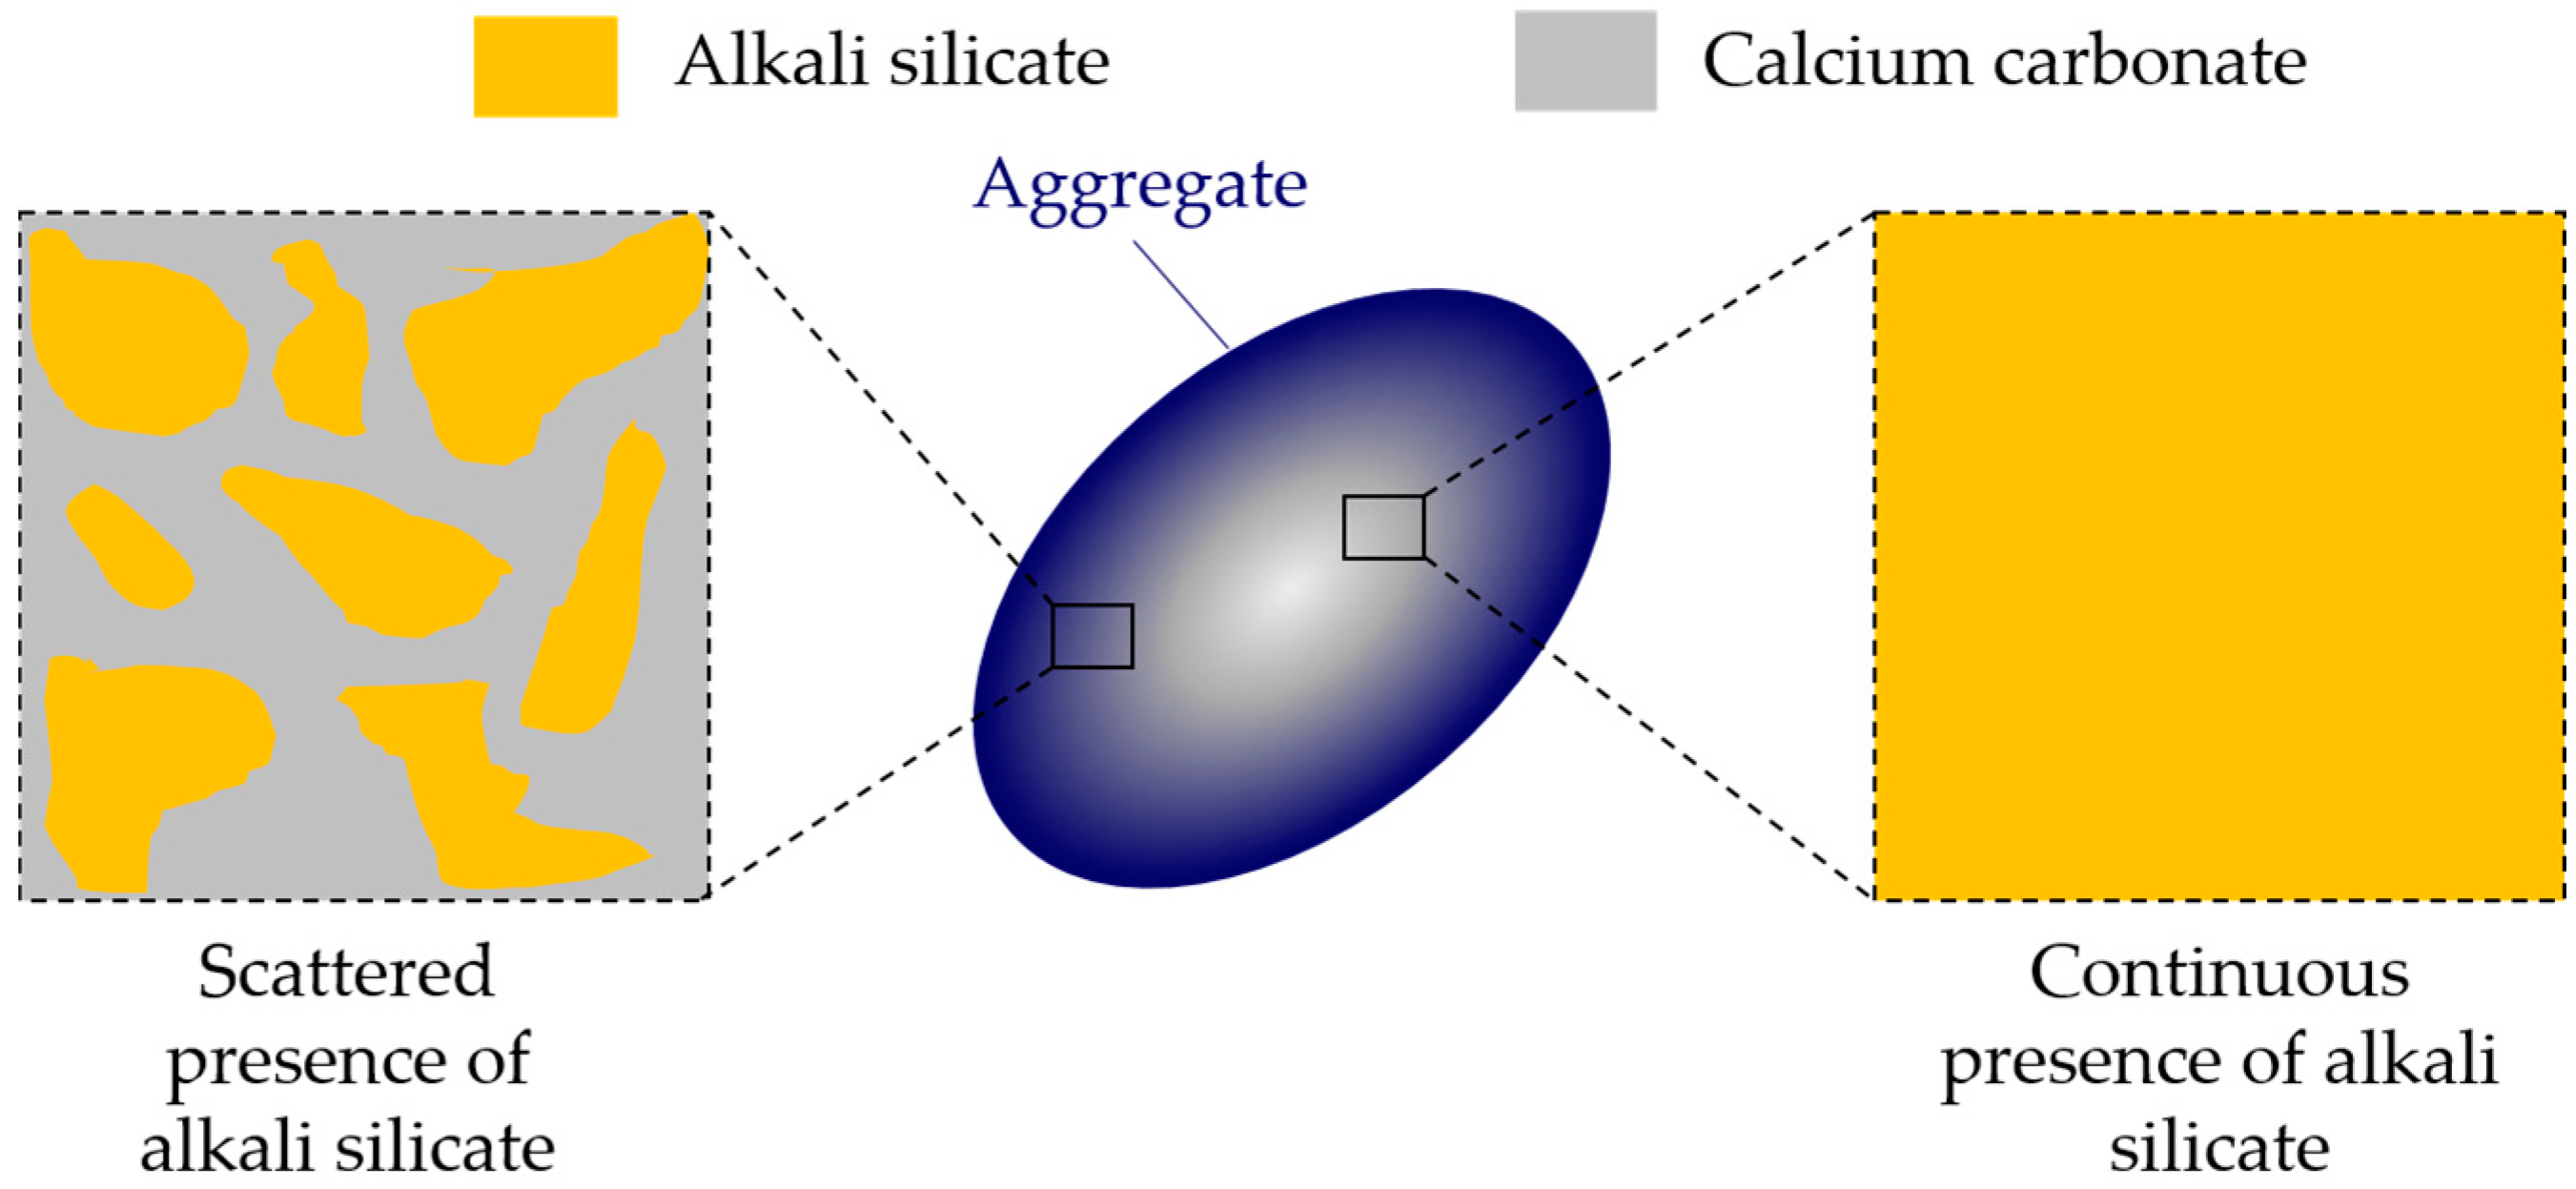
In the chemical model system of this study, pore solution is assumed to be the only source of calcium, consistent with the situation for aggregates like opal, chert and sandstone, where little calcium is present around the reactive silica in the aggregates. This leads to the formation of a continuous phase of alkali silicate, as shown in
Figure 4b. For the aggregates coming from calcareous rock, calcium is abundantly contained in the calcium carbonate surrounding the reactive silica. However, this kind of calcium cannot be considered as active as the one provided by the pore solution. Because calcium carbonate has an extremely low solubility in water at room temperature (about 13 mg/L, K
sp = 3.3 × 10
−9) compared to calcium hydroxide with its solubility at about 1.7 g/L (K
sp = 5.5 × 10
−6), therefore, this kind of calcium is actually “locked” in the calcium carbonate that surrounds the reactive silica in the calcium-rich aggregates. Accordingly, the calcium carbonate can be considered as an inert phase, which separates or even isolates the reactive silica in aggregates. In this sense, a continuous phase of alkali silicate shown in
Figure 4b and
Figure 17 will be altered into various regions of alkali silicate separated by the calcium carbonate phase, as shown in
Figure 17. Notably, each region of alkali silicate can still be considered as a continuous phase of alkali silicate at a smaller scale.
Bearing in mind that the findings in the present study are based on the chemical model system idealizing multiple physico-chemical reactions of ASR, directly applying those findings to real concrete might be misleading.


