1. Introduction
Hybrid Titanium Composite Laminates (HTCL) possess unique mechanical and thermal properties such as high specific strength and specific modulus, and superior strength at elevated temperature which makes them widely used for applications in high temperature components in the aerospace field [
1]. However, the difference in machinability of the titanium alloy and graphite composite components present difficulties in machining titanium graphite (TiGr) laminates with conventional methods [
2,
3,
4]. Some examples of machining difficulties include: extremely high tool wear rate caused by the abrasive nature of the reinforcement fibers, delamination, fiber pullout, and titanium burrs. Specifically, conventional drilling of HCTL has been seen to yield defects in the form of voids, poor surface quality on the interior surface of drilled holes, delamination of the face sheet material, and backside rupture of the Titanium lower face sheet [
5,
6,
7].
Electrical Discharge Machining (EDM) has proven itself a capable method for machining a variety of materials [
4,
8] and was successfully applied in machining titanium [
9,
10,
11,
12,
13], metal matrix composites [
14,
15,
16,
17] as well as ceramic composites [
4,
18,
19,
20,
21]. The ability of EDM to remove material without application of mechanical force has the possibility of eliminating many of the difficulties seen in conventional machining of composite materials such as drilling. Research into the proper settings for EDM of polymer matrix composites (PMCs) has shown that there is a very specific range of settings at which the workpiece can be machined [
4,
22,
23,
24,
25,
26,
27]. Ordinarily, for these materials, the matrix material is non-conductive; however, if the fiber material is conductive, the fibers can be used to generate sparks required for material removal by EDM. Positive polarity was found to produce minimum tool wear thereby increasing the quality of cuts in a polymer composite material. At higher currents (approximately 5 A and higher) defects such as undesirable thermal expansion of the fibers within the composite can result causing hexagonal shaped fibers, debonding between the fibers and the matrix material, as well as severe melting of the composite surface. At lower currents (<5 A), the quality of the features is commonly much higher [
22,
23,
24], fibers will more likely remain in an undisturbed state, and the heat affected zone surrounding the feature is usually greatly decreased. Along with current settings, the shape of the current pulse can also affect the quality of the features created [
23]. Varying the lengths of time dedicated for sparking and those dedicated for flushing the molten workpiece material can have significant effects on cutting time as well as surface finish. Having too long a delay between sparks can result in lengthened cutting times as well as the possibility of shorting between the workpiece and tool [
26,
27]. If the pulse delay is too short, the material will not have adequate time to be properly flushed, which can result in material being deposited on the tool, or recast on the workpiece. Either of which will decrease the machining efficiency, as well as decrease the quality of the cut. These defects can be avoided if the energy used for processing is kept low enough; however, this was noted to extend the cutting time [
21,
22,
24,
26,
27]. In summary, when properly applied, it has been demonstrated that composite materials can be machined using EDM [
28]. However, EDM applied to hybrid thermoplastic composite materials has not yet been researched. This paper presents the first results of using EDM to produce holes in TiGr.
The objective of this paper is to investigate the use of EDM on a particular type of HTCL, known as TiGr (Titanium Graphite). TiGr, as used in this study, is comprised of two outer plies of titanium sheets that sandwich a composite core. The composite core is a high-temperature thermoplastic matrix material, PIXA-M, that is reinforced with IM-6 graphite fibers. Able to withstand temperatures up to 177 °C, the core is intended to provide good fatigue resistance and improve the strength to weight ratio, while the outer layers of titanium protect the PIXA-M from environmental weather concerns and from impact. The workpiece material removal rate (MRR), tool material removal rate or tool wear rate (TWR), surface roughness, and quality hole geometry are the four important machinability criteria with economic implications. To date, no research has been conducted that characterizes EDM machinability of this material. Therefore, the purpose of this study is to evaluate EDM machinability by varying EDM process conditions, namely, the effect of peak current, pulse time, and percent on-time on work piece material removal rate, tool wear rate, and surface quality.
2. Experiment Setup and Methodology
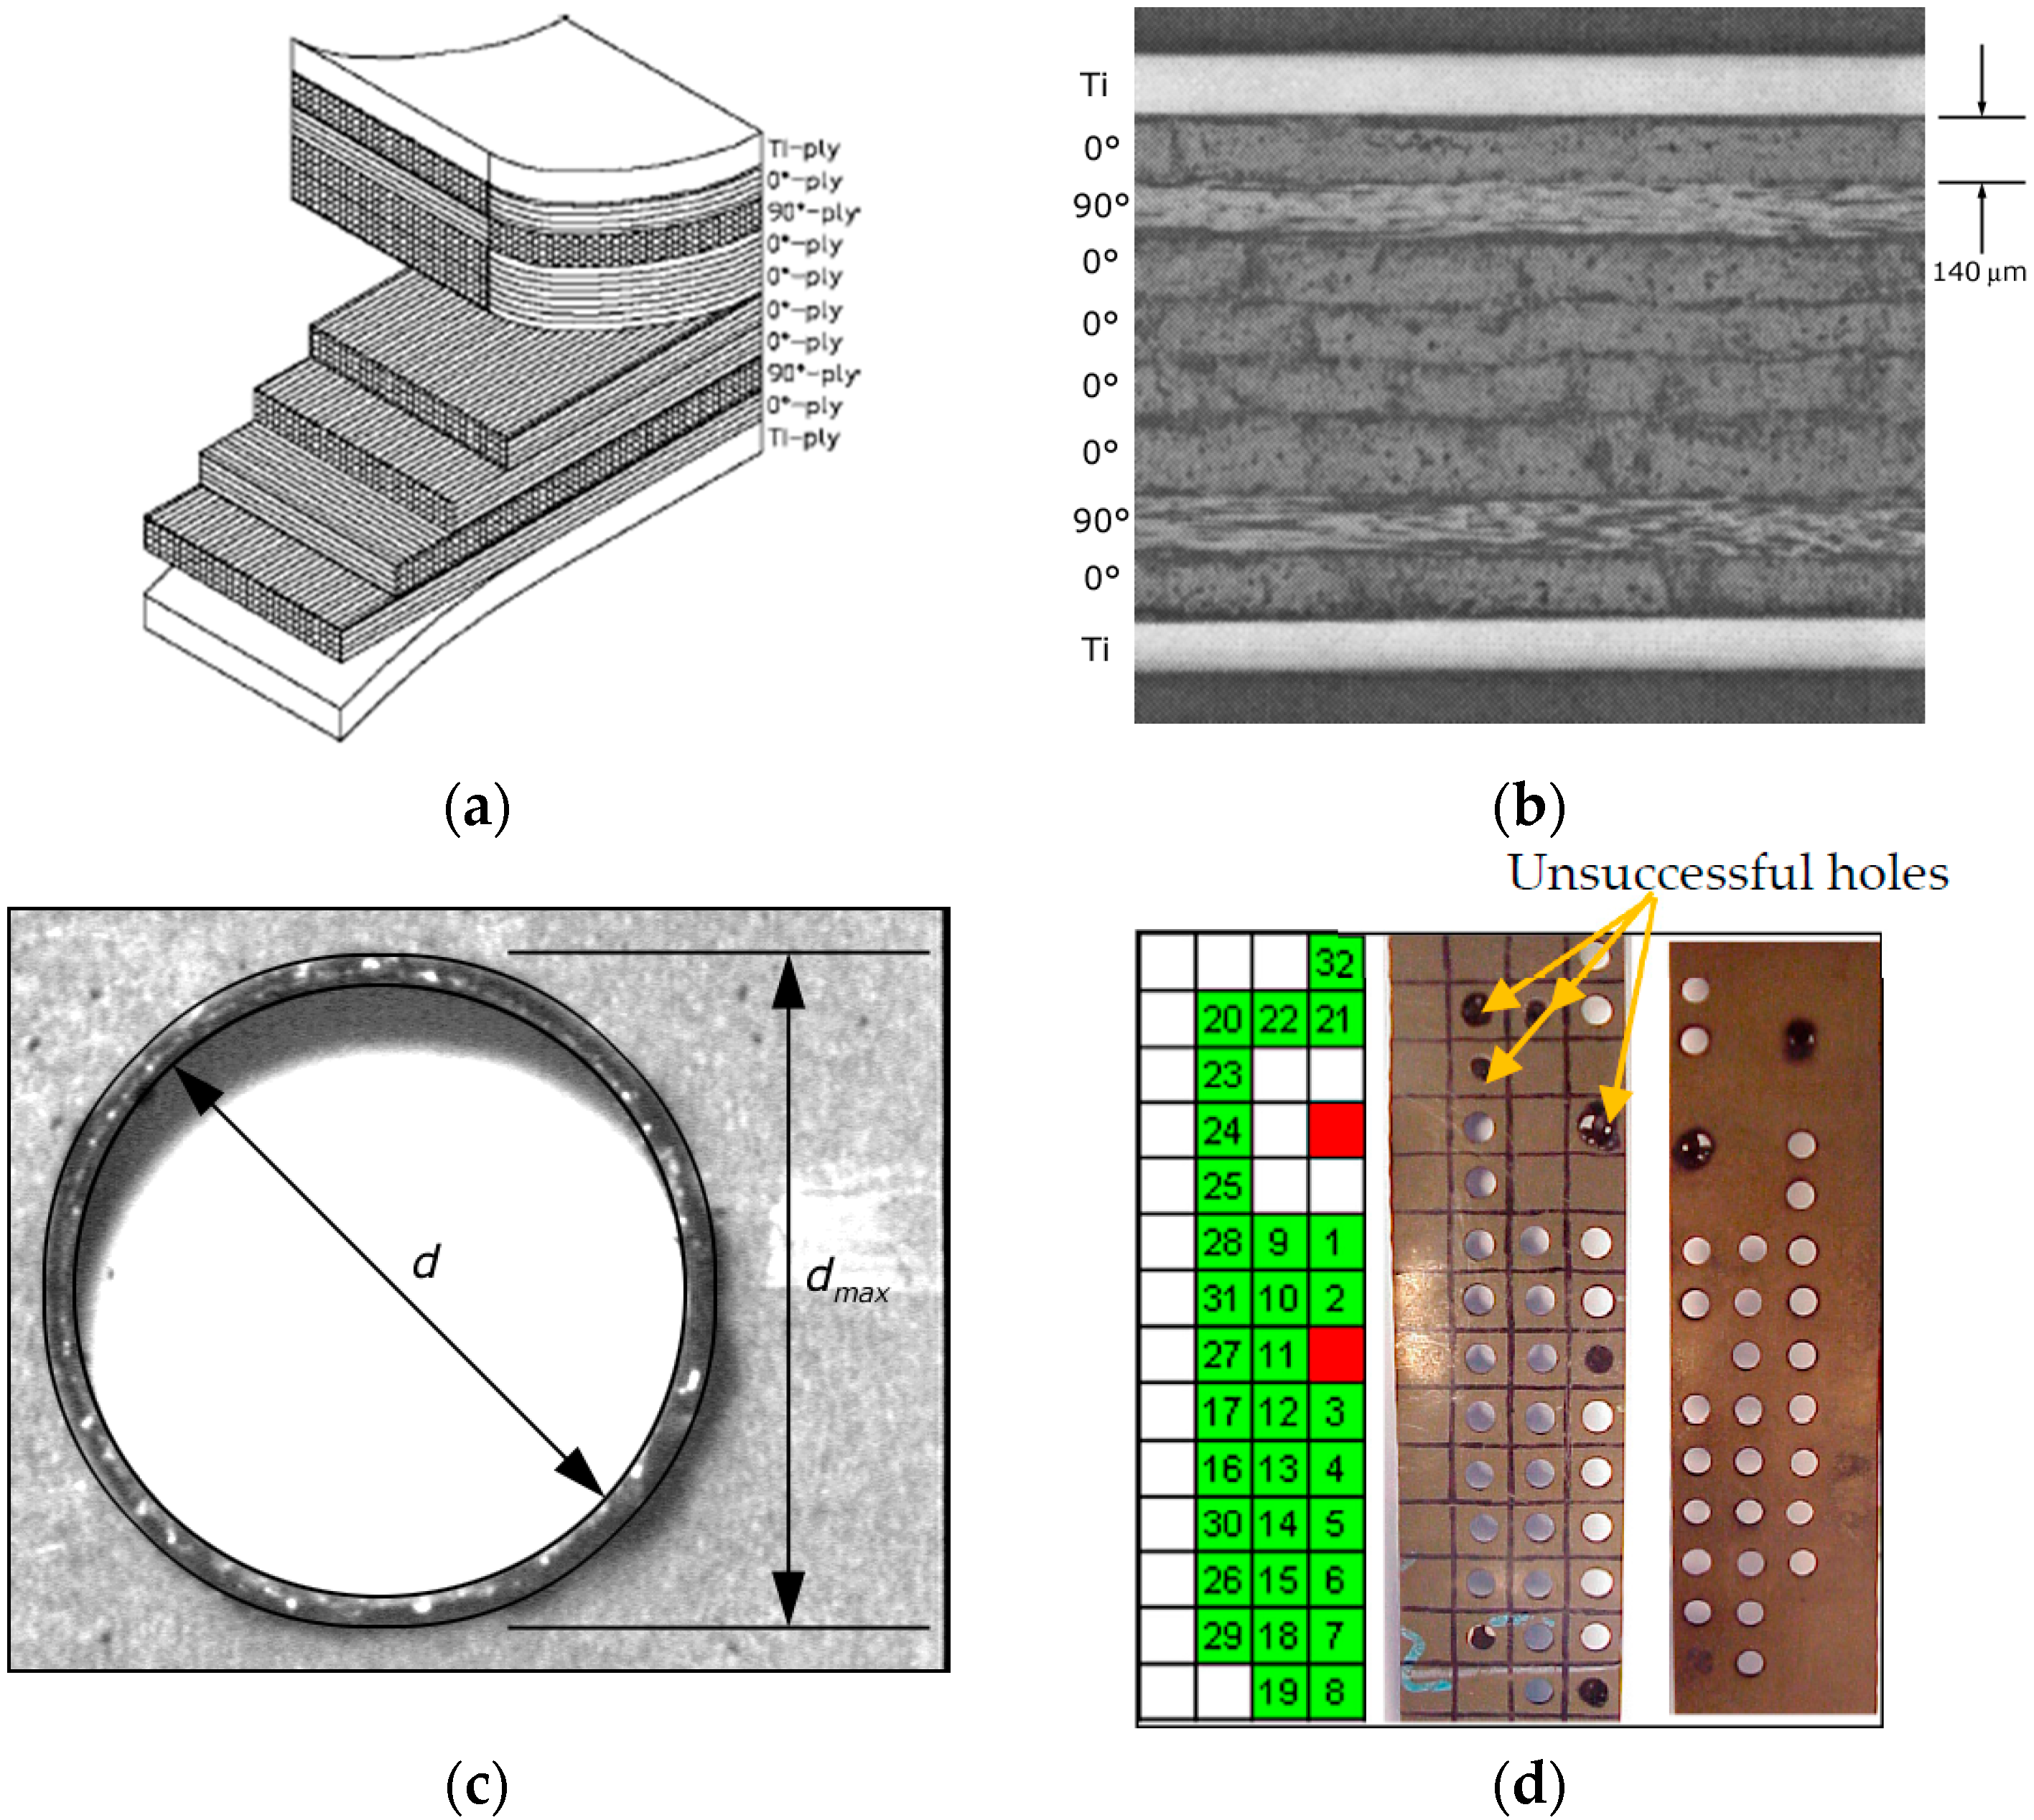
A TiGr workpiece with dimensions 304.8 mm × 304.8 mm × 1.4 mm was utilized in this investigation with details of the autoclave consolidation process used for fabrication described in references [
1,
2]. A 50.8 mm × 304.8 mm test specimen of this material was sectioned utilizing a diamond coated abrasive band saw blade. The TiGr workpiece is made up of two surface plies of Ti with eight plies of PIXA-M thermoplastic polyimide resin (Mitsui Chemicals, Tokyo, Japan) and IM7 intermediate modulus graphite fiber (Hexcel, Yokohama, Japan), with a ply thickness of approximately 140 micrometers. The continuous fibers in the PIXA-M had an approximate diameter of 6 micrometers. These plies were laid out with the following symmetric stacking sequence: {Ti,(0, 90, 0, 0, 0, 0, 90, 0),Ti} as shown both schematically (
Figure 1a) and with a photomicrograph (
Figure 1b) in
Figure 1. The resistivity of the carbon fibers is 9.5–18 µΩ·m. Matrix material’s resistivity is less than 1 × 10
−6 ohm
−·m and titanium have a resistivity of 1.47 × 10
−6 ohm
−·m [
28,
29,
30]. The exact conductivity or resistance depends on the modulus of the fiber. In general, high modulus fibers have lower resistance and low modulus fibers have higher resistance. Typical material properties for the TiGr material used in this investigation are given in
Table 1.
The tool material used in the experiments was 6.35 mm diameter copper 110 H04 round stock. Copper electrode material was selected based on the reported machining efficiency and minimum tool wear in drilling titanium [
9,
10,
11] and polymer composites [
22,
24,
25,
26,
27]. The tool density was 8.91 gm/cm
3 with a melting point of 1083 °C. Copper was chosen due to its low electrode wear rate, high quality surface finish, and material removal rate (MRR) when applied to EDM of graphite composite materials, as well as its low cost and its ease of availability. A Hansvedt Benchman EDM M-Pulse CNC machine (Hansvedt, Chicago, IL, USA) was utilized for the experiments. The dielectric fluid used in this machine was Rust-Lick EDM-250 (Hansvedt, Chicago, IL, USA), which has a dielectric strength of 47 kV and a viscosity of 0.01 P. The workpiece and tool were both submerged in the EDM tank, and two nozzles at 137.9 kPa placed approximately 12.7 mm from the spark gap flushed the cut.
Spark energy is the product of peak current, percent on-time and pulse duration. Since these process variables can be readily adjusted, machining conditions using positive polarity, were selected based on the reported literature for polymer composites [
23,
24,
25,
26,
27,
28]. Hence, these three principle EDM parameters were selected for this study also and the experiments were established upon full factorial design of these parameters. In order to determine optimal values for drilling the TiGr material, a 3-factorial design of experiments (DOE) was setup using Design Expert 6 software [
32]. Factors and levels are given in
Table 2. The makeup of this experimental design consisted of three variables, namely, peak current in amperes (A), percent on-time (duty factor = t
on/(t
on + t
off)), and pulse time in microseconds (µs); each with three levels. The machining parameters and drilling conditions were chosen based on literature [
8,
9,
10,
11,
12,
20,
21,
22,
23,
24,
25], and compromised selection. Past reported studies showed that pulse geometry and magnitude were the most relevant parameters to achieve desirable features using EDM. The remaining variables capable of being adjusted were kept constant throughout the experimental runs through machine settings. Machine settings used in the experiments are given in
Table 3. The responses considered are workpiece material removal rate, tool wear rate, surface quality, and damage. The experimental design employed is given in
Table 4.
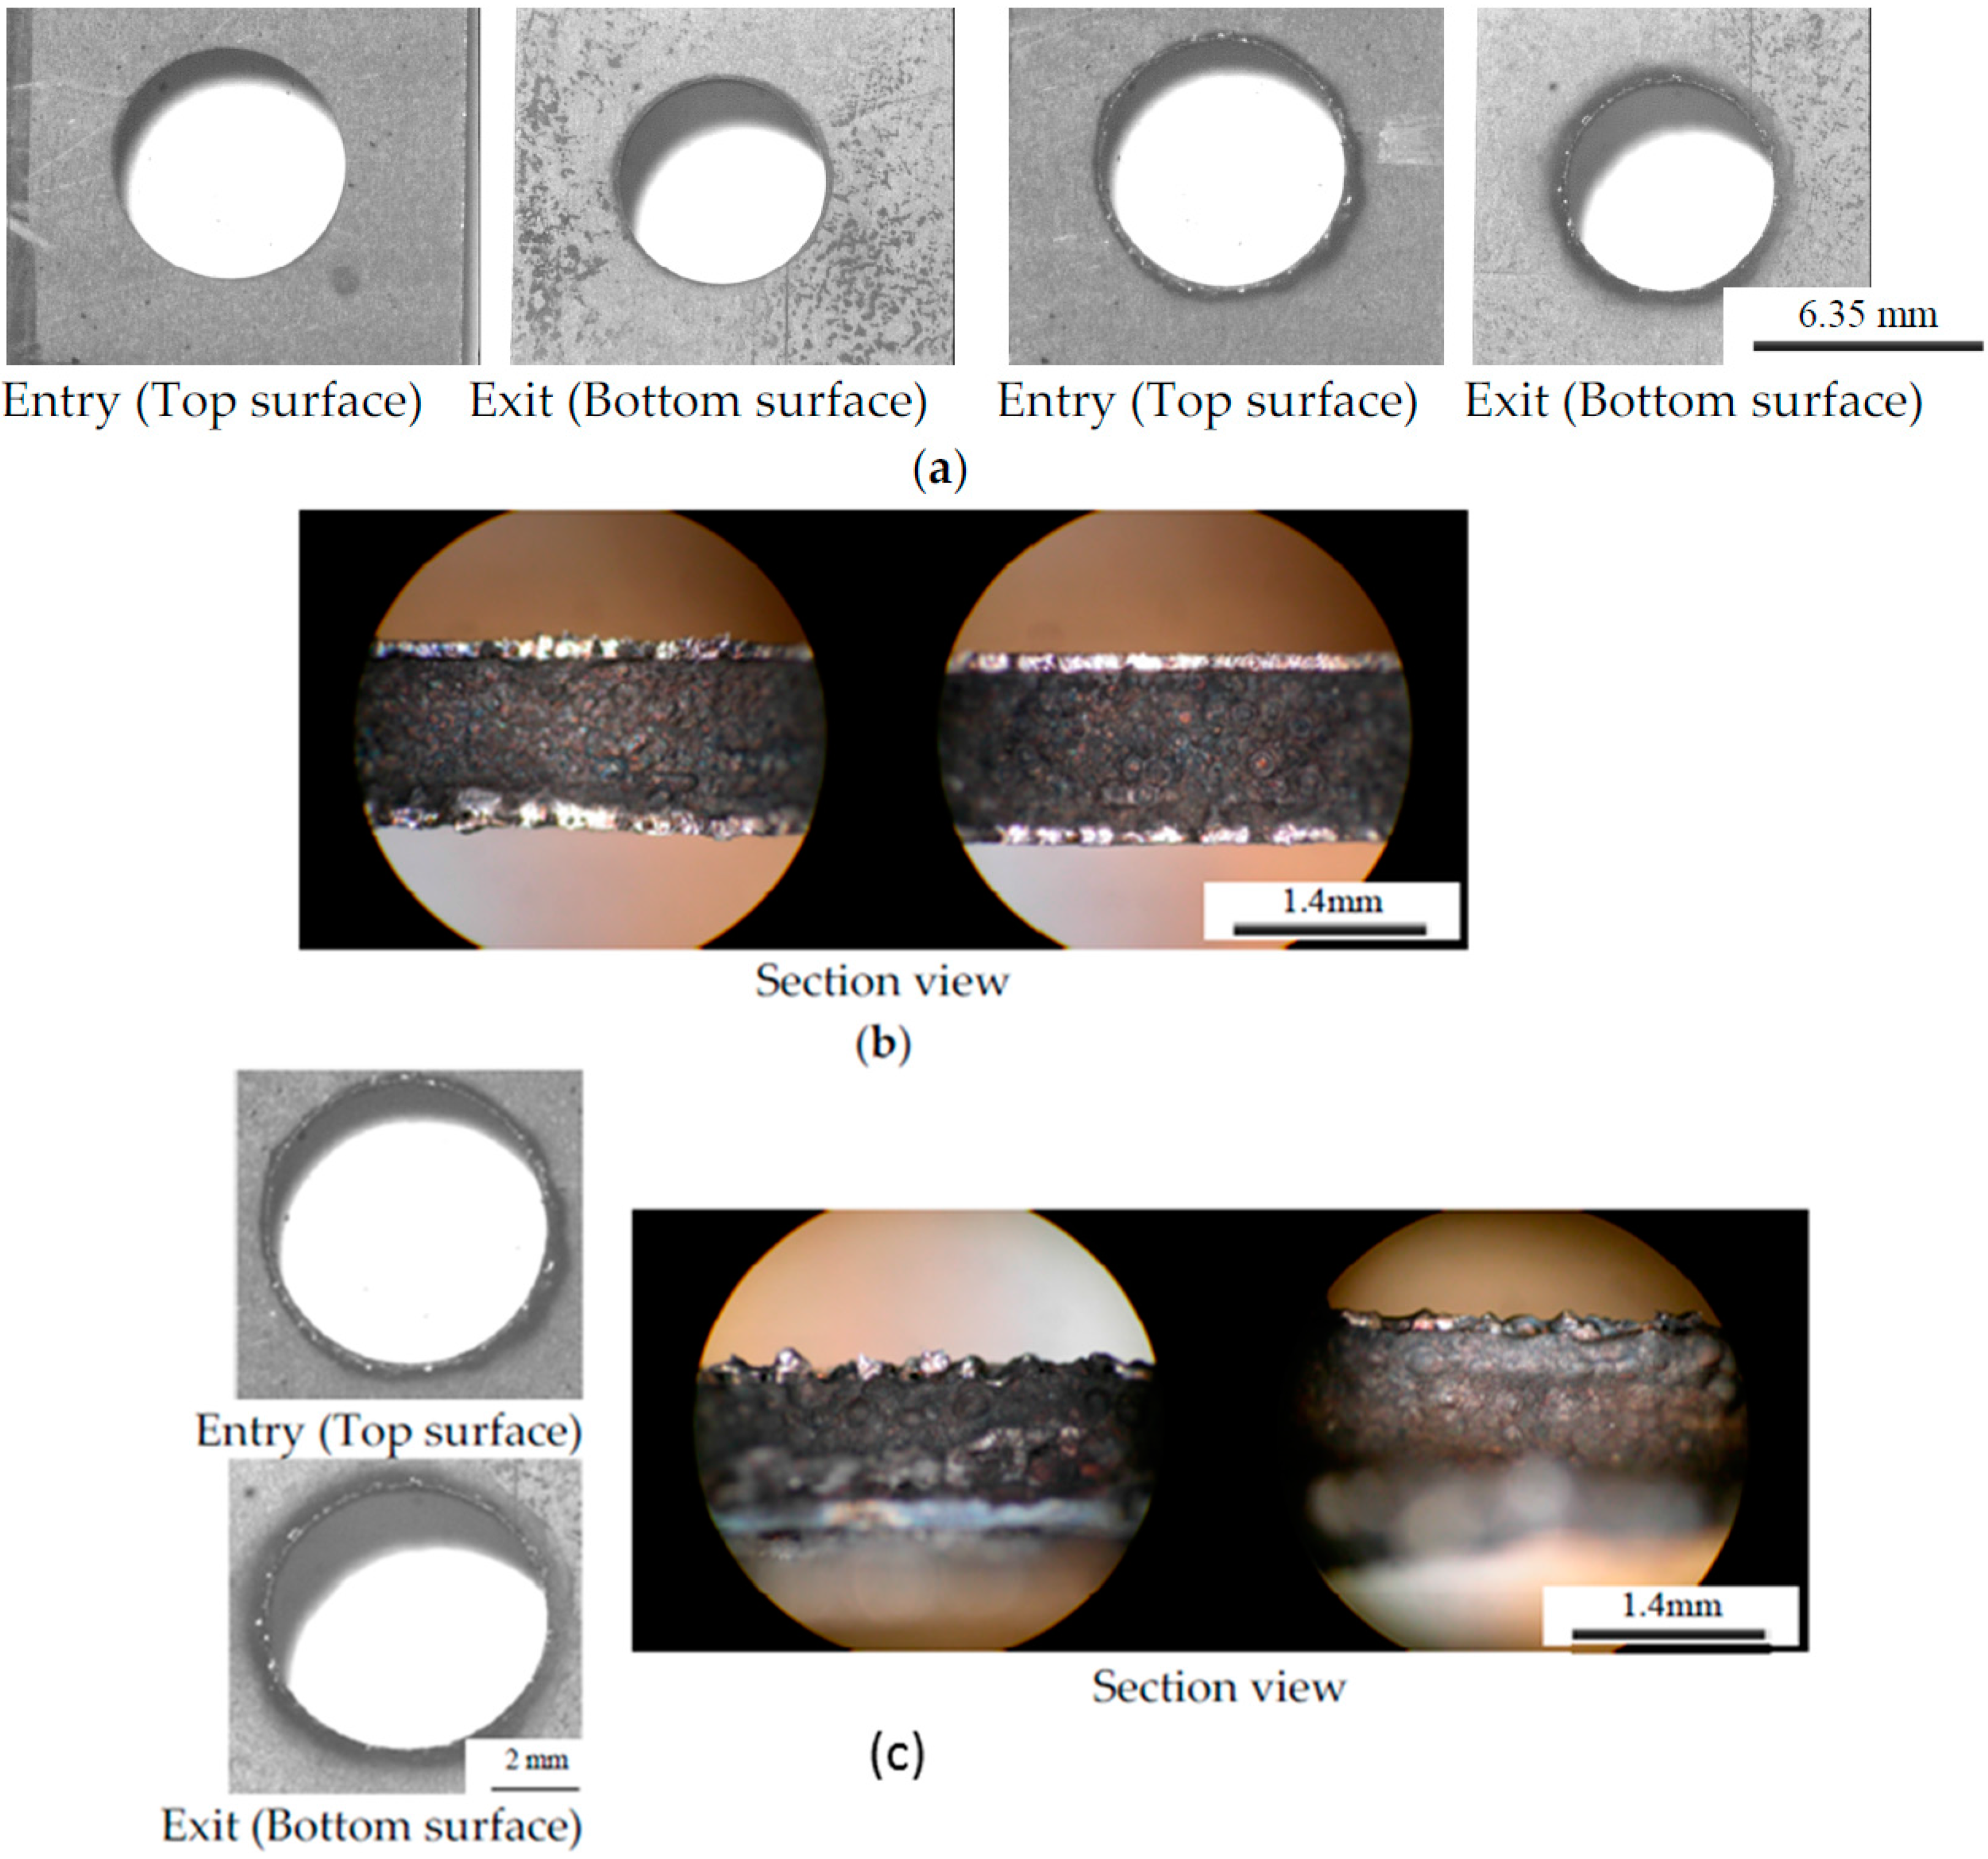
Material Removal Rate (MRR) is defined as the volume of material removed per unit cutting time. Tool wear rate (TWR) is defined as the change in volume of the tool material per unit cutting time. The volume change was calculated by determining the tool’s mass prior to and following the drilling process on a Mettler AE240 Scale (Mettler, Oakland, CA, USA). With known density of the tool material, the change in tool volume can be determined. Sinker EDM hole quality was evaluated in terms of taper, damage ratio, recast layer, and surface roughness. The damage ratio is defined as (d
max/d) where d
max is the damaged diameter and d is the hole diameter as defined in
Figure 1c. EDM hole production layout is shown in
Figure 1d. Measurement was conducted utilizing black and white micrographs of each drilled hole. The discoloration and burr formation on the titanium surface are used to define the damage diameter with measurement process similar to the method used by Guu et al. [
22].
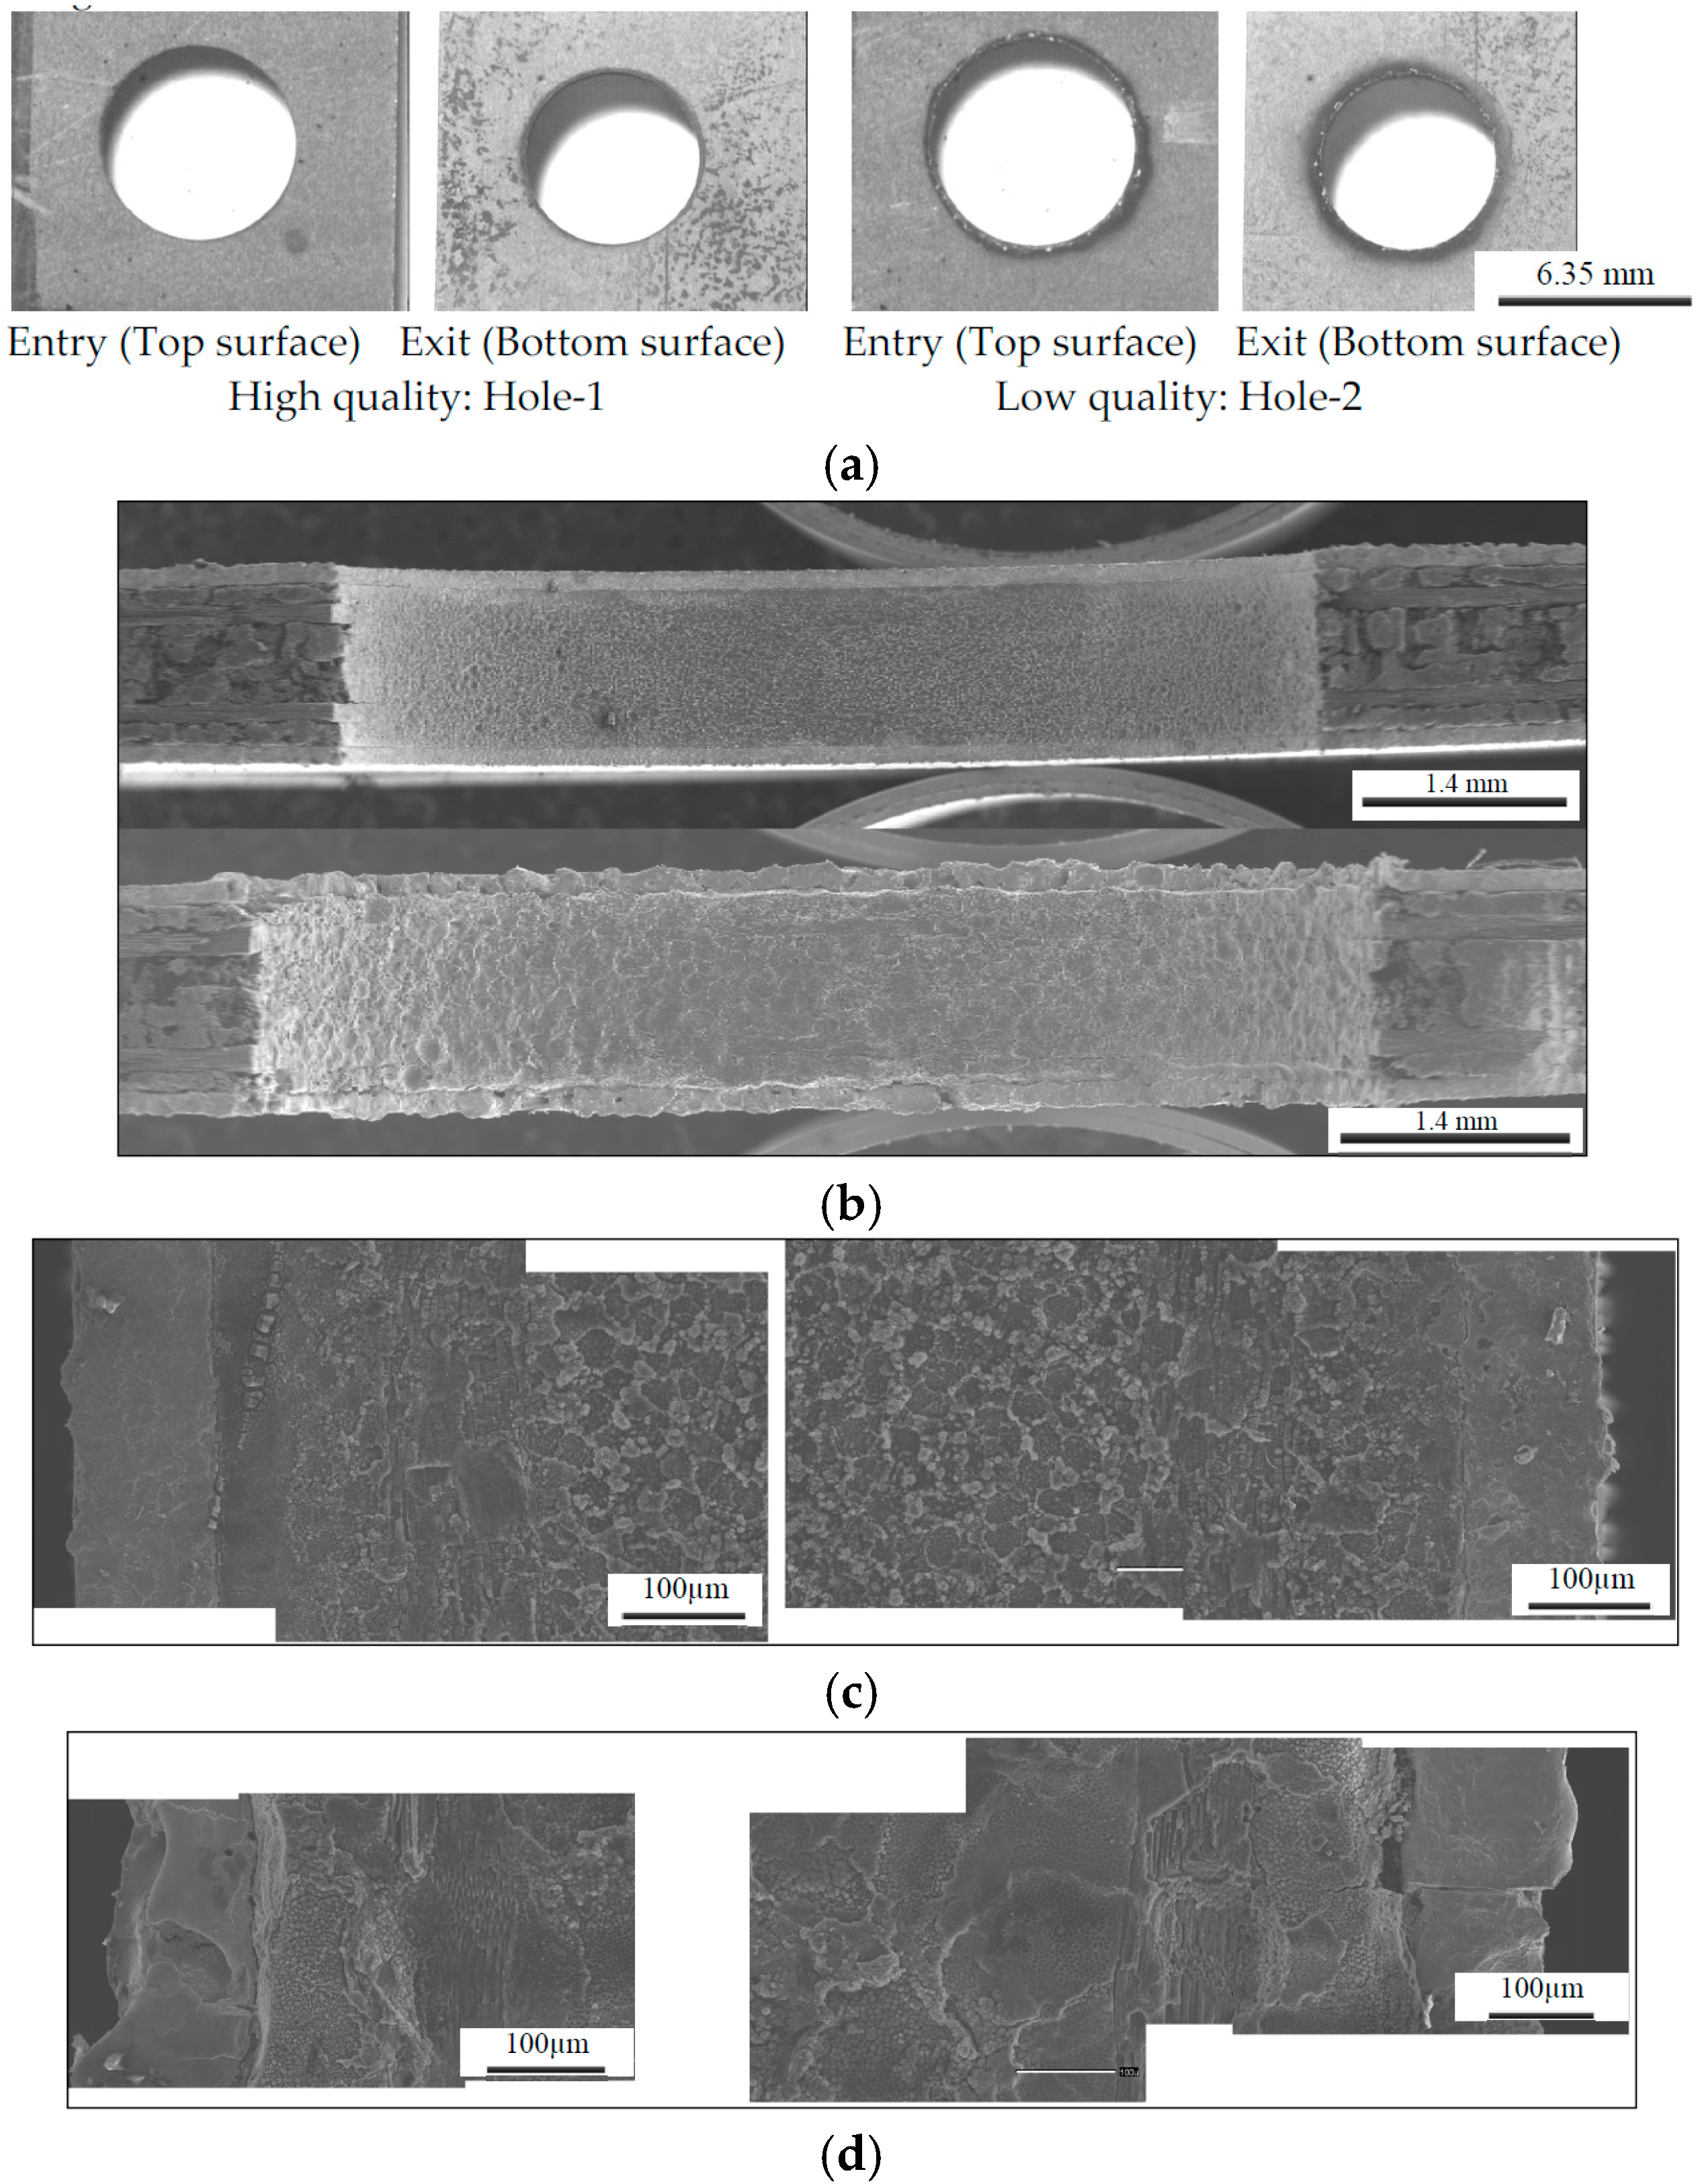
Following the damage ratio measurement, the specimen was sectioned exposing the interior surfaces of the holes. An optical microscope was used to take macrographs of the interior surfaces of each of the holes at 50× magnification. The macrographs of the drilled samples were analyzed for any visible damage to the material. From these macrographs, the highest quality hole and lowest quality hole were selected and set aside for imaging using a scanning electron microscope (SEM). After being imaged with the SEM, average roughness measurements were taken of all of the samples using a Taylor-Hobson Surftronic 3 (Taylor Hobson, Leicester, UK) with a cutoff of 0.01 microinches and a traverse distance of 0.5 mm.
Based on a design of experiments approach, a statistical analysis of variance (ANOVA) is performed in order to determine the effects of each of the variables that are statistically significant on each of the responses analyzed. In order to develop a statistical model of machining behavior of the cuts, measured data was examined and fitted using a multiple linear regression model of the form: in which the following are the coefficients:
= Constant;
= First order or linear effect;
= Second order or quadratic effect;
= Interaction effects.
The variables are the parameters and denoted as follows: = Pulse time (micro seconds); = Percent on time (% micro seconds); = Peak current (ampere).
The response equations for Workpiece Material Removal Rate, Tool Removal Rate or Tool Wear Ratio, Surface Roughness and Damage Ratio, follow in the next section. Depending on the model used to fit the data, individual effects and interaction effects can be determined as significant with respect to each response. Once these are determined, an equation is generated using the various effects to fit the specified model.
3. Results
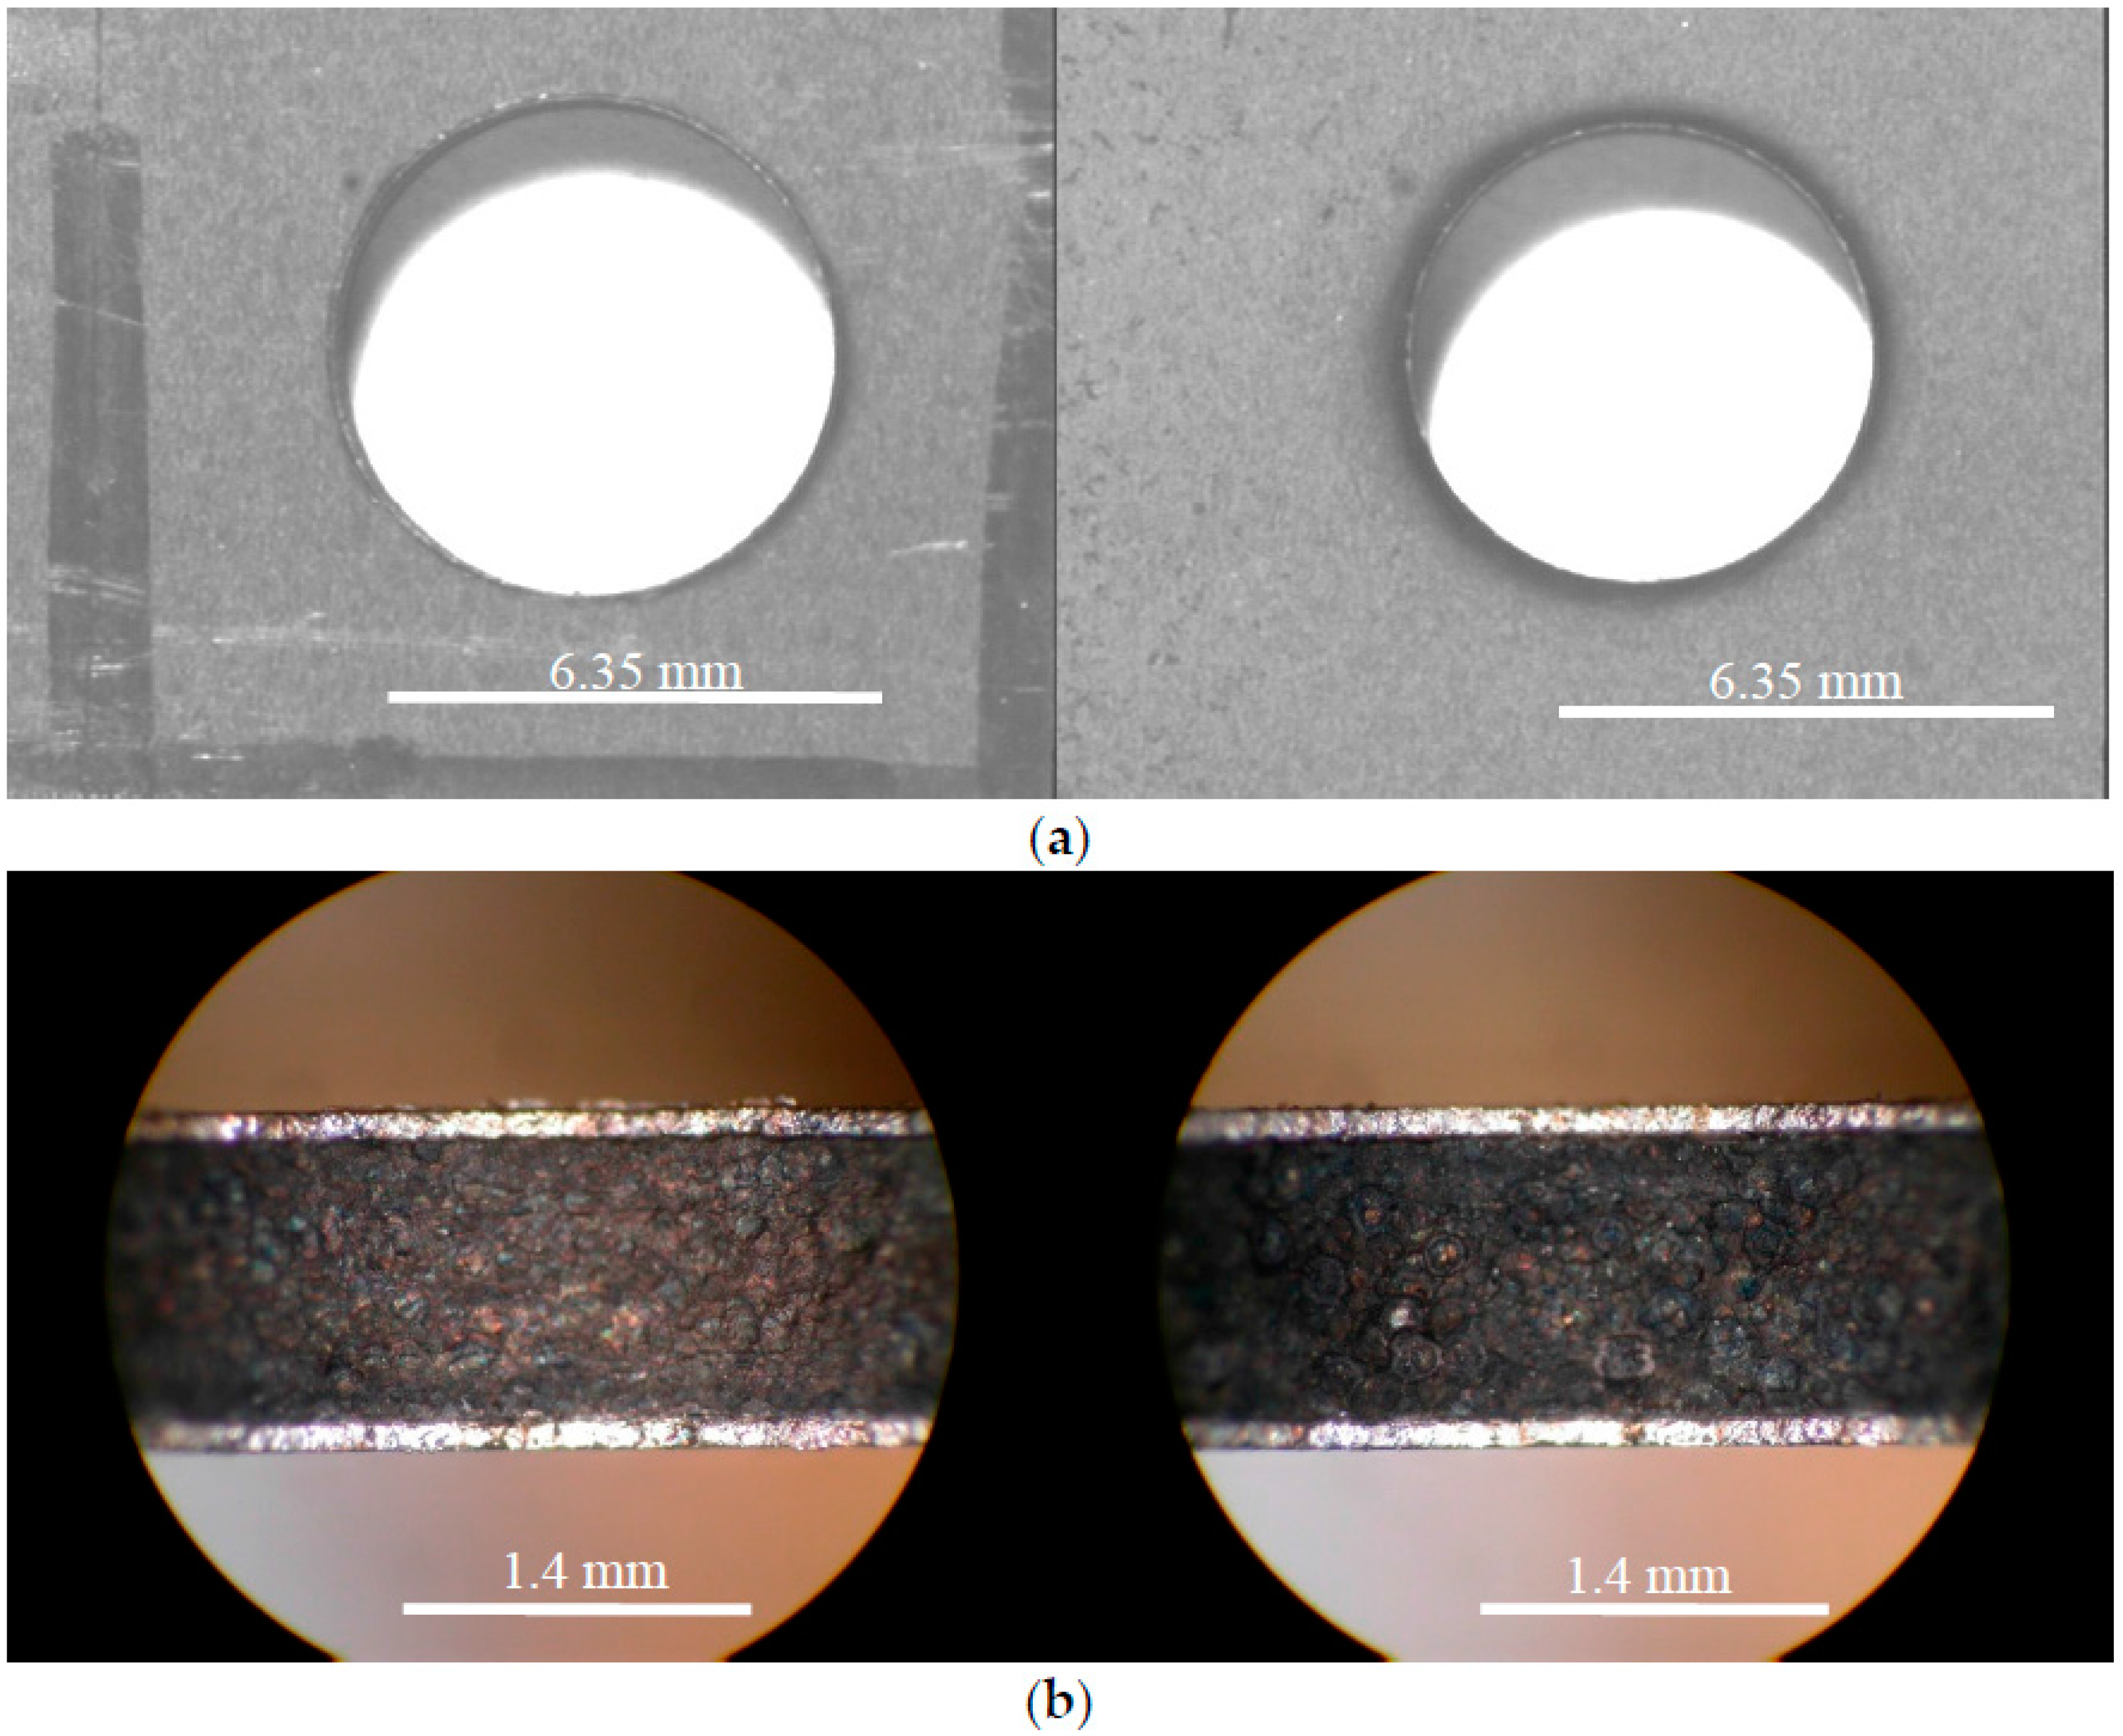
Photo-macrograph of 32 holes drilled using a die sinker EDM is shown in
Figure 1d. Typical high quality, poor, and failed holes are shown in the
Figure 2 with the associated EDM machining conditions. Unlike conventional drilling the top and bottom titanium ply was free of burrs in quality hole (Hole-1) and damage and heat affected zone for poor ones (Hole-31, 20). Good quality holes were associated with peak current of 2 A as seen
Figure 2a. It should also be noted that some of the holes were stopped prior to completion. Hole-8, 20 (
Figure 2c), 22, and 23 were stopped due to buildup of re-deposited material resulting in a short between the workpiece and tool. Hole-29 was stopped due to the excessive time required. An example sample of very poorly machined Hole-31 (
Figure 2b), and failed Hole-20 (
Figure 2c) optical micrographs are shown in
Figure 2. Note the thermal damage and heat effected zone (dark zone) in titanium layer both at the tool entry, exit positions. Severe damage can be seen in micrographs of sectioned hole walls
Figure 2a,b. Cutting time was recorded for each holes cut, and not surprisingly, more rapid drilling was associated with those cuts which were performed at a higher peak current. Note that the 50% On-Time maintained the most rapid cuts through all current settings; as the peak current increased, the longer pulse time allowed for the higher volume of melted material to be more effectively removed.
3.1. Material Removal and Surface Topography
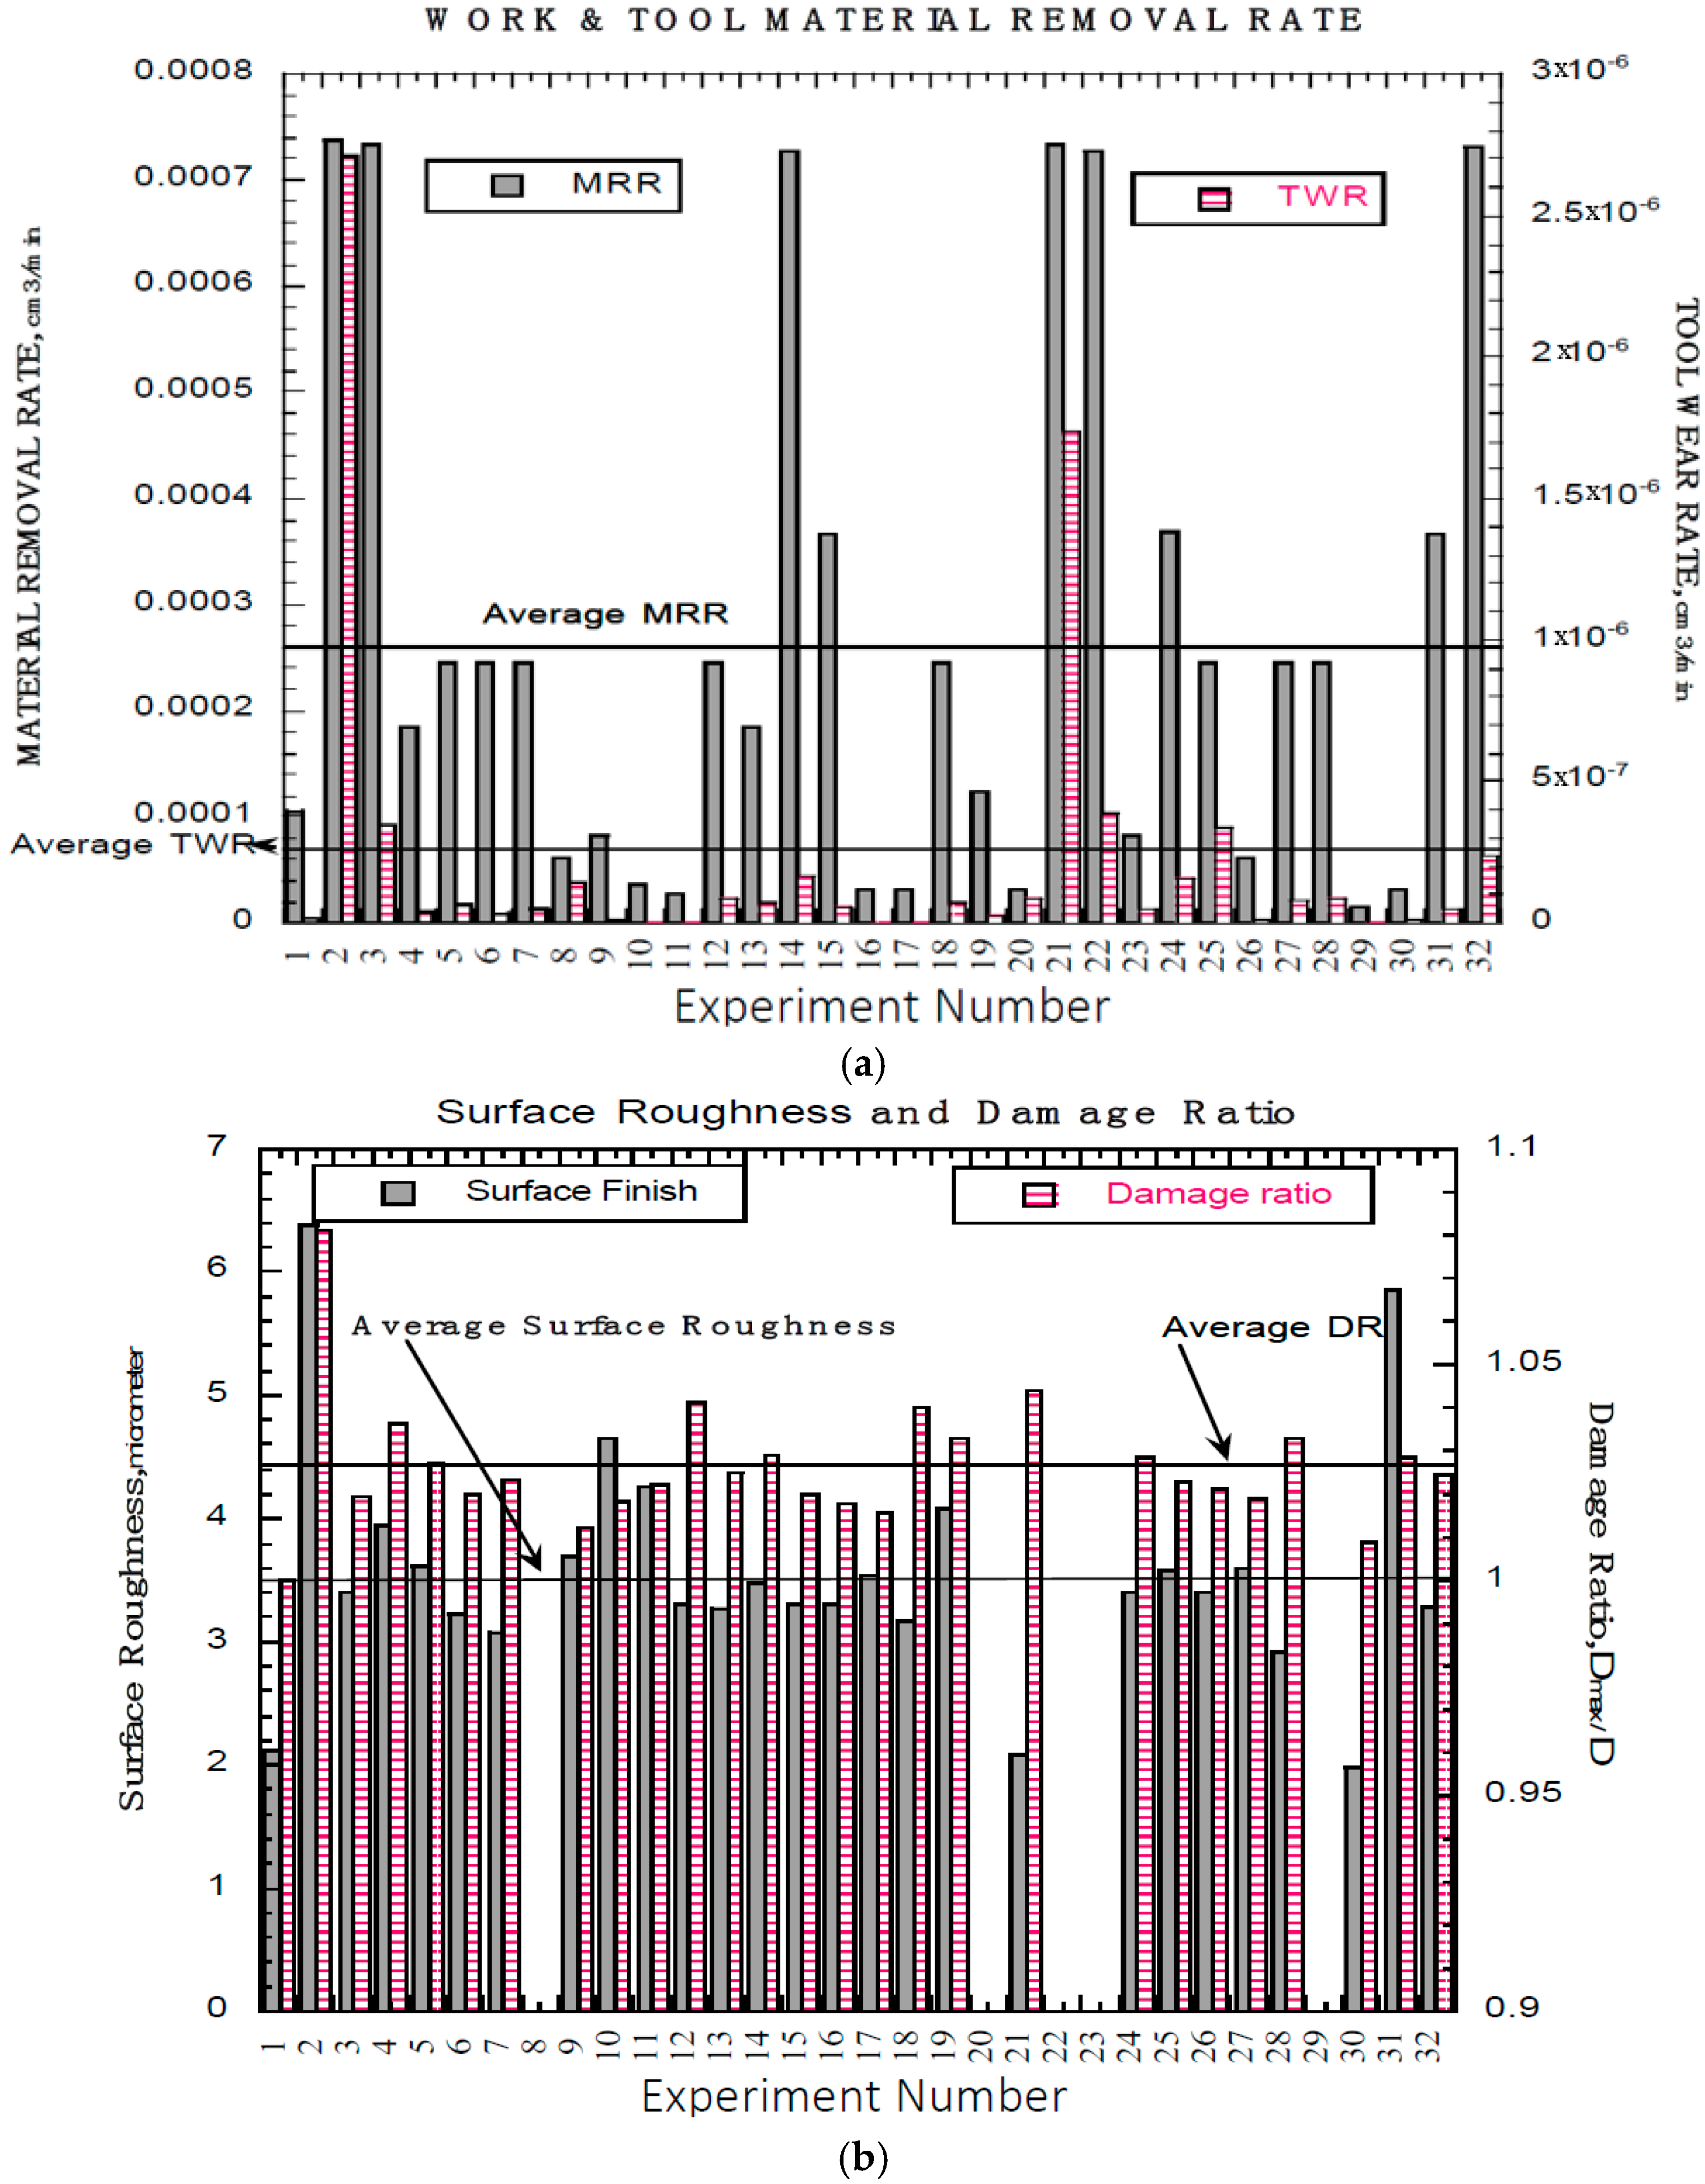
The machinability in terms of MRR, TWR, surface roughness and damage ratio data generated from the production of these holes was recorded and is presented in
Figure 3. As can be seen
Figure 3a, the holes-2, 3, 14, 21, 22, and 32 have produced high MRR and was found to be associated with higher peak current (11 A). At lower current (2 A), MRR was very low and the fibers were not disturbed regardless of its orientation to the cutting direction. Interestingly, MRR of holes-15, 24 and 31 was 3.67 × 10
−4 cc/min. At maximum peak current with longer pulse time allowed for the higher volume of melted material to be more effectively removed. The maximum, average and minimum MRR was found to be 7.37 × 10
−4, 2.6 × 10
−4 and 2.73 × 10
−5 cc/min respectively. In all experiments the TWR was very low with positive polarity regardless of the pulse on time and the % on-time, when the peak currents of 2 A and 5 A. Highest TWR was found to be 1.74 × 10
−6 and 2.71 × 10
−6 cc/min for the Holes-2 (400 µs, 75%, 11 A), and 21 (25 µs, 25%, 11 A) respectively as can be seen in
Figure 3a. The lowest TWR of 1.90 × 10
−8 cc/min, and it was for the Hole-1 (25 µs, 50%, 2 A).
The surface roughness and damage ratio vs. hole number or experiment number is shown in
Figure 3b. The surface roughness ranged from 1.98–6.38 µm and damage ratio from 1.0–1.08, for all the experiments. The average surface roughness and damage ratio shown as solid straight line in
Figure 3b are 3.5 mm and 1.03 respectively. As the peak current increased the surface roughness increased. All of these experimental observations are consistent with others [
22,
24,
26].
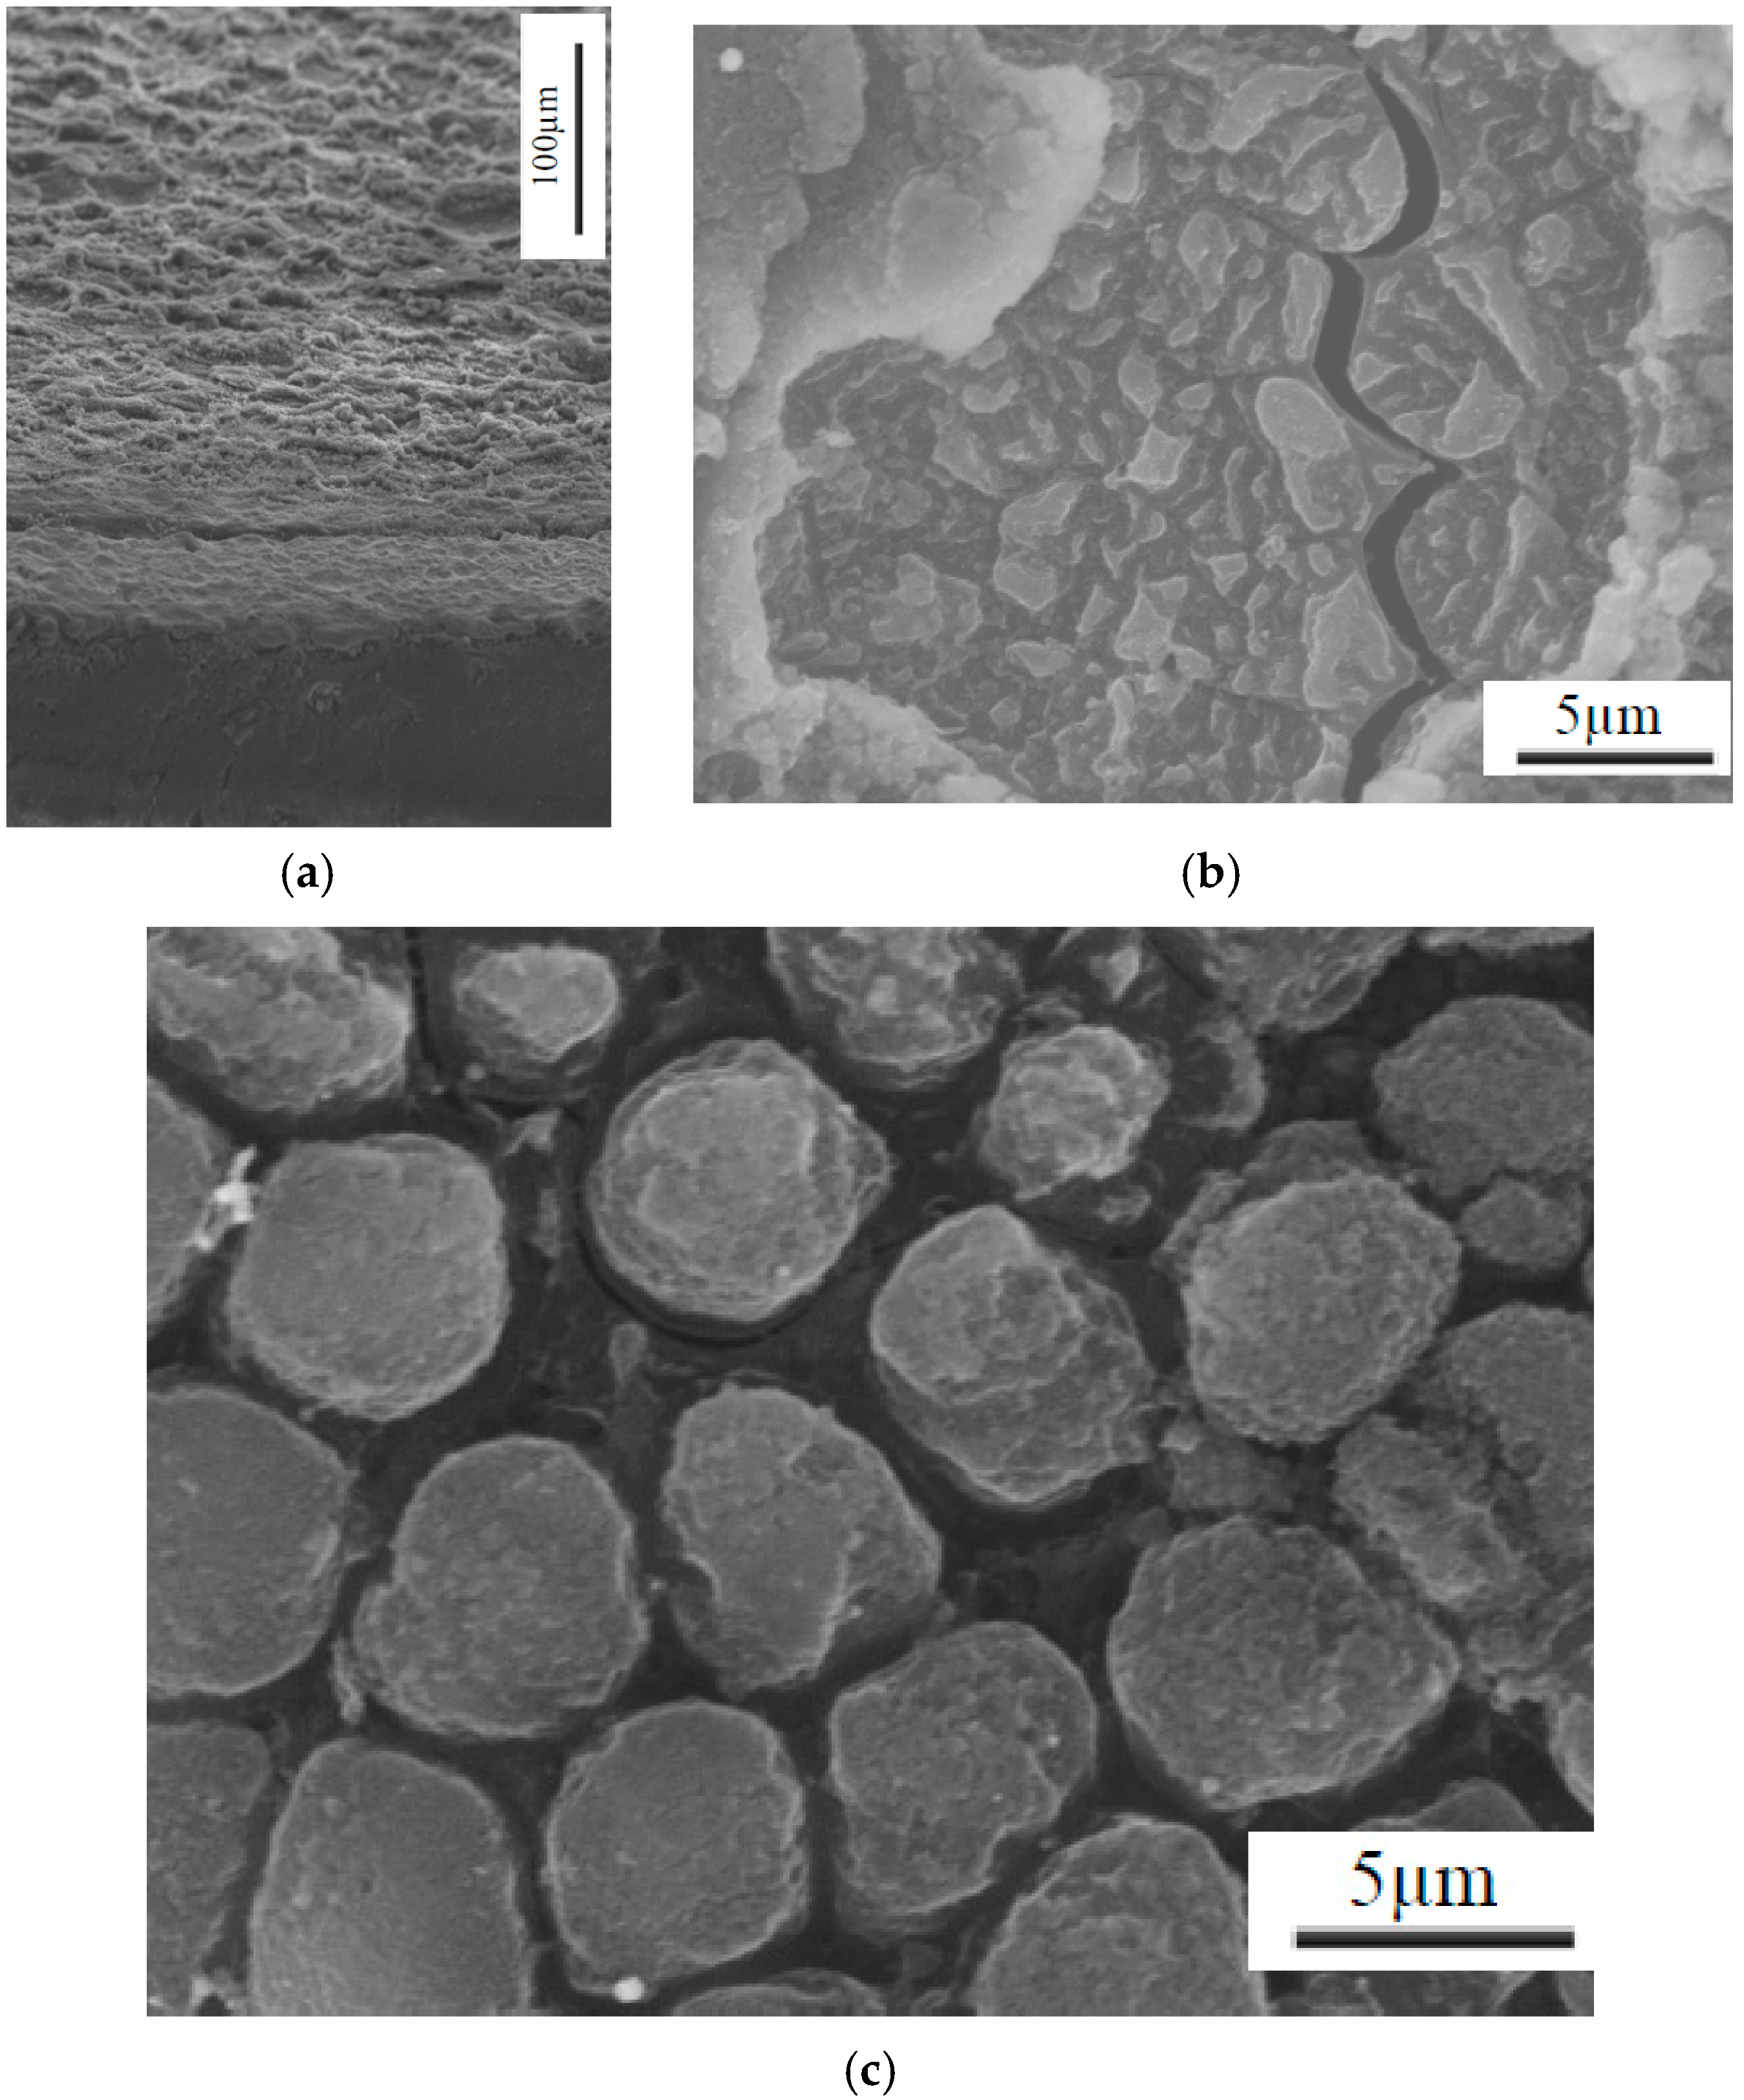
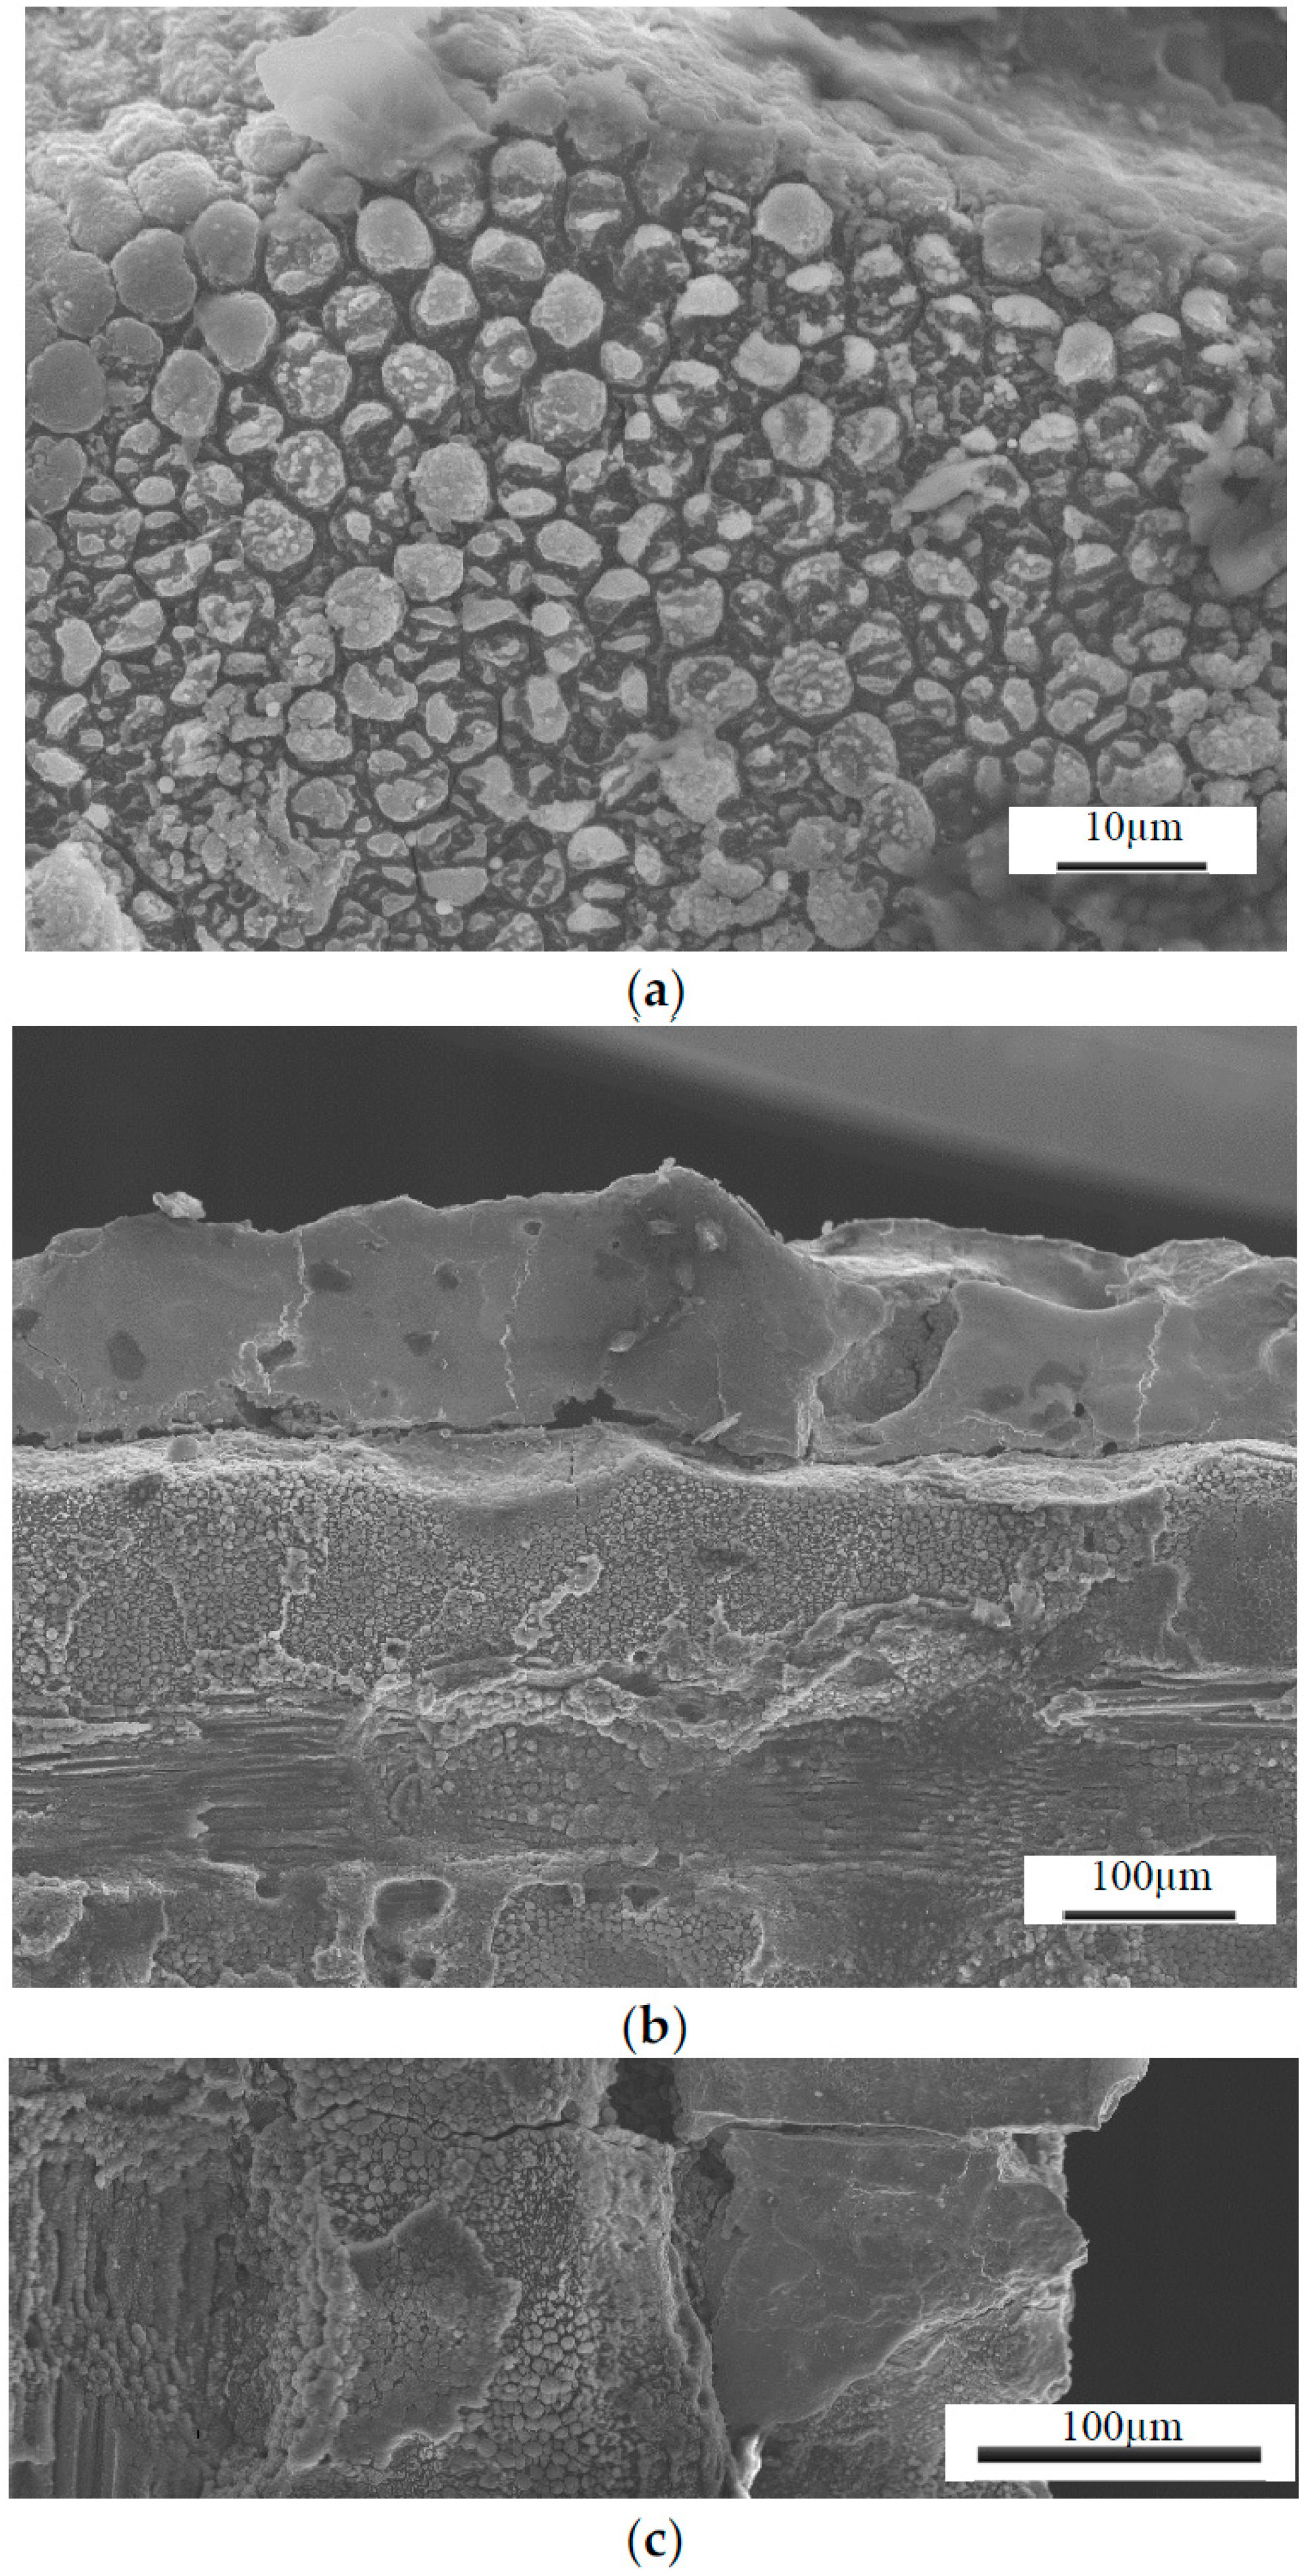
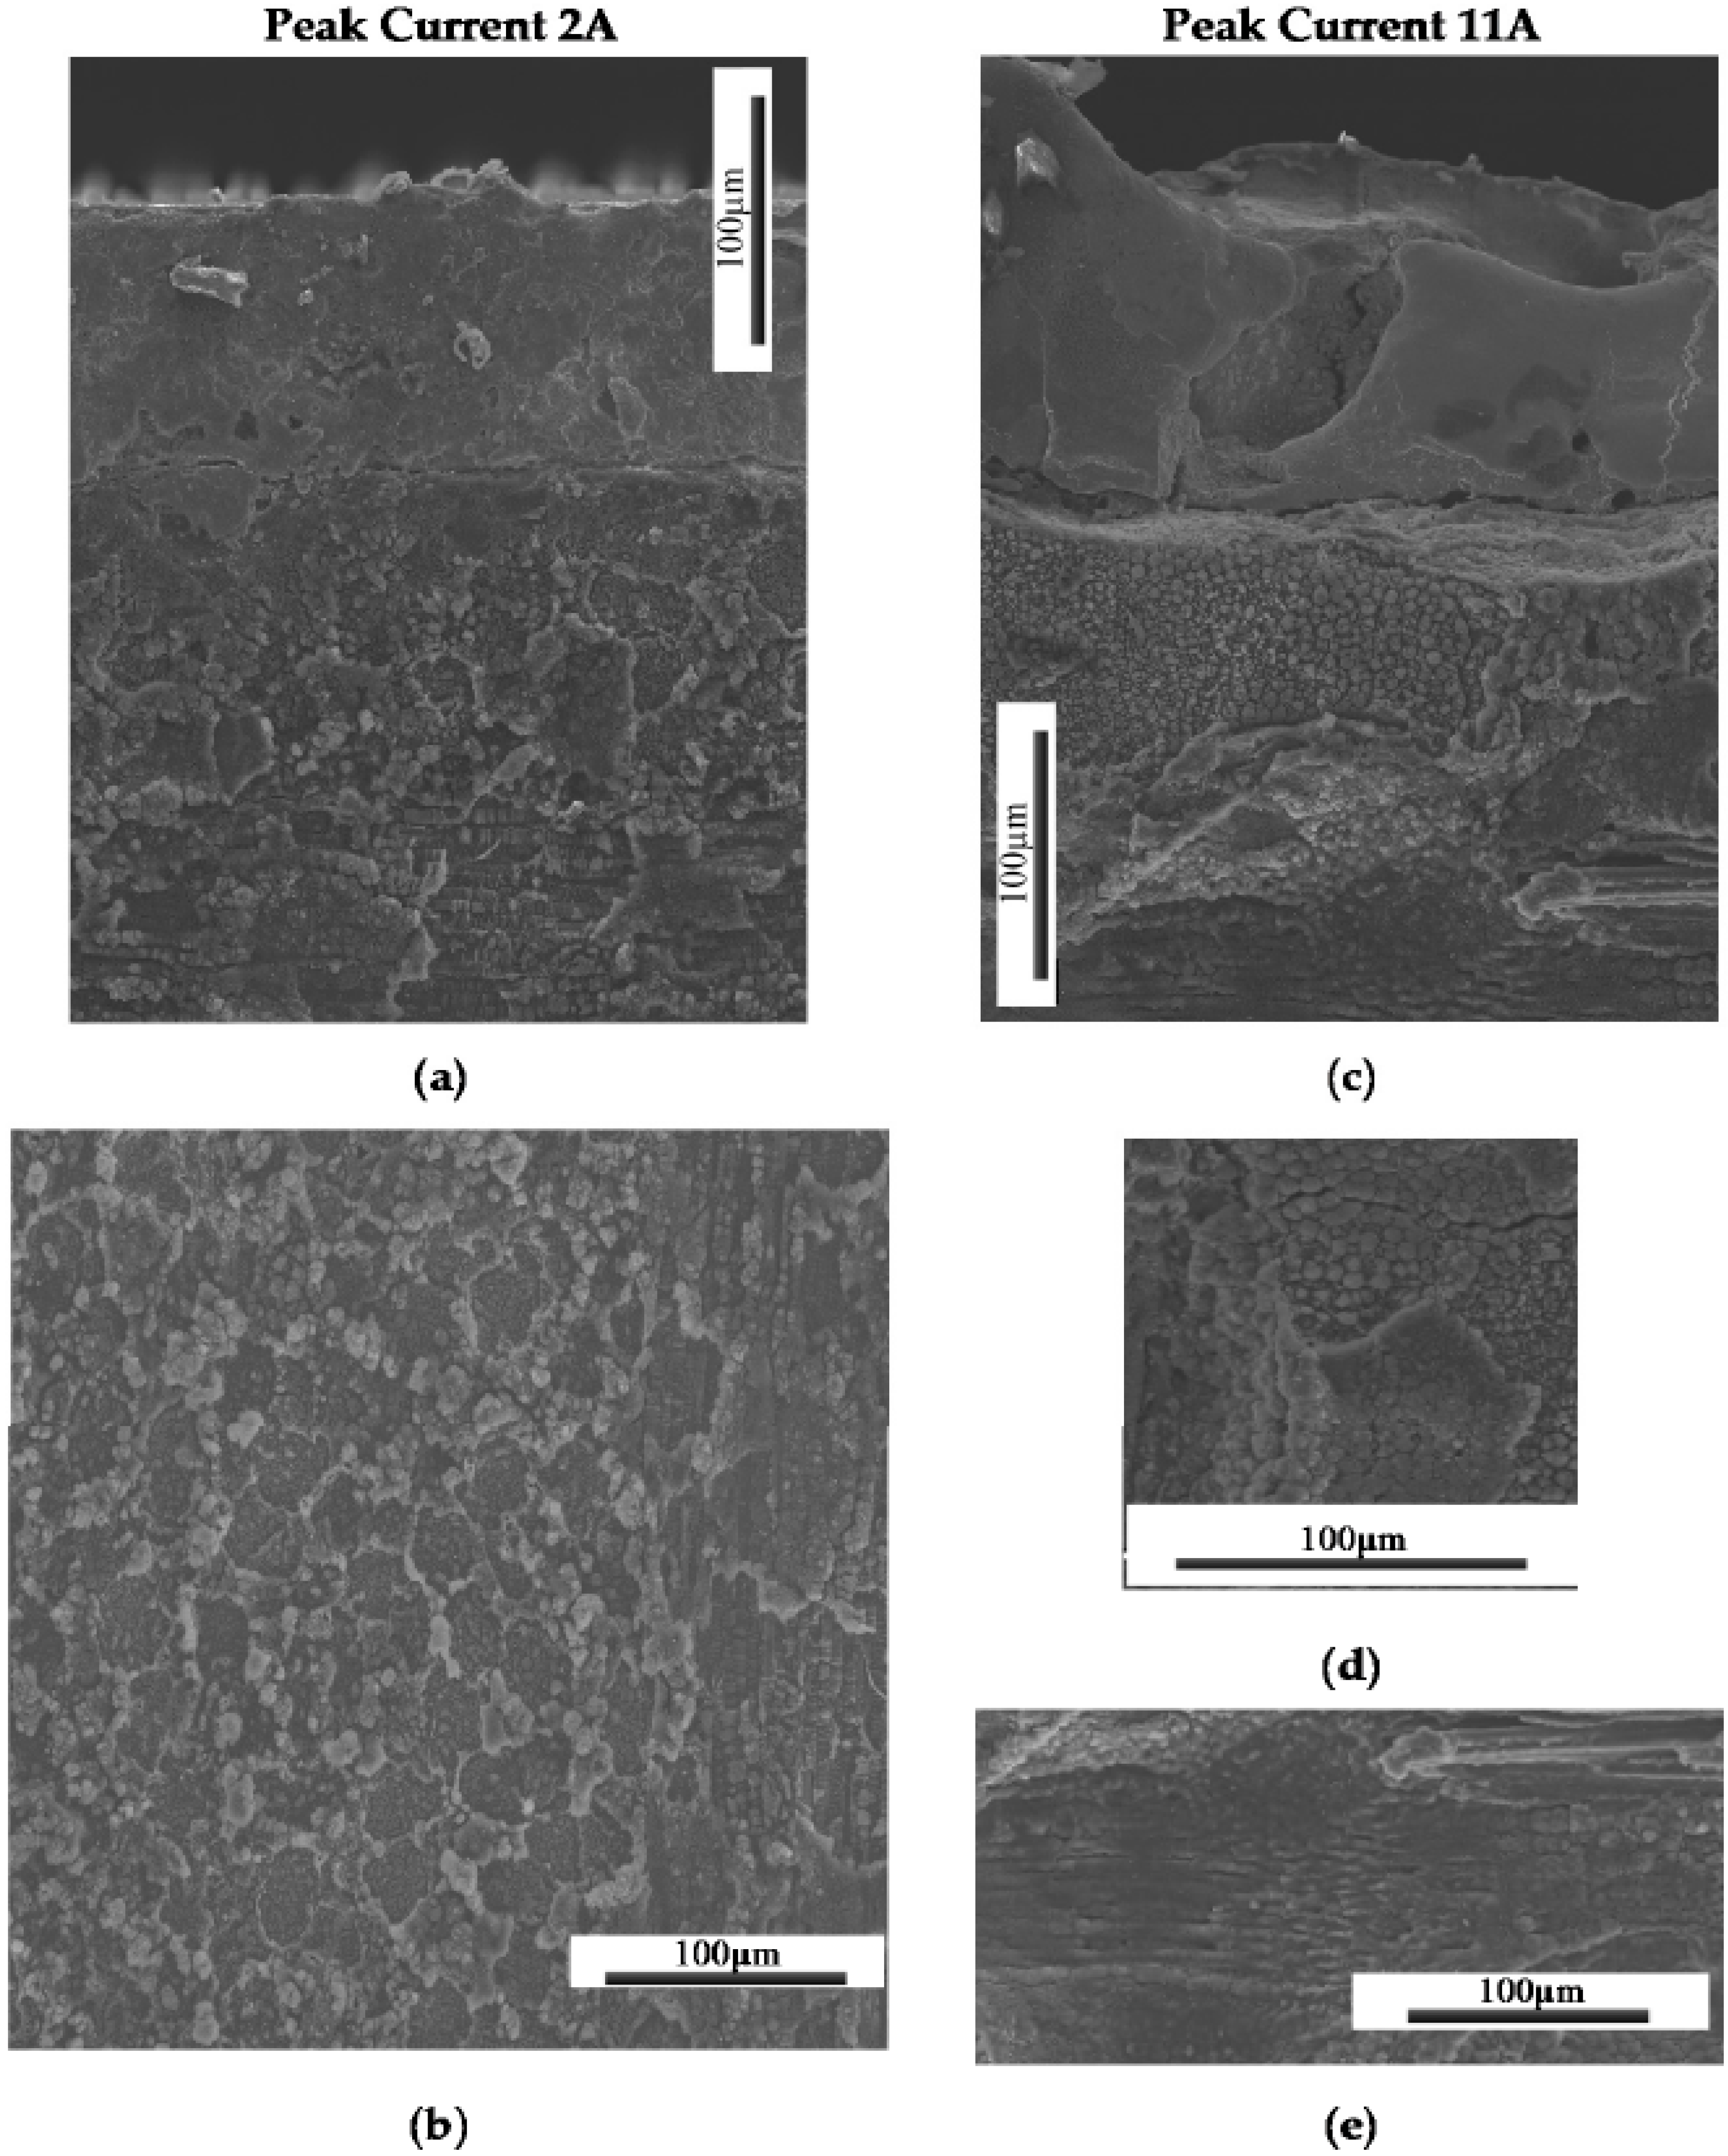
Figure 4 shows the TiGr composite machining surface from the EDM process. Matrix material was melt faster than fiber and solidified. Note that the sectioned surface shown in
Figure 4a, clearly shows craters, the recast layer in titanium ply and polymer core. From the examination of the surface characteristics, it was observed that EDM process produces much damage on the surface such as globules, varying size craters, cracks and debonding the plies. Thus the surface is uneven and can be seen with random size craters. Severe melting of the composite surface in particular matrix melting and debris re-solidifying along with cracks can be seen in
Figure 4a. Recast layer in titanium ply was ranged from 1–10 µm revealing lowest lowest peak current of 2 A and higher at 11 A. It was also found that at higher energy pulse (peak current × pulse on time), thermal expansion of 90 degree fiber shown in
Figure 4c were laterally expanded and was consistent with others [
24]. As the peak current and percent of on time increased, the deeper craters were more evident and rougher surfaces were more pronounced. The topography and typical characteristic features examined with SEM and shown in
Figure 4 and
Figure 5.
Figure 5 clearly show the effect of current on the surface topography and quality of the machined surface. In addition to the peak current, short pulse on time produced a finer finish and peak current long pulse time produced a rougher surface.
Design Expert [
32] was used to generate ANOVA and analyzed the data for the significance of input parameters for each process variable with Equations (2)–(5) obtained for predicting Workpiece MRR, TWR, Surface Roughness, and Damage Ratio, respectively. Response plots were plotted and presented in the following sections for selected peak currents of 2, 5 and 11 A. In the analysis of the data from this research, the models fitting the data points for these 5 unfinished cuts were not included.
3.2. Response Surface Modeling
The results of ANOVA for the response functions workpiece MRR and TWR are given in the appendix—
Table A1 and
Table A2 respectively. ANOVA identified that peak current had a dominant effect, both in linear, and quadratic effect, as well as percent on-time’s quadratic effect as being the most significant. This agrees to the data shown in
Figure 3. A regression fit through the data points using a quadratic surface with a log10 transform yielded Equations (2) and (3) for Workpiece MRR and TWR with an R
2 value of 0.85 and 0.91 respectively.
Workpiece Material Removal Rate (
WMRR)
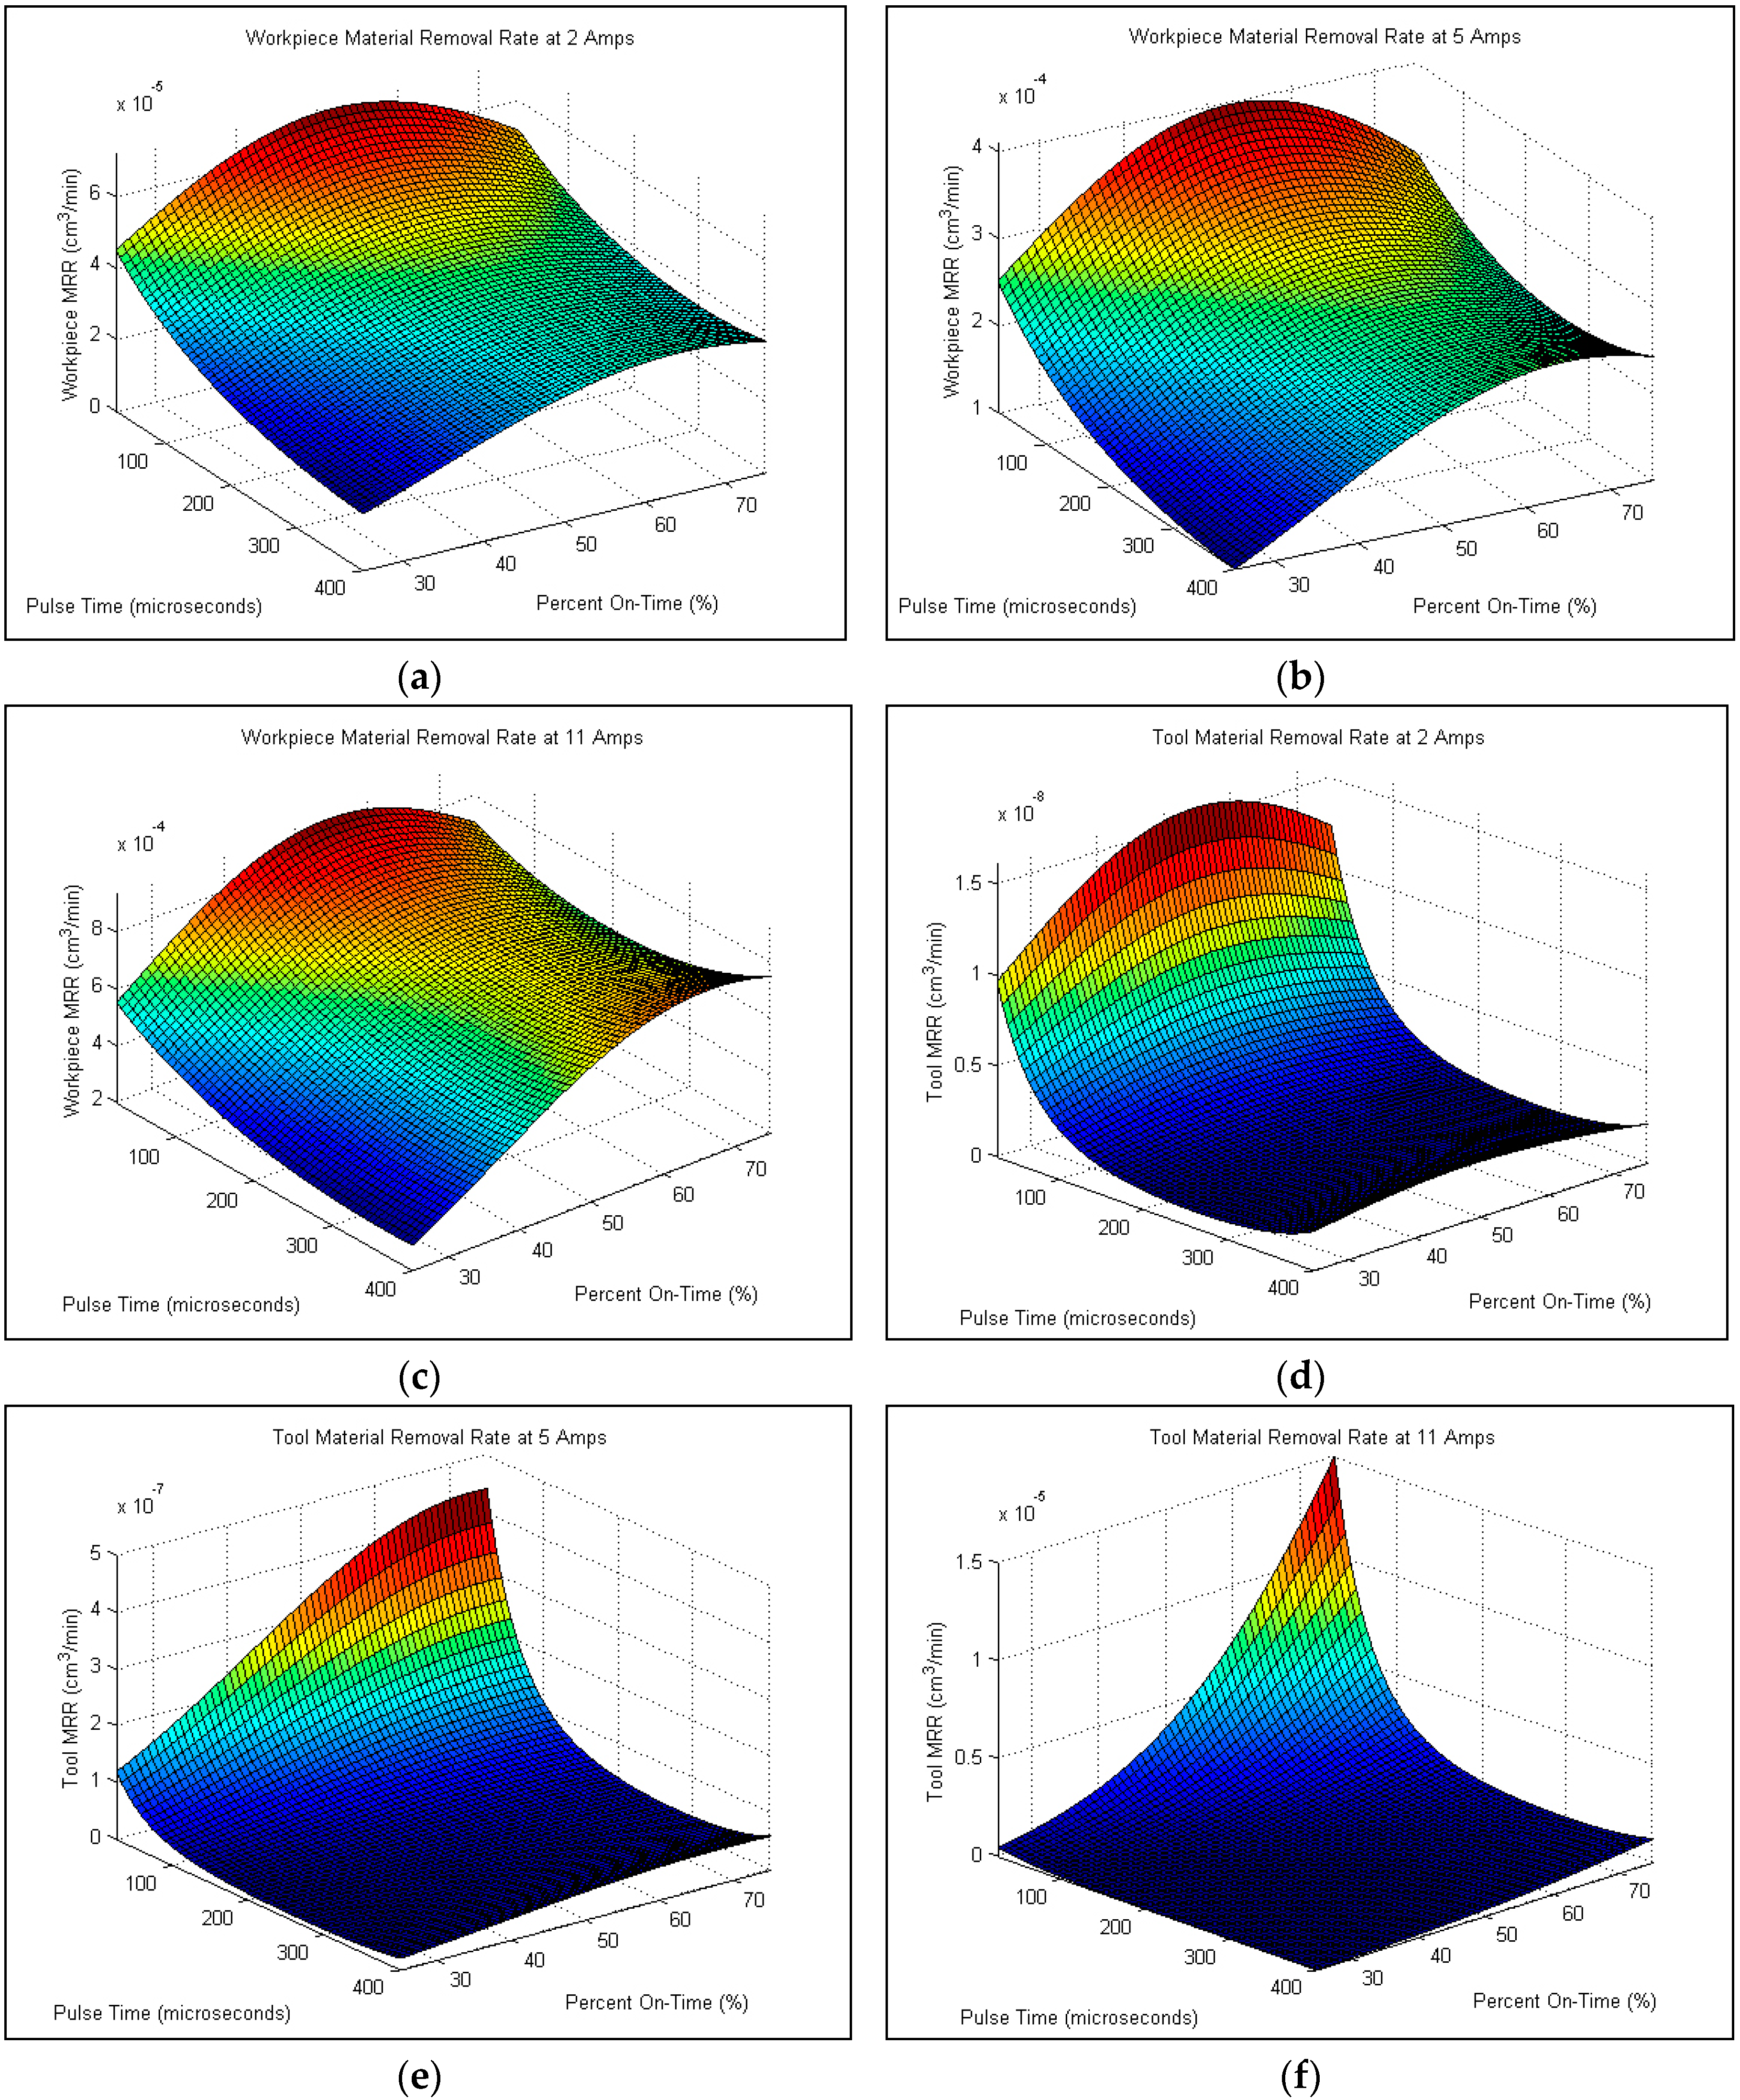
Figure 6 shows the trends of MRR both in workpiece (
Figure 6a–c) and tool material removal rate (
Figure 6d–f). In general, workpiece MRR followed the trend set by the cutting time due to its dependence on those values. Since the MRR is calculated from cutting times, the highest MRR values were found at high currents, low pulse, and a 50% On-Time and is similar to the values found for a low cutting time. From
Figure 6d–f, it can be seen that as peak current increased, the more uniform the tool wear rate, though the amount of wear also increased. The only tools which showed significant amounts of wear were found on the four cuts which did not finish due to shorting between the tool and workpiece. The omission of failed hole data in the generation of Equation (3) is the most likely reason for the spike found in
Figure 6f.
Hole quality is presented in terms of machined hole surface and the surface damage. The results of ANOVA for the response functions surface roughness is shown in
Table A3 and similar observation was made on damage ratio ANOVA and not listed in the
Table A1 and
Table A2. From ANOVA of average surface roughness, R
a, and damage ratio, d
max/d, it was found that Pulse Time and Percent On-Time were the significant factors on R
a, with an (Equation (4)) and percent on-time and peak current damage ratio (Equation (5)). The surface roughness and damage ratio model equations were determined with an an R
2 value of 0.98 and 0.70 respectively.
Damage Ratio (
Df)
where
relates to the pulse time in microseconds,
is the Percent On-Time, and
is the Peak Current.
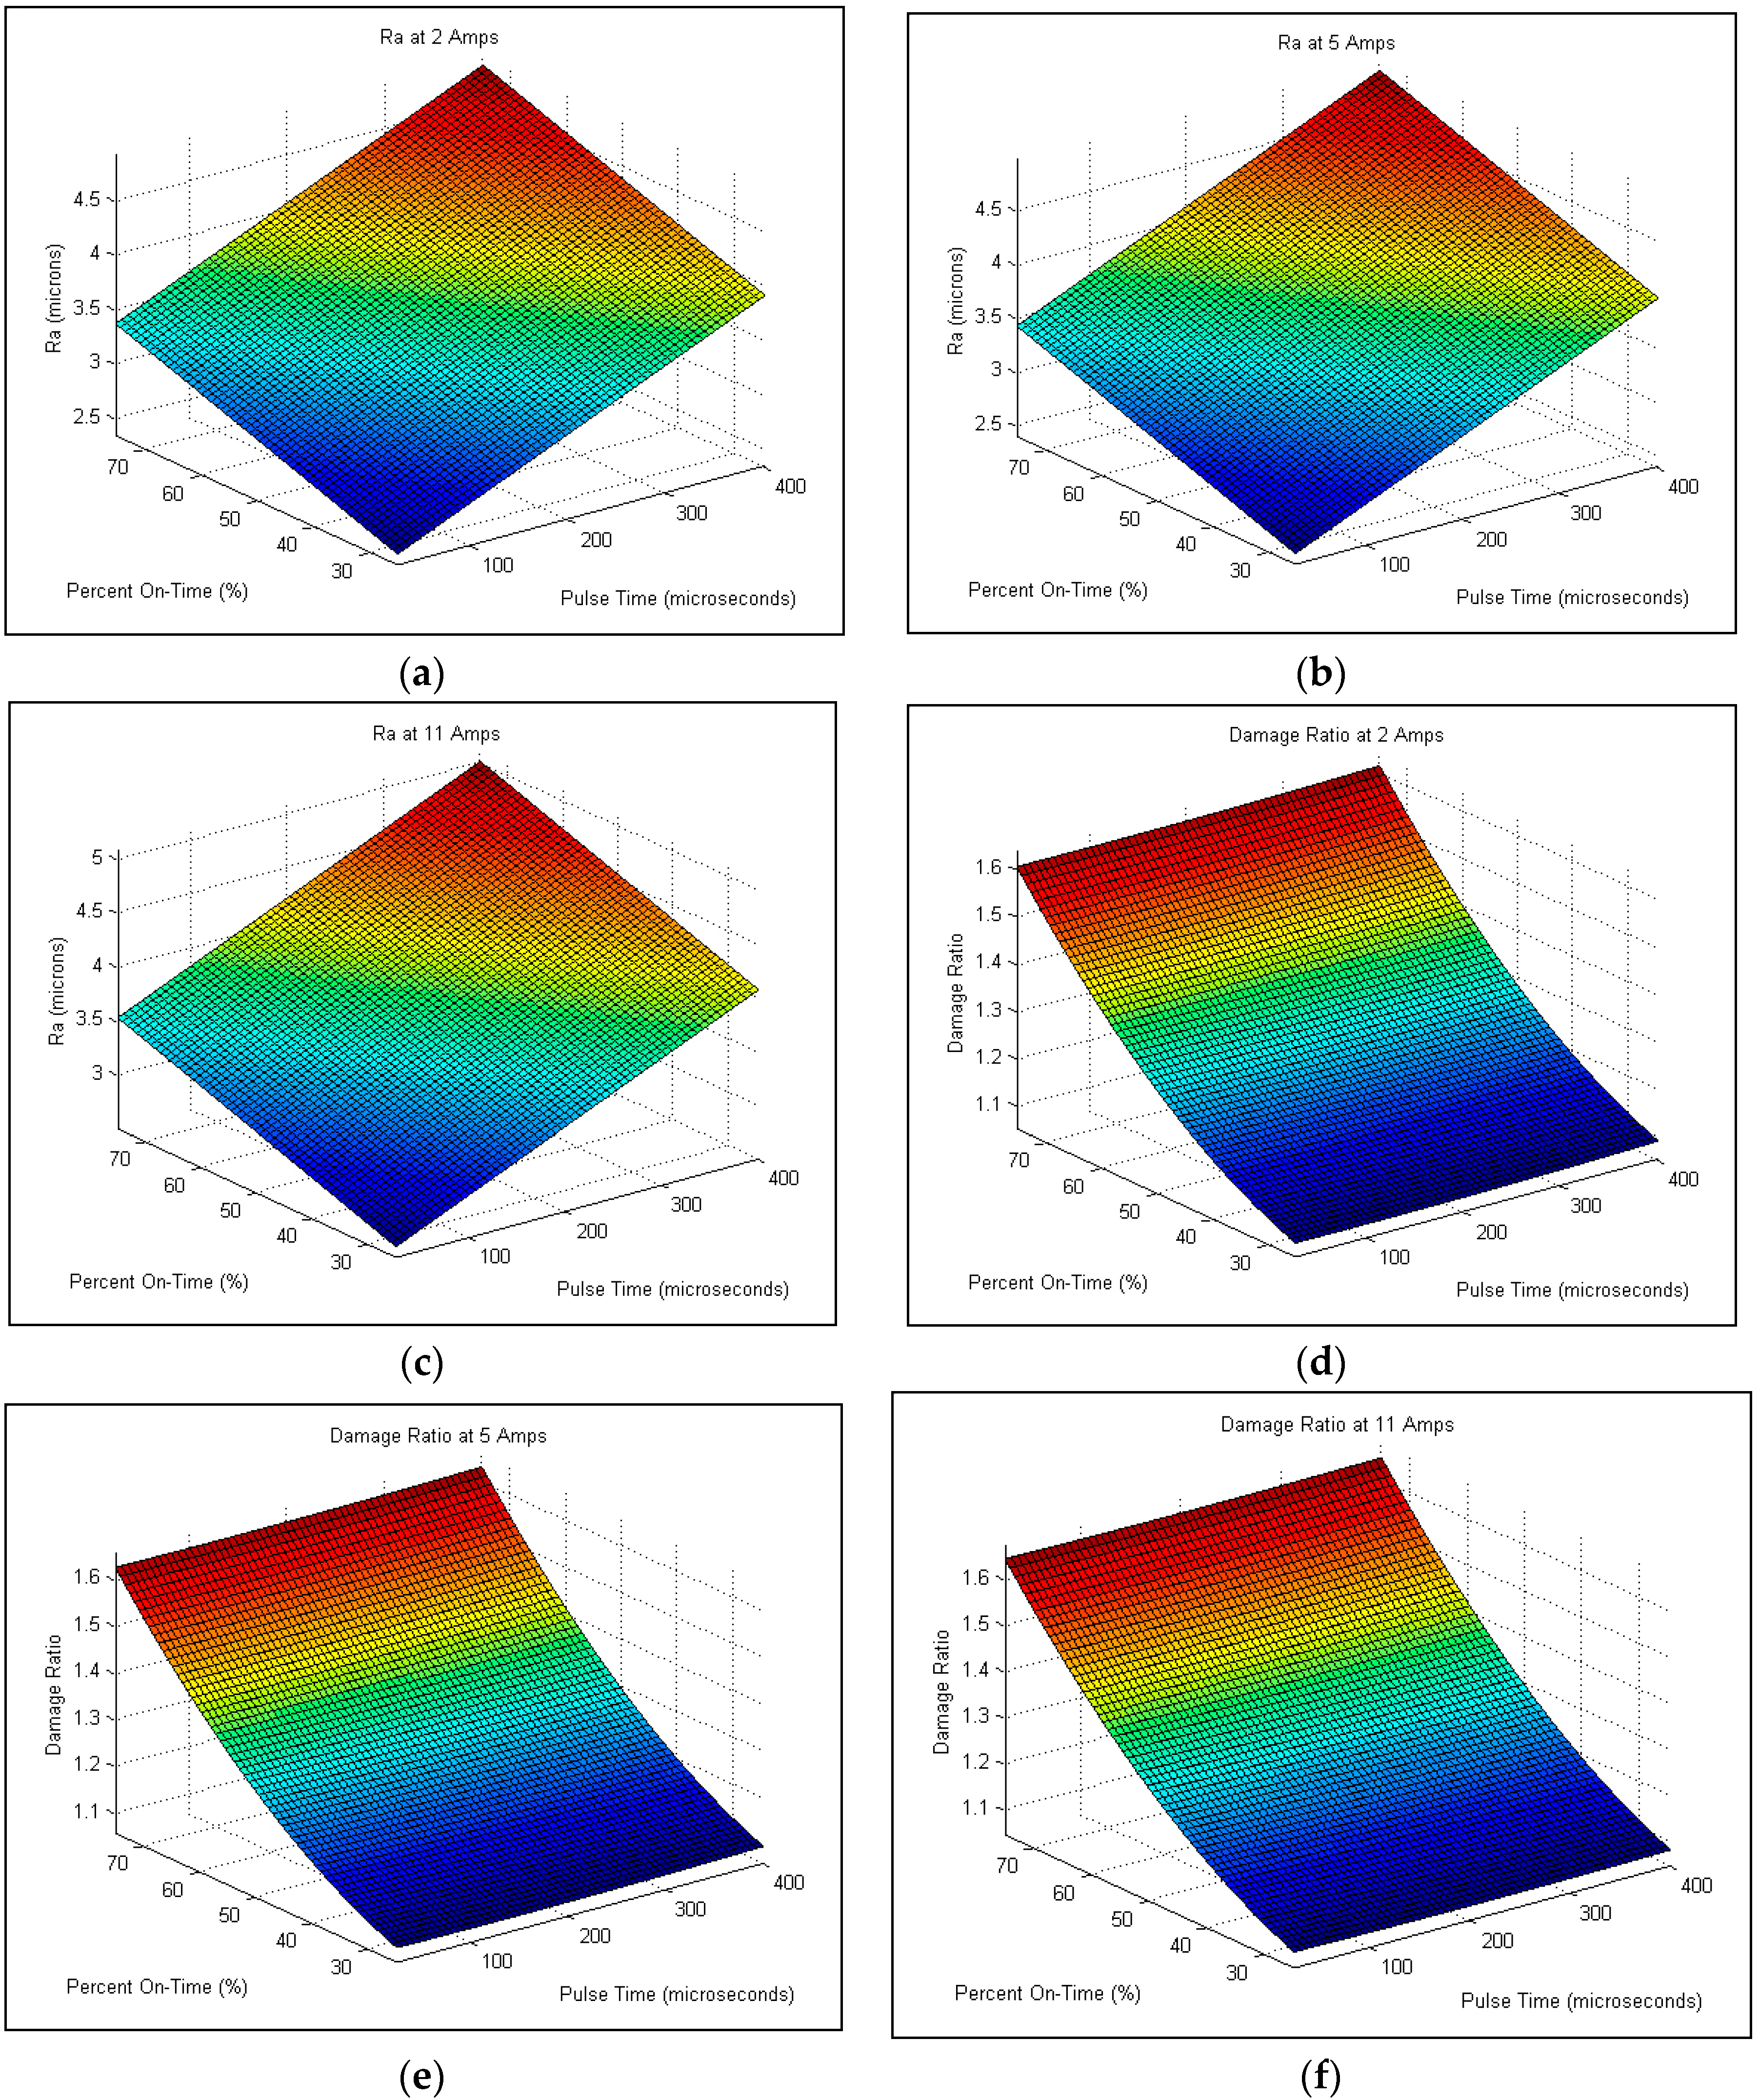
Figure 7 depicts the process conditions on hole quality. It can be seen from
Figure 7a–c that the variation of surface roughness between each of the individual currents was negligible; however; as Percent On-Time increased and Pulse Time increased, average surface roughness increased. While surface roughness increased as current increased, the change was very small. From
Figure 7d–f, it is possible to see that pulse time does not contribute in any significant manner to the damage ratio of the drilled holes. However, as percent on-time increased, the damage ratio increased possibly due to increased molten material. The damage ratio also increases slightly with increasing current. This isn’t surprising as in many manufacturing processes there is a trade-off between damage and cutting time, where in this case the shortest cutting times occurred at high currents. One difficulty with this form of damage assessment is that it cannot account for thermal damage subsurface of the cut in the composite layers of the material.


