3.2. XRD Results
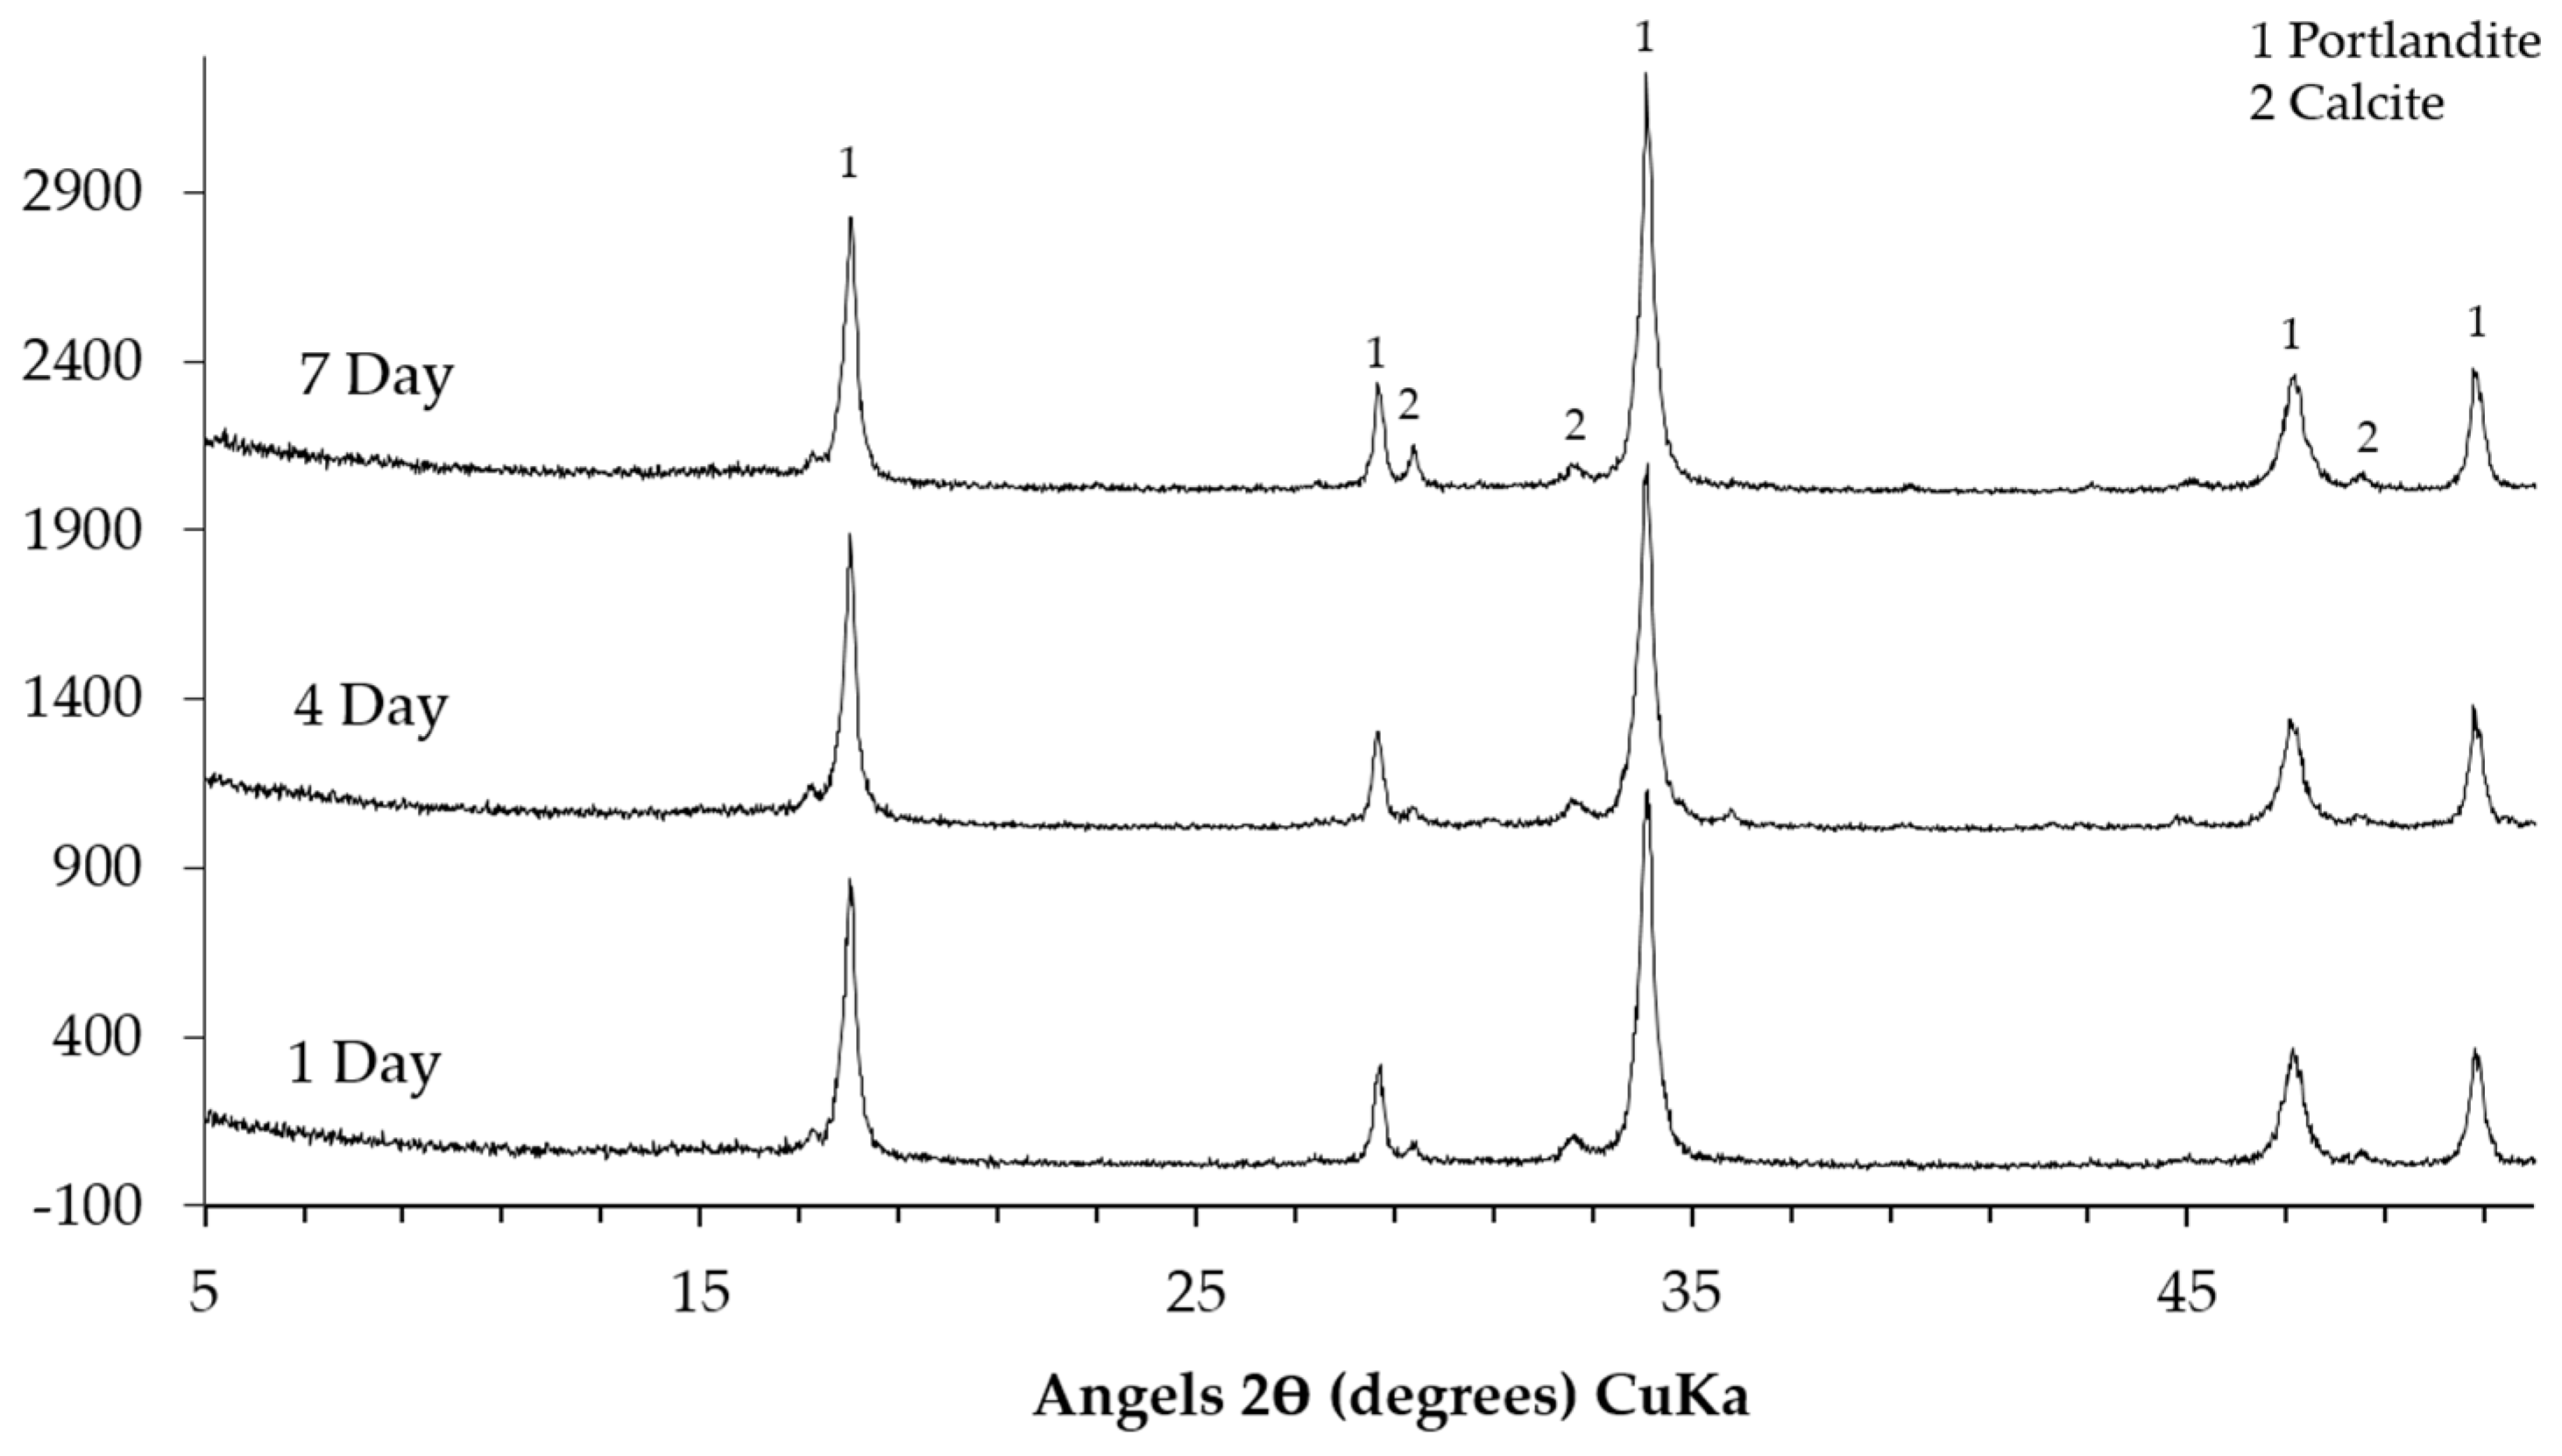
The XRD patterns of the sample collected from the middle layer are shown in
Figure 8. Obviously, the XRD patterns of the sample either from the system reacted for one, four or seven days are similar. This indicates that the different reaction periods did not have significant influence on the kinds of phases in the middle layer. The characteristic peaks at around 18° (2θ), 28.5° (2θ), 34° (2θ), 47° (2θ) and 50° (2θ) confirm the presence of Ca(OH)
2. The peaks from the calcite as the sign of carbonation in the middle layer are noticed as well. In addition, it seems that calcium alkali silicate was probably not present in the middle layer since its typical broadening and weak peaks were not found.
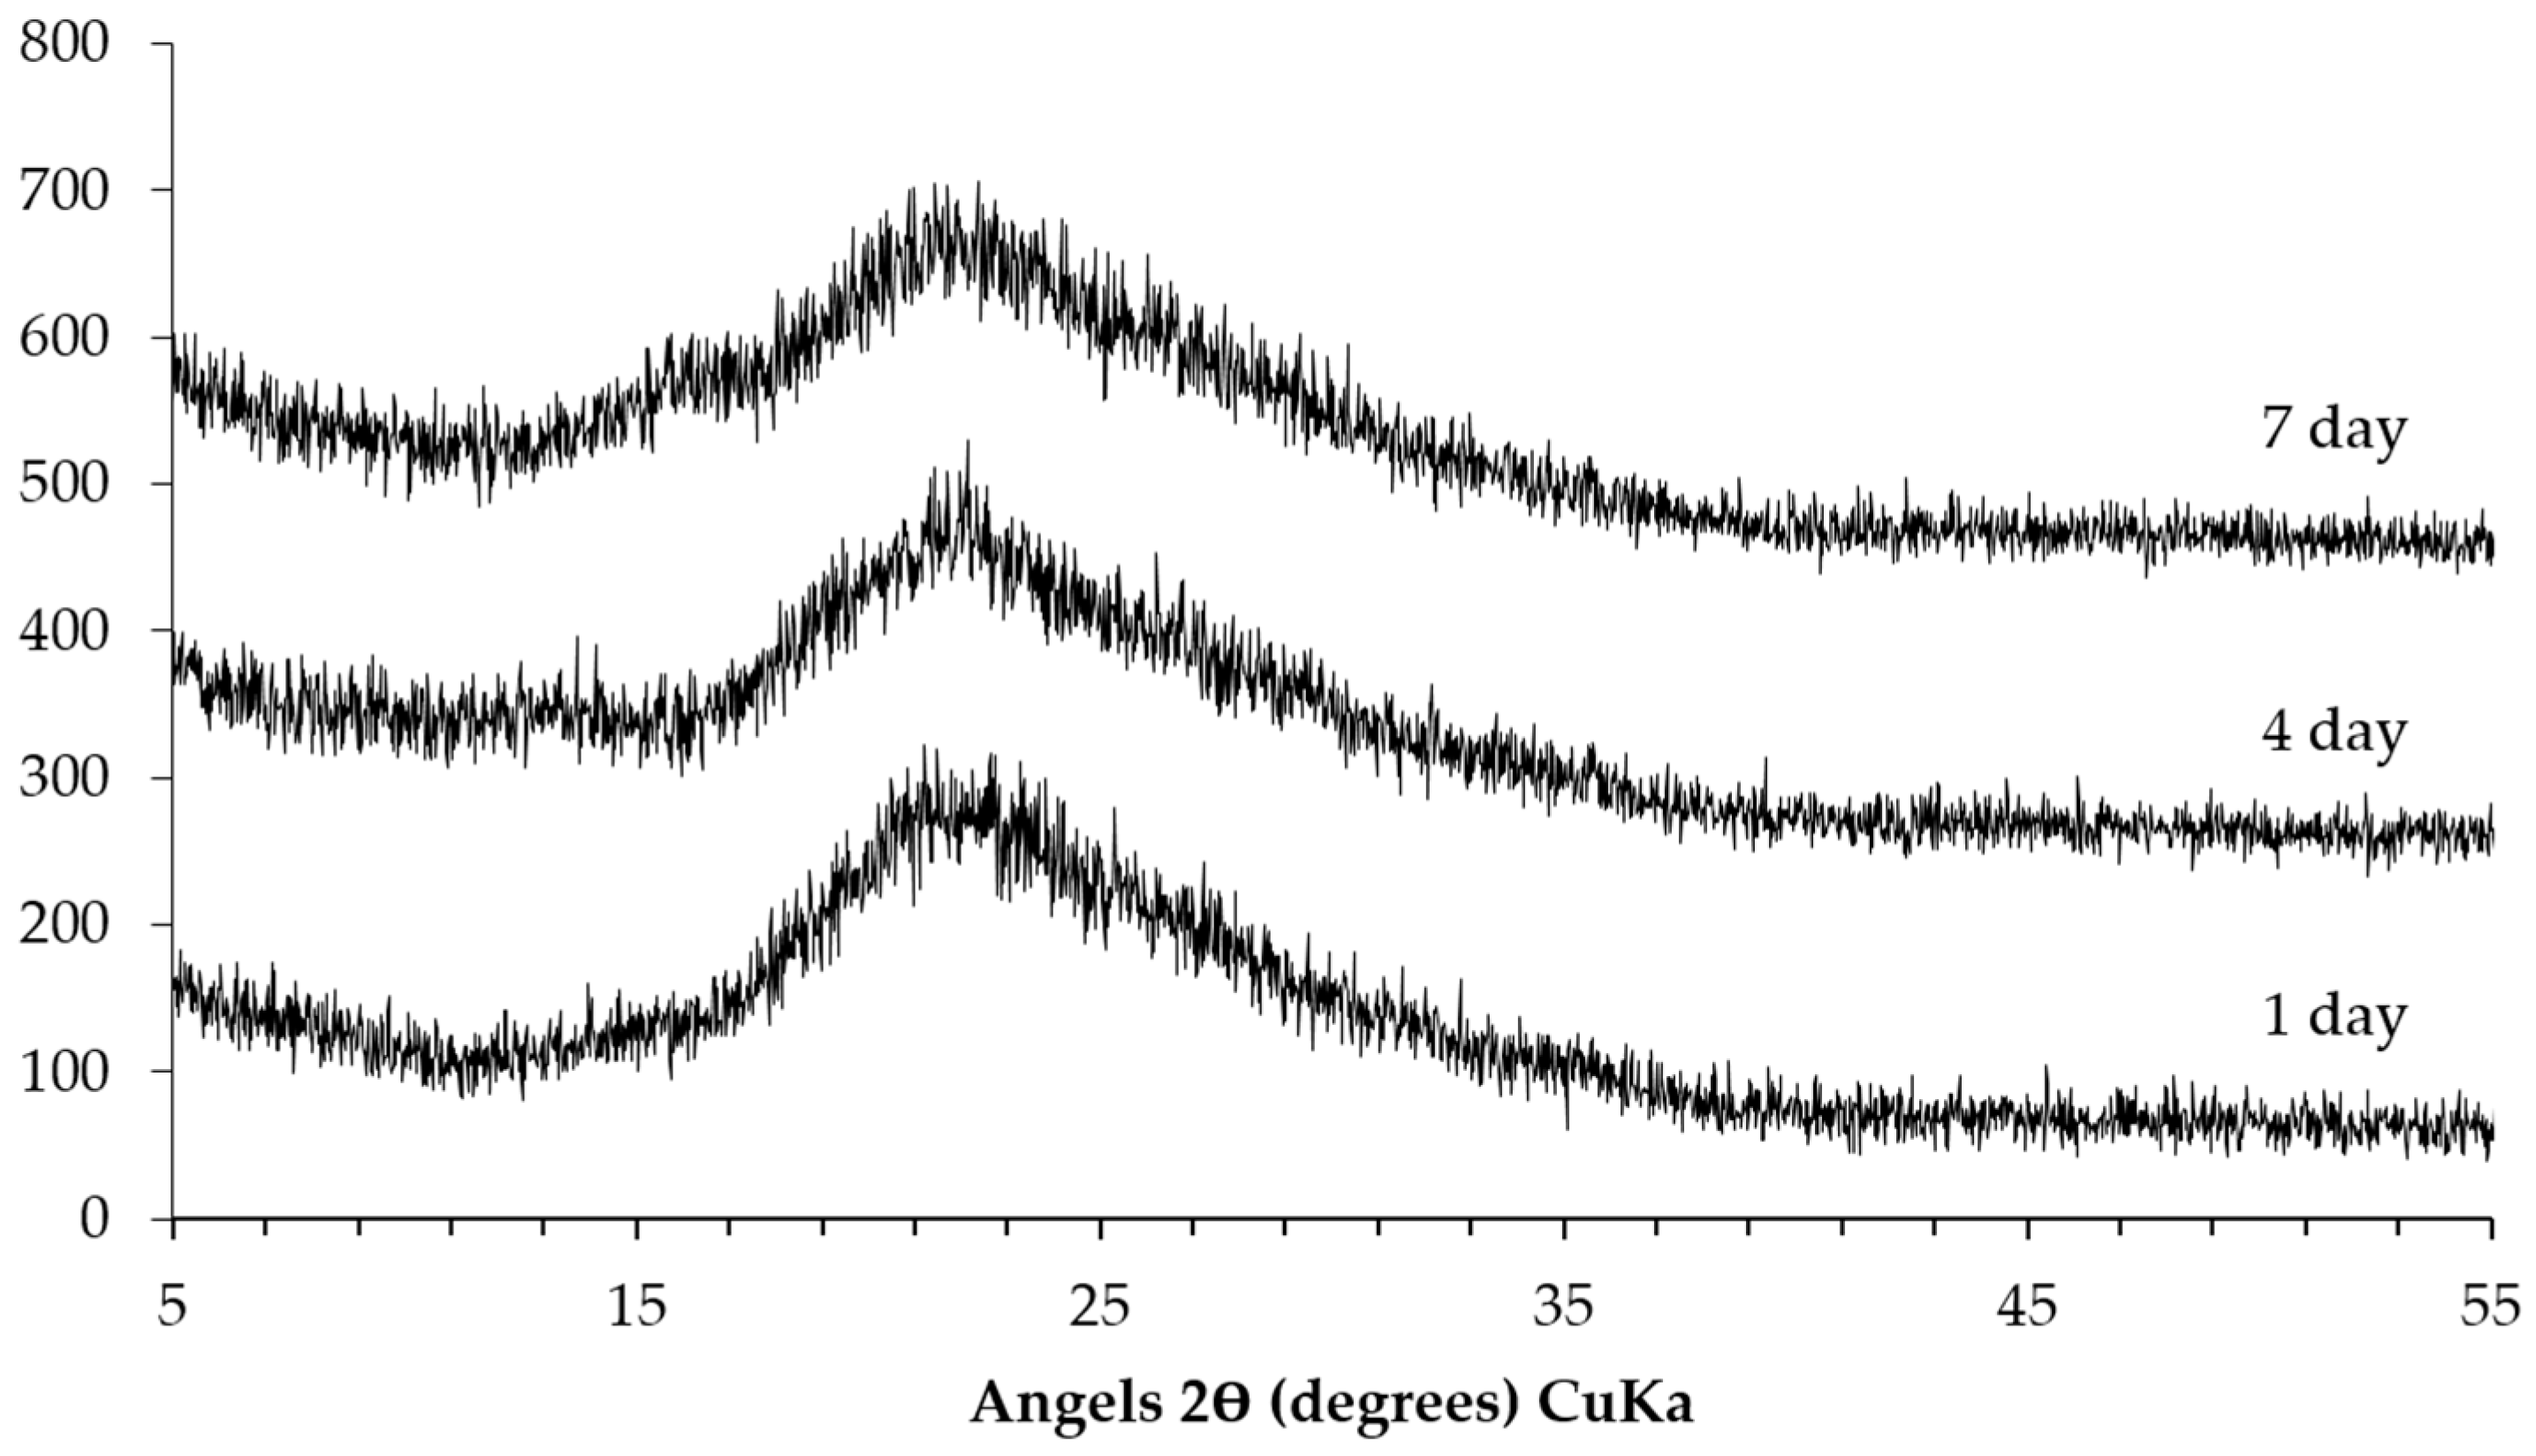
The XRD patterns of the sample collected from the slurry layer are shown in
Figure 9. Similar to the trend mentioned in the previous paragraph, the storage period has hardly any influence on the kinds of phases in the slurry layer as well. Particularly, the broadening peak centered around 21° (2θ) indicates the presence of unreacted silica fume or alkali silicate. Moreover, there are no characteristic peaks from Ca(OH)
2 and calcite indicating the absence of these phases in the slurry layer. The absence of the typical broadening peaks from calcium alkali silicate suggests that there is little or even no calcium alkali silicate present in this layer.
3.3. TGA Results
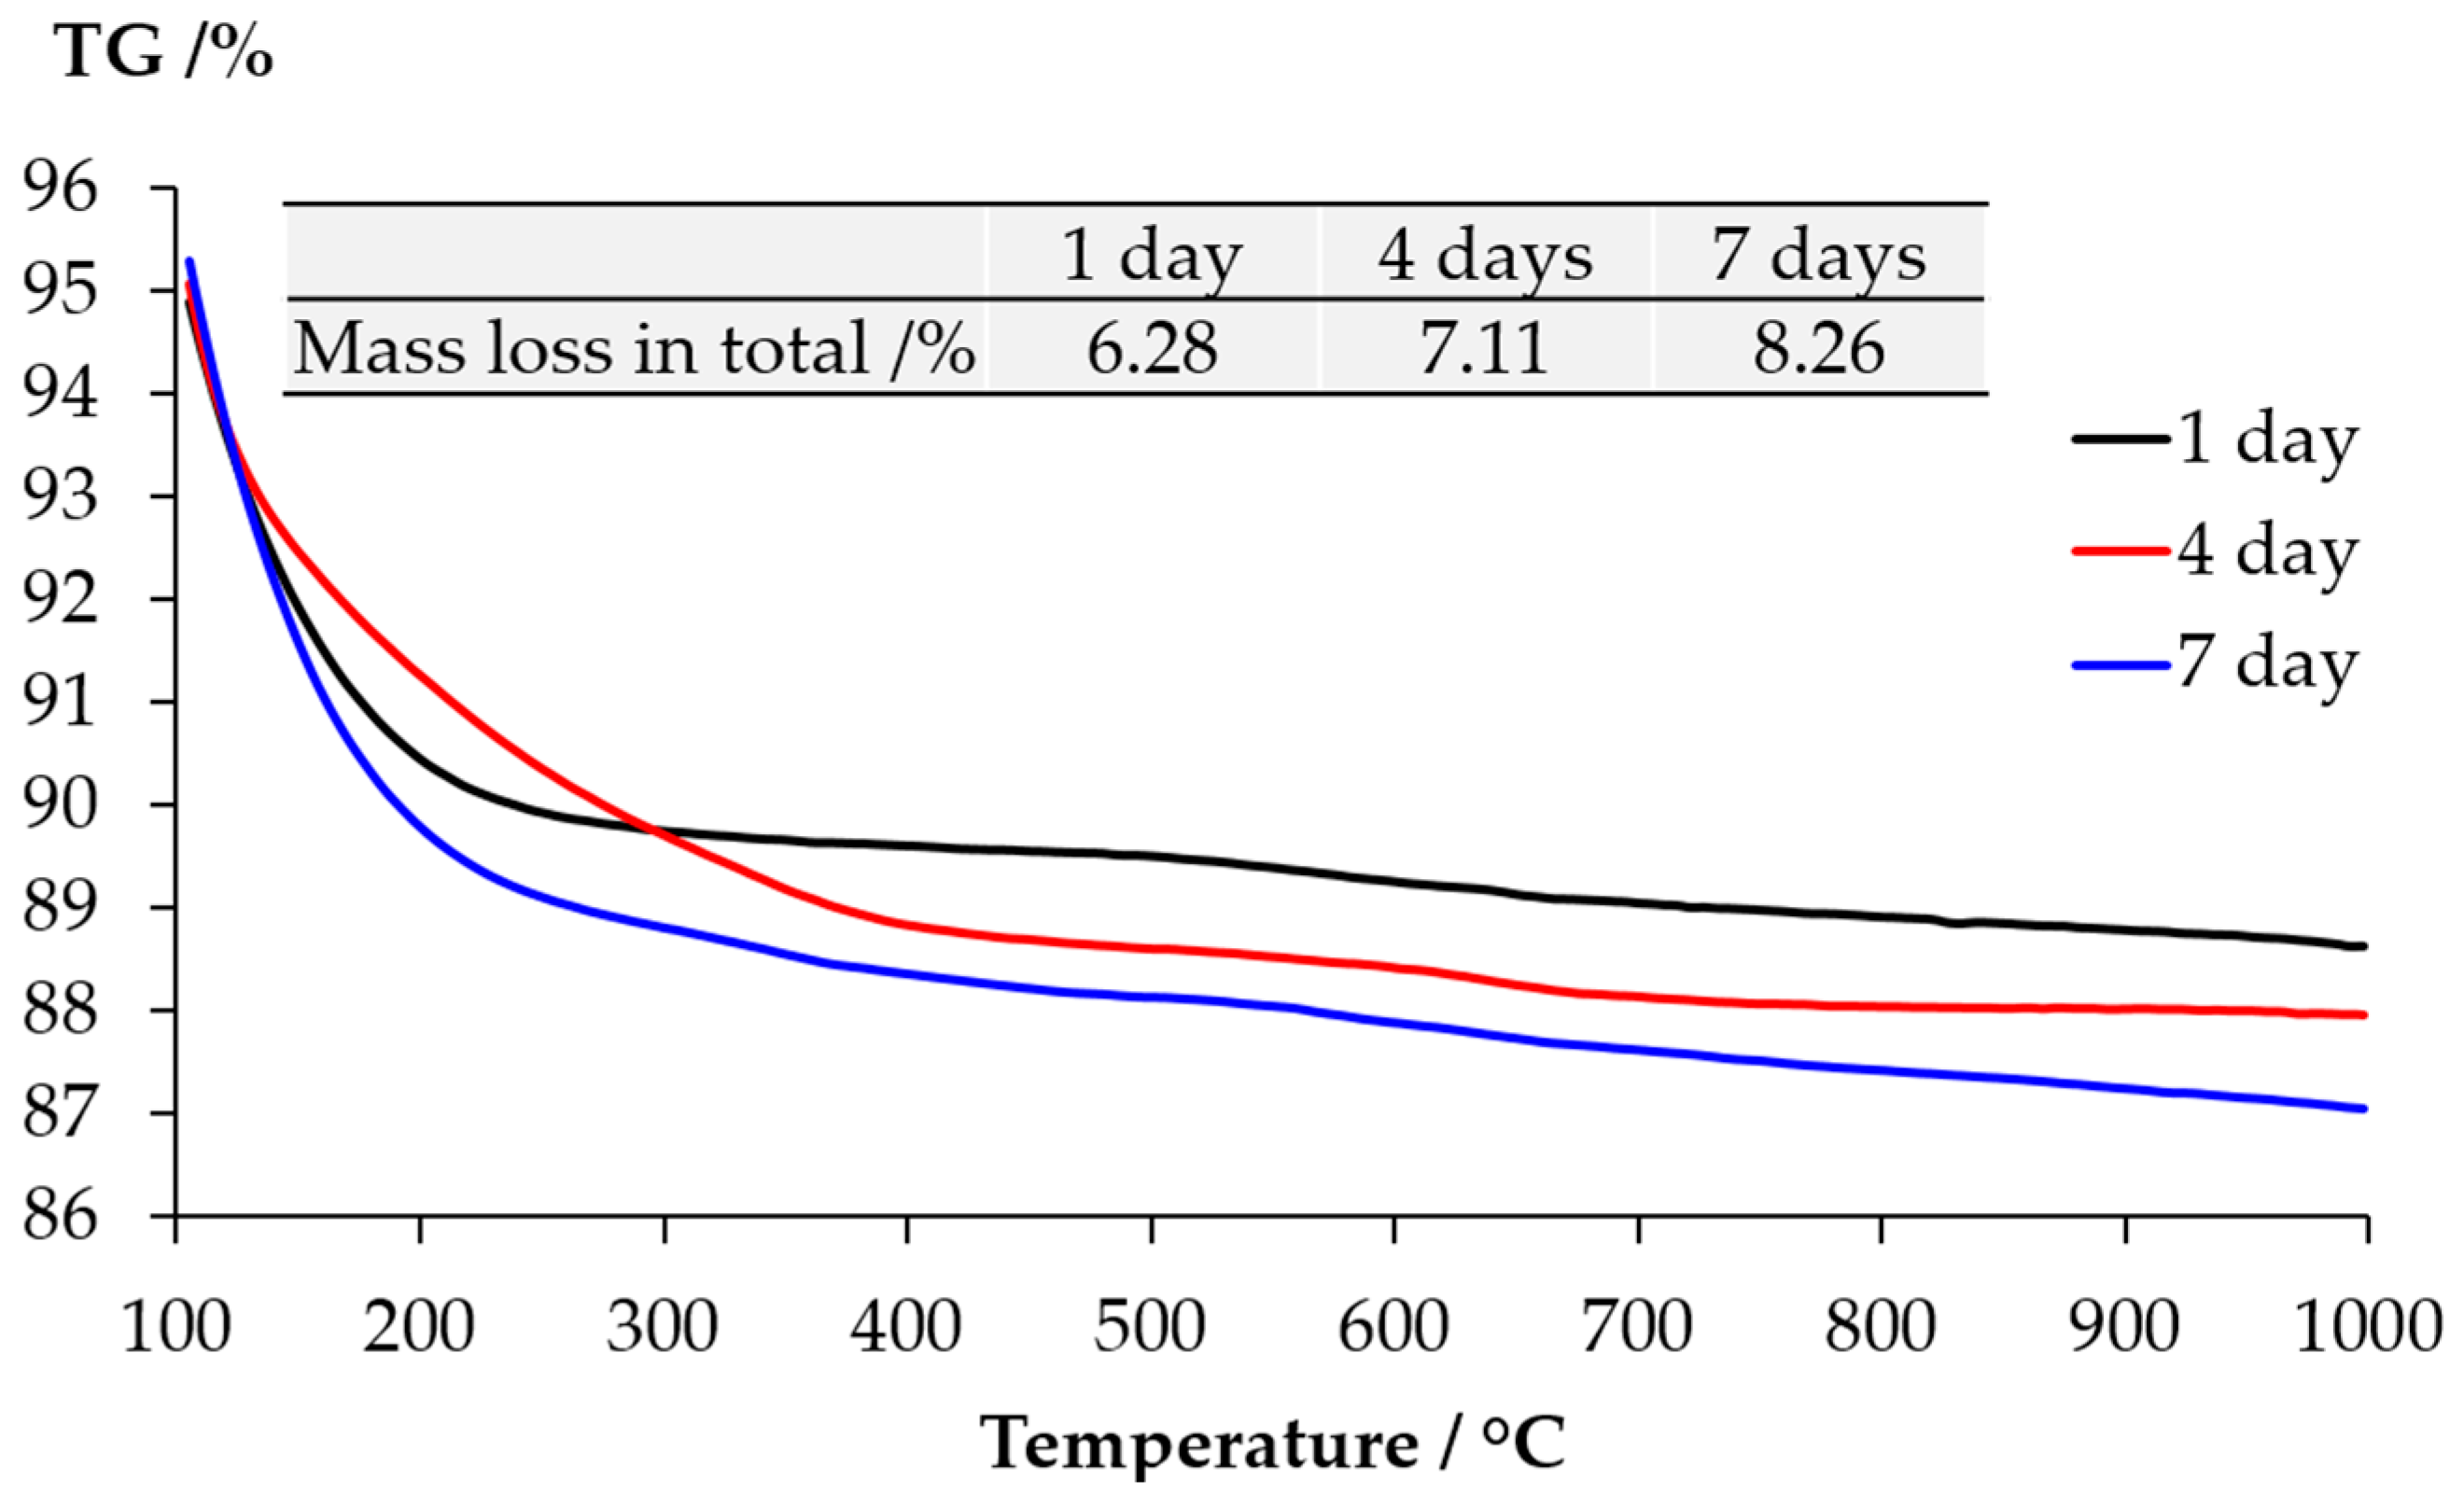
The TGA results of the samples from the middle layer are shown in
Figure 10. The content of Ca(OH)
2 and calcite present in the middle layer can be calculated based on the mass loss. The method of calculation is provided elsewhere [
16]. Apparently, the consistency among the results of the samples reacted for one, four and seven days confirms the trend observed by the XRD that, the storage period indeed had no significant influence on the kinds of phases in the middle layer. More particularly, the significant mass loss located between 400 °C and 500 °C verifies the abundant presence of Ca(OH)
2. The mass loss due to calcite is also clear between 650 °C and 800 °C. However, the presence of calcium alkali silicate is uncertain since the curves have extremely low but non-negligible slopes ranging between 100 °C and 400 °C. The mass loss within this range can be attributed to the dehydration of calcium alkali silicate or alkali silicate [
16].
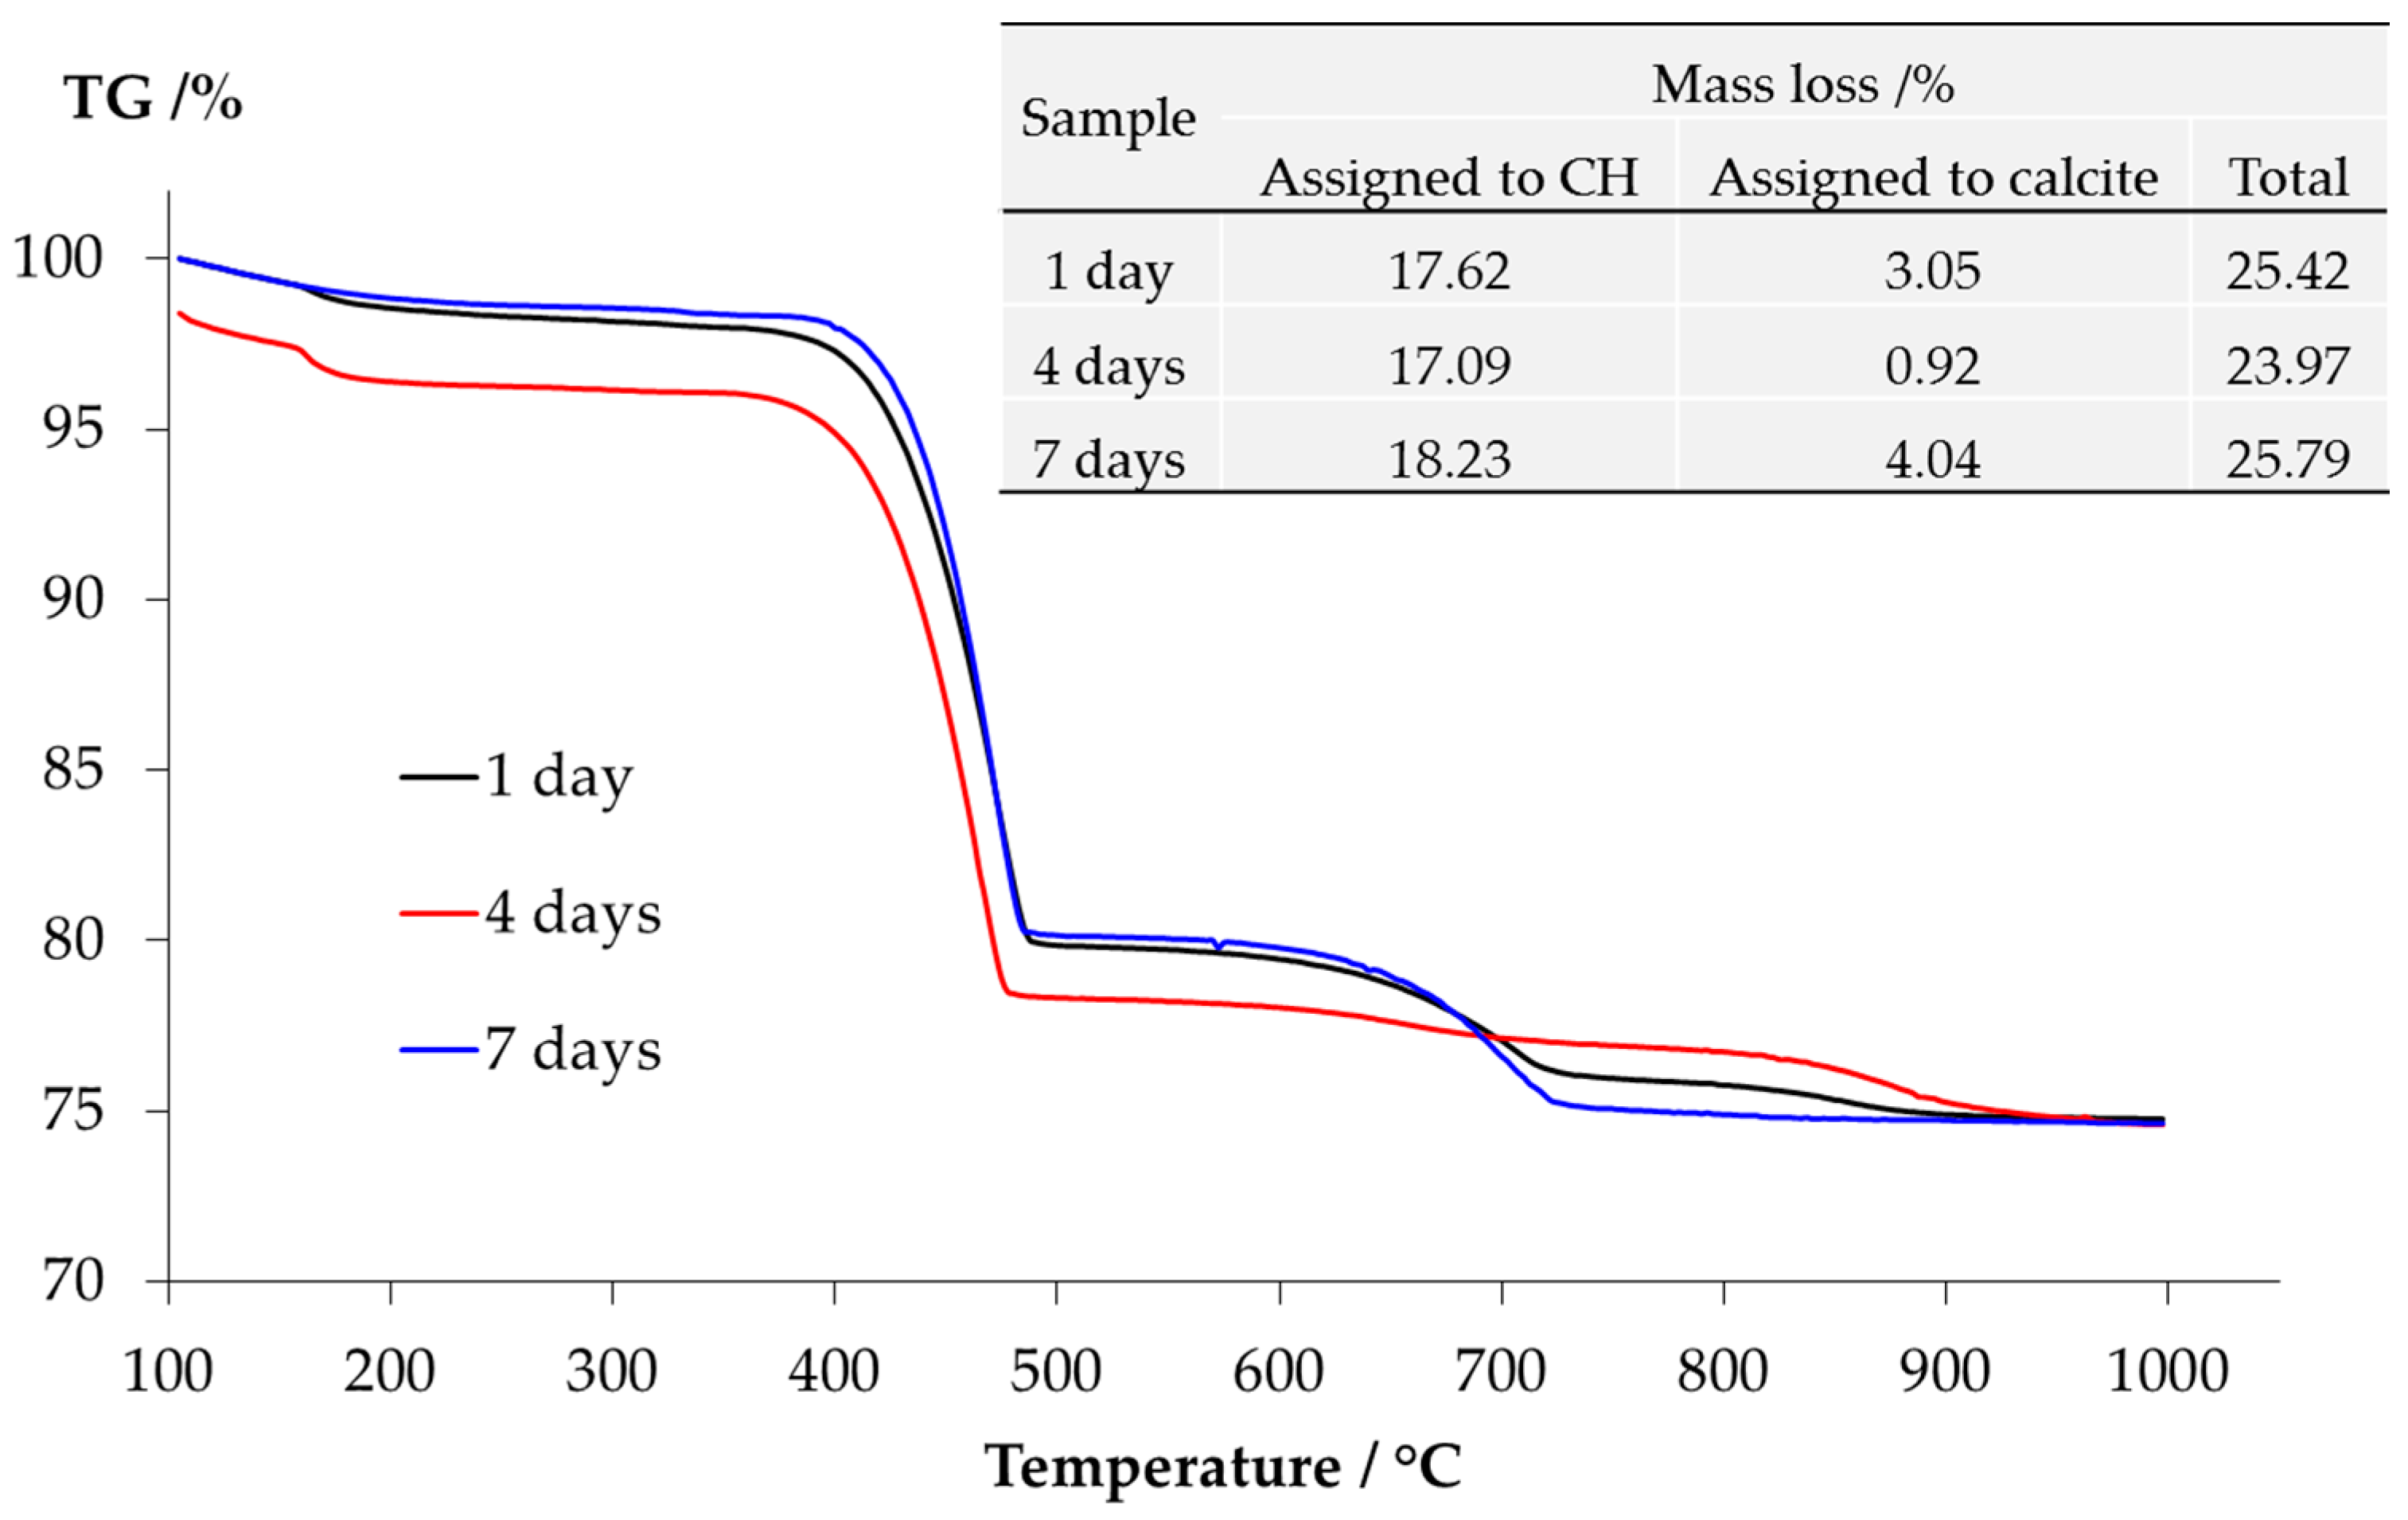
The TGA results of the samples collected from the slurry layer are shown as
Figure 11. The disappearance of the typical mass lose contributed by either Ca(OH)
2 or calcite confirms the XRD results that the slurry layer contained neither Ca(OH)
2 nor calcite. Combing with the XRD results, the significant mass loss locates between 100 °C and 400 °C is due to the dehydration of alkali silicate rather than calcium alkali silicate since the typical broadening peaks from calcium alkali silicate were not found in the XRD results shown in
Figure 9.
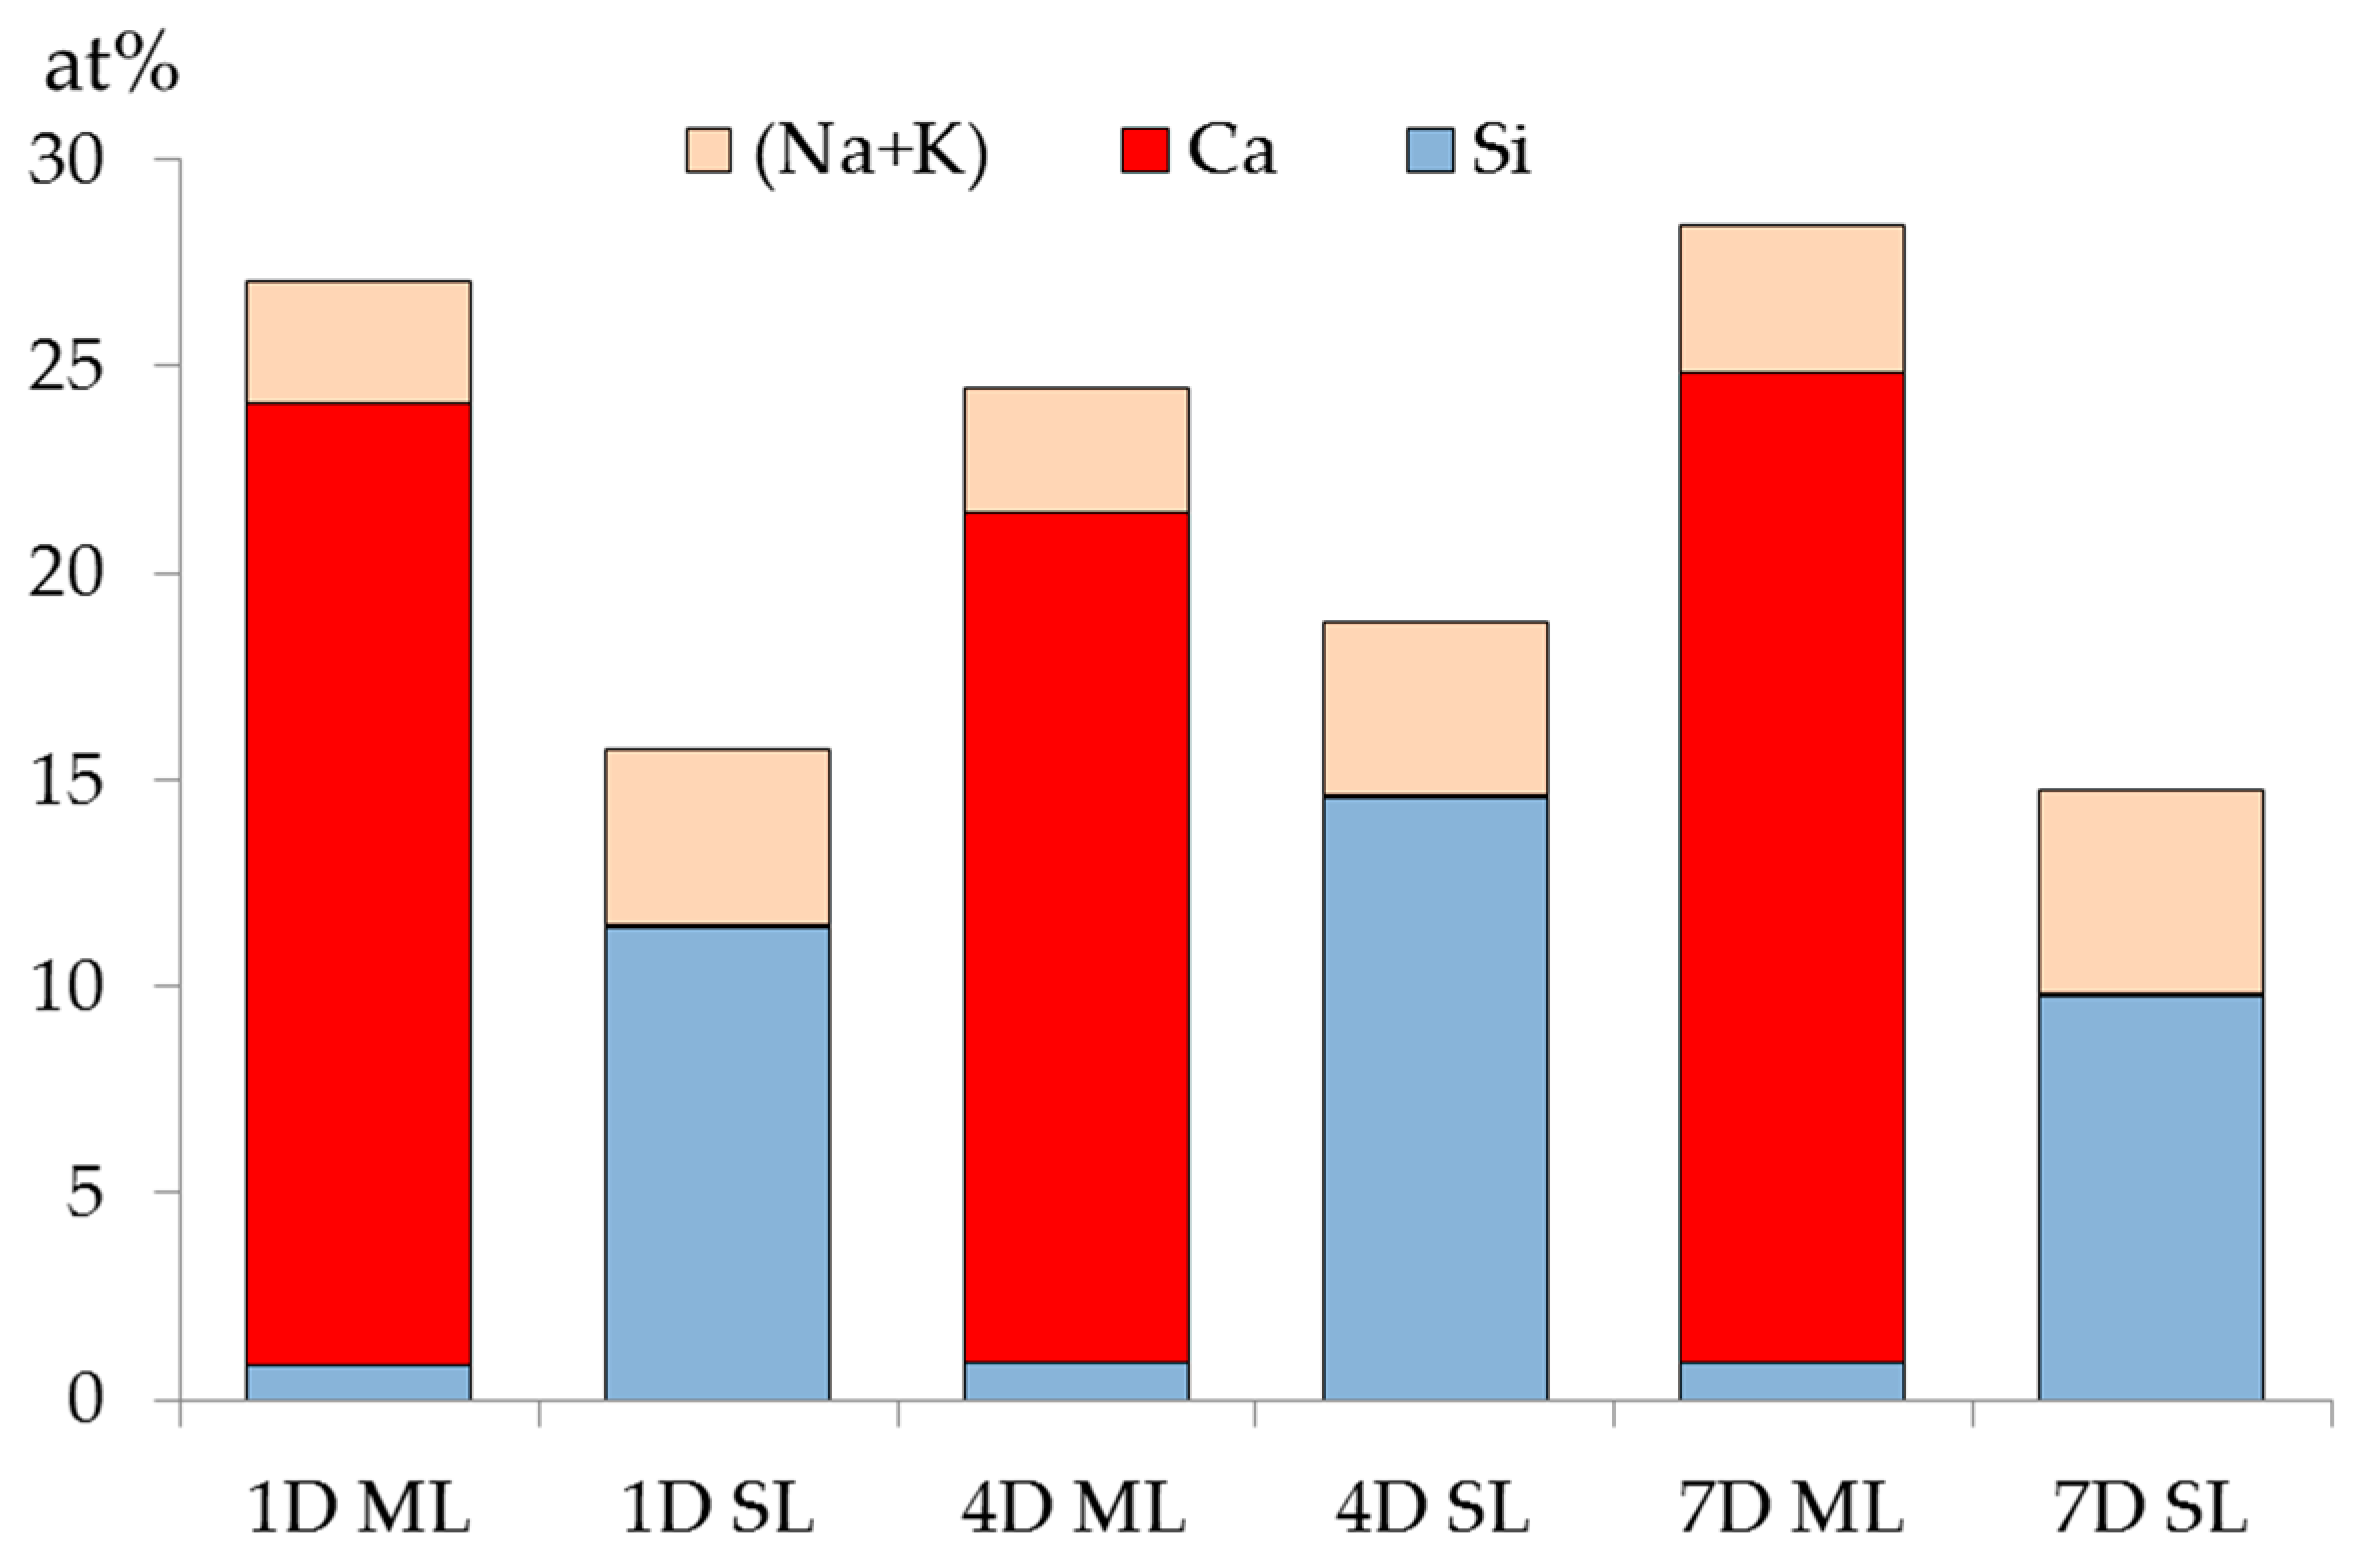
3.4. XRF Results
The XRF results of the samples from either the middle layer or the slurry layer with different reaction periods are summarized and plotted in
Figure 12. Notably, the mole ratio of the elements including (O, Al, Fe, Mg and so on) are not given individually in this chart to avoid confusion.
Obviously, regardless of the storage period, calcium is abundant in the middle layer while rare in the slurry layer; and the silicon is rare in the middle layer while abundant in the slurry layer. Particularly in the middle layer, the mole fraction of silicon is no more than 1% with respect to that of calcium, which is more than 20%. The abundance of the calcium is consistent with the XRD and TGA results showing that portlandite and calcite were present in the middle layer. In addition, the content of alkalis (Na and K) is slightly higher in the slurry layer than in the middle layer regardless of the storage period. This is perhaps due to more alkalis were bonded by alkali silicate in the slurry layer. This also infers that the contents of alkalis present in the middle layer and the slurry layer are similar.
In the middle layer, where Ca(OH)2 is abundantly present, any silicate had to react with the excess Ca(OH)2 to form calcium alkali silicate, i.e., silicate cannot coexist with Ca(OH)2 in this region other than reacts with Ca(OH)2 to form calcium alkali silicate. Hence, the weak signal of silicon detected in the middle layer came from a trace amount of calcium alkali silicate. This confirms the suspicious presence of calcium alkali silicate, which was not detected by XRD and TGA in the middle layer due to its extremely low concentration.
In the slurry layer, regardless of the storage period, the mole fraction of calcium is lower than 0.1% while that of silicon is higher than 10%. This indicates that, on the one hand, no additional calcium arrived in the slurry layer considering the original mole fraction of calcium in the silica fume. On the other hand, silicon prevailed in the slurry layer, consistent with the XRD results shown in
Figure 9 that the slurry layer was composed of unreacted silica fume or alkali silicate.
3.5. Existence of a Transport Barrier
Based on the XRD, TGA and XRF results mentioned in the last sections, some remarks need to be clarified before we continue. In the middle layer, the excess Ca(OH)
2 present in this layer enabled the reaction between calcium and silicate to proceed as long as both of them were present in this area. However, the least amount of silicon detected by XRF as well as the evidence of excess portlandite present in this area suggests that, the reaction ceased due to a lack of sufficient reagent, i.e., silicate. Therefore, it is reasonable to believe that no additional silicate coming from the slurry layer arrived in the middle layer. The trace amount of silicate detected was perhaps from the dissolved silicate originally present in the liquid layer at the top, though the transport of trace amount of silicate cannot be absolutely excluded based on these results. However, this possible migration or supply of silicate was supposed to be limited, otherwise the excess Ca(OH)
2 present in the middle layer can react with any silicate to form calcium alkali silicate resulting in an expected observation of the typical broadening peaks from calcium alkali silicate in the XRD results shown in
Figure 8 as well as a higher silicon content in the XRF results shown in
Figure 12. Hence, it is rational to conclude that the further migration of silicate from other positions, especially from the slurry layer beneath, to the middle layer was somehow prevented leading to an insufficient supply of silicate for its reaction with calcium in the middle layer. This implies that a transport barrier exists between the silicate source (the slurry layer) and the calcium source (the middle layer) to prevent the migration of silicate from the slurry layer to the middle layer against the great silicate concentration gradient. It should be noted here that, this transport barrier was indeed playing a similar role of the reaction rim as proposed by Ichikawa [
10,
11].
A similar situation happened in the slurry layer, a transport barrier was able to prevent the migration of calcium coming from other places, especially from the middle layer, to the slurry layer. Otherwise if any additional calcium was present in the slurry layer, it could react with abundant alkali silicate there to generate calcium alkali silicate resulting in an expected observation of the typical broadening peaks in the XRD results shown in
Figure 9 as well as a higher calcium content in the XRF results shown in
Figure 12.
With respect to alkalis, there are only slight differences between their concentrations in the middle layers and the slurry layers from different samples. This infers the migration of alkalis was not influenced by such a transport barrier.
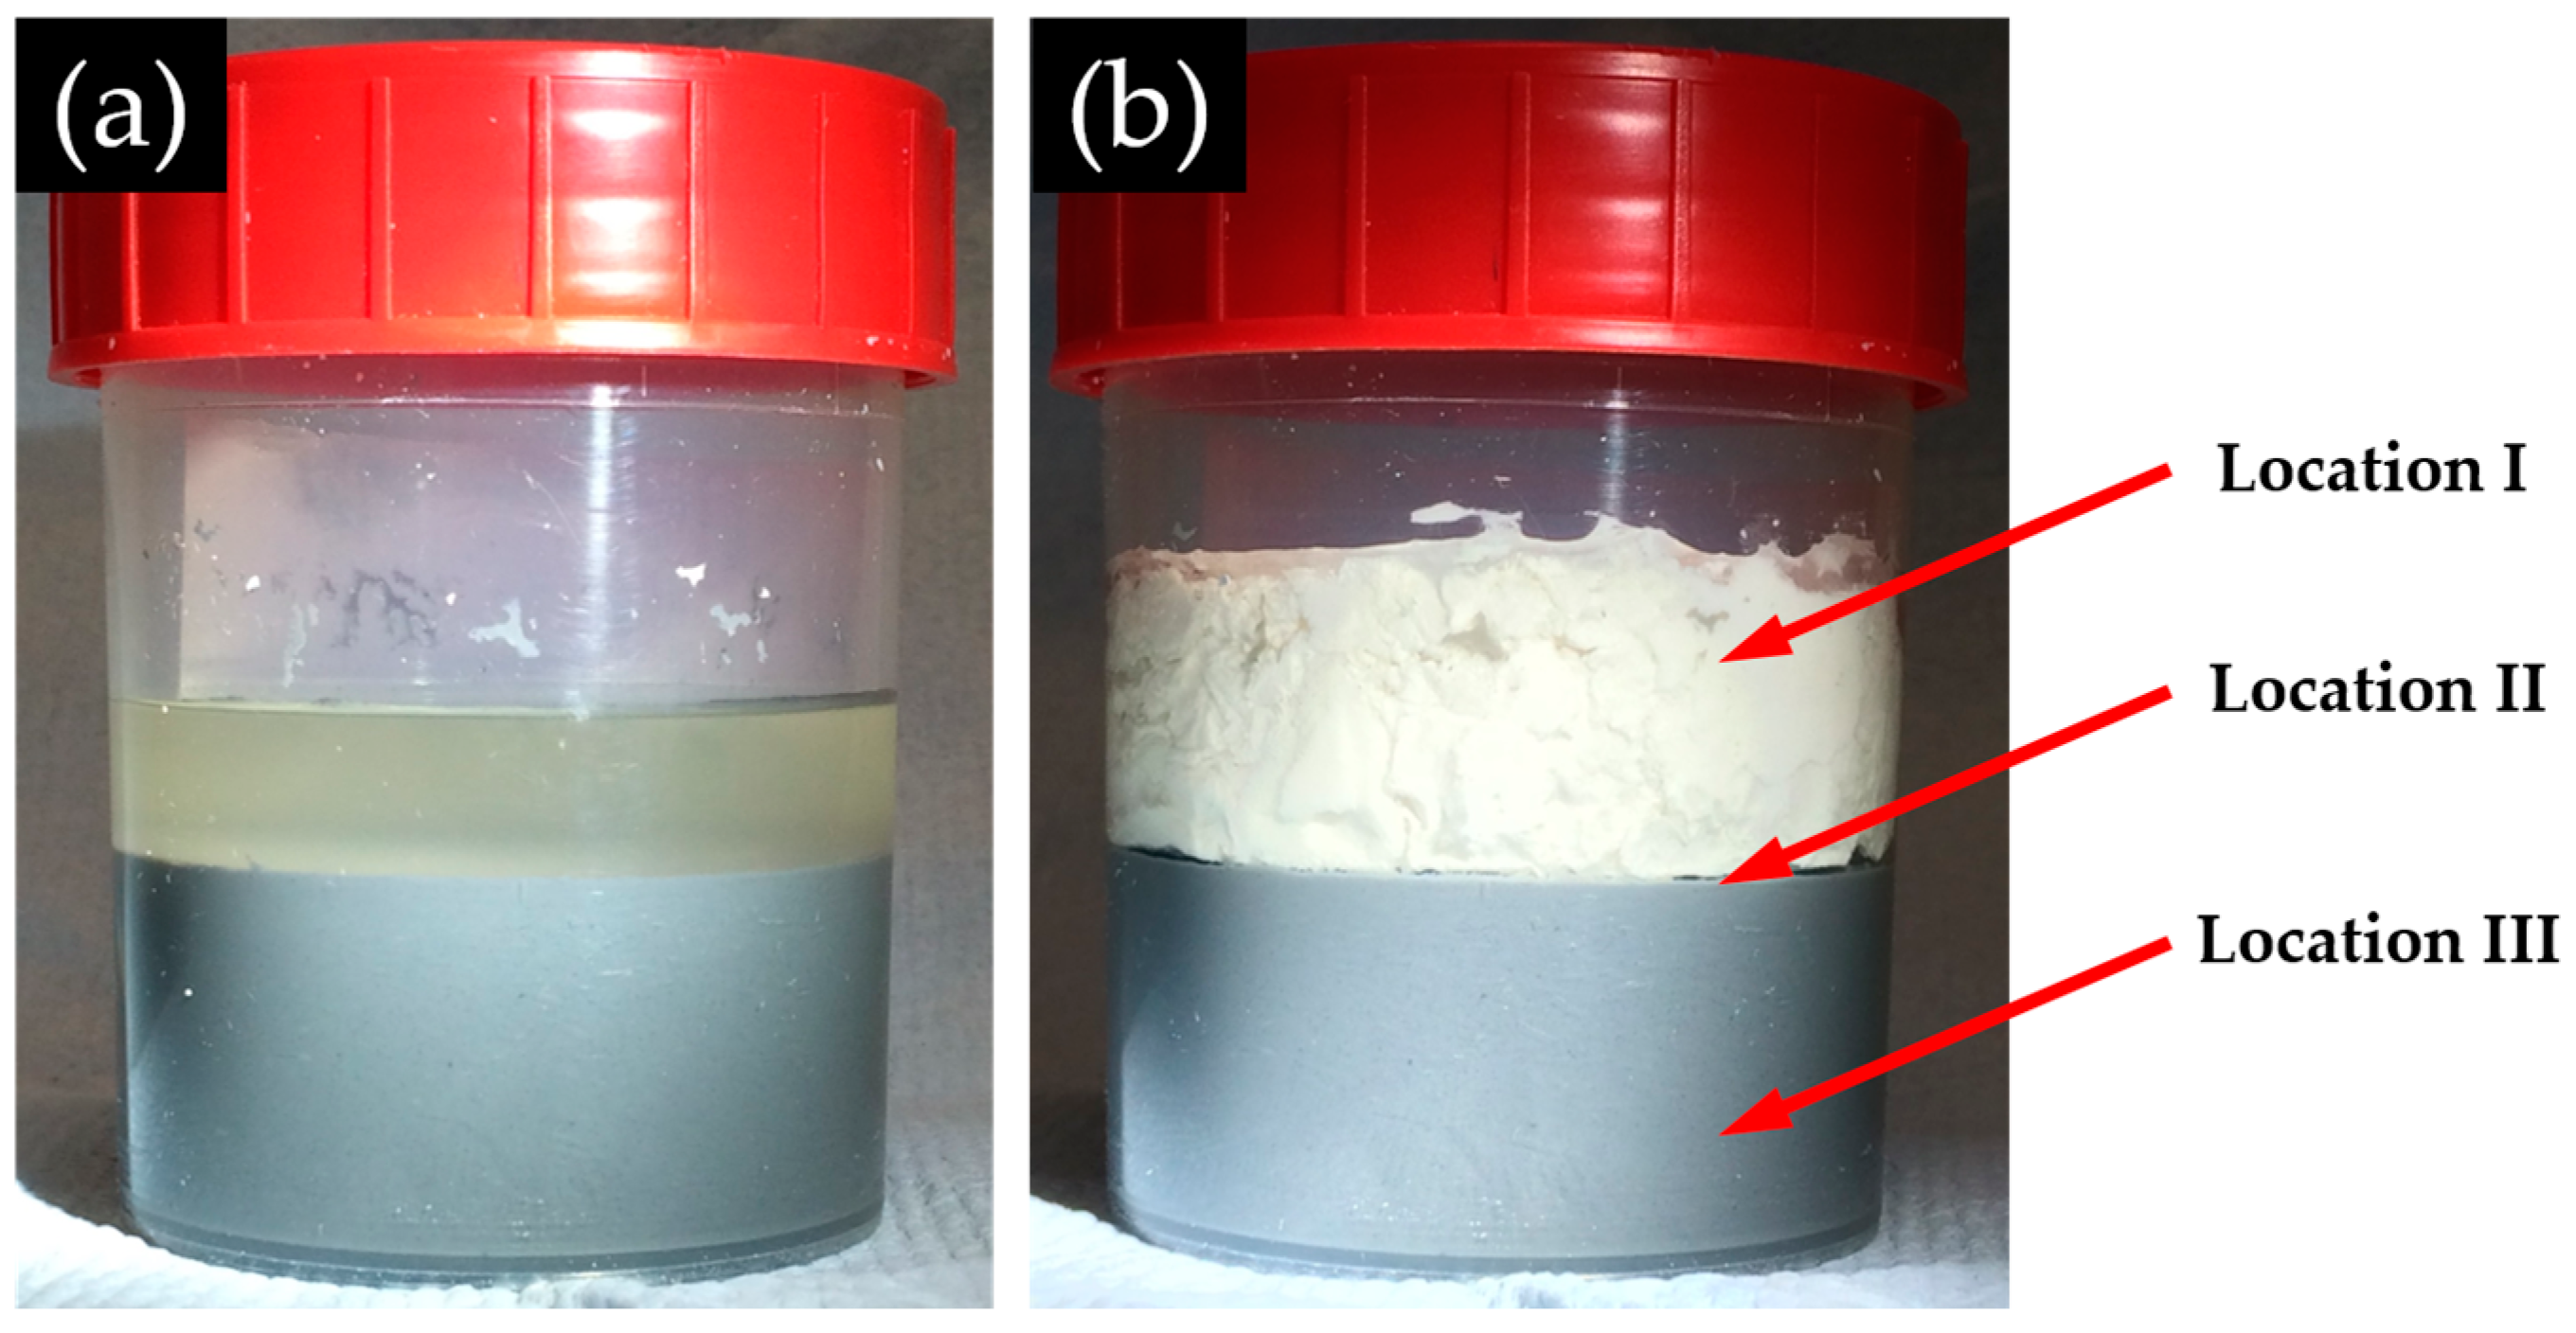
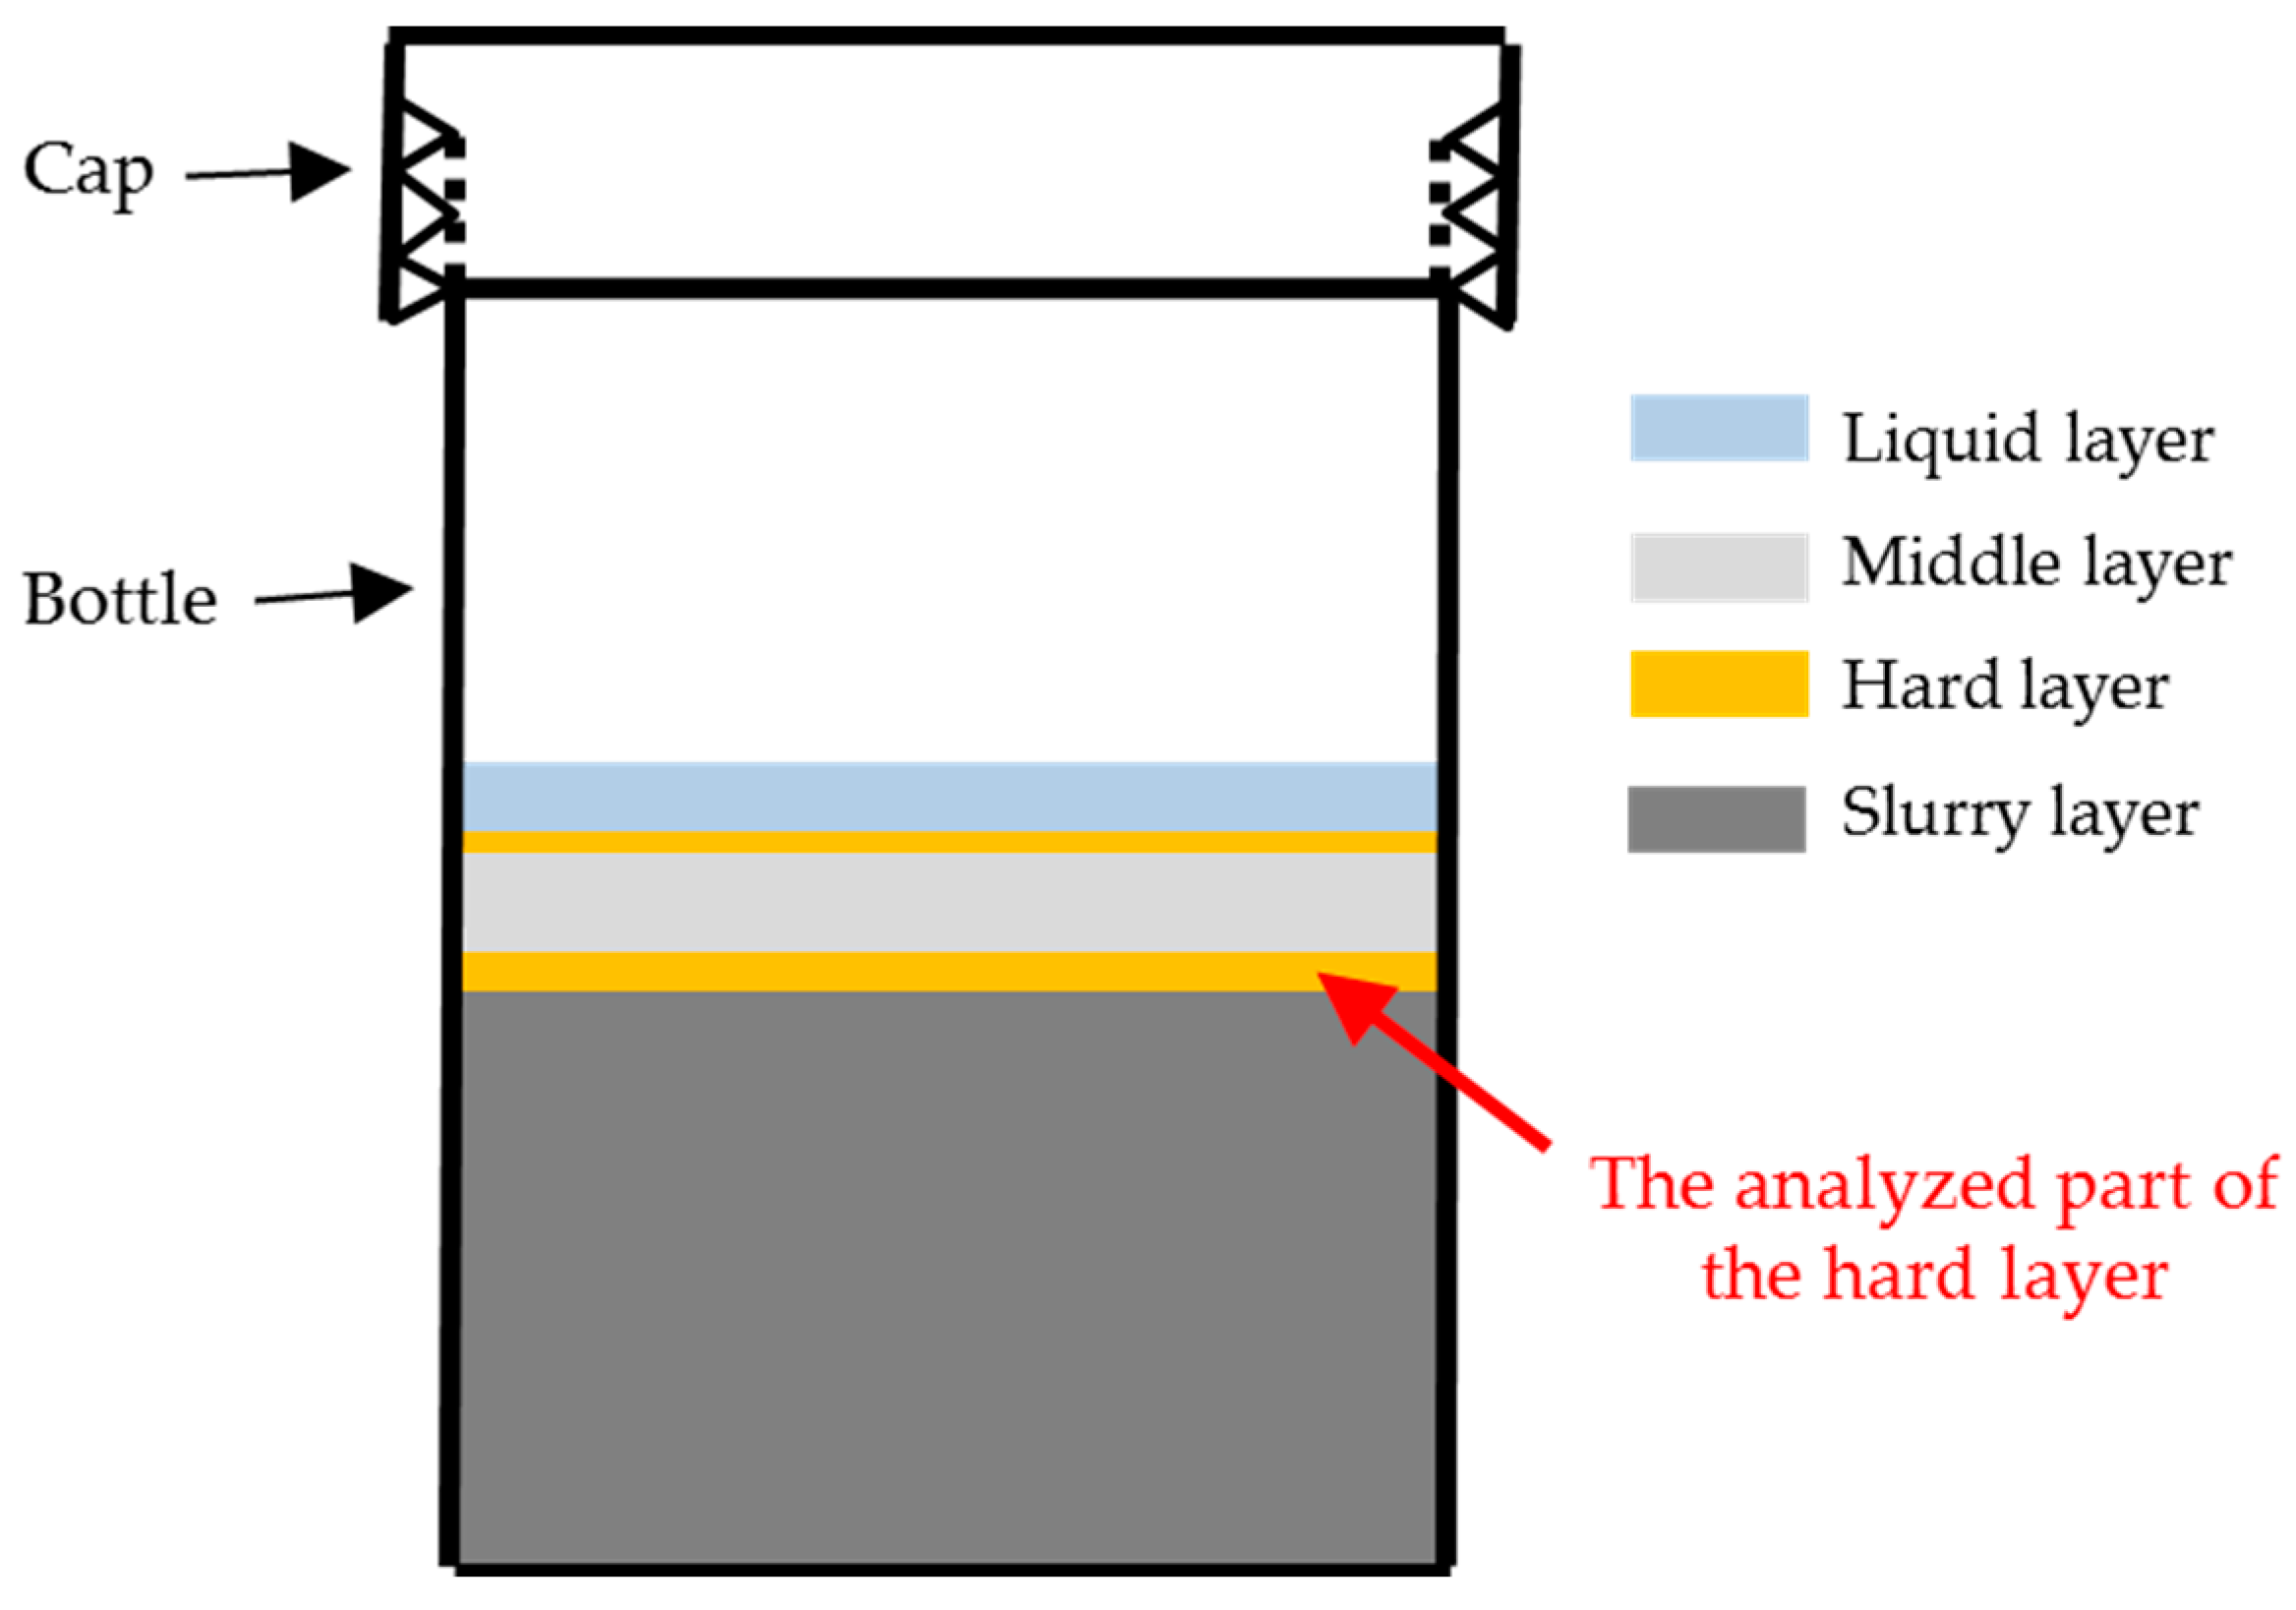
Based on the above results and discussion, this transport barrier preventing the penetration of both calcium and silicate can only be located between the middle layer, which was the calcium source at the top, and the slurry layer, which was the silicate source at the bottom. Considering the layered appearance of this system as shown in
Figure 7, the hard layer physically separated the middle layer and the slurry layer. Therefore, the hard layer was identified as the transport barrier preventing the migration of calcium and silicate. Accordingly, further emphasis will be cast on the hard layer itself to investigate its properties and explore its functioning mechanism as a transport barrier. It needs to be noted that, even though the transport barrier found in this study had comparable functions as the reaction rim, we will keep addressing it as transport barrier rather than reaction rim considering the simplified chemical model system used in this study.
3.6. BSE Imaging
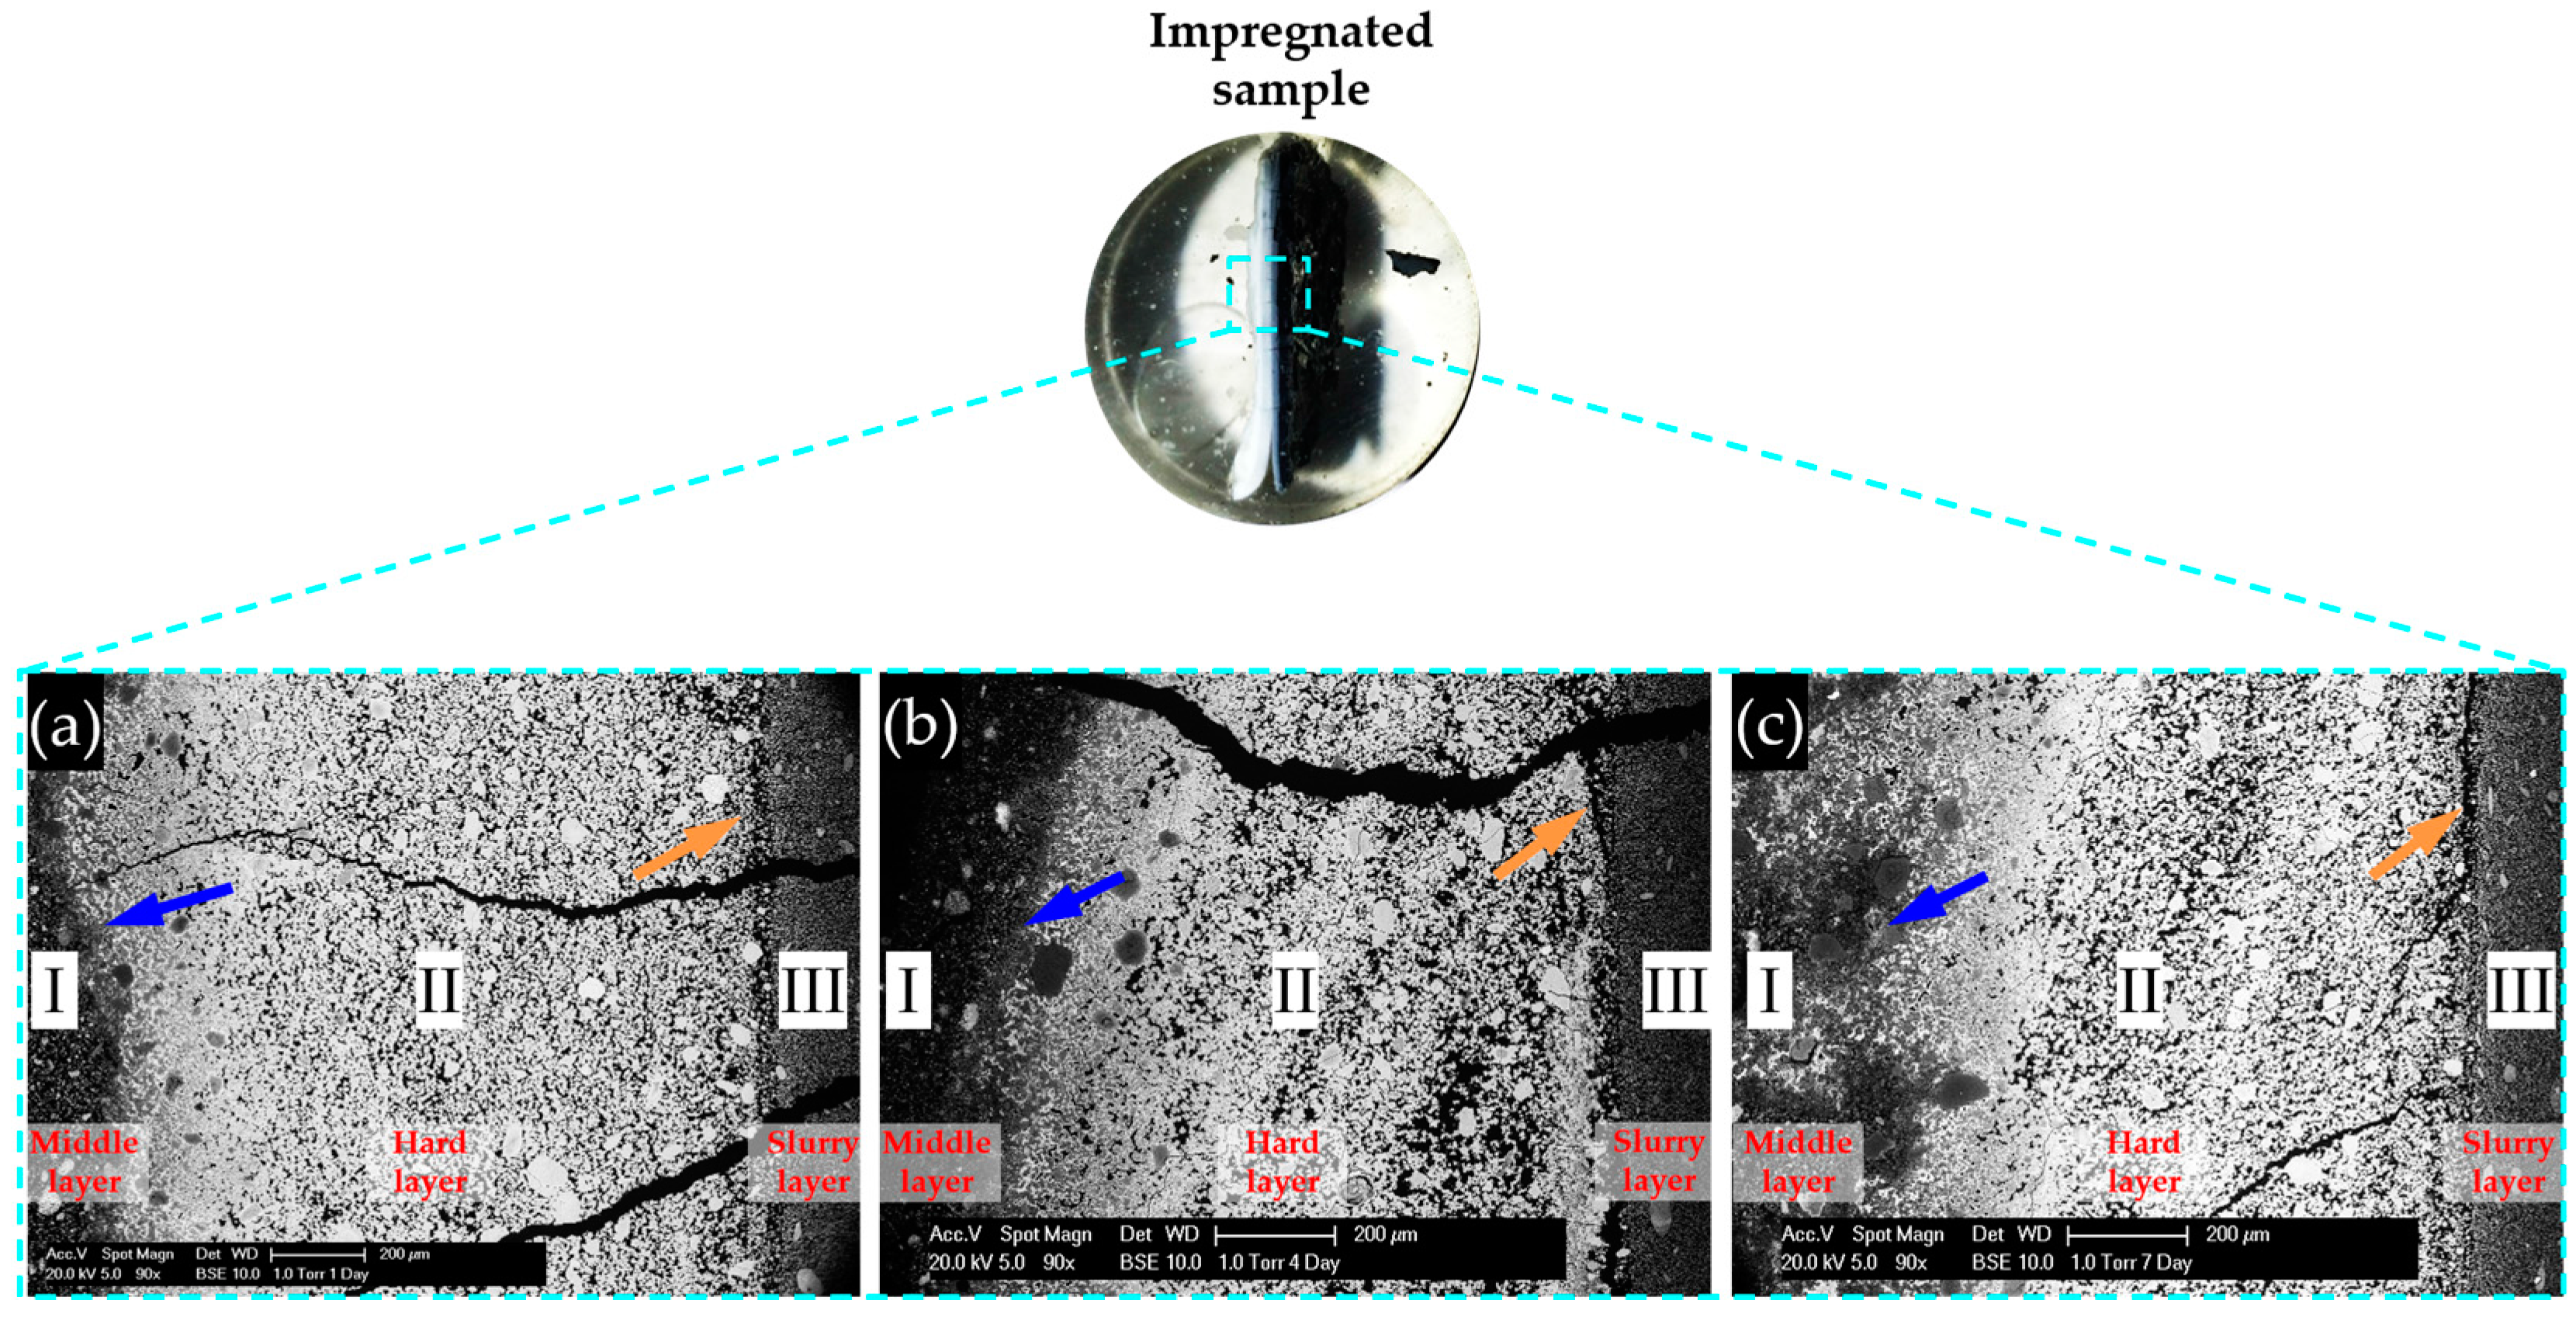
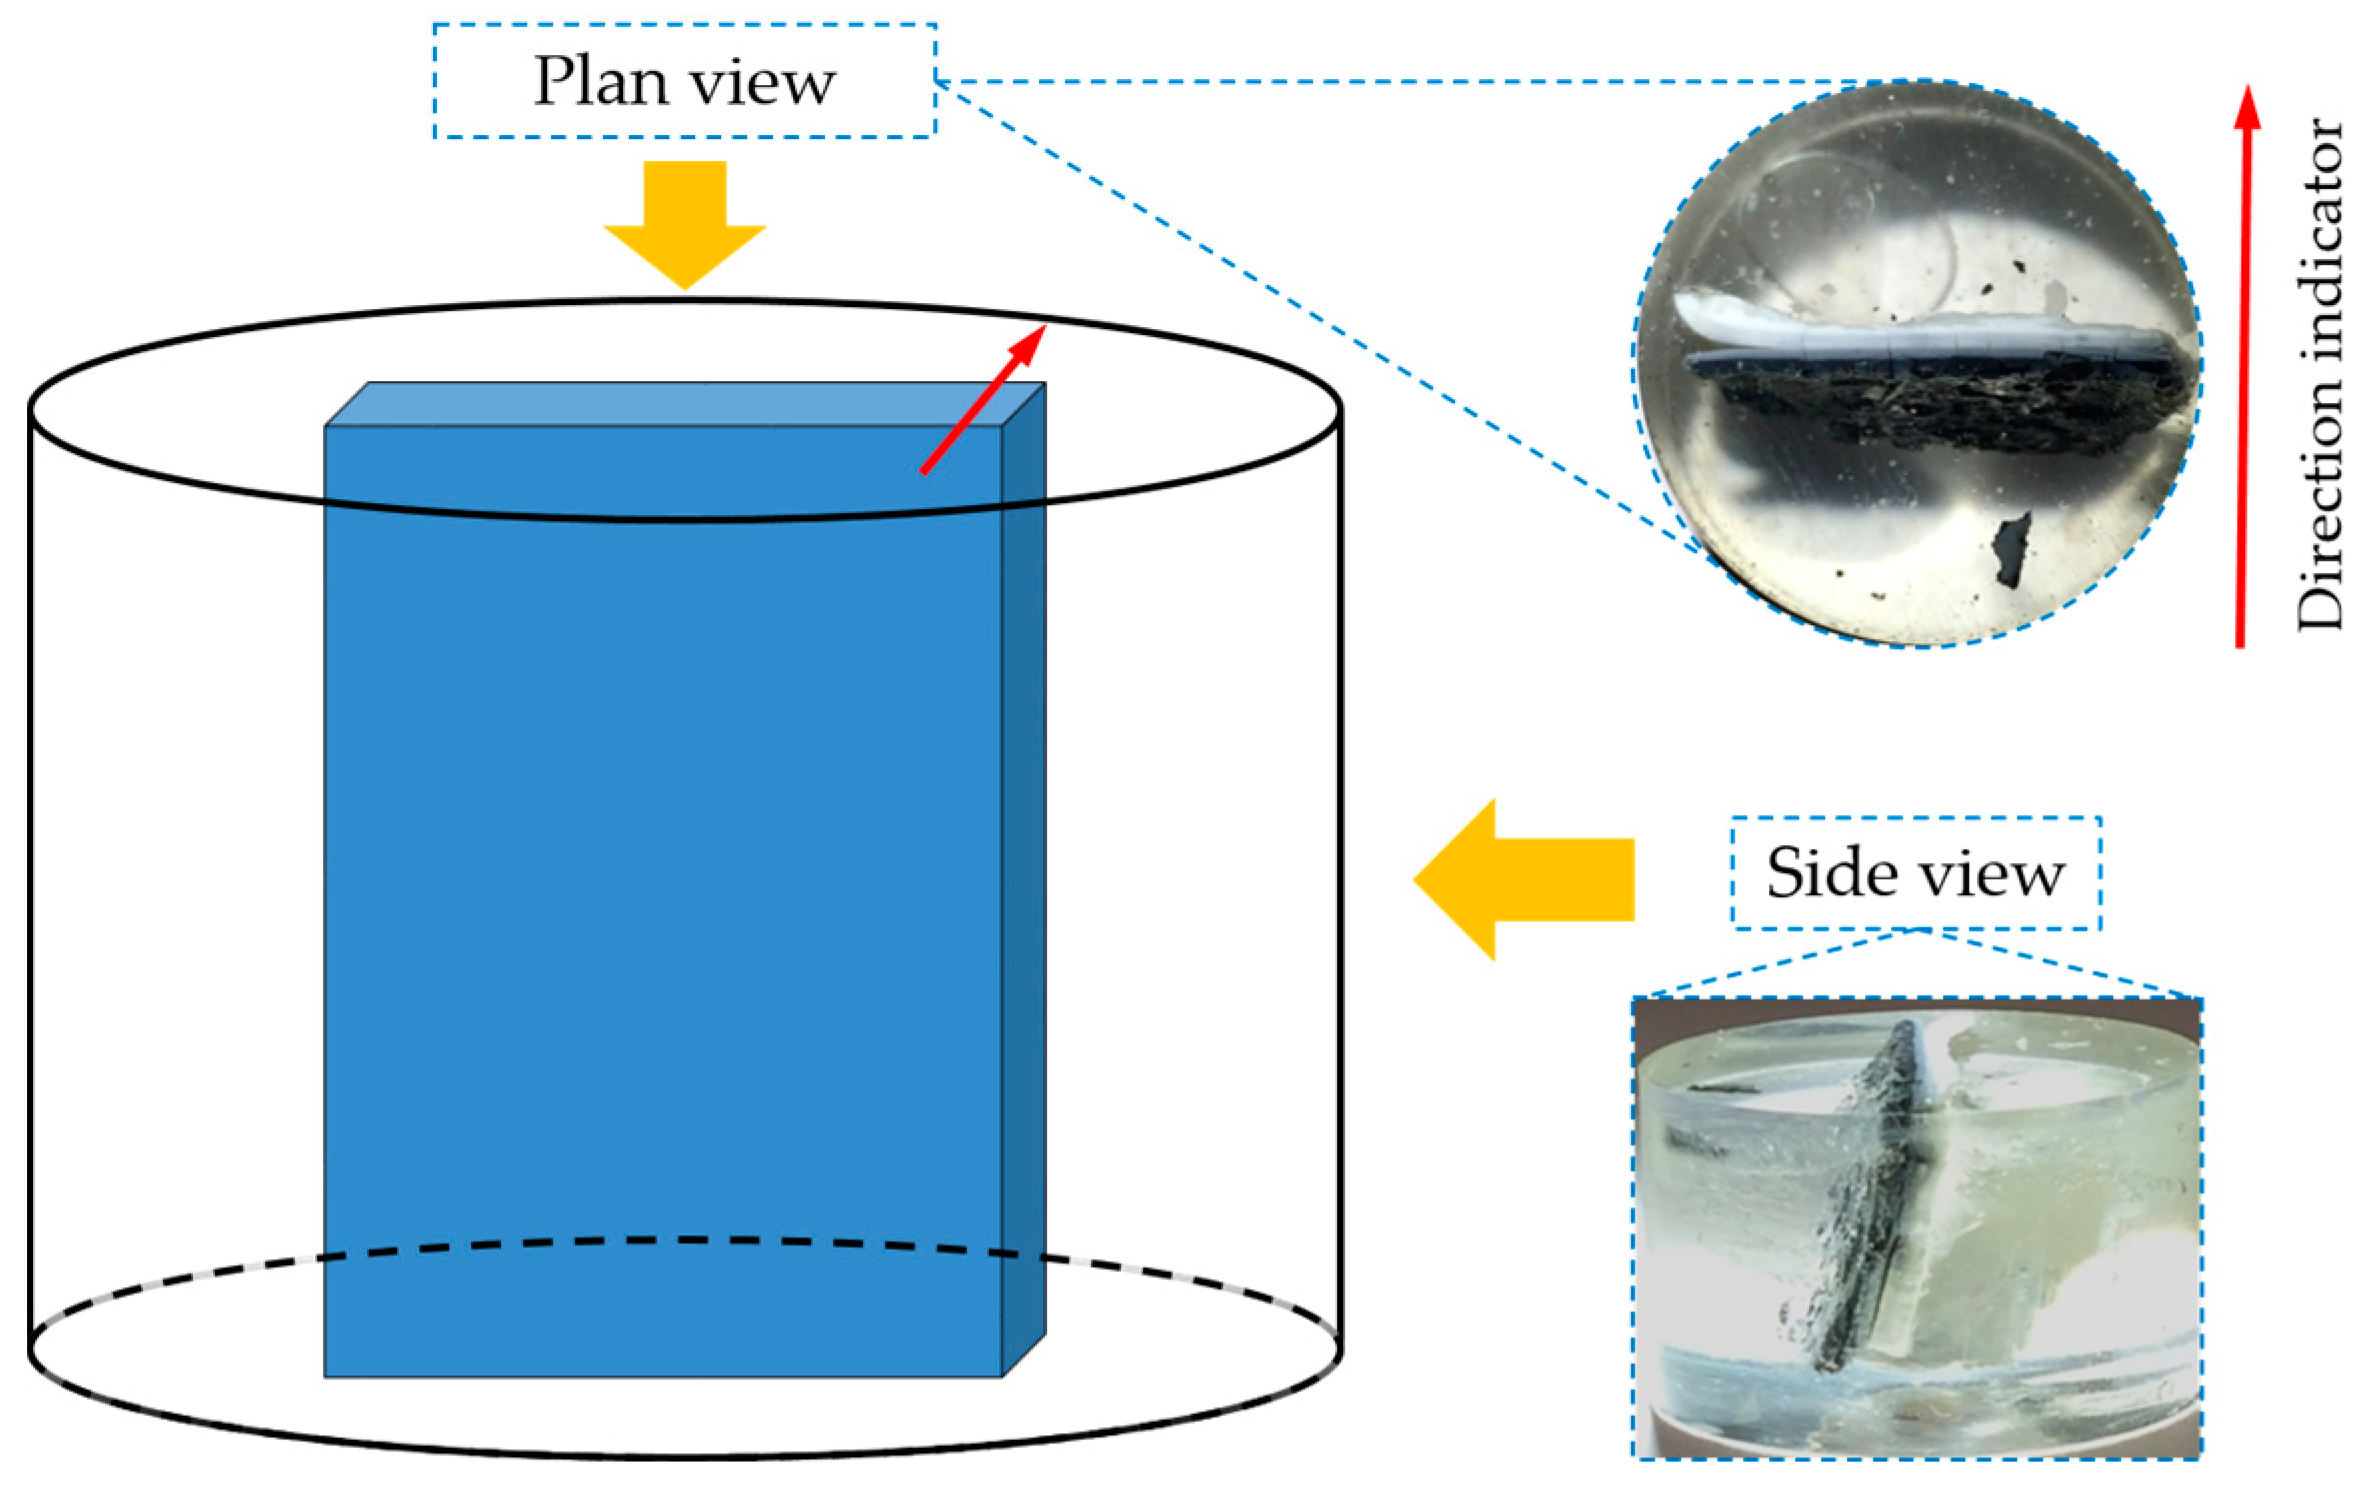
BSE images of samples with storage periods of one, four and seven days are shown in
Figure 13a–c, respectively. The directions of the images are shown as well.
As shown in
Figure 13, the BSE images of all the samples share some similarities. First, obviously, three regions with different grey levels can be found. According to the direction of the sample placement, these three regions can be assigned to the three phases found on the samples: adhesives from the middle layer on the upper surface of the hard layer; the hard layer itself; adhesives from the slurry layer on the lower surface of the hard layer. In particular, Region I was located at the upper surface of the hard layer belonging to the adhesives from the middle layer; Region II was the hard layer; and Region III was located at the lower surface of the hard layer belonging to the adhesives from the slurry layer.
Obviously, compared to the other two regions, the region of the hard layer had the highest grey level indicating it was the most densified phase. The region of the adhesives from the slurry layer was relatively more uniform than the other two regions. The region with the adhesives from the middle layer contained fragmental particles with different size.
The border between the adhesives from the middle layer and the hard layer as indicated with the blue arrows in
Figure 13, were not as clear as the ones between the hard layer and the adhesives from the slurry layer as indicated with orange arrows in
Figure 13. In addition, several cracks can be noticed in all the BSE images in
Figure 13. However, no products can be found in the interior of these cracks. This indicates the cracks did not form until the sample preparation. These cracks probably formed during the drying treatment.
3.7. EDS Results
In order to investigate the elemental composition of the hard layer, EDS area-scanning was carried out on the selected areas of each sample. As shown in
Figure 14,
Figure 15 and
Figure 16 for the sample reacted for one, four and seven days, respectively, the locations of the areas selected for EDS area-scanning are marked with rectangles. For the sake of convenience, the elemental composition of each area analyzed by EDS was expressed as Ca/Si ratio and alkali to silica mole ((Na+K)/Si) ratio. The averaged Ca/Si ratios and (Na+K)/Si ratios as well as their corresponding deviations of the areas from each column were plotted according to its relative position as indicated in the BSE images.
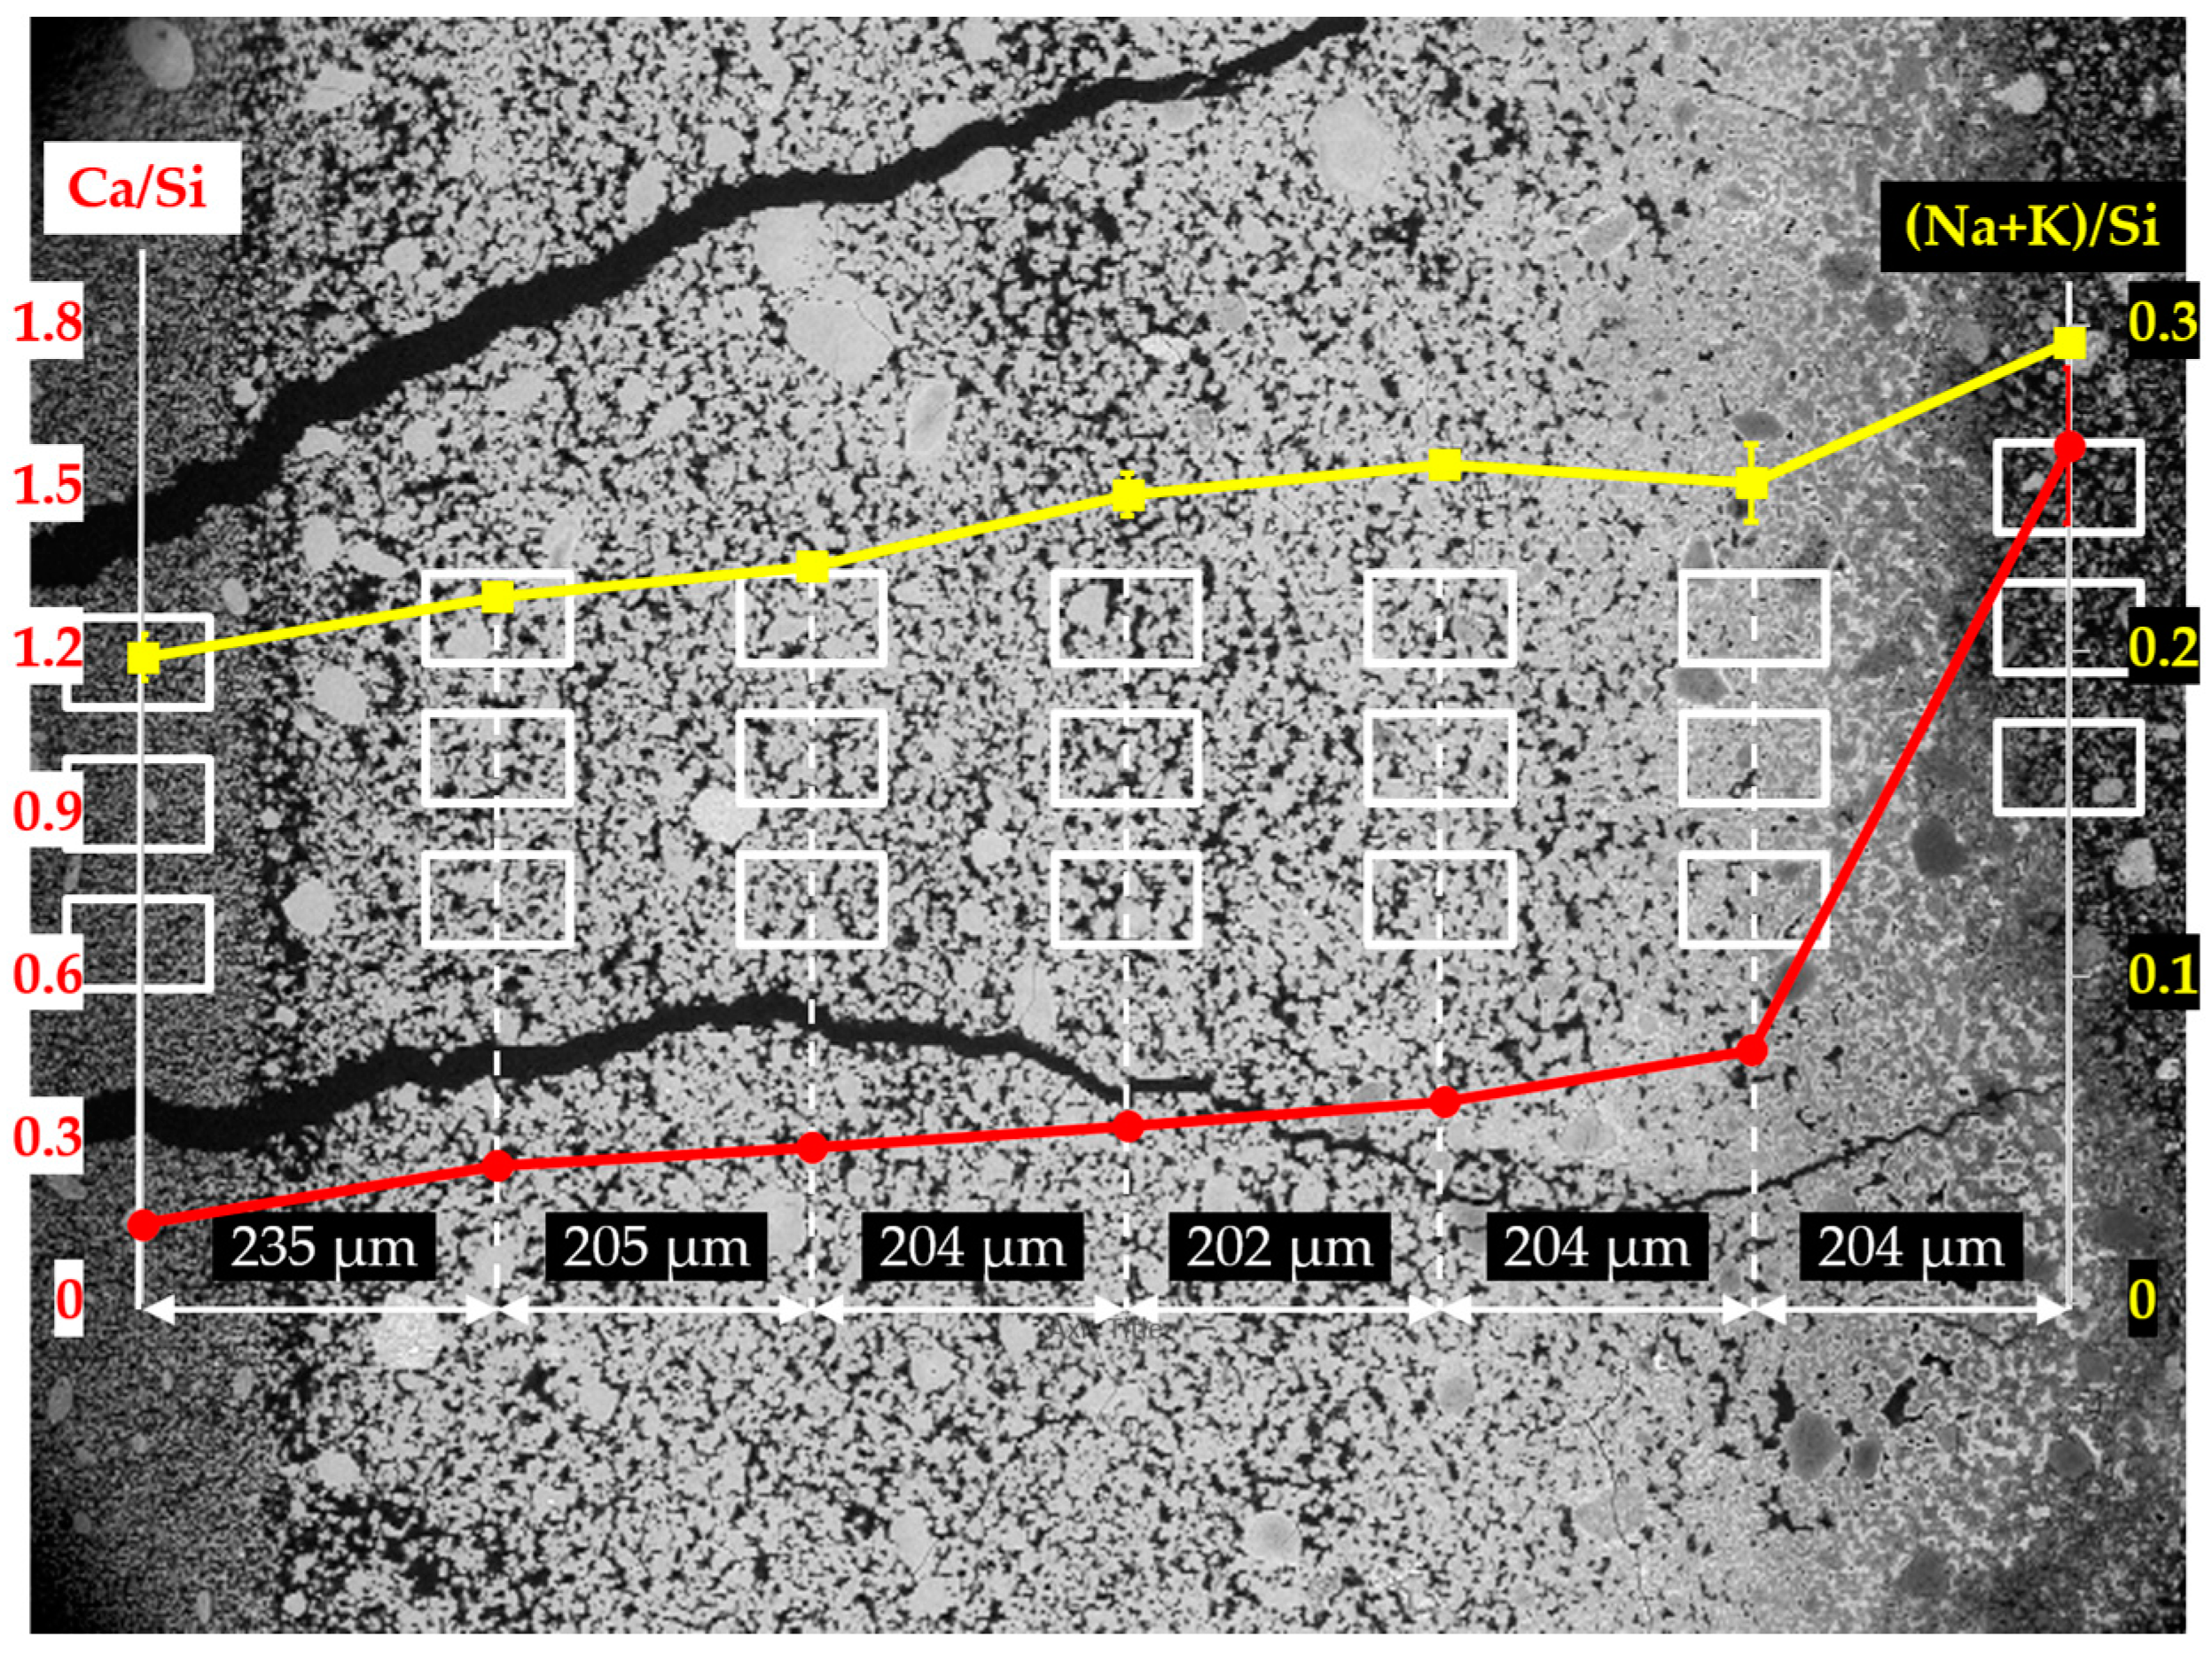
The EDS results of the sample reacted for one day are shown in
Figure 14. Based on the results of Ca/Si ratio, two regions can be differentiated: the first region containing the six columns on the left having a low value of Ca/Si ratio; the second one containing the first column on the right having a high value of Ca/Si ratio. The Ca/Si ratios of the areas from the second region, in particular, were about 1.60 on the mean, while the Ca/Si ratios of the areas from the first region were lower than about 0.40.
Interestingly, the Ca/Si ratio dropped dramatically from about 1.60 to about 0.40 within a distance of 204 µm between the first and second columns from the right, confirming the existence of the border of the hard layer with the adhesives from the middle layer between the first and the second columns as marked with a blue arrow in
Figure 13a. The huge decrease of the Ca/Si ratio across the border indicates that, the hard layer was able to keep large amount of calcium outside of its territory. It should be noted that, either the decreasing amount of calcium or the increasing amount of silicon present in these areas, can cause the decrease of Ca/Si ratio. However, for the situation here on the border of the hard layer with the adhesives from the middle layer where abundant Ca(OH)
2 was present, the decreasing amount of calcium should be the dominant effect since the concentration of silicate in these areas was expected to be low. On the contrary, such a significant decrease of Ca/Si ratio was not found across the border of the hard layer with the adhesives from the slurry layer, as indicated with an orange arrow in
Figure 13a. The Ca/Si ratio dropped from about 0.25 for the areas located on the hard layer to about 0.14 for the areas located on the adhesives from the slurry layer. This minor decrease was probably attributed to the abundant presence of silicate near the lower surface of the hard layer in contact with the slurry layer beneath. In other words, the relatively high concentration of silicate as well as the relatively low concentration of calcium limited the change of the Ca/Si ratio in this area.
Moreover, for the areas located within the territory of the hard layer, their Ca/Si ratio slightly decreased from about 0.45 to about 0.25 as getting away from the border of the hard layer with the adhesives in a distance of about 800 µm. This implies the hard layer was even capable of preventing migration of calcium and silicate within its territory. In addition, the changes of the (Na+K)/Si ratio had a smaller variation ranging from 0.20 to 0.30 indicating the weak interaction between the hard layer and the alkalis.
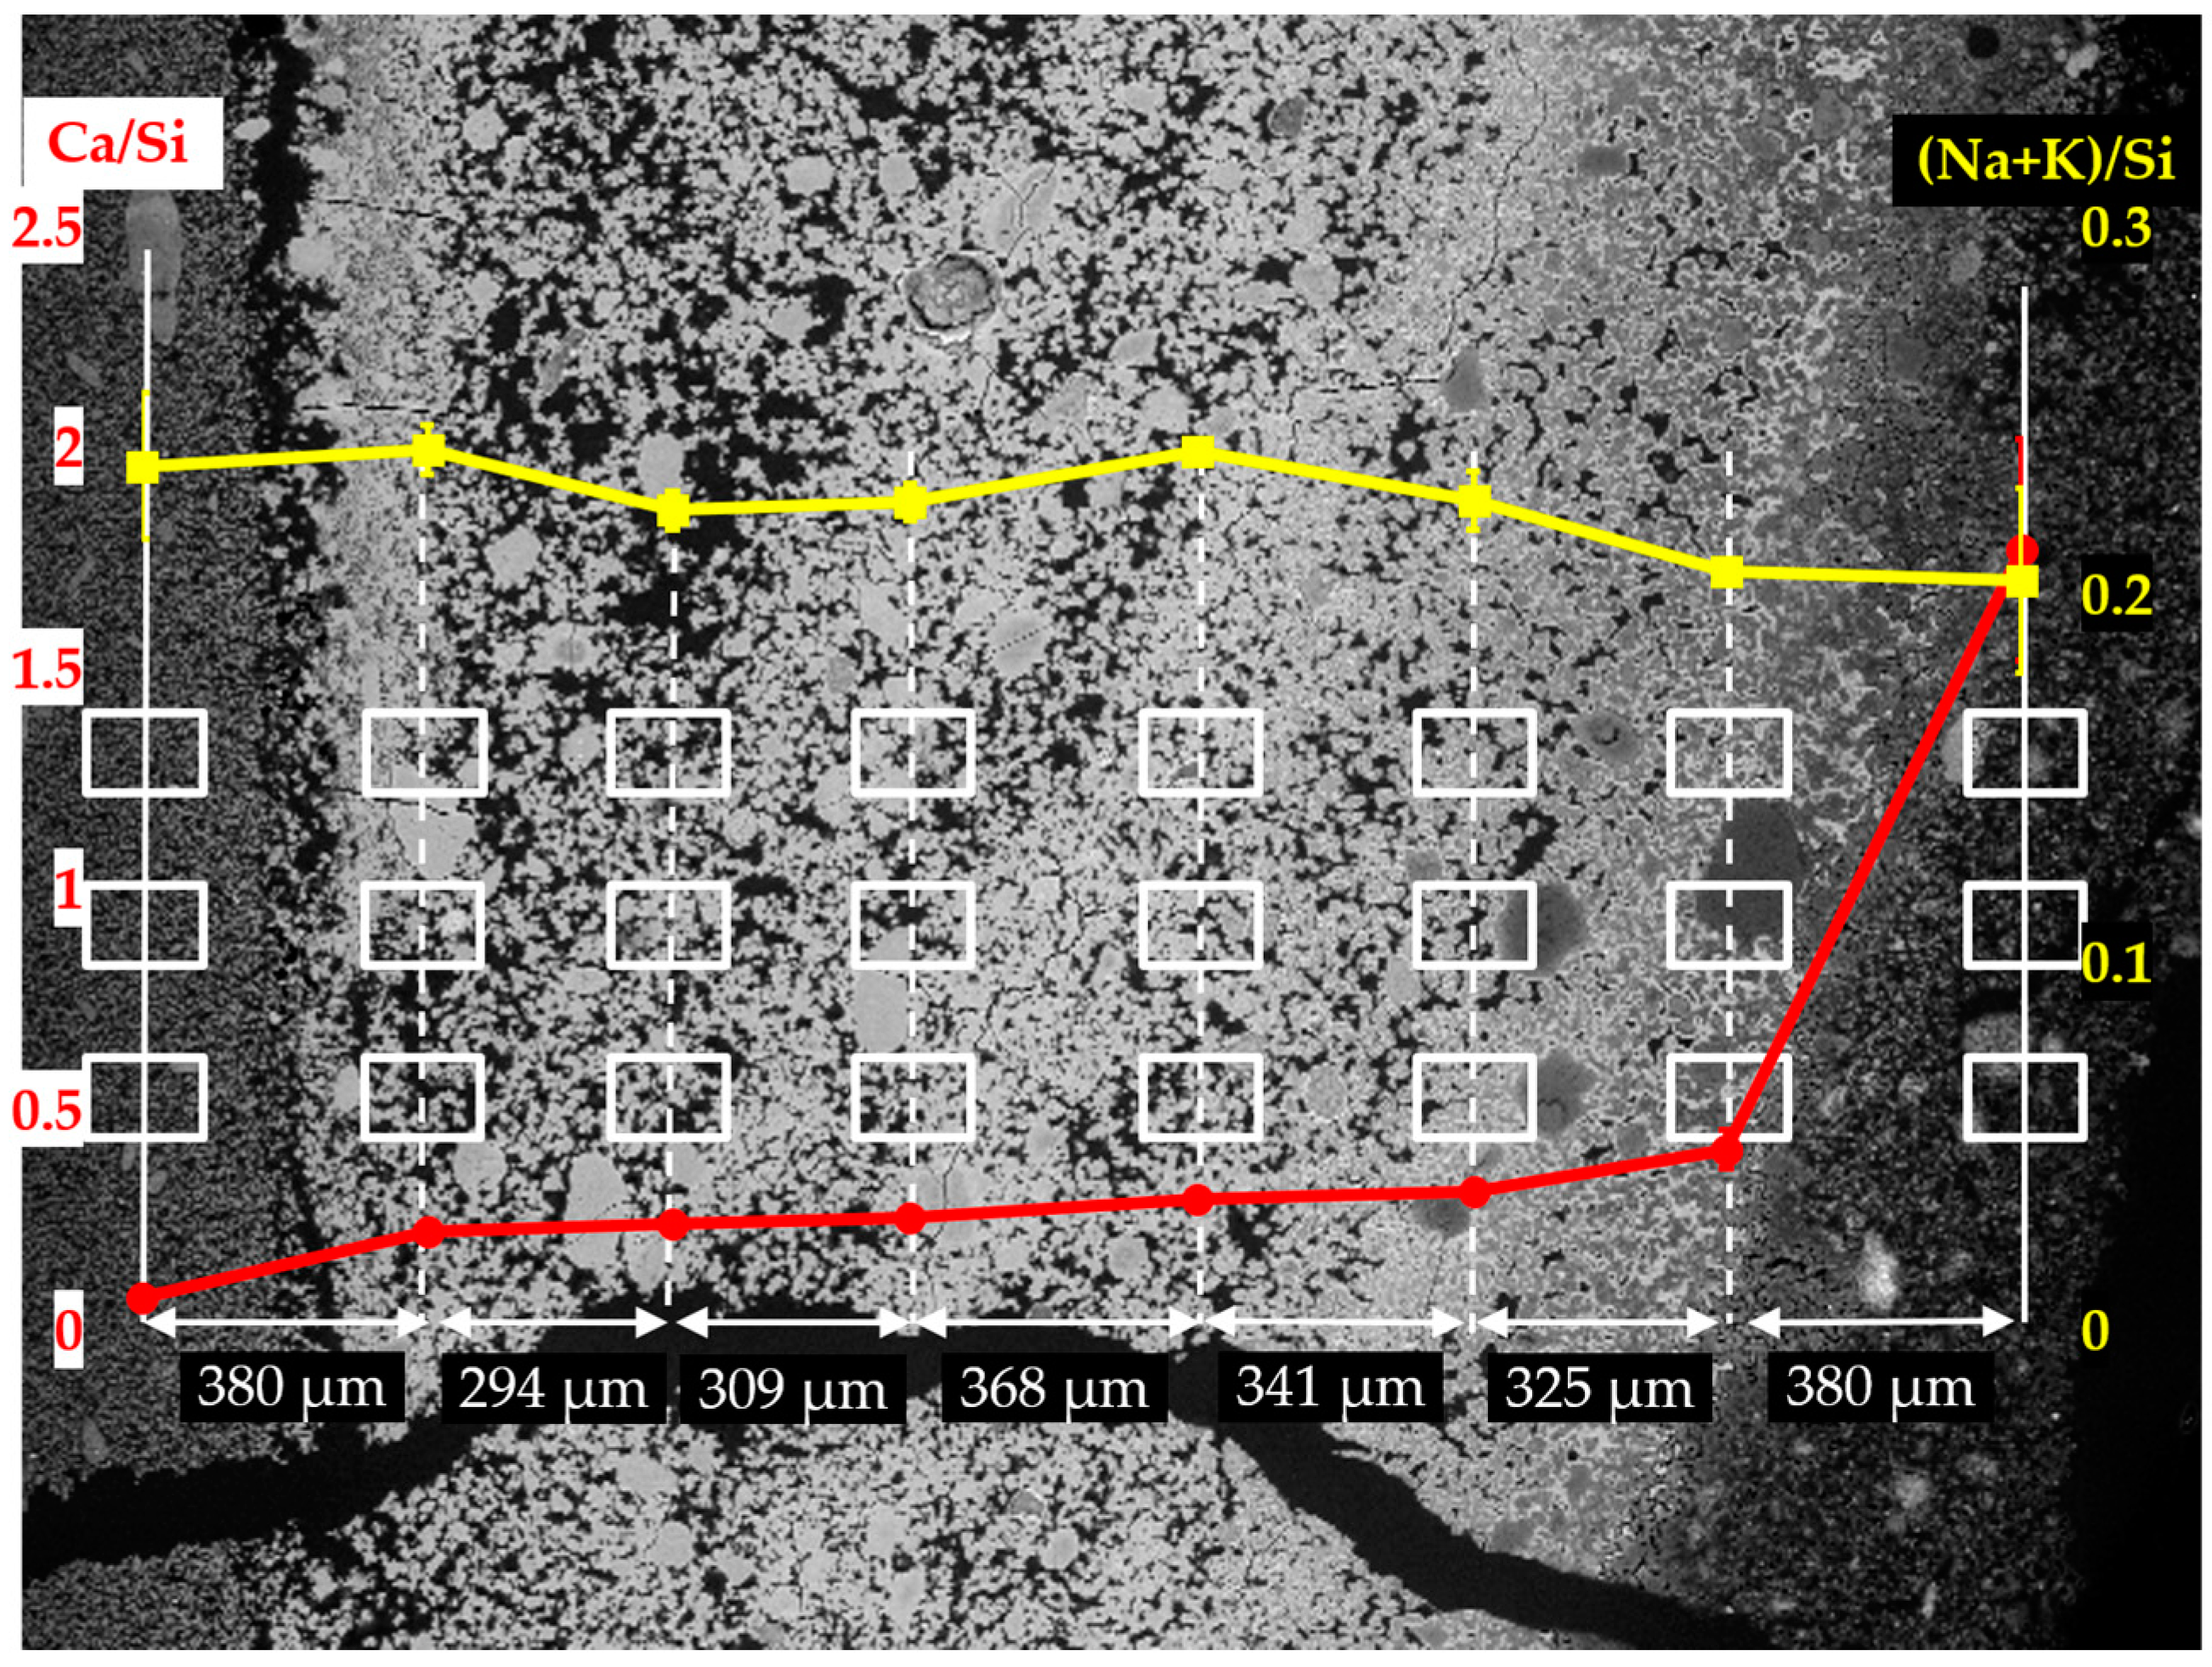
The EDS results of the analyzed areas of the sample reacted for four days are shown in
Figure 15. Similar to the sample reacted for one day, two regions can be differentiated with respect to the values of Ca/Si ratio: the region containing the first column from the right with a high value of Ca/Si ratio; the region containing the other seven columns on the left with a low value of Ca/Si ratio. Based on the observation from the BSE image shown in
Figure 13b, the region with high value of Ca/Si ratio was located on the adhesives from the middle layer; the region with the second column to the seventh column on the right was located on the hard layer itself; the first column on the left was located on the adhesives from the slurry layer.
Comparably, a dramatic decrease of the Ca/Si ratio was noticed from the first column on the right to the second one. The Ca/Si ratio dropped from about 1.80 to about 0.40 within a distance of 380 µm suggesting the existence of the border between the hard layer with the adhesives from the middle layer as indicated with a blue arrow in
Figure 13b. Such a high value of Ca/Si ratio implies the presence of Ca(OH)
2 in this region. Besides, the dramatic drop of Ca/Si ratio confirms the ability of the hard layer to stop the penetration of calcium into its matrix. With respect to the border of the hard layer with the adhesives from the slurry layer as indicated with an orange arrow in
Figure 13b, the Ca/Si ratio dropped from about 0.24 to about 0.08 across the border. This decrease of Ca/Si ratio was mainly attributed to the significantly increasing concentration of silicate rather than the decreasing concentration of calcium confirming the hard layer was able to stop the transport of silicate as well. Moreover, the (Na+K)/Si ratio did not show significant changes across these regions consistent with the results of the sample reacted for one day.
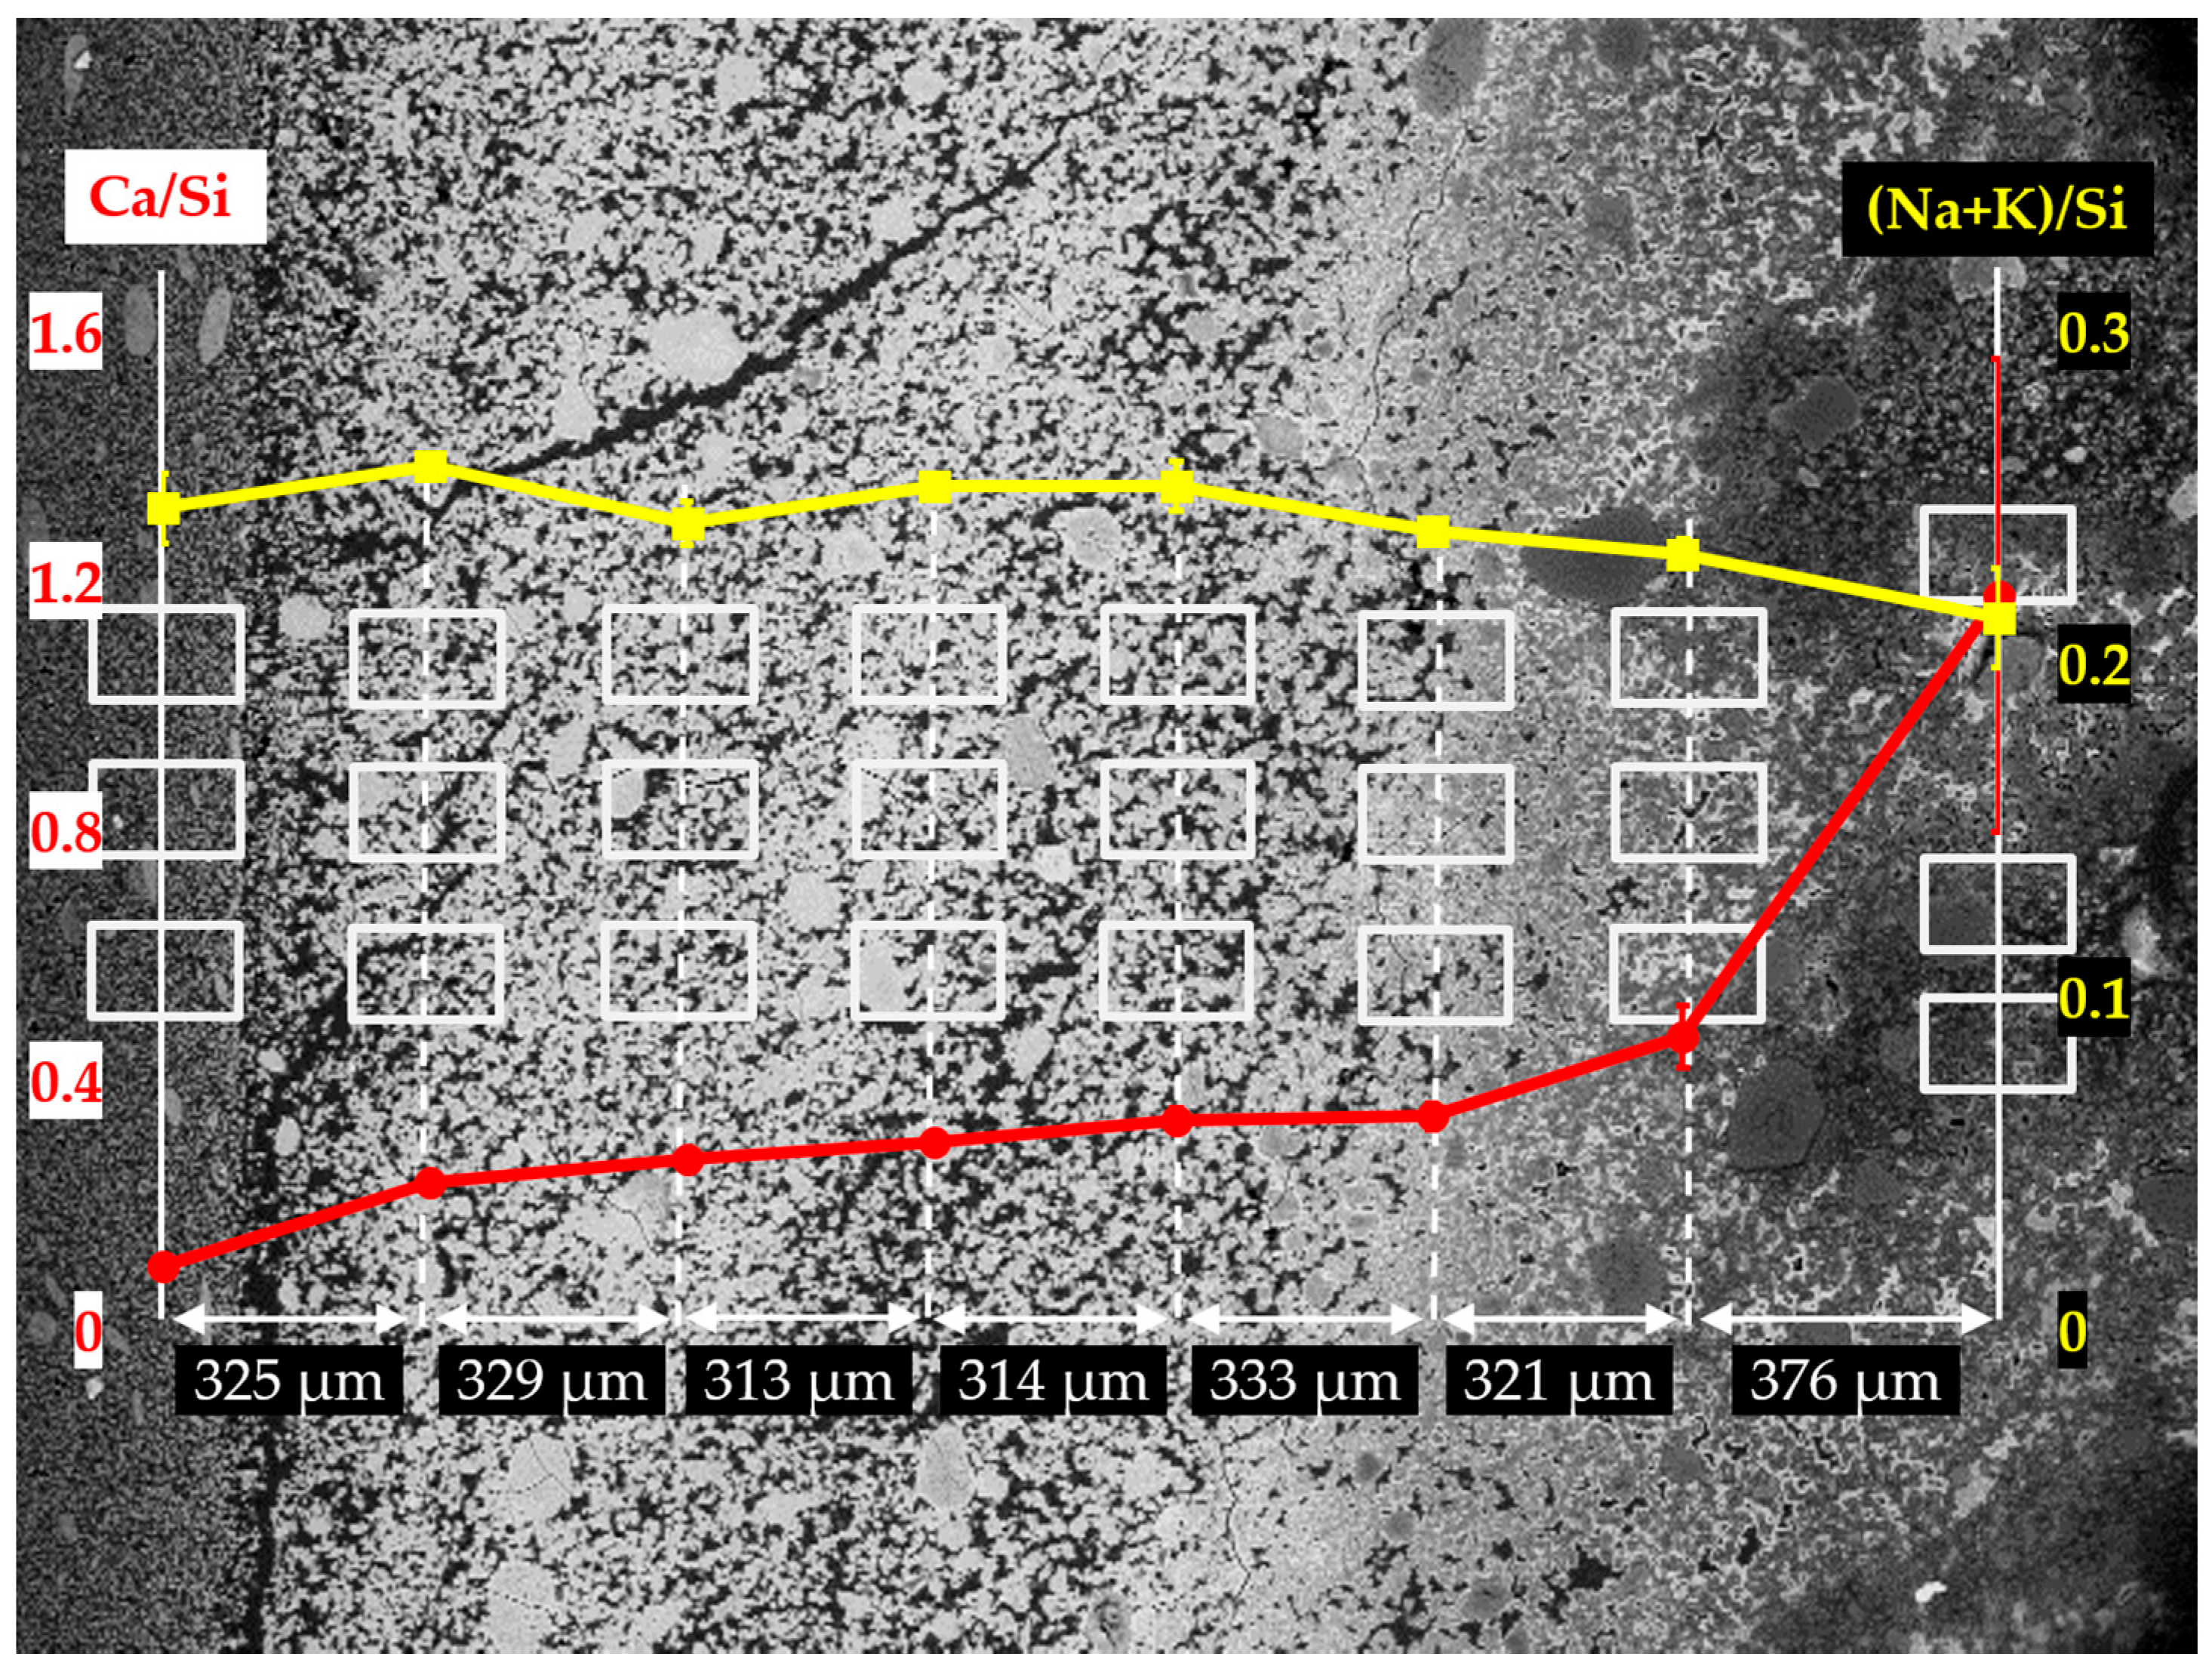
In
Figure 16, the EDS results of the sample reacted for seven days are given. Compared to the samples with the reaction periods of one day and four days, a similar trend of Ca/Si ratio variation across the borders has been found. A significant decrease of Ca/Si ratio was noticed across the border of the hard layer with the adhesives from the middle layer from about 1.20 to about 0.47 within a distance of 376 µm. Meanwhile, the Ca/Si ratio experienced another considerable decrease across the border of the hard layer with the adhesives from the slurry layer from about 0.25 to about 0.10. This is consistent with the results from the other two samples that, the hard layer was indeed able to prevent the transport of calcium and silicate across its borders. Furthermore, for the areas in the interior of the hard layer, their Ca/Si ratios slightly dropped from about 0.47 to about 0.25, suggesting the hard layer was also capable of preventing the migration of calcium and silicate in its interior. In addition, (Na+K)/Si ratio experienced a minor variation ranging from 0.21 to 0.25 consistent with the results of the other two samples.
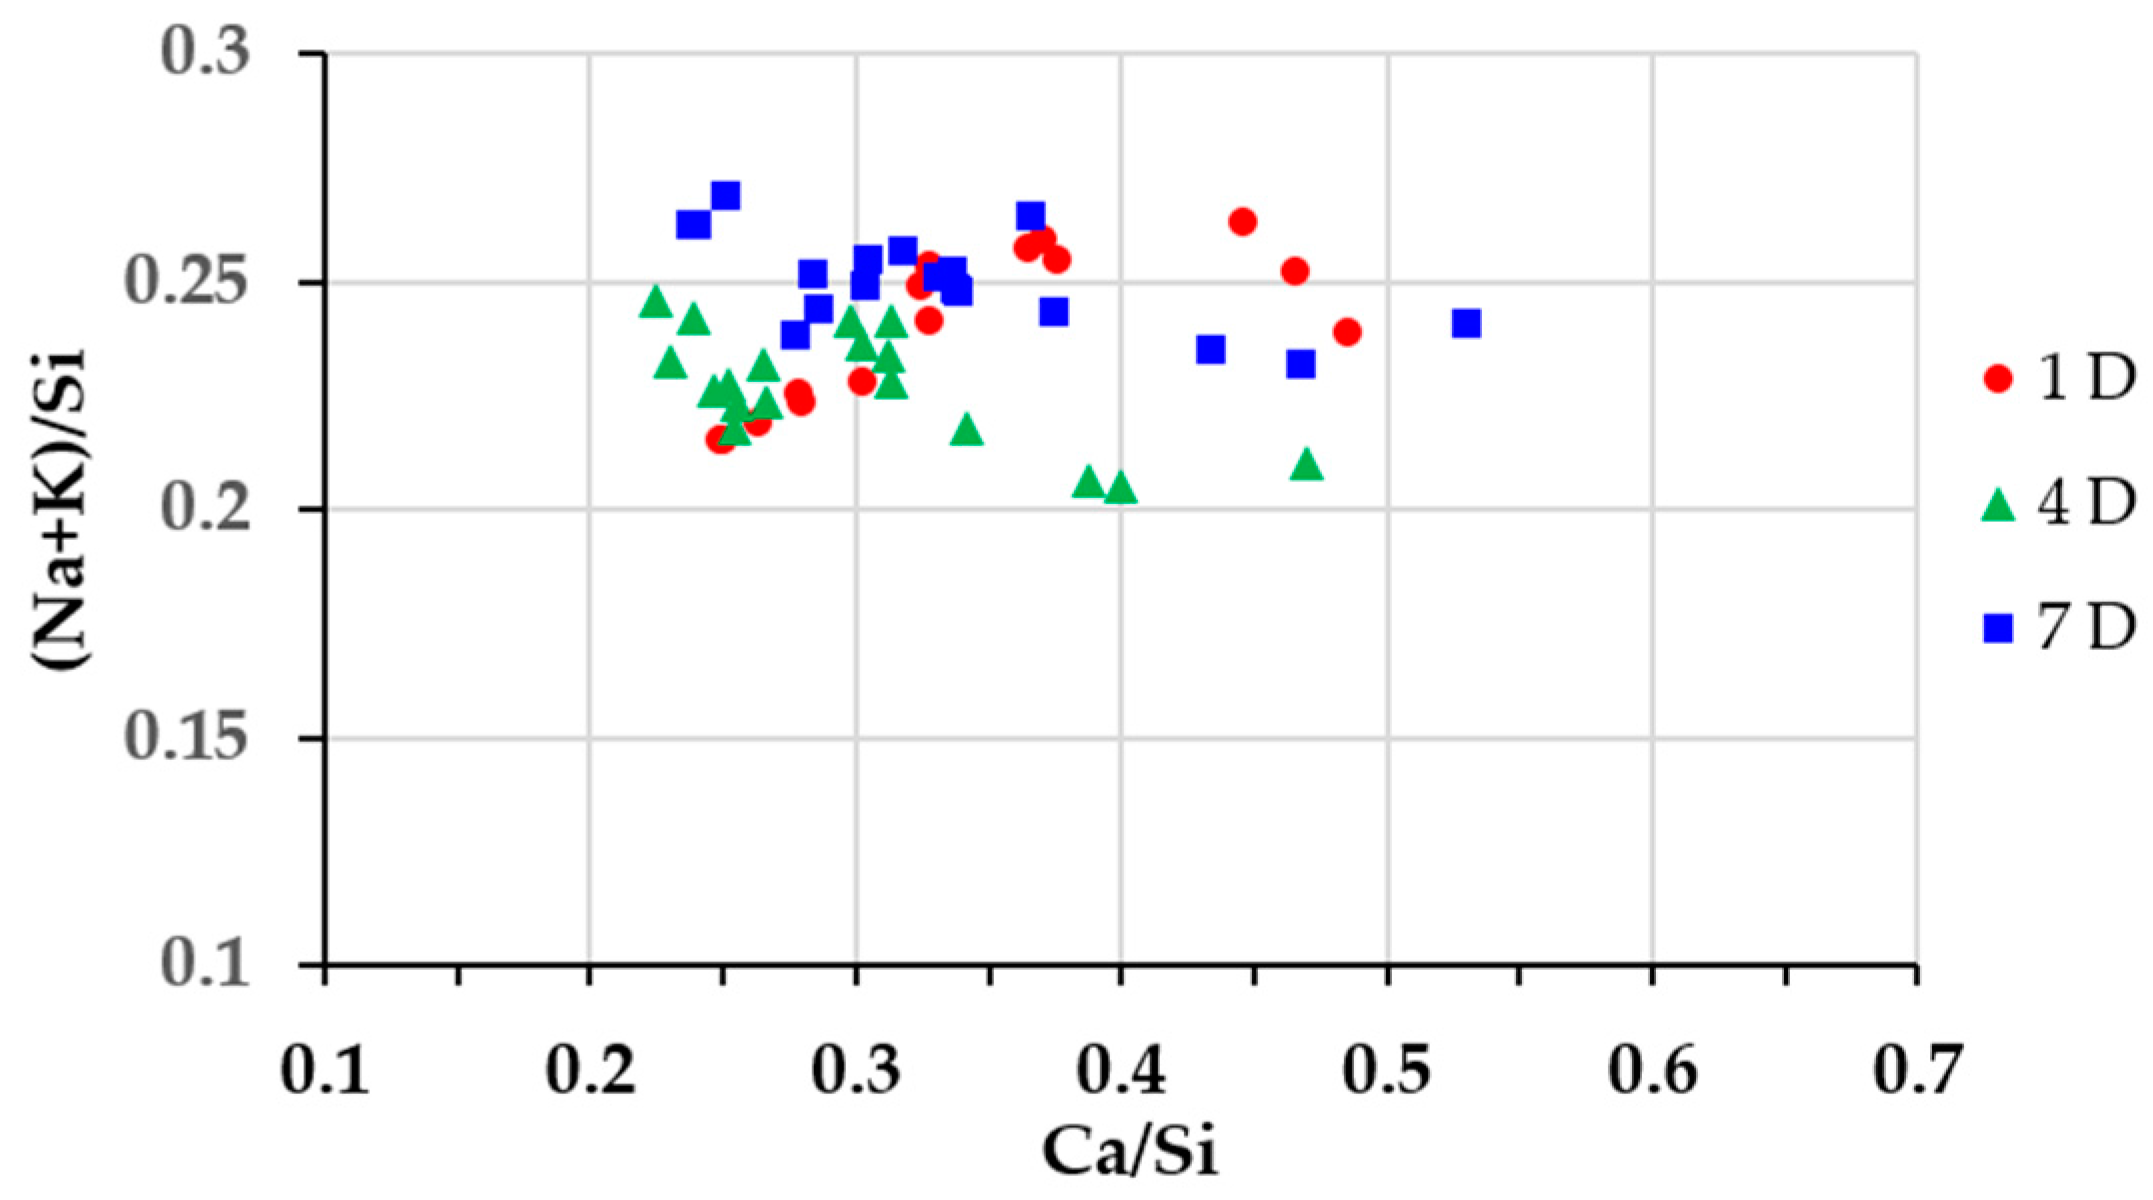
With the help of the above results, the areas located at the hard layers itself from different samples can be identified. Thereafter, the Ca/Si ratio of these areas are plotted against their corresponding (Na+K)/Si ratio to reveal the elemental composition of the hard layer, as shown in
Figure 17. The results appeared to be relatively concentrated implying the similarity among the samples with different storage periods. The Ca/Si ratio of calcium alkali silicate found on the hard layers was roughly ranging between 0.22 and 0.53; the (Na+K)/Si ratio was ranging between 0.20 and 0.26. This is different from the previous studies that the reaction rim found in real concrete was with either high Ca/Si ratio [
7] or low Ca/Si ratio [
9]. This is perhaps due to the relatively pure chemical model system used in this study compared to the heterogeneous conditions in real concrete. Moreover, the areas located closer to the lower surface of the hard layer which was in contact with the slurry layer, had a lower Ca/Si ratio; the ones located closer to the upper surface of the hard layer which was in contact with the middle layer, had a higher Ca/Si ratio. Interestingly, the Ca/Si ratios of all the areas located close to the lower surface of the hard layer in contact with the slurry layer were around 0.20. It seems this is the lowest Ca/Si ratio for the calcium alkali silicate to form the hard layer.
3.8. NMR Results
The powdered samples from the hard layer with different reaction periods were analyzed with
29Si NMR. For the sake of convenience, it is necessary to introduce the standard notation of Q
n nomenclature to interpret the NMR spectra [
17]. Q represents a given tetrahedron; the exponent n represents the number of the associated oxygen with silicon. In this way, a Q
4 tetrahedron has four bridging oxygen with silicon suggesting the existence of a complete interlinked silicon–oxygen organization, e.g., a 3D structure. A Q
3 tetrahedron has three bridging oxygen and one non-bridging oxygen with silicon suggesting this tetrahedron has one bond available for bridging. Notably, the non-bridging oxygen can be bonded to another cation other than silicon, e.g., bonded to a proton to form an –OH group. A Q
2 tetrahedron has two bridging oxygen and two non-bridging oxygen indicating the existence of a less cross-linked silicon–oxygen organization as compared to Q
3. Q
2 is usually found to be present as part of a chain. A Q
1 tetrahedron has only one bridging oxygen with silicon and three non-bridging oxygen, which is usually found to be present at the end of a structure or as in a dimer. Q
0 tetrahedron has four non-bridging oxygen usually present as monomer Si(OH)
4. With the help of this nomenclature, the processes of polymerization and de-polymerization can be defined. The polymerization describes a process of interconnection between different tetrahedron with an increasing amount of Q
3 or Q
4 at the expense of Q
1 or Q
2. The de-polymerization describes an opposite process to the polymerization that the amount of Q
1 or Q
2 increases at the expense of Q
3 or Q
4.
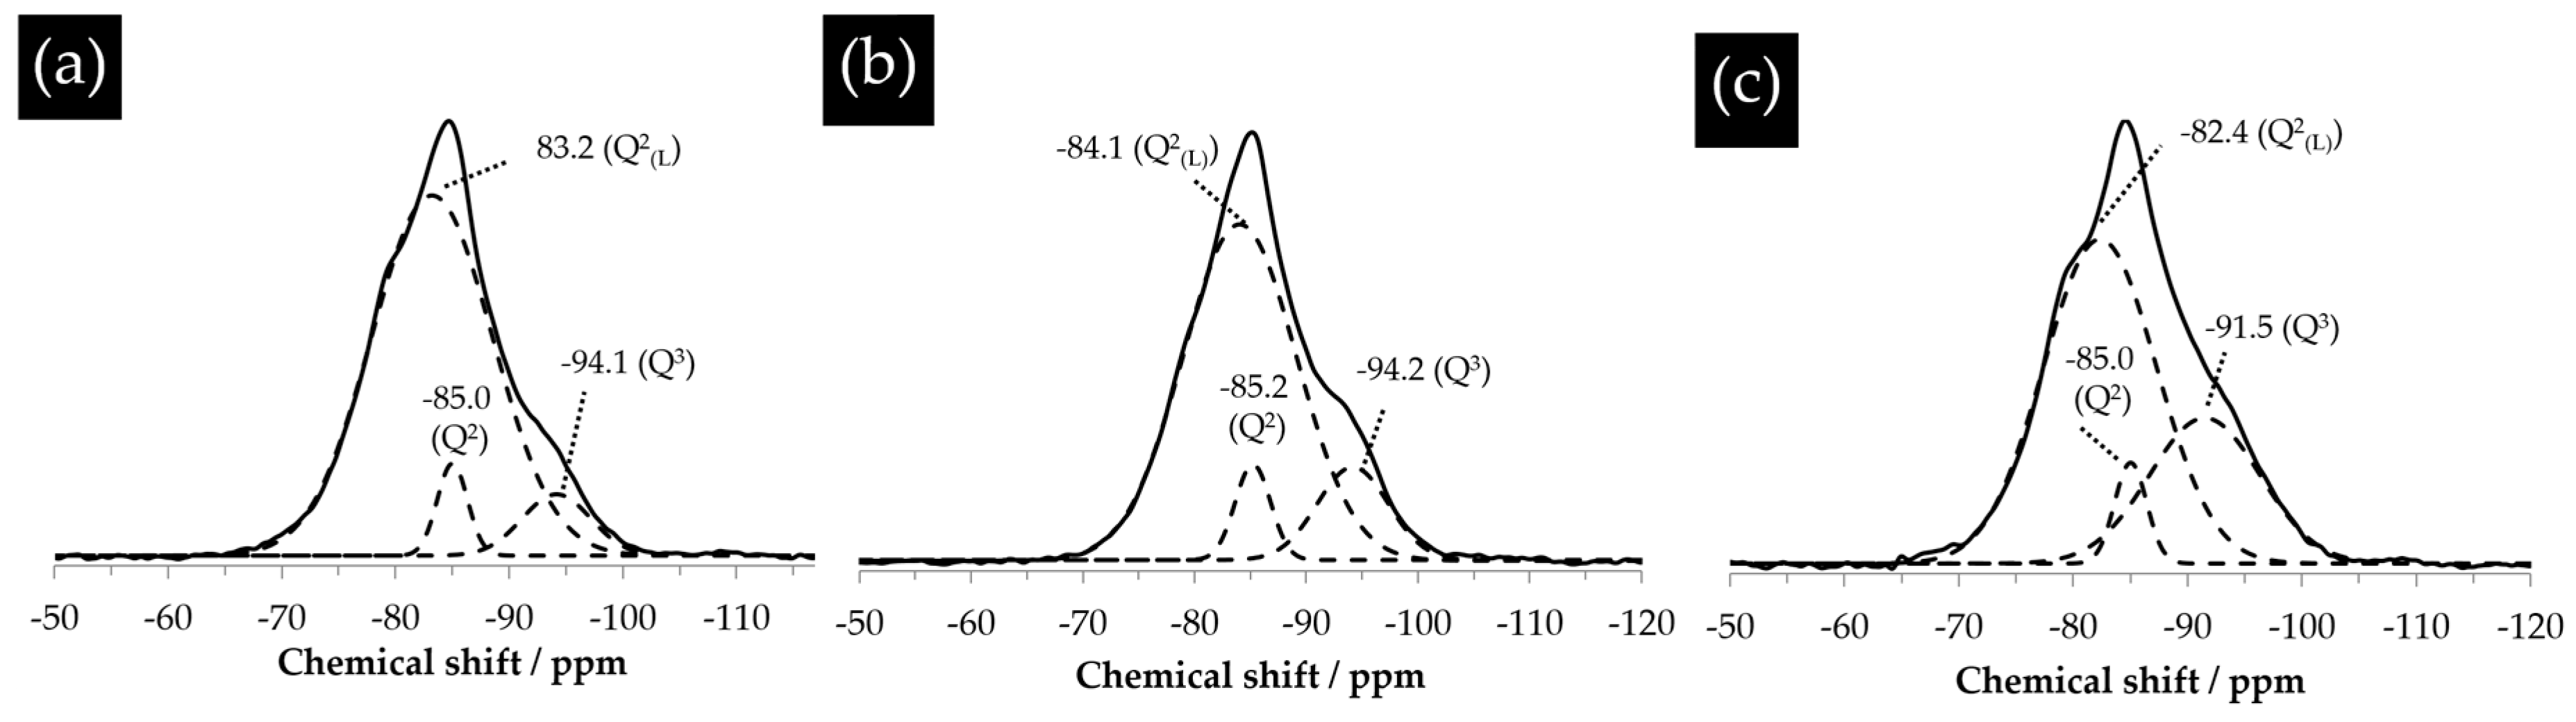
The assignment of the peaks shown in
Figure 18 was obtained by deconvolution. As shown in
Figure 18, the powdered samples of the hard layers from different systems were mainly composed of Q
2 with a chemical shift ranging between −79 ppm and −85 ppm and Q
3 with a chemical shift ranging between −91 ppm and −98 ppm. The absence of the signal from Q
4 in these spectra suggests there was no unreacted silica present in the hard layers. For the sample reacted for one day (
Figure 18a), aside from the typical peaks of Q
2 at −85 ppm and Q
3 at −94.1 ppm, a shoulder centered at −83.2 ppm was found. This was attributed to the altered environment of Q
2 by its linkage with a proton and so presence as a bridging tetrahedron [
18]. This altered Q
2 is named Q
2(L) here and later on. Similarly, for the samples reacted for four days and seven days, the resonance of Q
2 slightly shifted towards the downfield, leaving a minor shoulder next to the main peak of Q
2.
Based on the deconvoluted spectra shown in
Figure 18, the fraction of each kind of silica tetrahedron can be obtained according to the percentage of the area under its deconvoluted spectrum. As shown in
Table 2, the fraction of Q
2(L) decreased and that of Q
3 increased with the increase of the reaction period. In other words, the polymerization degree of the calcium alkali silicate from the hard layer increased with the increase of the storage period. In the meantime, however, the fraction of Q
2 experienced an increase from one day to four days and a decrease from four days to seven days. It should be noted that the observed increase of Q
3 and decrease of Q
2(L) with the storage period does not necessarily mean that Q
3 was formed at the expense of Q
2(L) as usual. This polymerization can also be caused by the interlinkage of the alkali silicate externally from the slurry layer with the calcium alkali silicate in the hard layer near its lower surface [
19]. Meanwhile, on the contrary, the interaction between Ca(OH)
2 present in the middle layer and the calcium alkali silicate in the hard layer near its upper surface would unavoidably cause the de-polymerization of the calcium alkali silicate [
20,
21], given the previous results that the content of calcium increased near the upper surface of the hard layer. Therefore, the polymerization degree of the hard layers was determined by polymerization and de-polymerization happening on either surface of the hard layer.
Therefore, an assumption can be made based on the results shown in
Table 2 and given as follows. Based on the increasing amount of Q
3, the polymerization dominated the de-polymerization in the system. The rate of the de-polymerization caused by the interaction of calcium with calcium alkali silicate near the upper surface of the hard layer should be much lower than that of the polymerization happening near the lower surface of the hard layer.
3.9. Self-Thickening Process and Evolution of the Transport Barrier
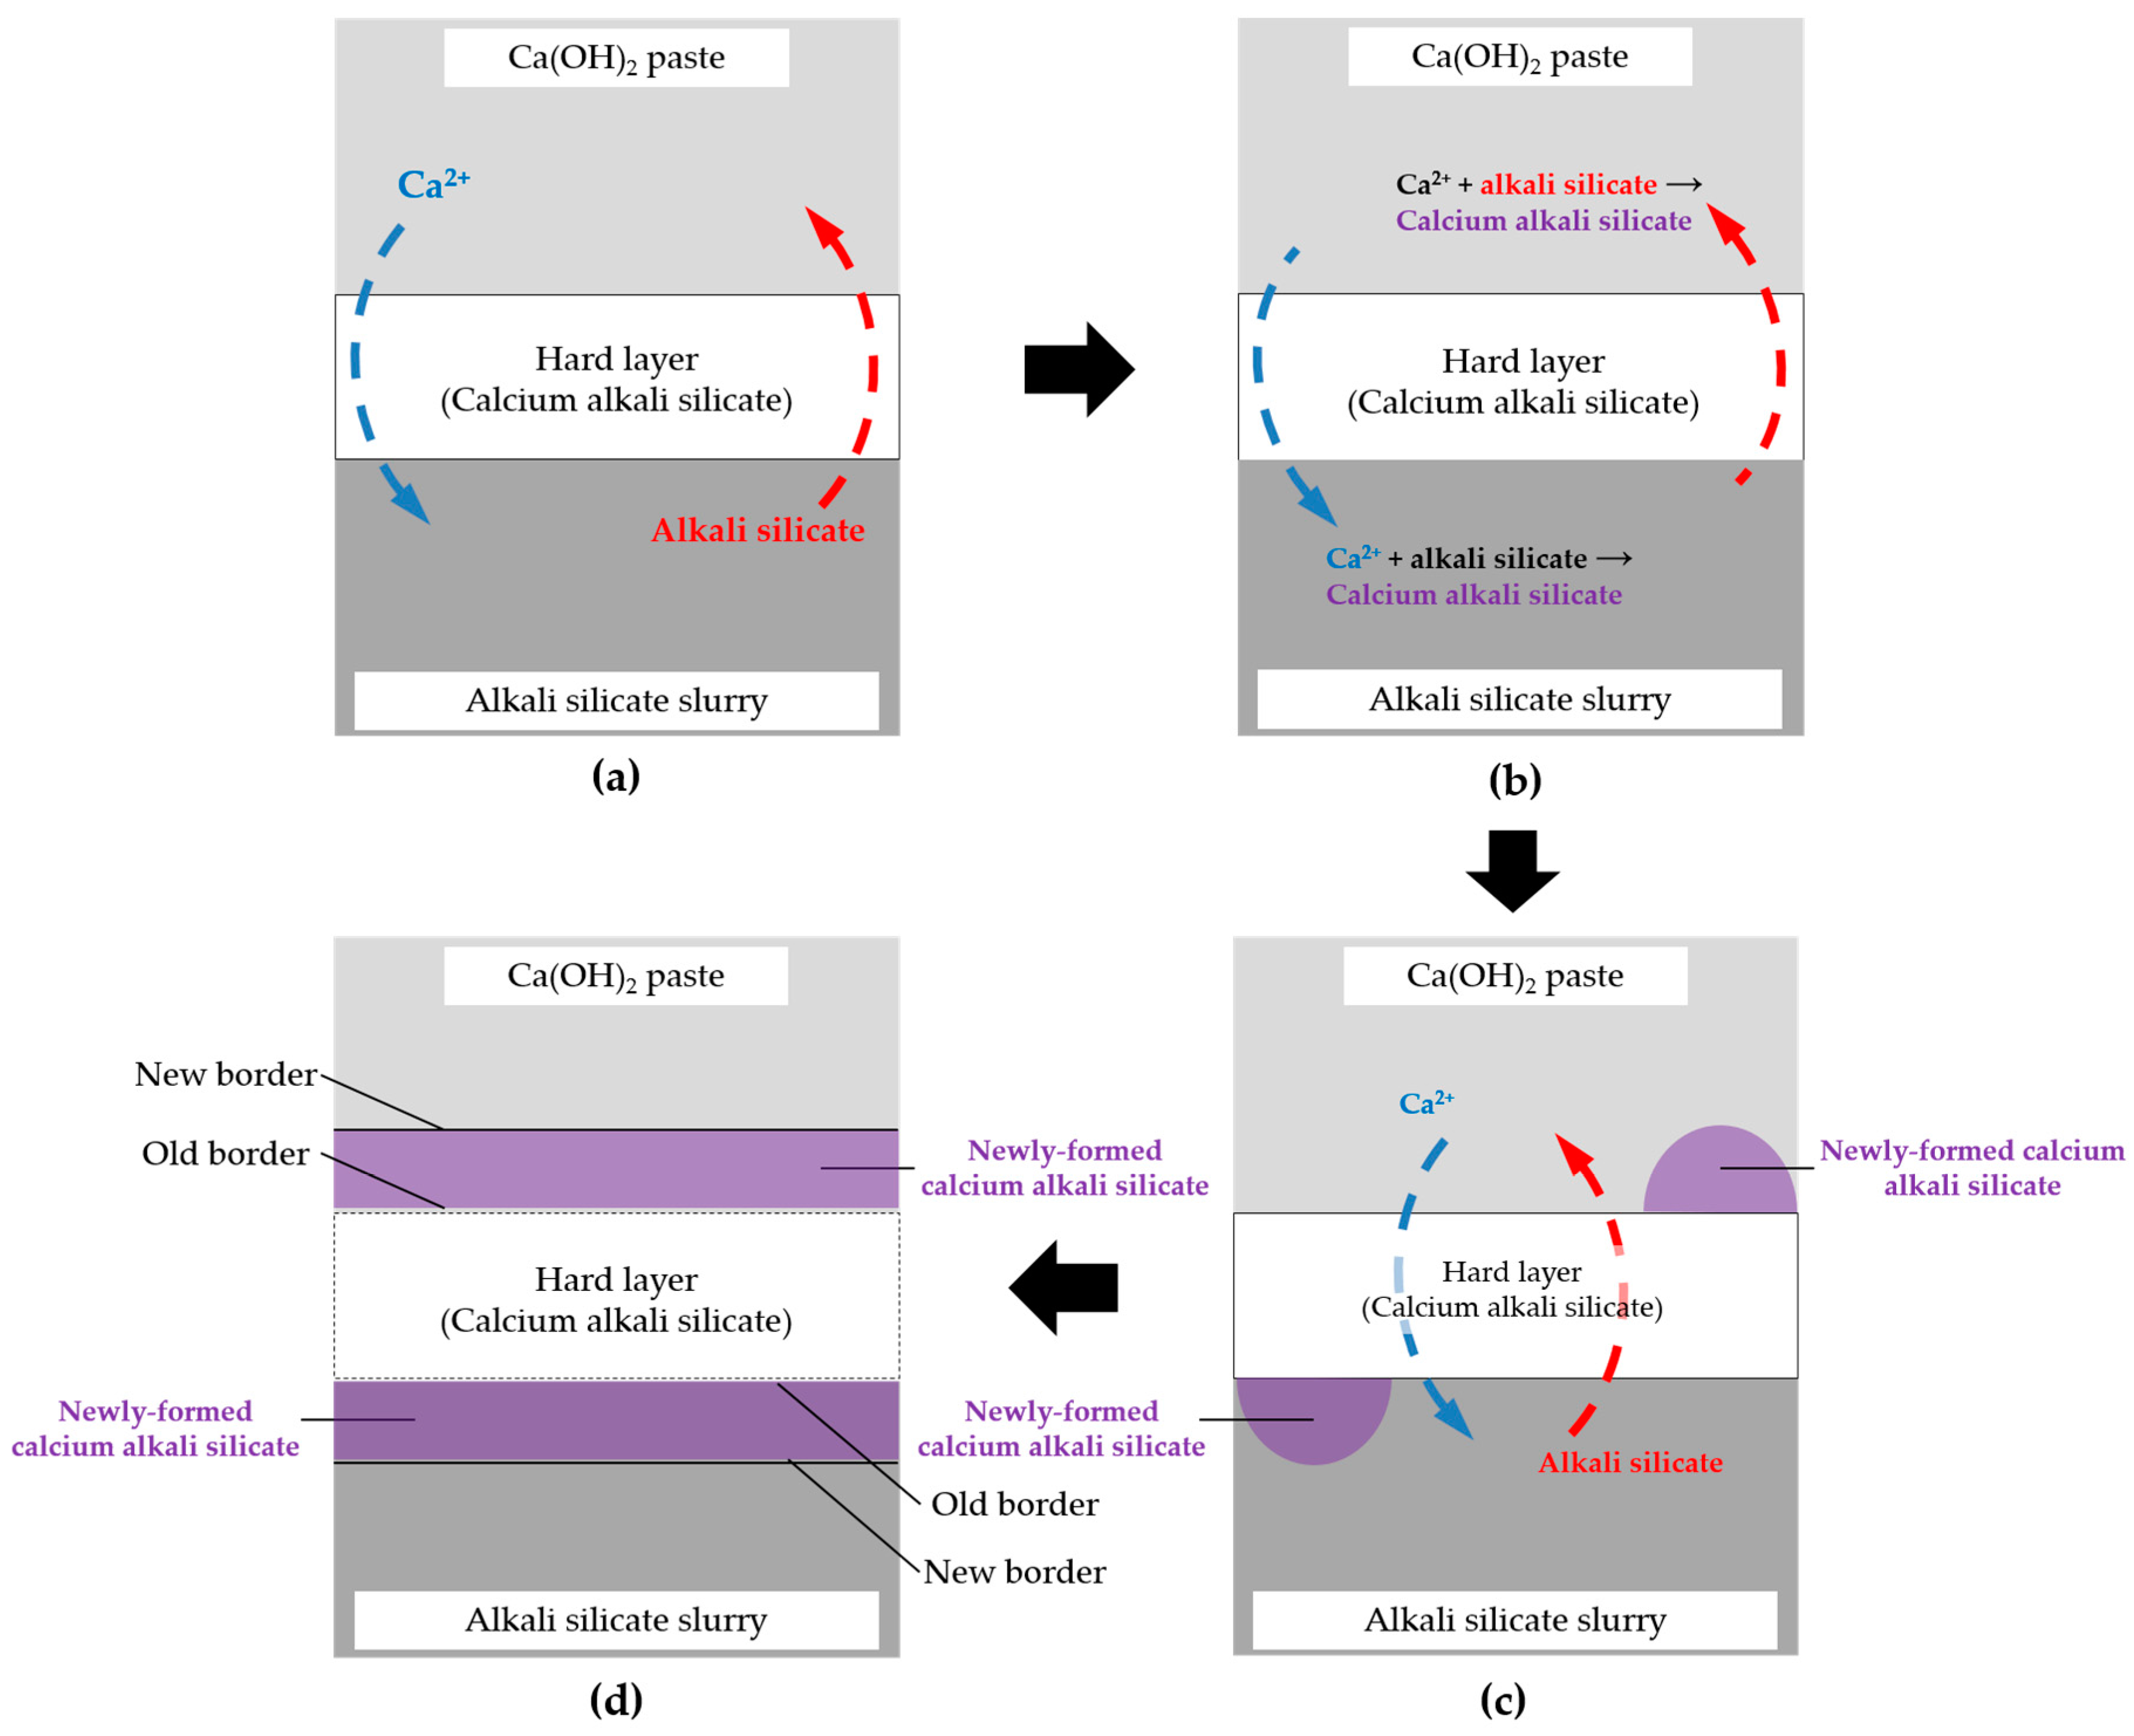
Based on the above results and discussion, the evolution mode of the hard layer as a transport barrier realized by a self-thickening process can be visualized by a thought experiment shown schematically in
Figure 19 and illustrated in detail as follows.
If any free calcium with a considerable amount is present on the lower “temporary” surface of the hard layer, which is in contact with the slurry layer by the migration through the hard layer, it can immediately react with the abundant alkali silicate present there to form calcium alkali silicate leading to the thickening of the hard layer until the concentration of calcium is too low to trigger this interaction. For example, in this study, such a threshold of Ca/Si ratio for enabling the formation of the hard layer is about 0.20 according to the EDS results of the areas located at the border of the hard layer with the slurry layer. Alternatively, if any alkali silicate is present on the upper “temporary” surface of the hard layer which is in contact with the middle layer, it can react with abundant Ca(OH)2 to form calcium alkali silicate leading to the thickening of the hard layer until the amount of silicate is too low to trigger this interaction as well. This self-thickening process, as a result, enables the growth of the hard layer towards either the middle layer for the upper surface at the top or the slurry layer for the lower surface at the bottom. In other words, the migration of calcium and silicate is completely prevented as soon as this process stops. Moreover, if any new transport path of calcium and silicate such as a micro crack is generated across the hard layer, the interaction mentioned above can “heal” this “wound” until the path is fully blocked.


