
Experimental Investigation of Mechanical Properties of Black Shales after CO2-Water-Rock Interaction


Abstract
:1. Introduction
2. Geological Setting and Geochemical Interactions
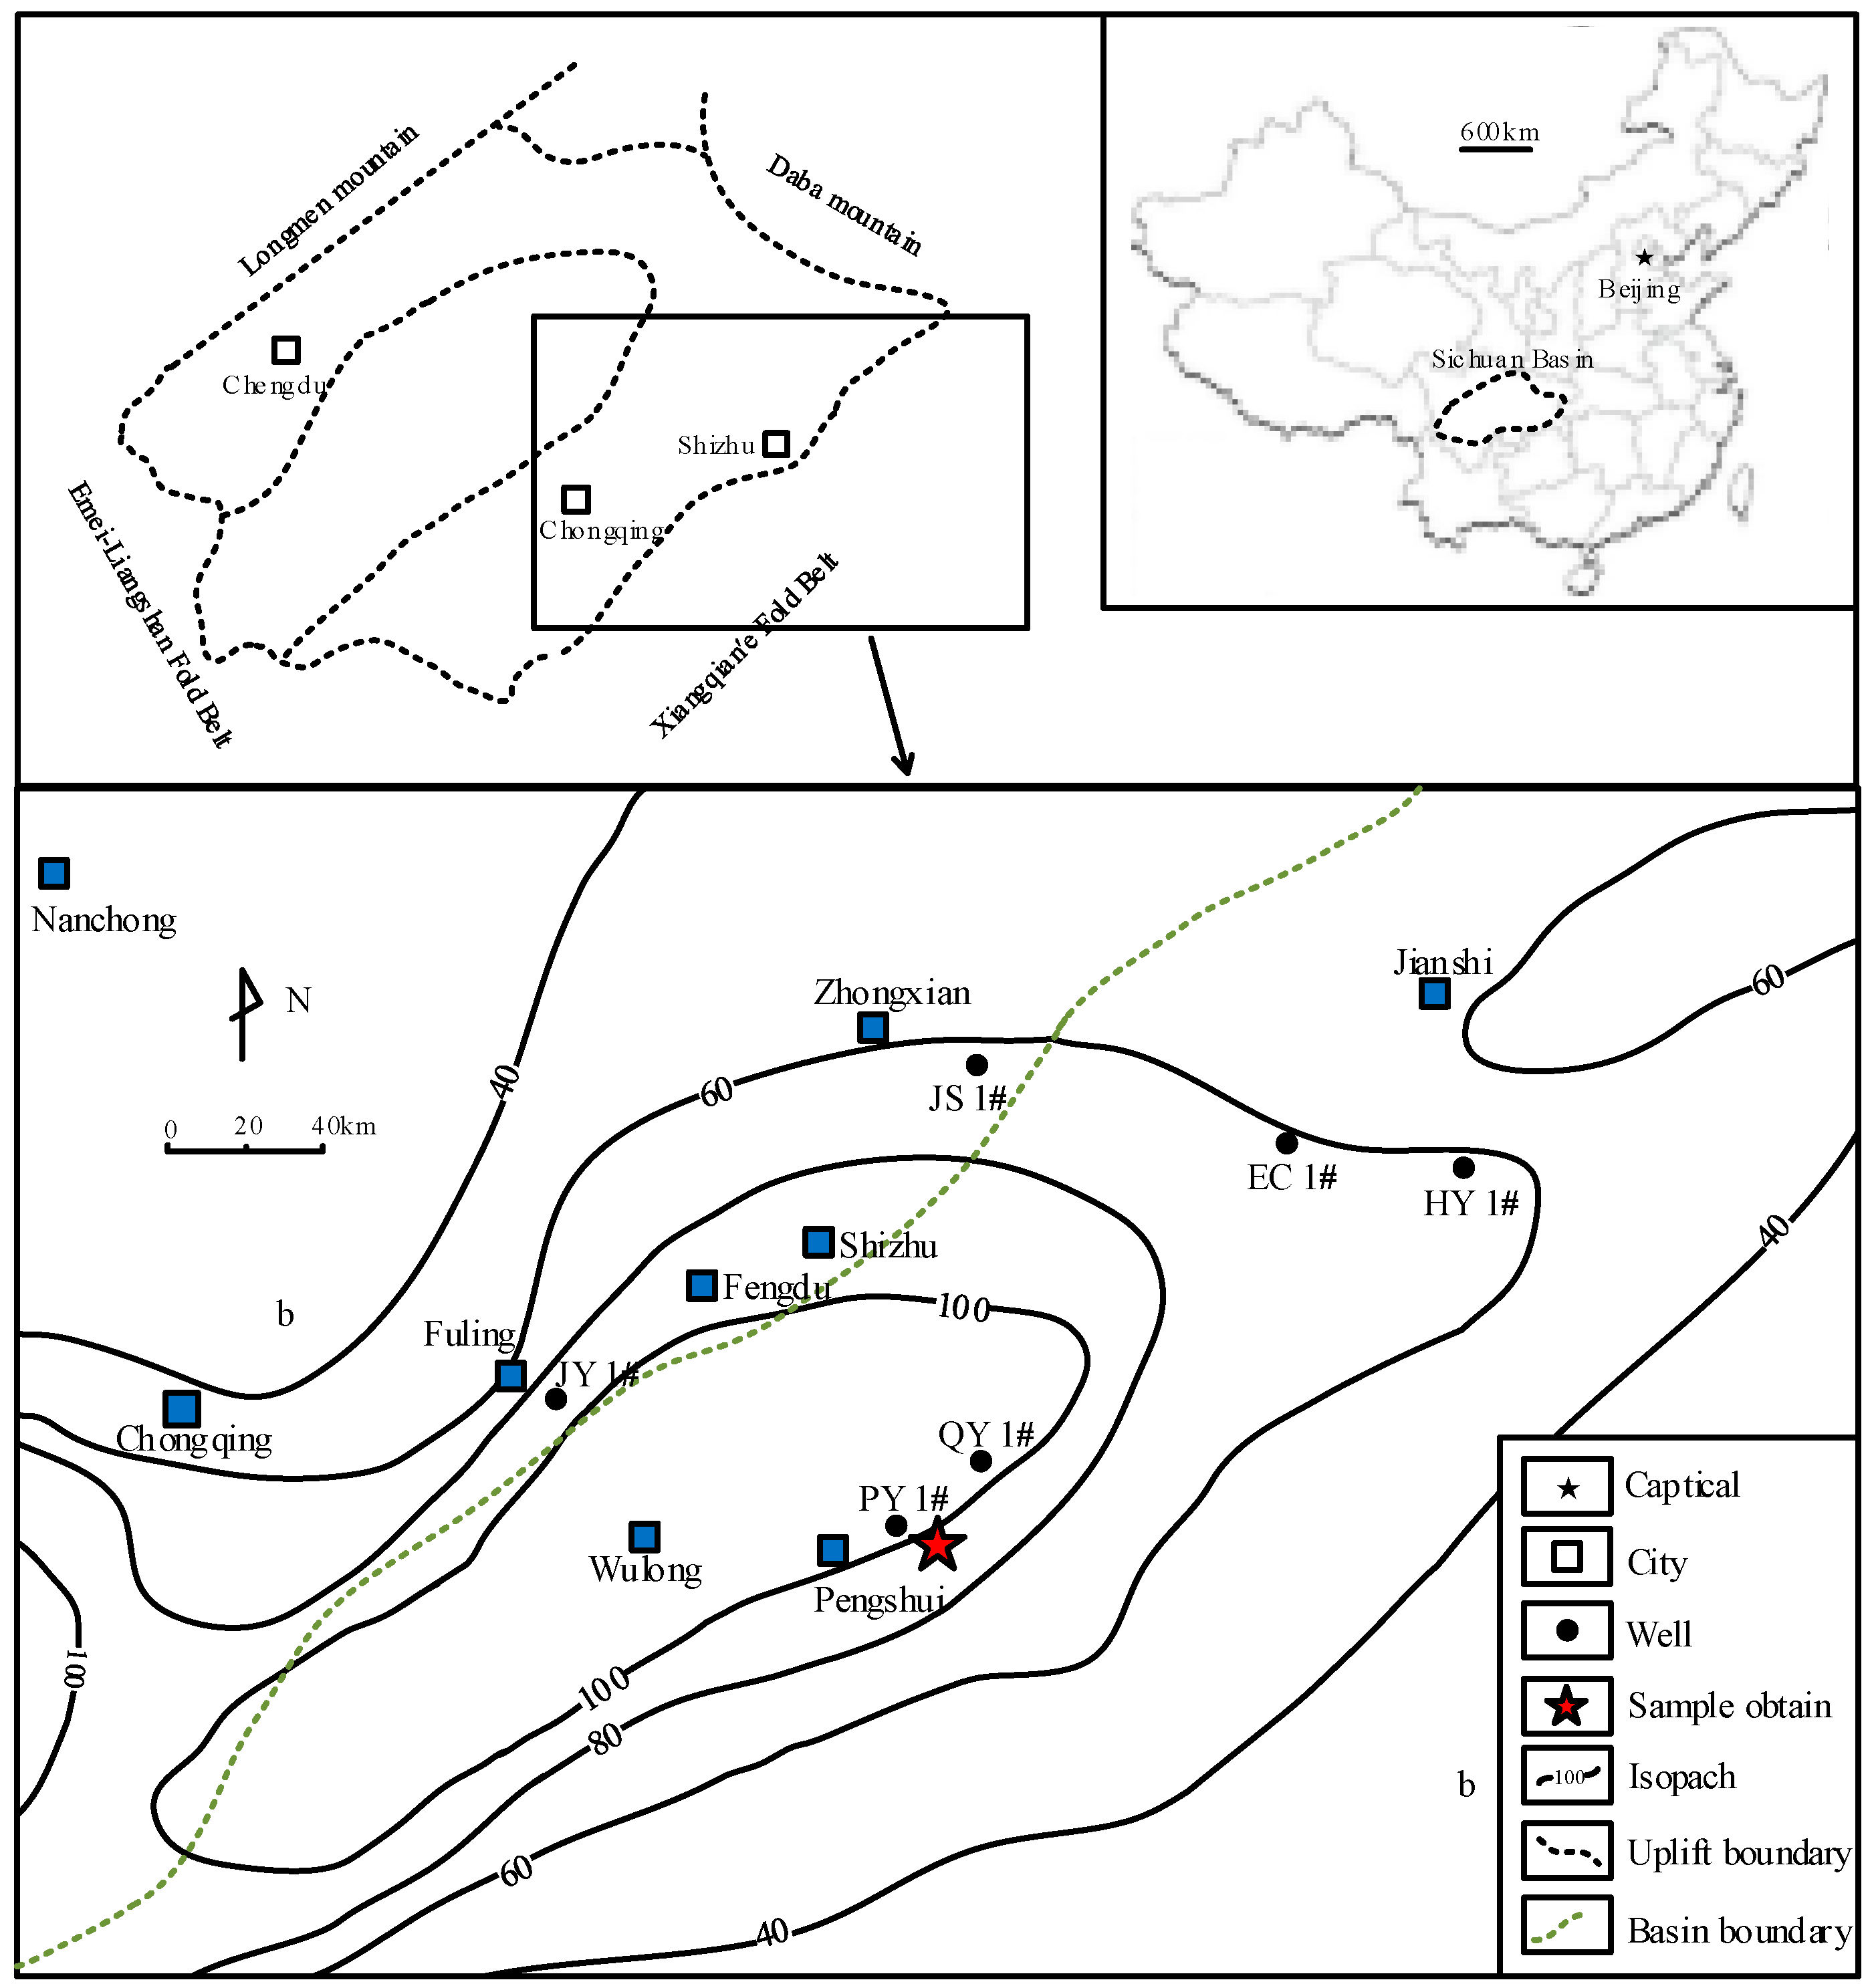
2.1. Geological Setting
2.2. Geochemical Interactions
3. Experimental Methodology
3.1. Sample Preparation
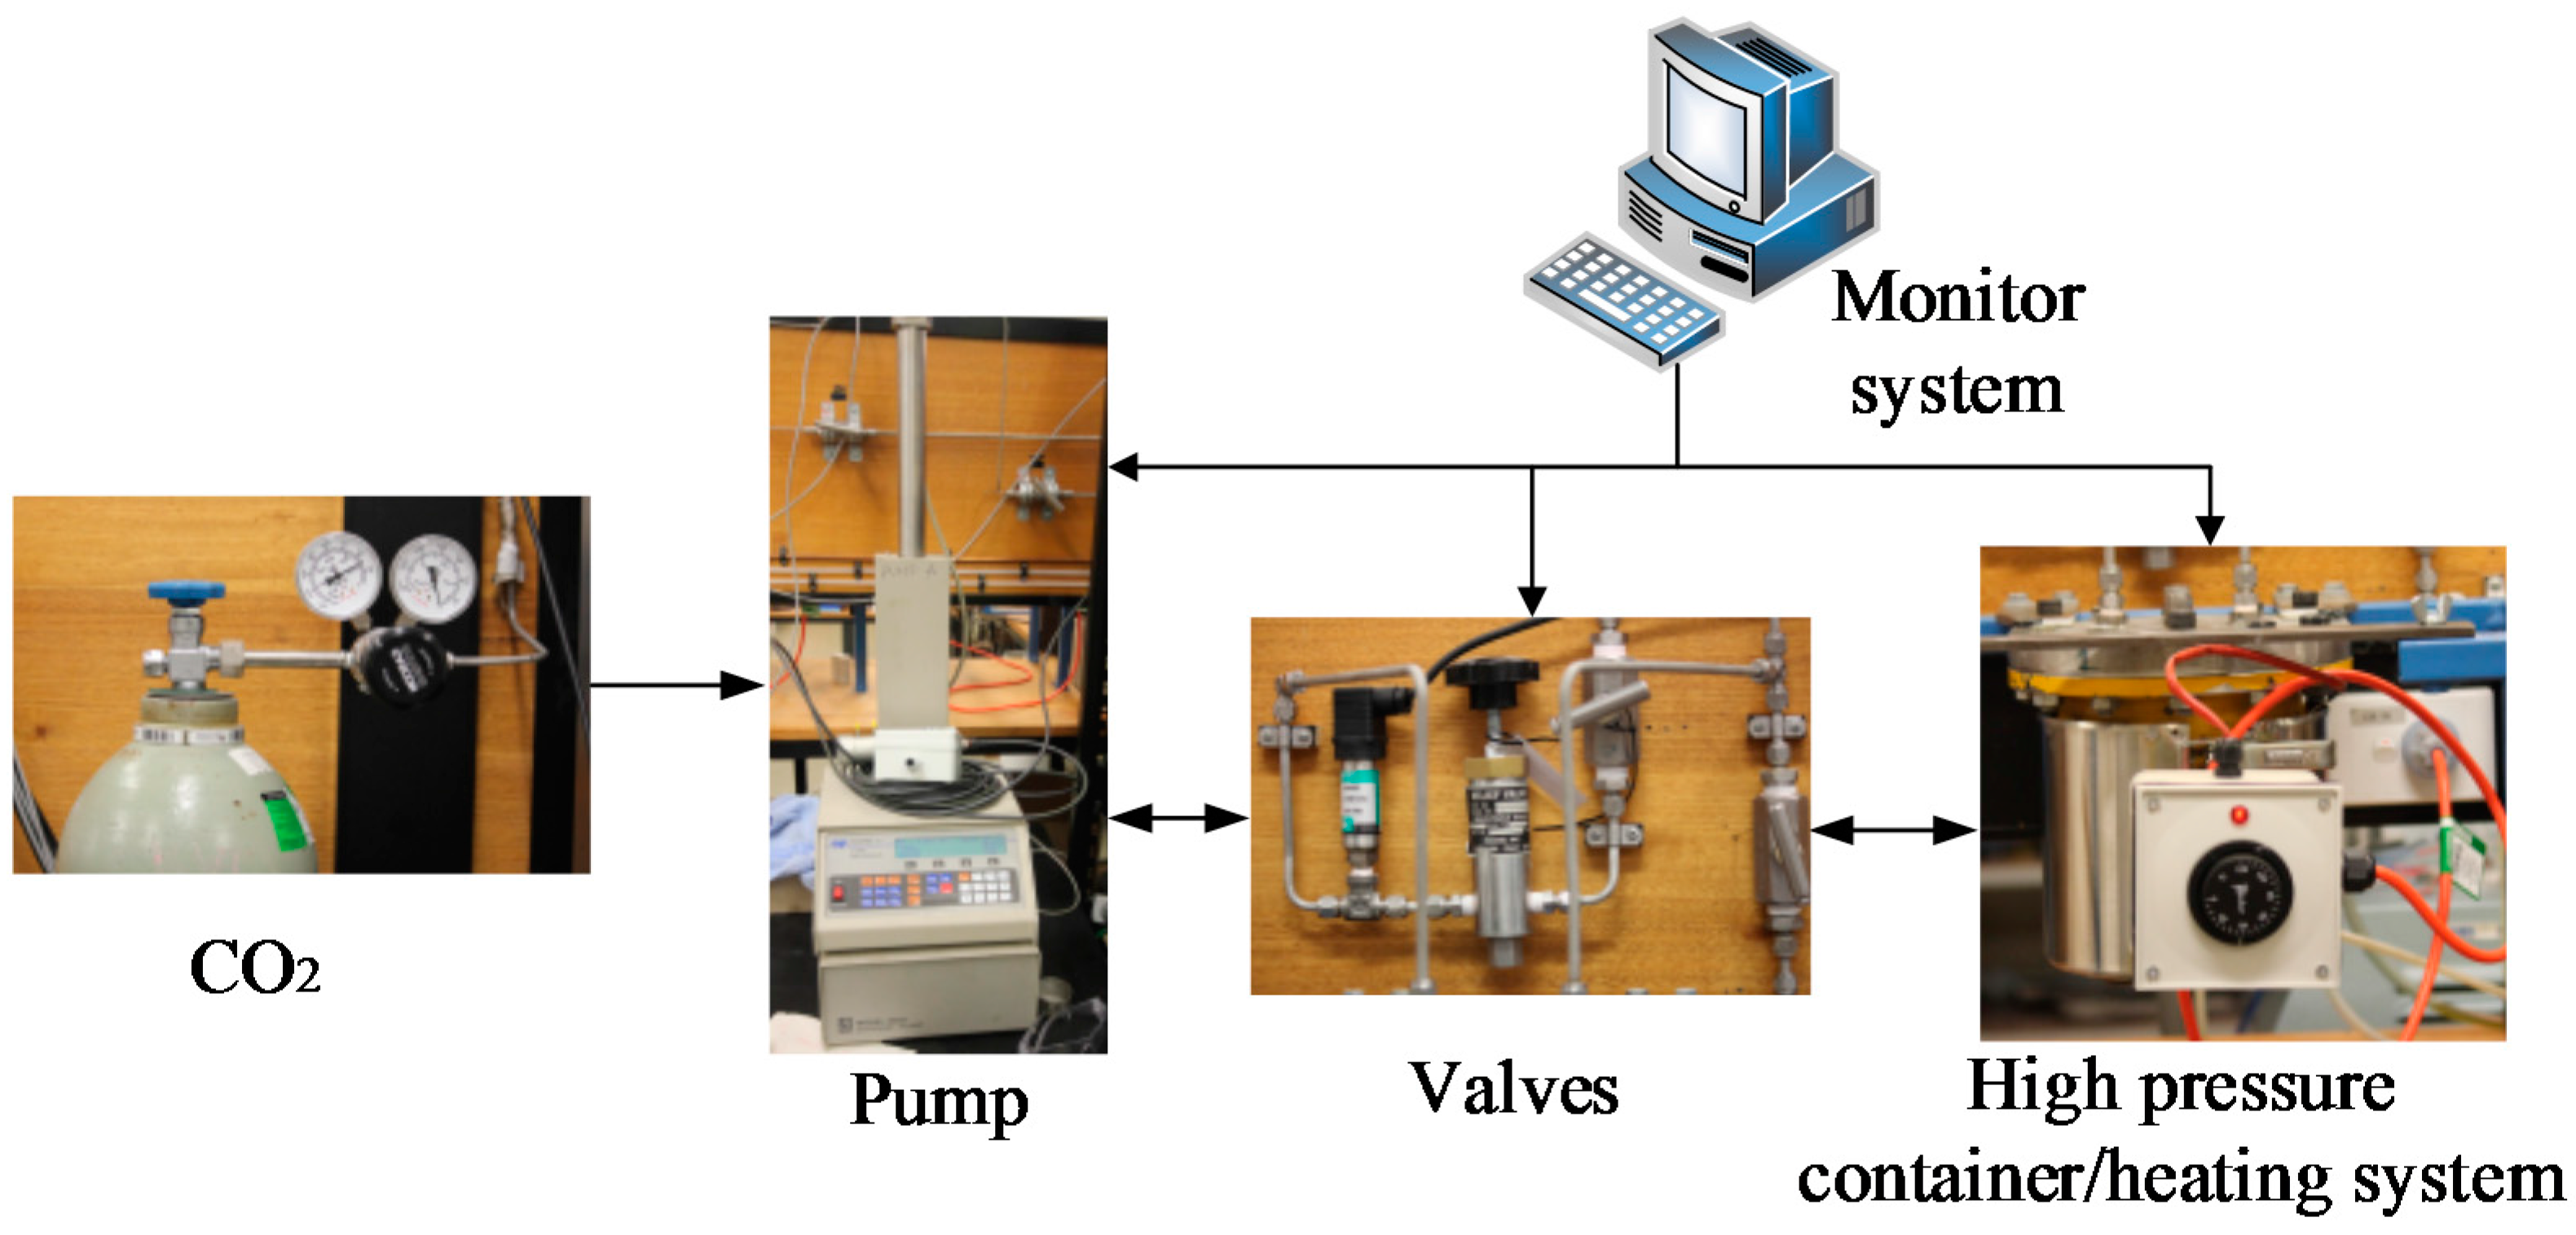
3.2. Testing Arrangement
4. Results and Discussion
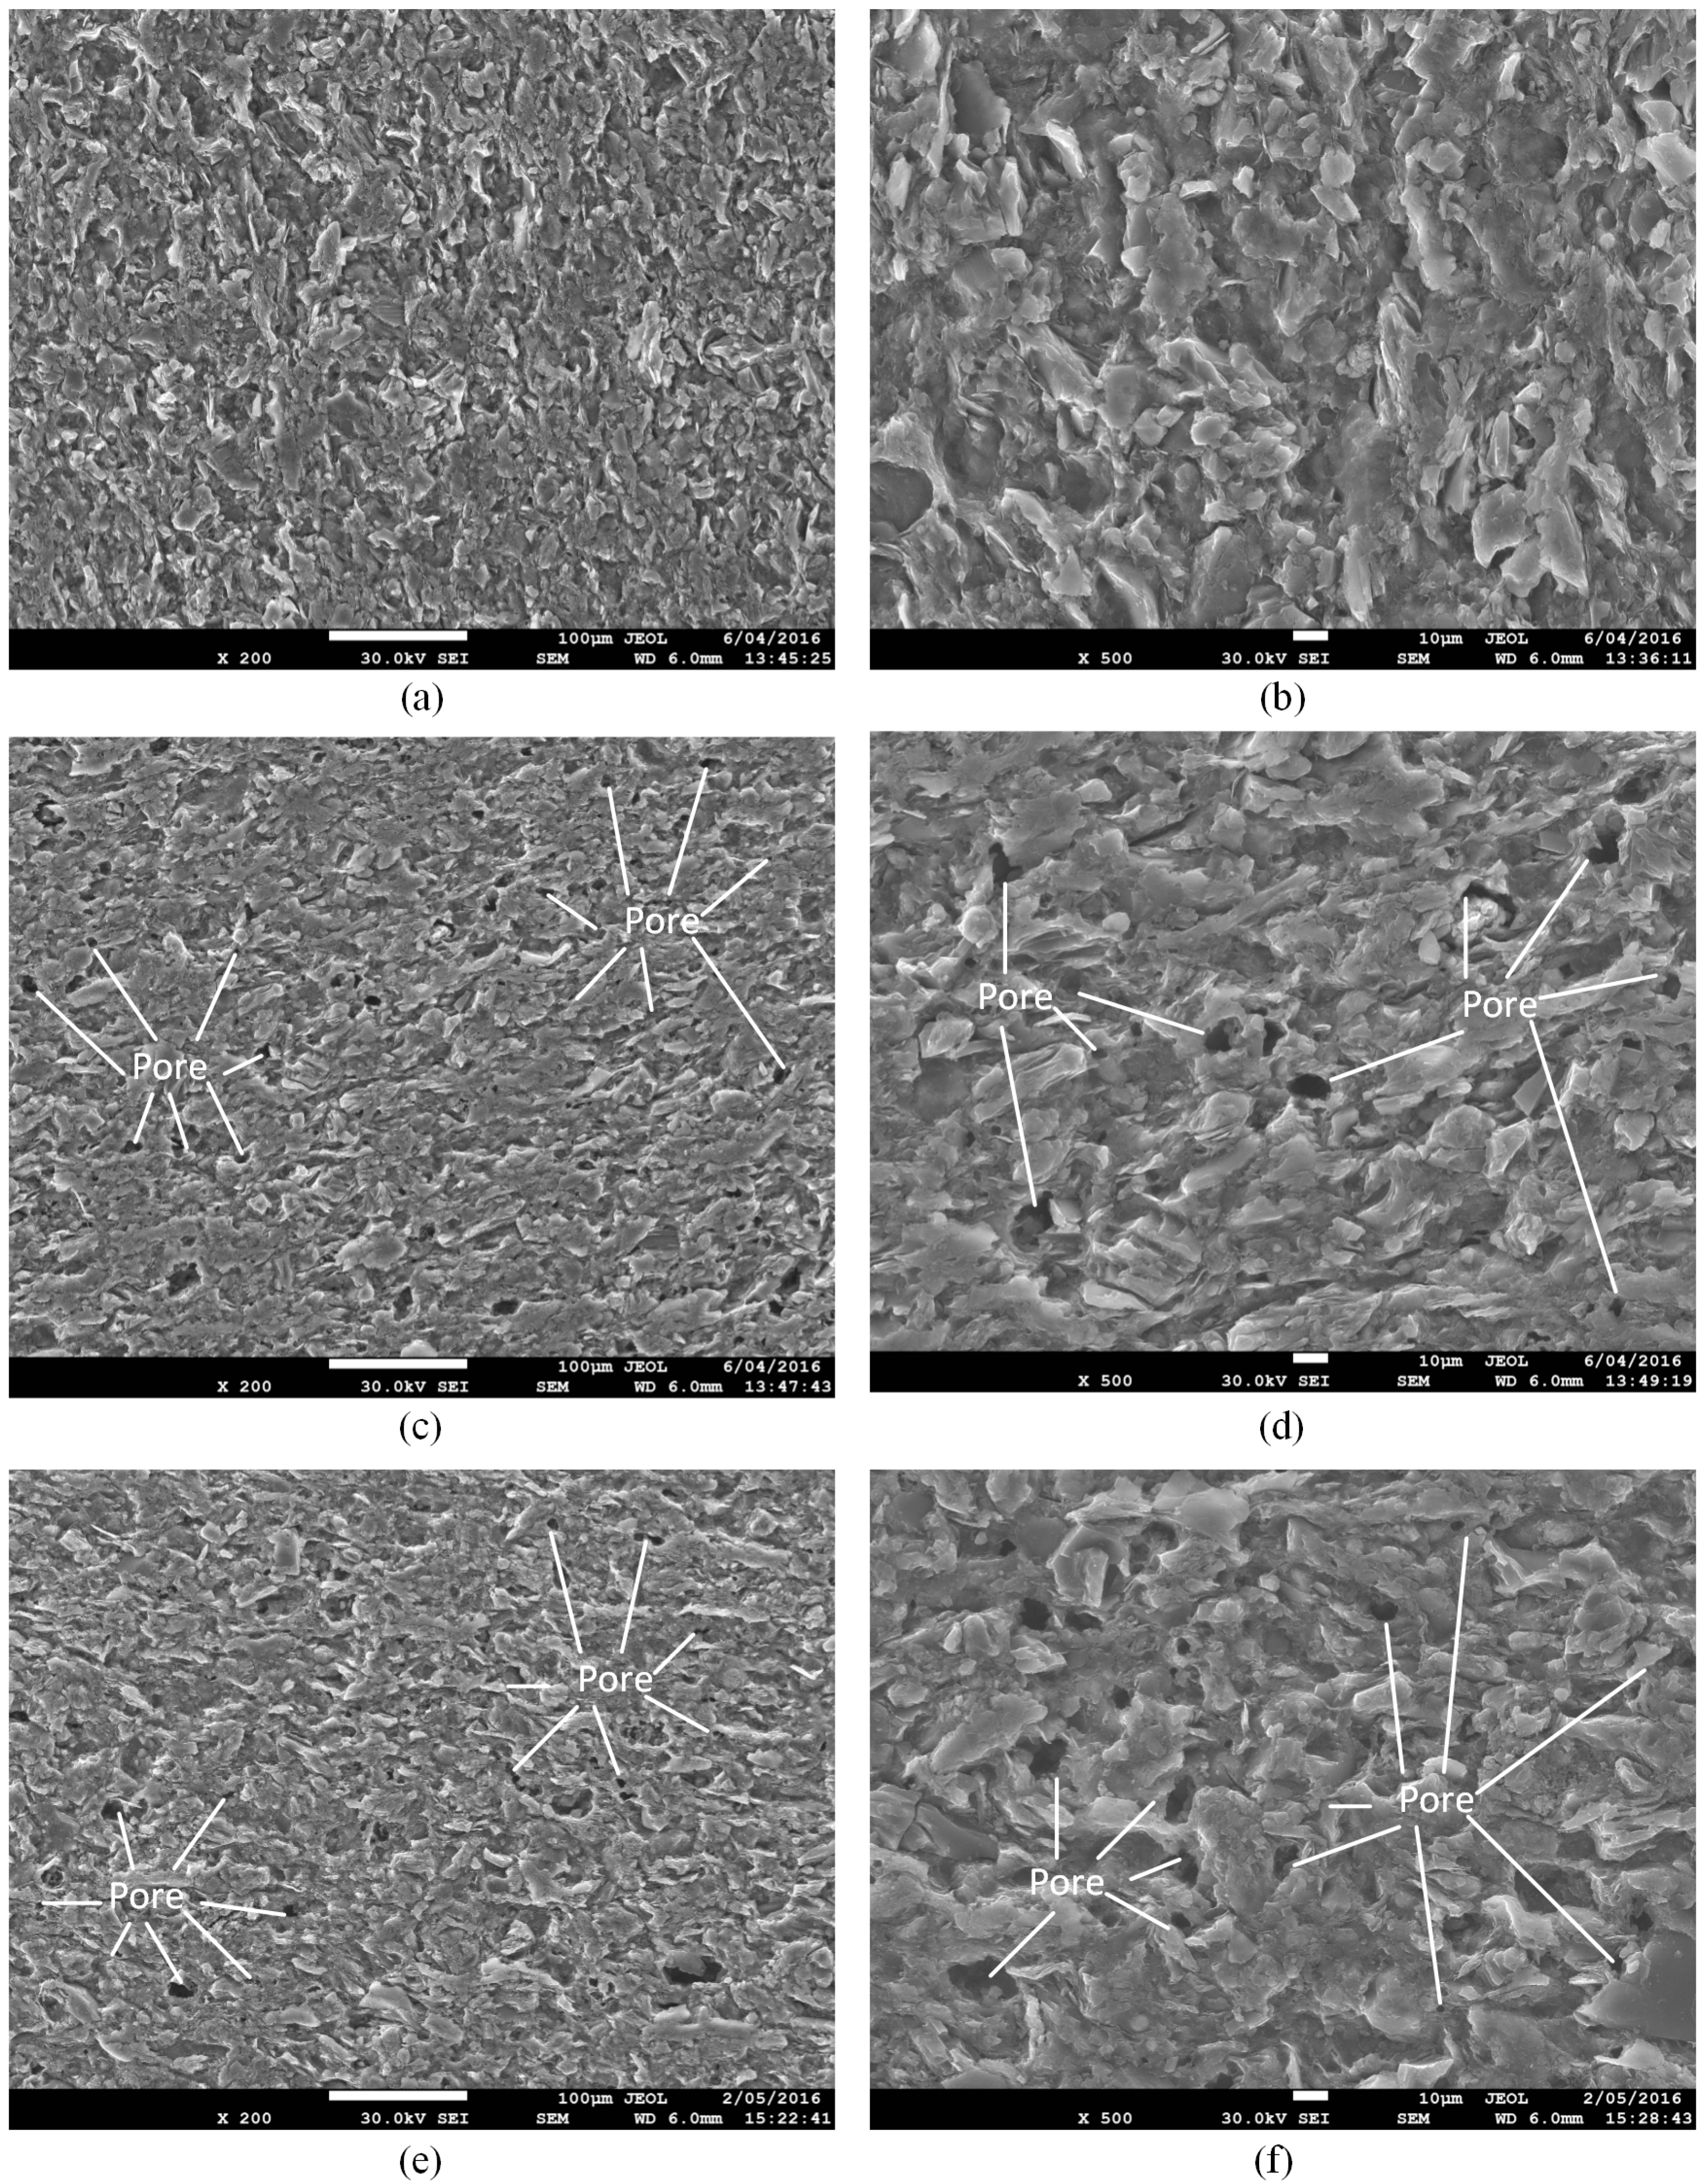
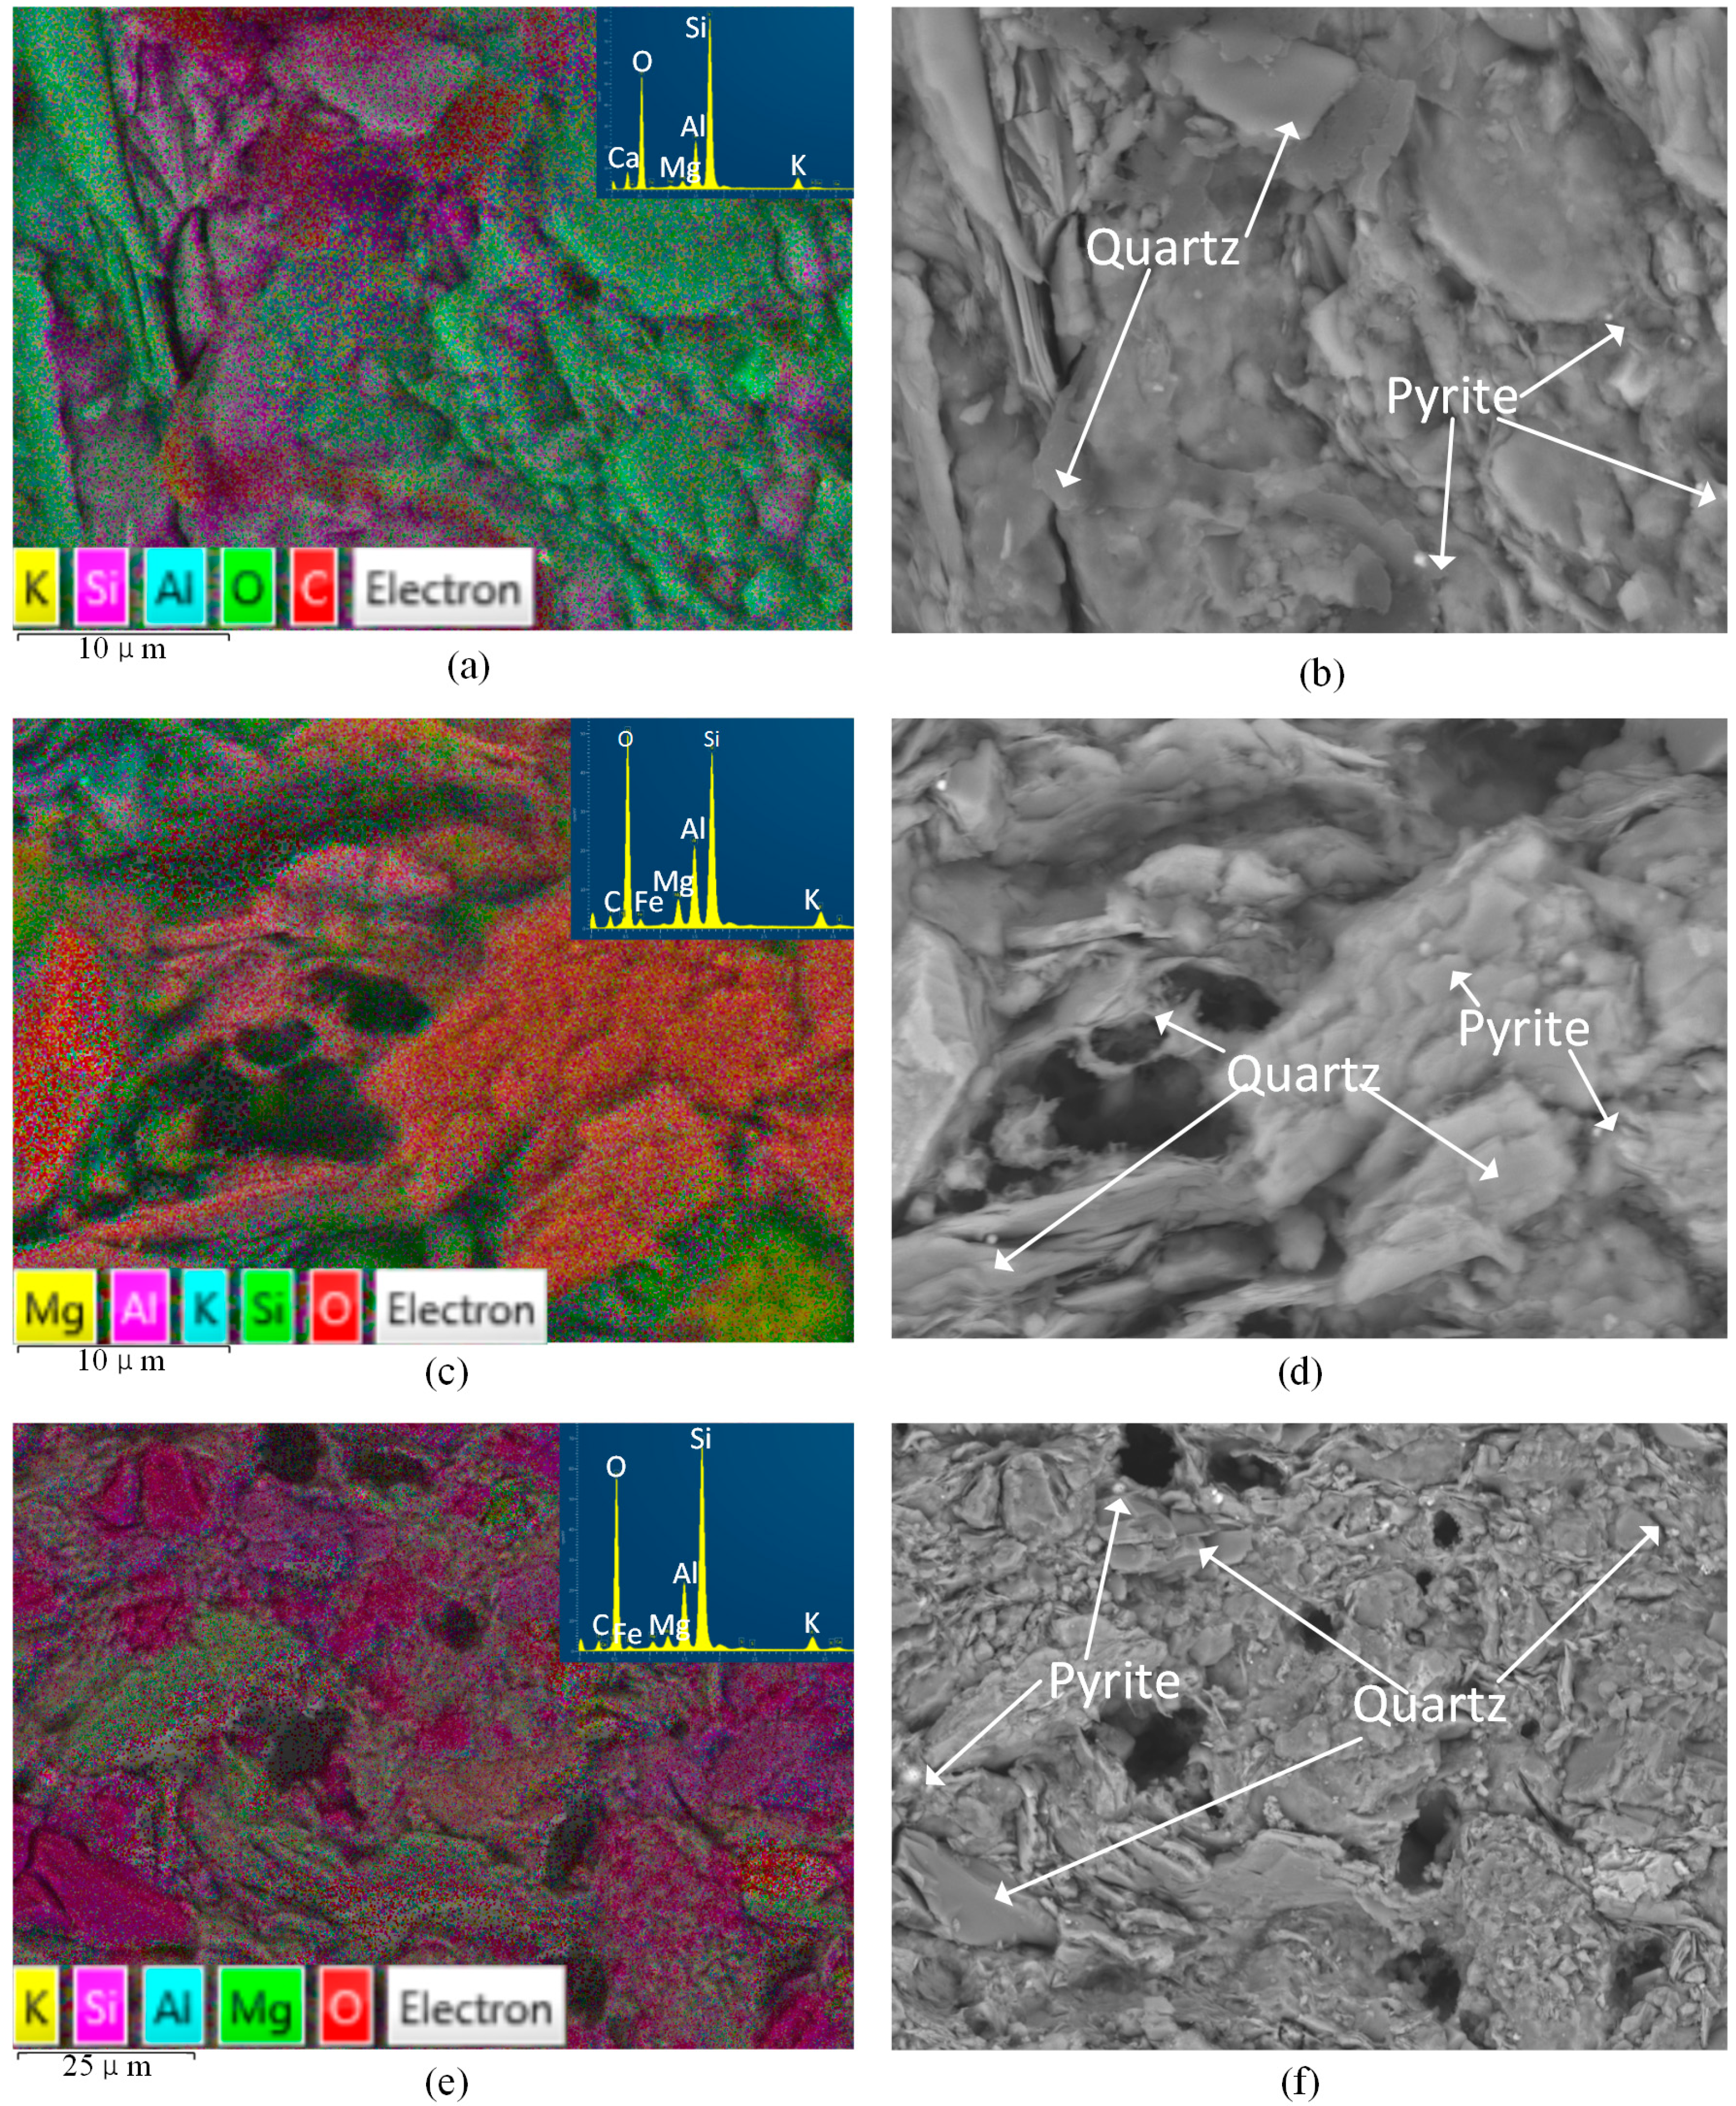
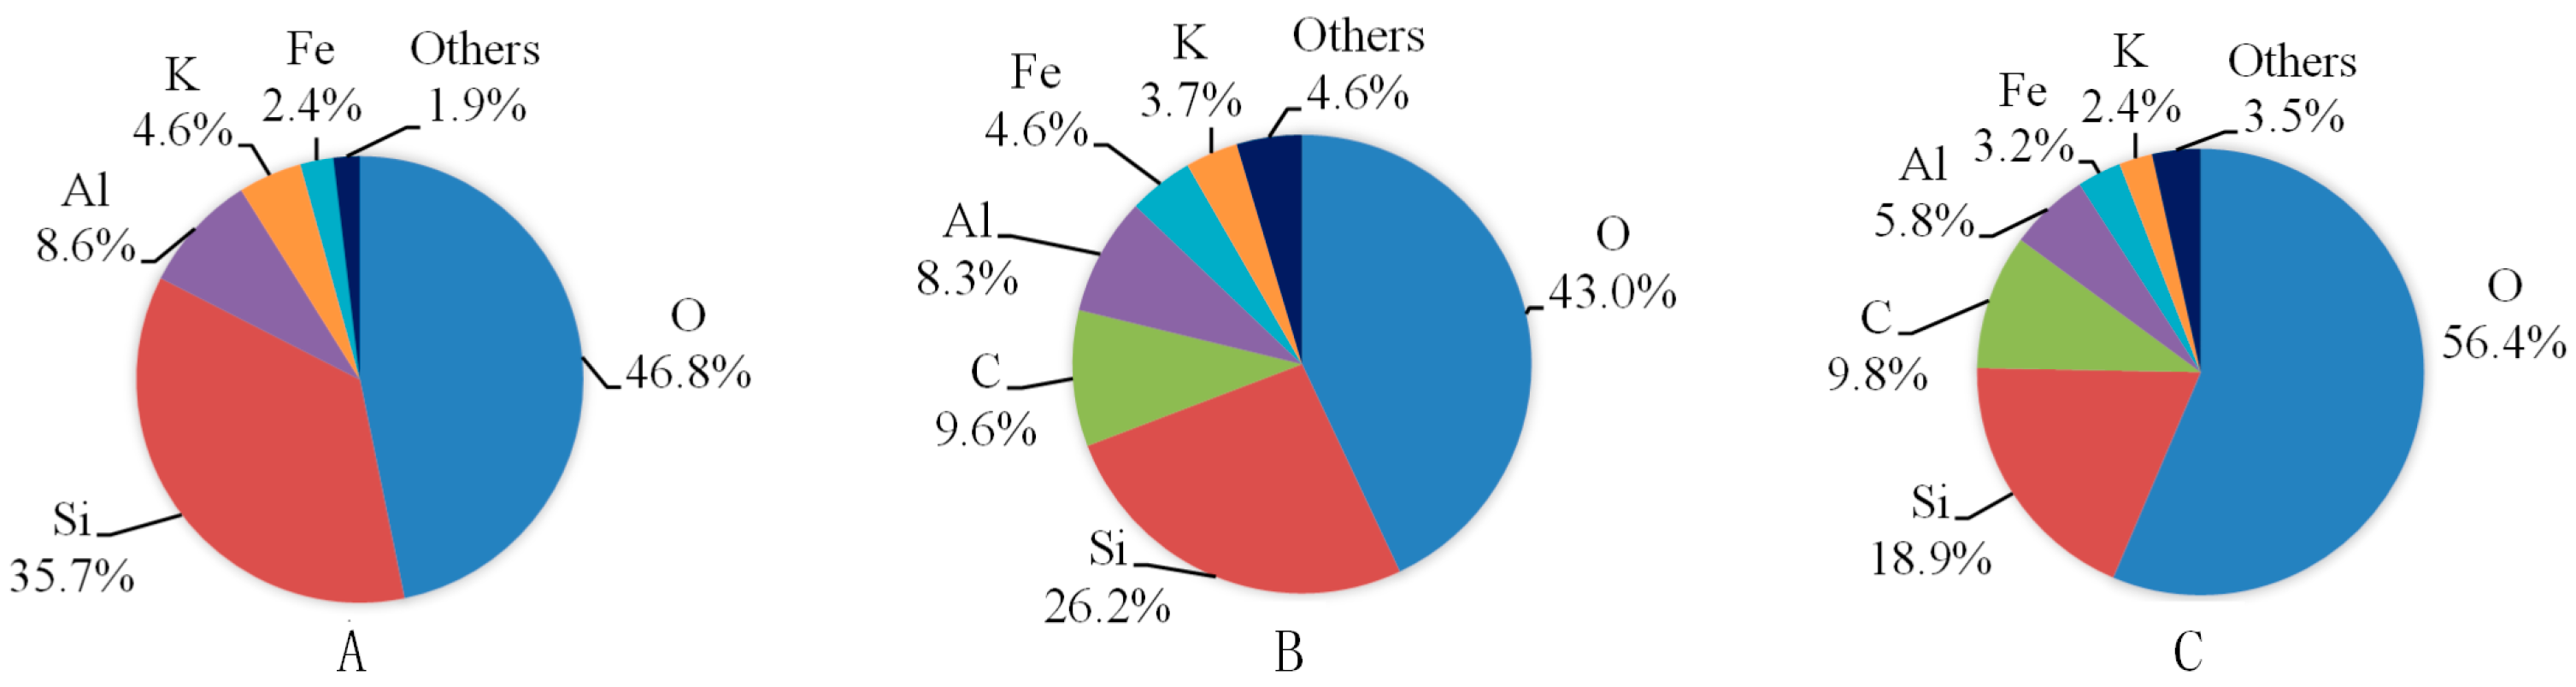
4.1. Microstructure Alteration after CO2-Water-Interaction
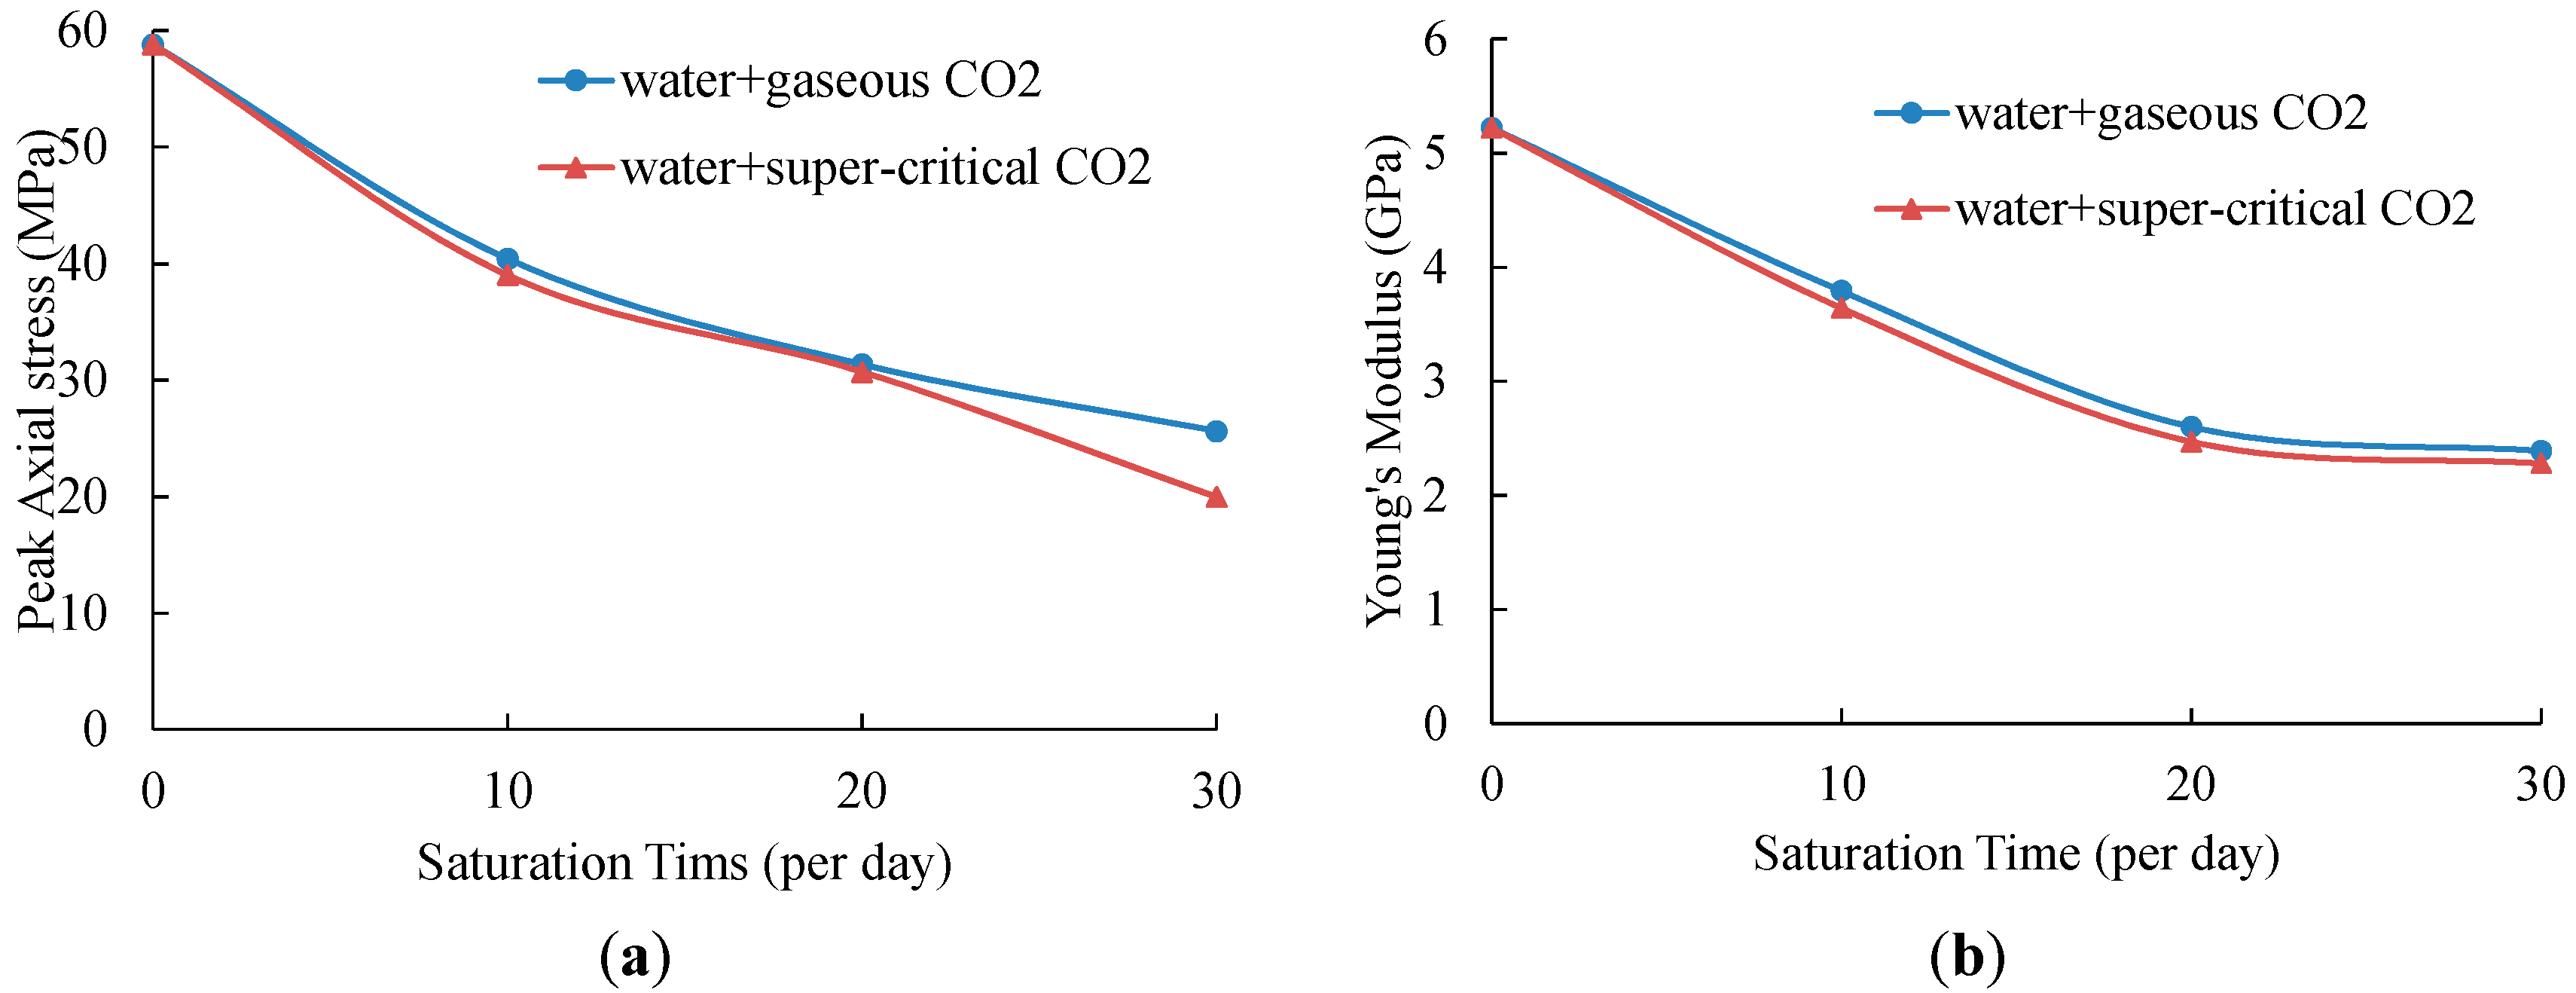
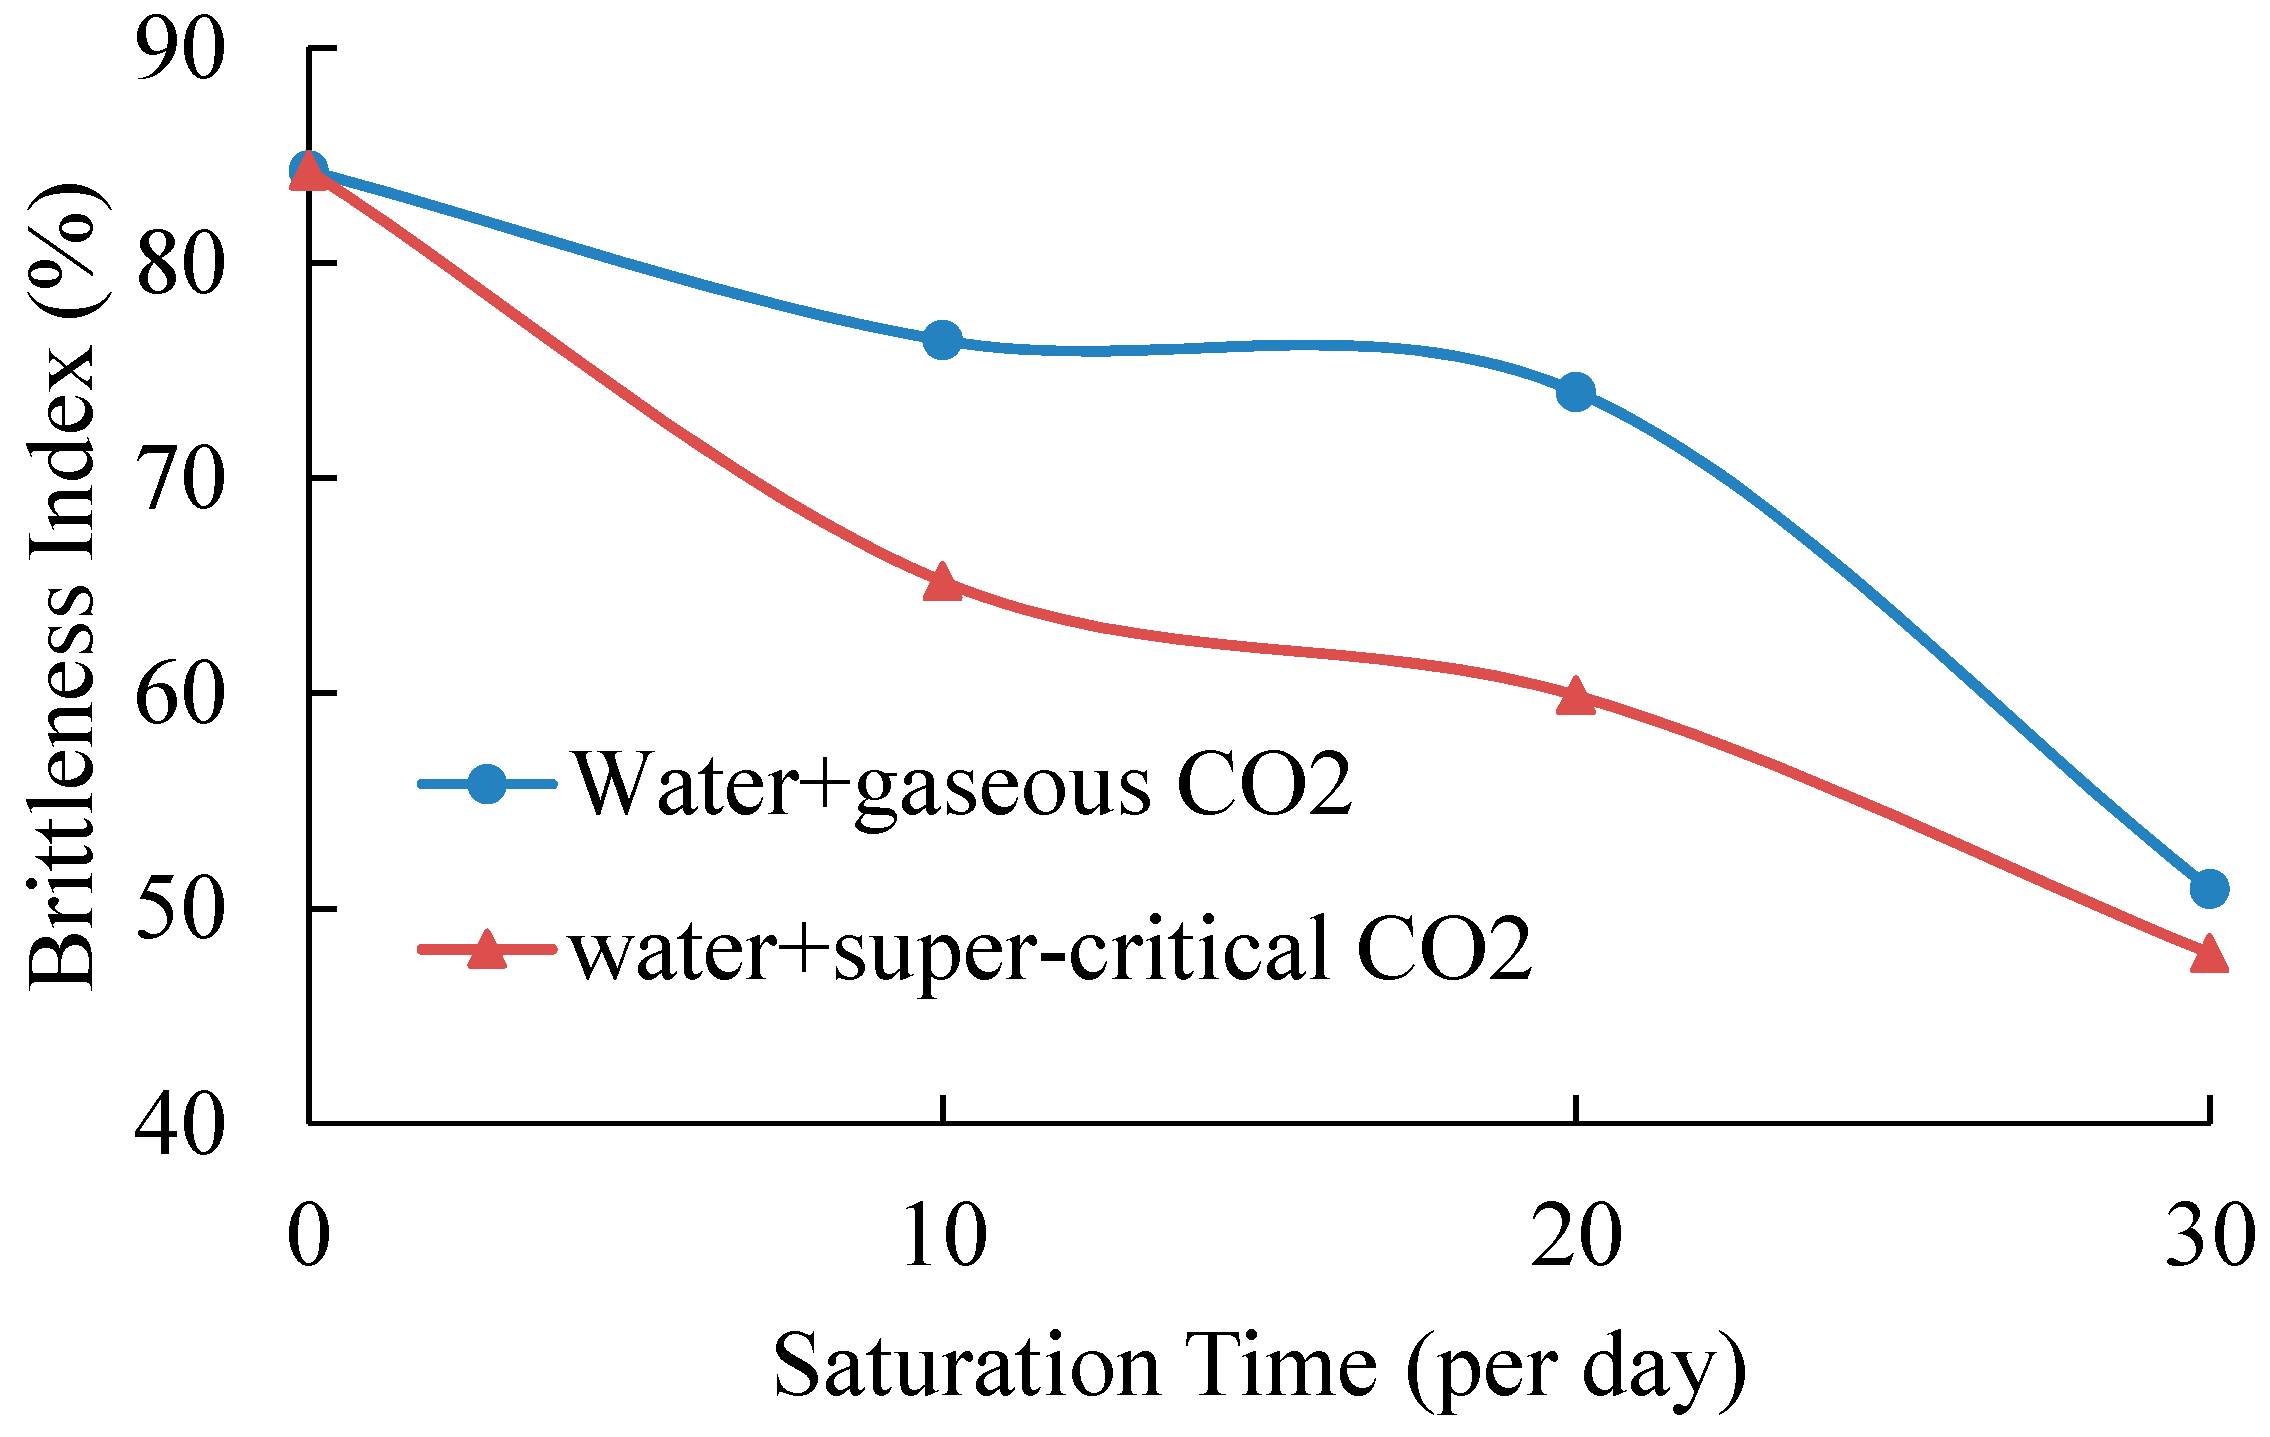
4.2. Effects of CO2-Water-Rock Interaction on Mechanical Behaviors
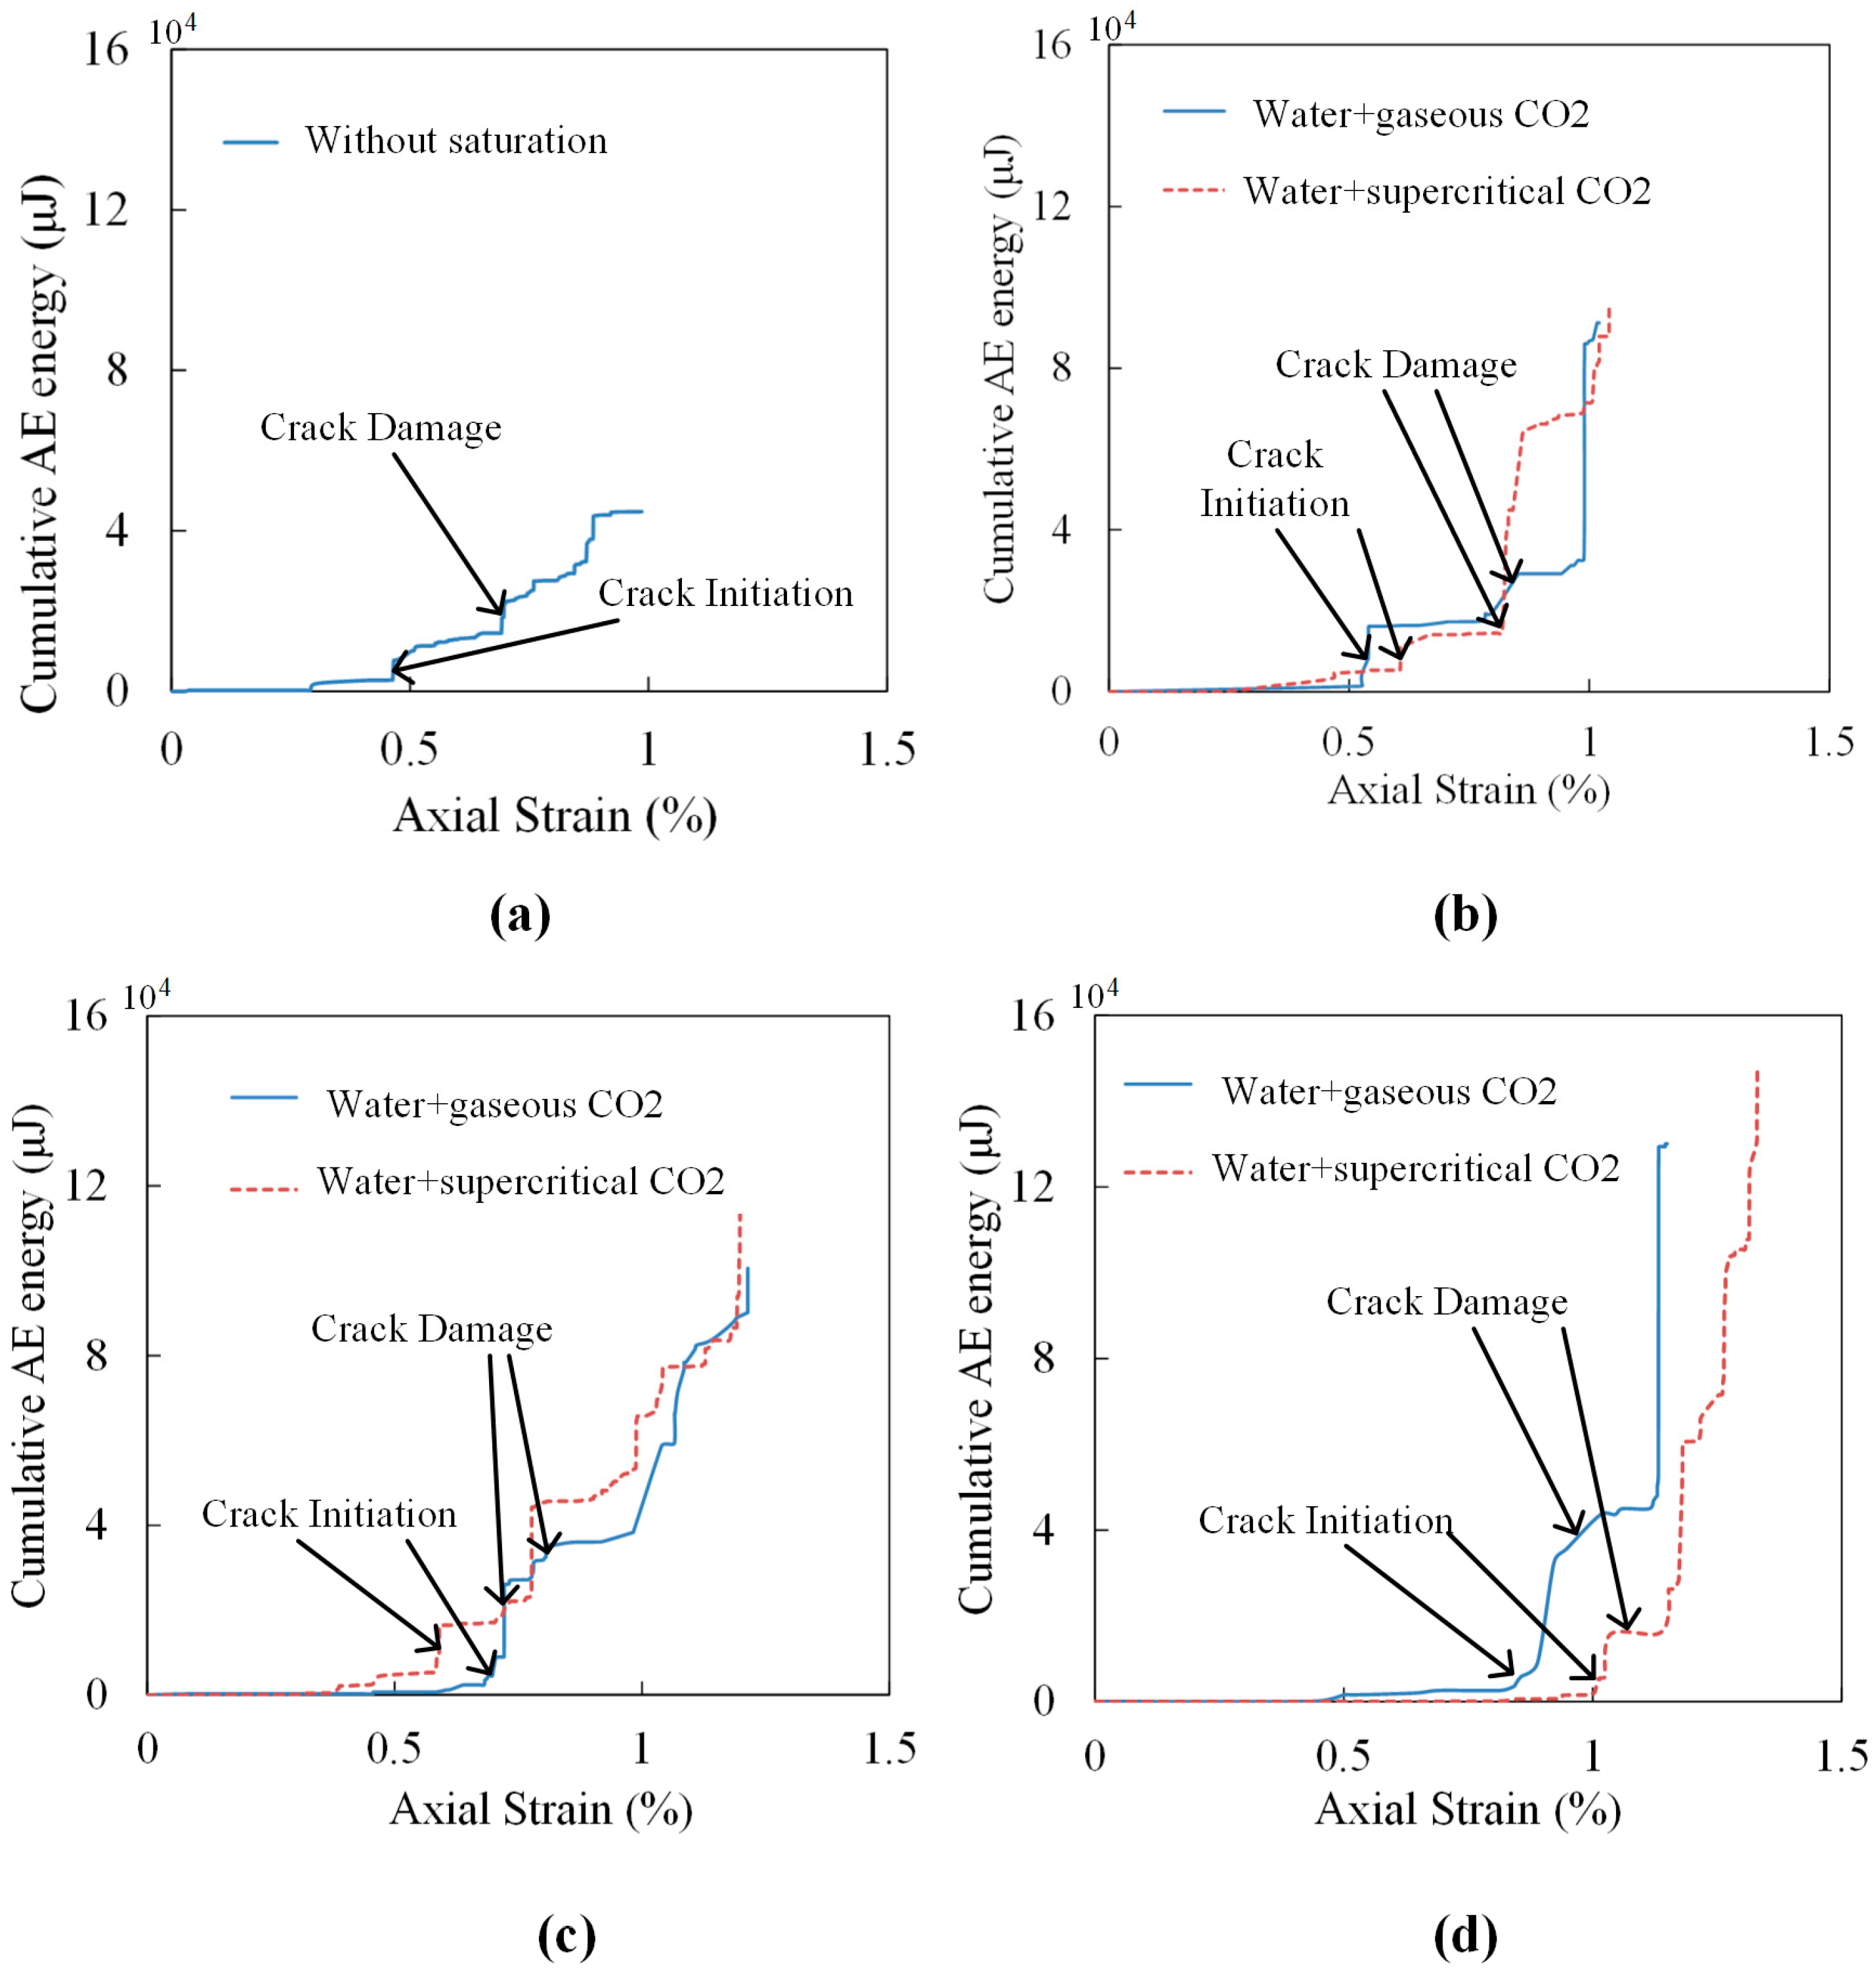
4.3. Effects of CO2-Water-Rock Interaction on Crack Propagation
5. Conclusions
Acknowledgments
Author Contributions
Conflicts of Interest
References
- Bachu, S.; Bonijoly, D.; Bradshaw, J.; Burruss, R.; Holloway, S.; Christensen, N.P.; Mathiassen, O.M. CO2 storage capacity estimation: Methodology and gaps. Int. J. Greenh. Gas Control 2007, 1, 430–443. [Google Scholar] [CrossRef]
- Dahaghi, A.K. Numerical simulation and modeling of enhanced gas recovery and CO2 sequestration in shale gas reservoirs: A feasibility study. In Proceedings of the SPE International Conference on CO2 Capture, Storage, and Utilization, New Orleans, LA, USA, 10–12 November 2010.
- Liu, F.; Ellett, K.; Xiao, Y.; Rupp, J.A. Assessing the feasibility of CO2 storage in the New Albany Shale (Devonian-Mississippian) with potential enhanced gas recovery using reservoir simulation. Int. J. Greenh. Gas Control 2013, 17, 111–126. [Google Scholar] [CrossRef]
- Chen, Z.; Liao, X.; Zhao, X.; Feng, X.; Zang, J.; He, L. A new analytical method based on pressure transient analysis to estimate carbon storage capacity of depleted shales: A case study. Int. J. Greenh. Gas Control 2015, 42, 46–58. [Google Scholar] [CrossRef]
- Gunter, W.; Wiwehar, B.; Perkins, E. Aquifer disposal of CO2-rich greenhouse gases: Extension of the time scale of experiment for CO2-sequestering reactions by geochemical modelling. Mineral. Petrol. 1997, 59, 121–140. [Google Scholar] [CrossRef]
- Carroll, S.A.; McNab, W.W.; Dai, Z.; Torres, S.C. Reactivity of Mount Simon sandstone and the Eau Claire shale under CO2 storage conditions. Environ. Sci. Technol. 2012, 47, 252–261. [Google Scholar] [CrossRef] [PubMed]
- Ketzer, J.; Iglesias, R.; Einloft, S.; Dullius, J.; Ligabue, R.; De Lima, V. Water-rock-CO2 interactions in saline aquifers aimed for carbon dioxide storage: Experimental and numerical modeling studies of the Rio Bonito Formation (Permian), southern Brazil. Appl. Geochem. 2009, 24, 760–767. [Google Scholar] [CrossRef]
- Lu, J.; Partin, J.W.; Hovorka, S.D.; Wong, C. Potential risks to freshwater resources as a result of leakage from CO2 geological storage: A batch-reaction experiment. Environ. Earth. Sci. 2010, 60, 335–348. [Google Scholar] [CrossRef]
- Liu, F.; Lu, P.; Griffith, C.; Hedges, S.W.; Soong, Y.; Hellevang, H.; Zhu, C. CO2–brine–caprock interaction: Reactivity experiments on Eau Claire shale and a review of relevant literature. Int. J. Greenh. Gas Control 2012, 7, 153–167. [Google Scholar] [CrossRef]
- Choi, B.-Y.; Yun, S.-T.; Mayer, B.; Hong, S.-Y.; Kim, K.-H.; Jo, H.-Y. Hydrogeochemical processes in clastic sedimentary rocks, South Korea: A natural analogue study of the role of dedolomitization in geologic carbon storage. Chem. Geol. 2012, 306, 103–113. [Google Scholar] [CrossRef]
- Chopping, C.; Kaszuba, J.P. Supercritical carbon dioxide-brine-rock reactions in the Madison Limestone of Southwest Wyoming: An experimental investigation of a sulfur-rich natural carbon dioxide reservoir. Chem. Geol. 2012, 322, 223–236. [Google Scholar] [CrossRef]
- Choi, B.-Y.; Yun, S.-T.; Kim, K.-H.; Choi, H.-S.; Chae, G.-T.; Lee, P.-K. Geochemical modeling of CO2-water-rock interactions for two different hydrochemical types of CO2-rich springs in Kangwon District, Korea. J. Geochem. Explor. 2014, 144, 49–62. [Google Scholar] [CrossRef]
- Wang, T.; Wang, H.; Zhang, F.; Xu, T. Simulation of CO2-water-rock interactions on geologic CO2 sequestration under geological conditions of China. Mar. Pollut. Bull. 2013, 76, 307–314. [Google Scholar] [CrossRef] [PubMed]
- Pokrovsky, O.S.; Golubev, S.V.; Schott, J.; Castillo, A. Calcite, dolomite and magnesite dissolution kinetics in aqueous solutions at acid to circumneutral pH, 25 to 150 C and 1 to 55 atm pCO2: New constraints on CO2 sequestration in sedimentary basins. Chem. Geol. 2009, 265, 20–32. [Google Scholar] [CrossRef]
- Pauwels, H.; Gaus, I.; le Nindre, Y.M.; Pearce, J.; Czernichowski-Lauriol, I. Chemistry of fluids from a natural analogue for a geological CO2 storage site (Montmiral, France): Lessons for CO2-water-rock interaction assessment and monitoring. Appl. Geochem. 2007, 22, 2817–2833. [Google Scholar] [CrossRef]
- Gaus, I. Role and impact of CO2-rock interactions during CO2 storage in sedimentary rocks. Int. J. Greenh. Gas Control 2010, 4, 73–89. [Google Scholar] [CrossRef]
- Harvey, O.R.; Qafoku, N.P.; Cantrell, K.J.; Lee, G.; Amonette, J.E.; Brown, C.F. Geochemical implications of gas leakage associated with geologic CO2 storage: A qualitative review. Environ. Sci. Technol. 2012, 47, 23–36. [Google Scholar] [CrossRef] [PubMed]
- Krevor, S.; Pini, R.; Zuo, L.; Benson, S.M. Relative permeability and trapping of CO2 and water in sandstone rocks at reservoir conditions. Water Resour. Res. 2012, 48, W02535–W02551. [Google Scholar] [CrossRef]
- Lyu, Q.; Long, X.; Ranjith, P.G.; Kang, Y. Unconventional Gas: Experimental Study of the Influence of Subcritical Carbon Dioxide on the Mechanical Properties of Black Shale. Energies 2016, 9, 516. [Google Scholar] [CrossRef]
- Bertier, P.; Swennen, R.; Laenen, B.; Lagrou, D.; Dreesen, R. Experimental identification of CO2-water-rock interactions caused by sequestration of CO2 in Westphalian and Buntsandstein sandstones of the Campine Basin (NE-Belgium). J. Geochem. Explor. 2006, 89, 10–14. [Google Scholar] [CrossRef] [Green Version]
- Madland, M.V.; Finsnes, A.; Alkafadgi, A.; Risnes, R.; Austad, T. The influence of CO2 gas and carbonate water on the mechanical stability of chalk. J. Petrol. Sci. Eng. 2006, 51, 149–168. [Google Scholar] [CrossRef]
- Bennion, B.; Bachu, S. Drainage and imbibition relative permeability relationships for supercritical CO2/brine and H2S/brine systems in intergranular sandstone, carbonate, shale, and anhydrite rocks. SPE Reserv. Eval. Eng. 2008, 11, 487–496. [Google Scholar] [CrossRef]
- Bachu, S.; Bennion, B. Effects of in-situ conditions on relative permeability characteristics of CO2-brine systems. Environ. Geol. 2008, 54, 1707–1722. [Google Scholar] [CrossRef]
- Farquhar, S.; Pearce, J.; Dawson, G.; Golab, A.; Sommacal, S.; Kirste, D.; Biddle, D.; Golding, S. A fresh approach to investigating CO2 storage: Experimental CO2-water-rock interactions in a low-salinity reservoir system. Chem. Geol. 2015, 399, 98–122. [Google Scholar] [CrossRef]
- Rutqvist, J.; Wu, Y.-S.; Tsang, C.-F.; Bodvarsson, G. A modeling approach for analysis of coupled multiphase fluid flow, heat transfer, and deformation in fractured porous rock. Int. J. Rock Mech. Min. 2002, 39, 429–442. [Google Scholar] [CrossRef]
- Rutqvist, J.; Birkholzer, J.; Tsang, C.-F. Coupled reservoir-geomechanical analysis of the potential for tensile and shear failure associated with CO2 injection in multilayered reservoir-caprock systems. Int. J. Rock Mech. Min. 2008, 45, 132–143. [Google Scholar] [CrossRef]
- Rutqvist, J.; Vasco, D.W.; Myer, L. Coupled reservoir-geomechanical analysis of CO2 injection and ground deformations at In Salah, Algeria. Int. J. Greenh. Gas Control 2010, 4, 225–230. [Google Scholar] [CrossRef]
- Rutqvist, J.; Tsang, C.-F. A study of caprock hydromechanical changes associated with CO2-injection into a brine formation. Environ. Geol. 2002, 42, 296–305. [Google Scholar] [CrossRef]
- Xie, C.; Zhang, J.; Li, Y.; Wang, X. Characteristics and gas content of the Lower Cambrian dark shale in Well Yuke 1, Southeast Chongqing. Oil Gas Geol. 2013, 1, 4. [Google Scholar]
- Tian, H.; Pan, L.; Xiao, X.; Wilkins, R.W.; Meng, Z.; Huang, B. A preliminary study on the pore characterization of Lower Silurian black shales in the Chuandong Thrust Fold Belt, southwestern China using low pressure N2 adsorption and FE-SEM methods. Mar. Petrol. Geol. 2013, 48, 8–19. [Google Scholar] [CrossRef]
- Pan, L.; Xiao, X.; Tian, H.; Zhou, Q.; Cheng, P. Geological models of gas in place of the Longmaxi shale in Southeast Chongqing, South China. Mar. Petrol. Geol. 2016, 73, 433–444. [Google Scholar] [CrossRef]
- Toews, K.L.; Shroll, R.M.; Wai, C.M.; Smart, N.G. pH-defining equilibrium between water and supercritical CO2. Influence on SFE of organics and metal chelates. Anal. Chem. 1995, 67, 4040–4043. [Google Scholar] [CrossRef]
- Watson, M. Petrological Characterisation of the Vlaming Sub-Basin, Perth Basin for the Purpose of CO2 Storage; CO2CRC Publication Number RPT06-0098; CO2CRC: Melbourne, Australia, 2006. [Google Scholar]
- Oomole, O.; Osoba, J. Carbon dioxide-dolomite rock interaction during CO flooding process. In Proccedings of the Annual Technical Meeting, Banff, AB, Canada, 10–13 May 1983.
- Wigand, M.; Carey, J.; Schütt, H.; Spangenberg, E.; Erzinger, J. Geochemical effects of CO2 sequestration in sandstones under simulated in situ conditions of deep saline aquifers. Appl. Geochem. 2008, 23, 2735–2745. [Google Scholar] [CrossRef]
- Krauskopf, K.B.; Bird, D.K. Introduction to Geochemistry; McGraw-Hill New York: New York, NY, USA, 1967; Volume 721. [Google Scholar]
- Rathnaweera, T.; Ranjith, P.; Perera, M.; Haque, A.; Lashin, A.; Al Arifi, N.; Chandrasekharam, D.; Yang, S.; Xu, T.; Wang, S. CO2-induced mechanical behaviour of Hawkesbury sandstone in the Gosford basin: An experimental study. Mater. Sci. Eng. A 2015, 641, 123–137. [Google Scholar] [CrossRef]
- Marbler, H.; Erickson, K.P.; Schmidt, M.; Lempp, C.; Pöllmann, H. Geomechanical and geochemical effects on sandstones caused by the reaction with supercritical CO2: An experimental approach to in situ conditions in deep geological reservoirs. Environ. Earth Sci. 2013, 69, 1981–1998. [Google Scholar] [CrossRef]
- Lyu, Q.; Ranjith, P.; Long, X.; Kang, Y.; Huang, M. A review of shale swelling by water adsorption. J. Nat. Gas Sci. Eng. 2015, 27, 1421–1431. [Google Scholar] [CrossRef]
- Heller, R.; Zoback, M. Adsorption of methane and carbon dioxide on gas shale and pure mineral samples. J. Unconv. Oil Gas Resour. 2014, 8, 14–24. [Google Scholar] [CrossRef]
- Luo, X.; Wang, S.; Wang, Z.; Jing, Z.; Lv, M.; Zhai, Z.; Han, T. Adsorption of methane, carbon dioxide and their binary mixtures on Jurassic shale from the Qaidam Basin in China. Int. J. Coal. Geol. 2015, 150–151, 210–223. [Google Scholar] [CrossRef]
- Middleton, R.S.; Carey, J.W.; Currier, R.P.; Hyman, J.D.; Kang, Q.; Karra, S.; Jiménez-Martínez, J.; Porter, M.L.; Viswanathan, H.S. Shale gas and non-aqueous fracturing fluids: Opportunities and challenges for supercritical CO2. Appl. Energy 2015, 147, 500–509. [Google Scholar] [CrossRef]
- De Jong, S.M.; Spiers, C.J.; Busch, A. Development of swelling strain in smectite clays through exposure to carbon dioxide. Int. J. Greenh. Gas Control 2014, 24, 149–161. [Google Scholar] [CrossRef]
- Span, R.; Wagner, W. A new equation of state for carbon dioxide covering the fluid region from the triple-point temperature to 1100 K at pressures up to 800 MPa. J. Phys. Chem. Ref. Data 1996, 25, 1509–1596. [Google Scholar] [CrossRef]
- Hou, D.; Luo, P.; Wang, C.; Sun, L.; Tang, Y.; Pan, Y. Experimental research and theoretical model for CO2 solubility in water under high temperature and high pressure. J. Jilin Univ. Earth Ed. 2015, 45, 564–572. [Google Scholar]
- Zhang, D.; Ranjith, P.; Perera, M. The brittleness indices used in rock mechanics and their application in shale hydraulic fracturing: A review. J. Petrol. Sci. Eng. 2016, 143, 158–170. [Google Scholar] [CrossRef]
- Hucka, V.; Das, B. International Journal of Rock Mechanics and Mining Sciences & Geomechanics Abstracts. In Brittleness Determination of Rocks by Different Methods; Elsevier: Amsterdam, The Newtherlands, 1974; pp. 389–392. [Google Scholar]
- Lyu, Q.; Ranjith, P.; Long, X.; Kang, Y.; Huang, M. Effects of coring directions on the mechanical properties of Chinese shale. Arab. J. Geosci. 2015, 8, 10289–10299. [Google Scholar] [CrossRef]


| Mineralogical Analysis | Value (%, w/w) | Chemistry |
|---|---|---|
| Quartz | 58.38 | SiO2 |
| Potassium Feldspar | 14.57 | KAlSi3O8 |
| Muscovite | 5.57 | KAl2(Si3AlO10) |
| Calcite | 9.54 | CaCO₃ |
| Pyrite | 4.08 | FeS2 |
| Smectite | 3.43 | (Al,Mg)2[Si4O10](OH)2·nH2O |
| Illite | 1.42 | K1.5Al4(Si6.5Al1.5O20)(OH)4 |
| Annite | 1.41 | -- |
| Kaolinite | 1.00 | Al2Si2O5(OH)4 |
| Braunite | 0.37 | -- |
| Experimental Stage | Stage Duration (Days) | Pressure (MPa) | Temperature (°C) | Number of Samples |
|---|---|---|---|---|
| Without saturation | -- | -- | -- | 2 |
| Gaseous | 10 | 7 | 40 | 2 |
| 20 | 7 | 40 | 2 | |
| 30 | 7 | 40 | 2 | |
| Super-critical | 10 | 9 | 40 | 2 |
| 20 | 9 | 40 | 2 | |
| 30 | 9 | 40 | 2 |
| Specimen | UCS, MPa | Average UCS, MPa (Standard Deviation, MPa) | ∆UCS, % | Young’s Modulus, GPa | Average E, GPa (Standard Deviation, GPa) | ∆E, % | |
|---|---|---|---|---|---|---|---|
| Without saturation | NO. 1 | 56.33 | 58.82 (2.49) | — | 5.41 | 5.22 (0.20) | — |
| NO. 2 | 61.31 | 5.02 | |||||
| Gaseous CO2 + water | 10 days | ||||||
| NO. 1 | 37.85 | 40.42 (2.57) | 31.28% | 3.61 | 3.79 (0.18) | 27.39% | |
| NO. 2 | 42.98 | 3.96 | |||||
| 20 days | |||||||
| NO. 1 | 29.55 | 31.36 (1.81) | 46.68% | 2.44 | 2.60 (0.16) | 49.81% | |
| NO. 2 | 33.16 | 2.76 | |||||
| 30 days | |||||||
| NO. 1 | 23.49 | 25.63 (2.14) | 56.43% | 2.23 | 2.39 (0.16) | 54.21% | |
| NO. 2 | 27.76 | 2.54 | |||||
| Super-critical CO2 + water | 10 days | ||||||
| NO. 1 | 37.42 | 39.02 (1.60) | 33.66% | 3.45 | 3.64 (0.19) | 30.27% | |
| NO. 2 | 40.62 | 3.83 | |||||
| 20 days | |||||||
| NO. 1 | 27.55 | 30.72 (3.17) | 47.77% | 2.25 | 2.47 (0.22) | 52.68% | |
| NO. 2 | 33.89 | 2.69 | |||||
| 30 days | |||||||
| NO. 1 | 19.97 | 19.97 | 66.05% | 2.28 | 2.28 | 56.32% | |
| NO. 2 | 9.35 (excluded) | -- | |||||
| Properties | Phase | Density kg/m3 | Viscosity μPa·s | Thermal Conductivity W/m·K | Dissolution in Water dm3/kg | pH of Water |
|---|---|---|---|---|---|---|
| Gaseous CO2 | Vapor | 198.55 | 19.288 | 0.031 | 26.23 | 2.84 ± 0.02 |
| SC-CO2 | Super-critical | 492.75 | 35.360 | 0.071 | 27.81 | 2.83 ± 0.02 |
| Saturation Condition | Saturation Time/Days | |||||||
|---|---|---|---|---|---|---|---|---|
| 0 | 10 | 20 | 30 | |||||
| BI % | Average % (Standard Deviation) | BI % | Average % (Standard Deviation) | BI % | Average % (Standard Deviation) | BI % | Average % (Standard Deviation) | |
| Without saturation | 83.1 | 84.3 (1.2) | — | — | — | — | — | — |
| 85.4 | — | — | — | |||||
| Gaseous | — | — | 79.8 | 76.4 (3.4) | 75.6 | 74.0 (1.7) | 43.4 | 50.9 (7.5) |
| — | 73.0 | 72.3 | 58.3 | |||||
| Super-critical | — | — | 68.2 | 65.2 (3.0) | 62.5 | 59.9 (2.6) | 47.9 | 47.9 |
| — | 62.2 | 57.3 | — | |||||
| Saturation Condition | Crack Initiation (% of peak) | Crack Damage (% of peak) | Peak Cumulative AE Energy μJ | |||
|---|---|---|---|---|---|---|
| Cumulative AE Energy μJ (% of peak) | Axial Stress MPa (% of peak) | Cumulative AE Energy μJ (% of peak) | Axial Stress MPa (% of peak) | |||
| Without saturation | 2864 (6.4) | 23.36 (39.7) | 14,511 (32.4) | 44.15 (75.1) | 44,802 | |
| Gaseous | 10 days | 1377 (1.5) | 12.77 (31.6) | 17,518 (19.2) | 26.52 (65.6) | 91,227 |
| 20 days | 2347 (2.3) | 15.76 (50.3) | 38,369 (38.2) | 21.93 (70.0) | 100,564 | |
| 30 days | 3578 (2.8) | 19.79 (77.2) | 46,995 (36.1) | 22.09 (86.2) | 130,037 | |
| Super-critical | 10 days | 5306 (5.6) | 18.86 (48.3) | 14,526 (15.3) | 31.57 (80.9) | 94,840 |
| 20 days | 5306 (4.6) | 16.40 (53.4) | 23,395 (20.2) | 26.48 (86.2) | 116,068 | |
| 30 days | 2039 (1.4) | 14.29 (71.5) | 15,745 (10.6) | 19.13 (95.8) | 147,862 | |
© 2016 by the authors; licensee MDPI, Basel, Switzerland. This article is an open access article distributed under the terms and conditions of the Creative Commons Attribution (CC-BY) license (http://creativecommons.org/licenses/by/4.0/).
Share and Cite
Lyu, Q.; Ranjith, P.G.; Long, X.; Ji, B. Experimental Investigation of Mechanical Properties of Black Shales after CO2-Water-Rock Interaction. Materials 2016, 9, 663. https://doi.org/10.3390/ma9080663
Lyu Q, Ranjith PG, Long X, Ji B. Experimental Investigation of Mechanical Properties of Black Shales after CO2-Water-Rock Interaction. Materials. 2016; 9(8):663. https://doi.org/10.3390/ma9080663
Chicago/Turabian StyleLyu, Qiao, Pathegama Gamage Ranjith, Xinping Long, and Bin Ji. 2016. "Experimental Investigation of Mechanical Properties of Black Shales after CO2-Water-Rock Interaction" Materials 9, no. 8: 663. https://doi.org/10.3390/ma9080663
APA StyleLyu, Q., Ranjith, P. G., Long, X., & Ji, B. (2016). Experimental Investigation of Mechanical Properties of Black Shales after CO2-Water-Rock Interaction. Materials, 9(8), 663. https://doi.org/10.3390/ma9080663