
Modeling the Effects of Cu Content and Deformation Variables on the High-Temperature Flow Behavior of Dilute Al-Fe-Si Alloys Using an Artificial Neural Network

Abstract
:
1. Introduction
2. Experimental Procedures
3. Results and Discussion
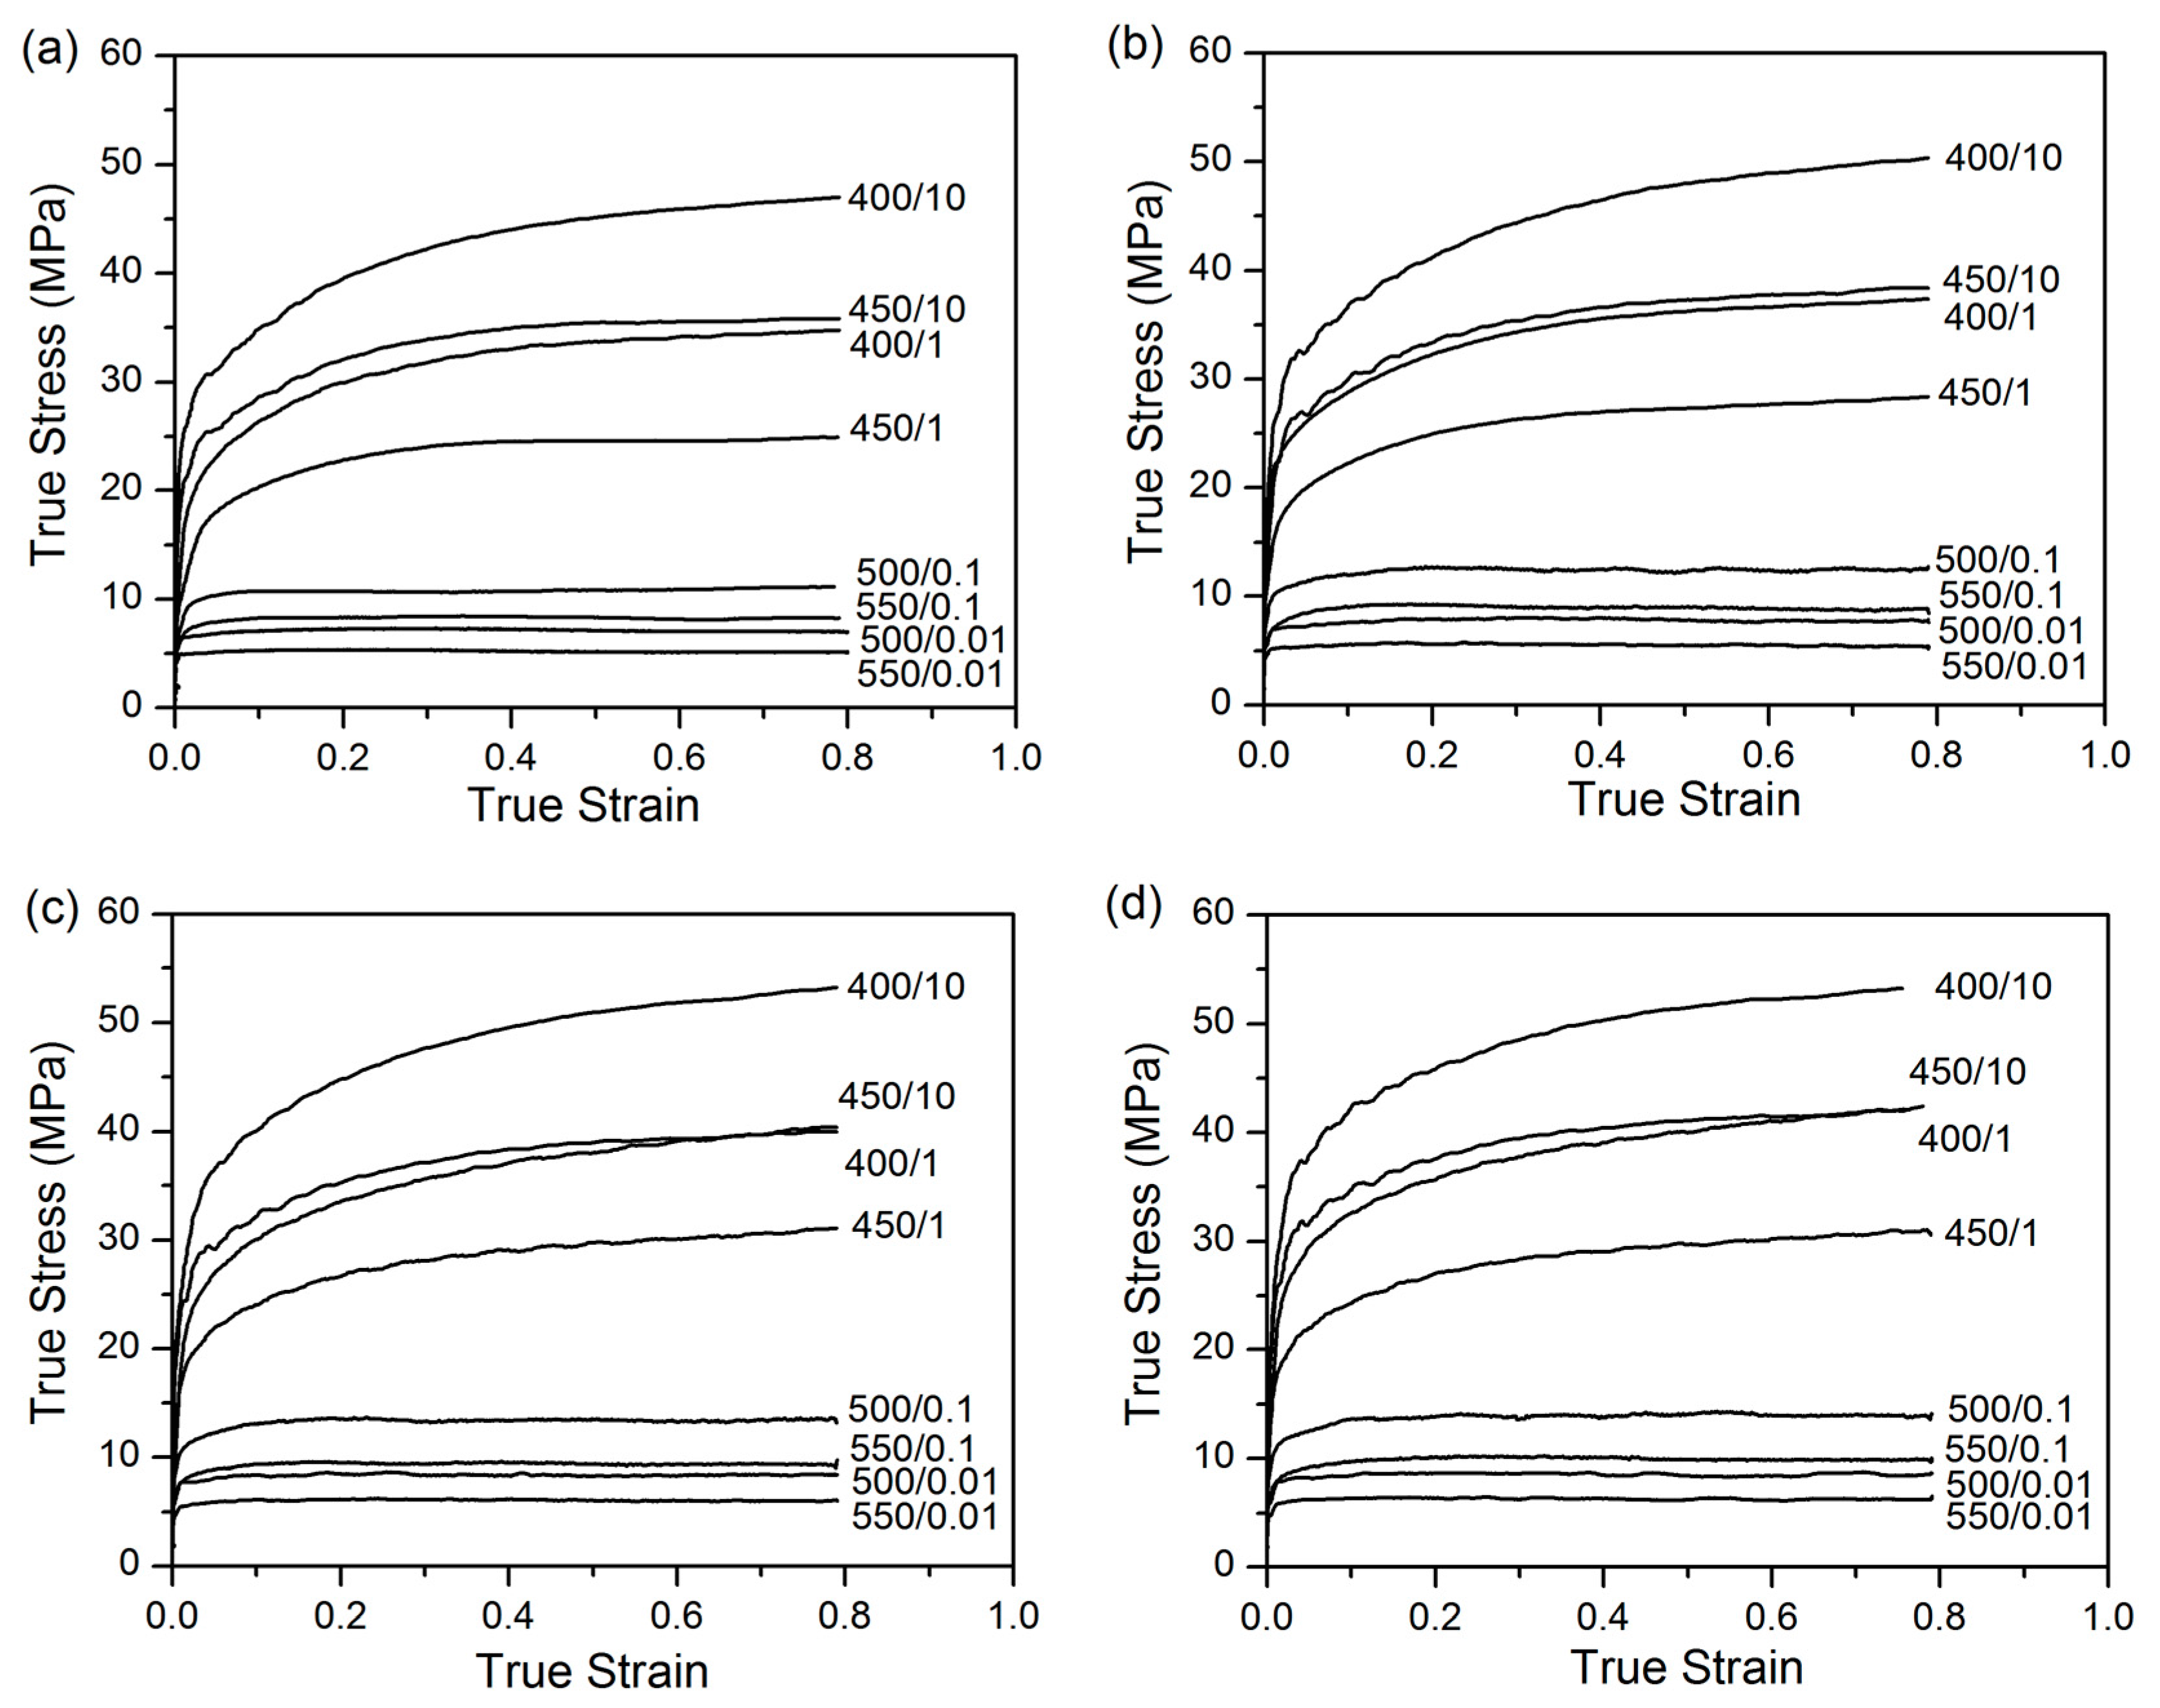
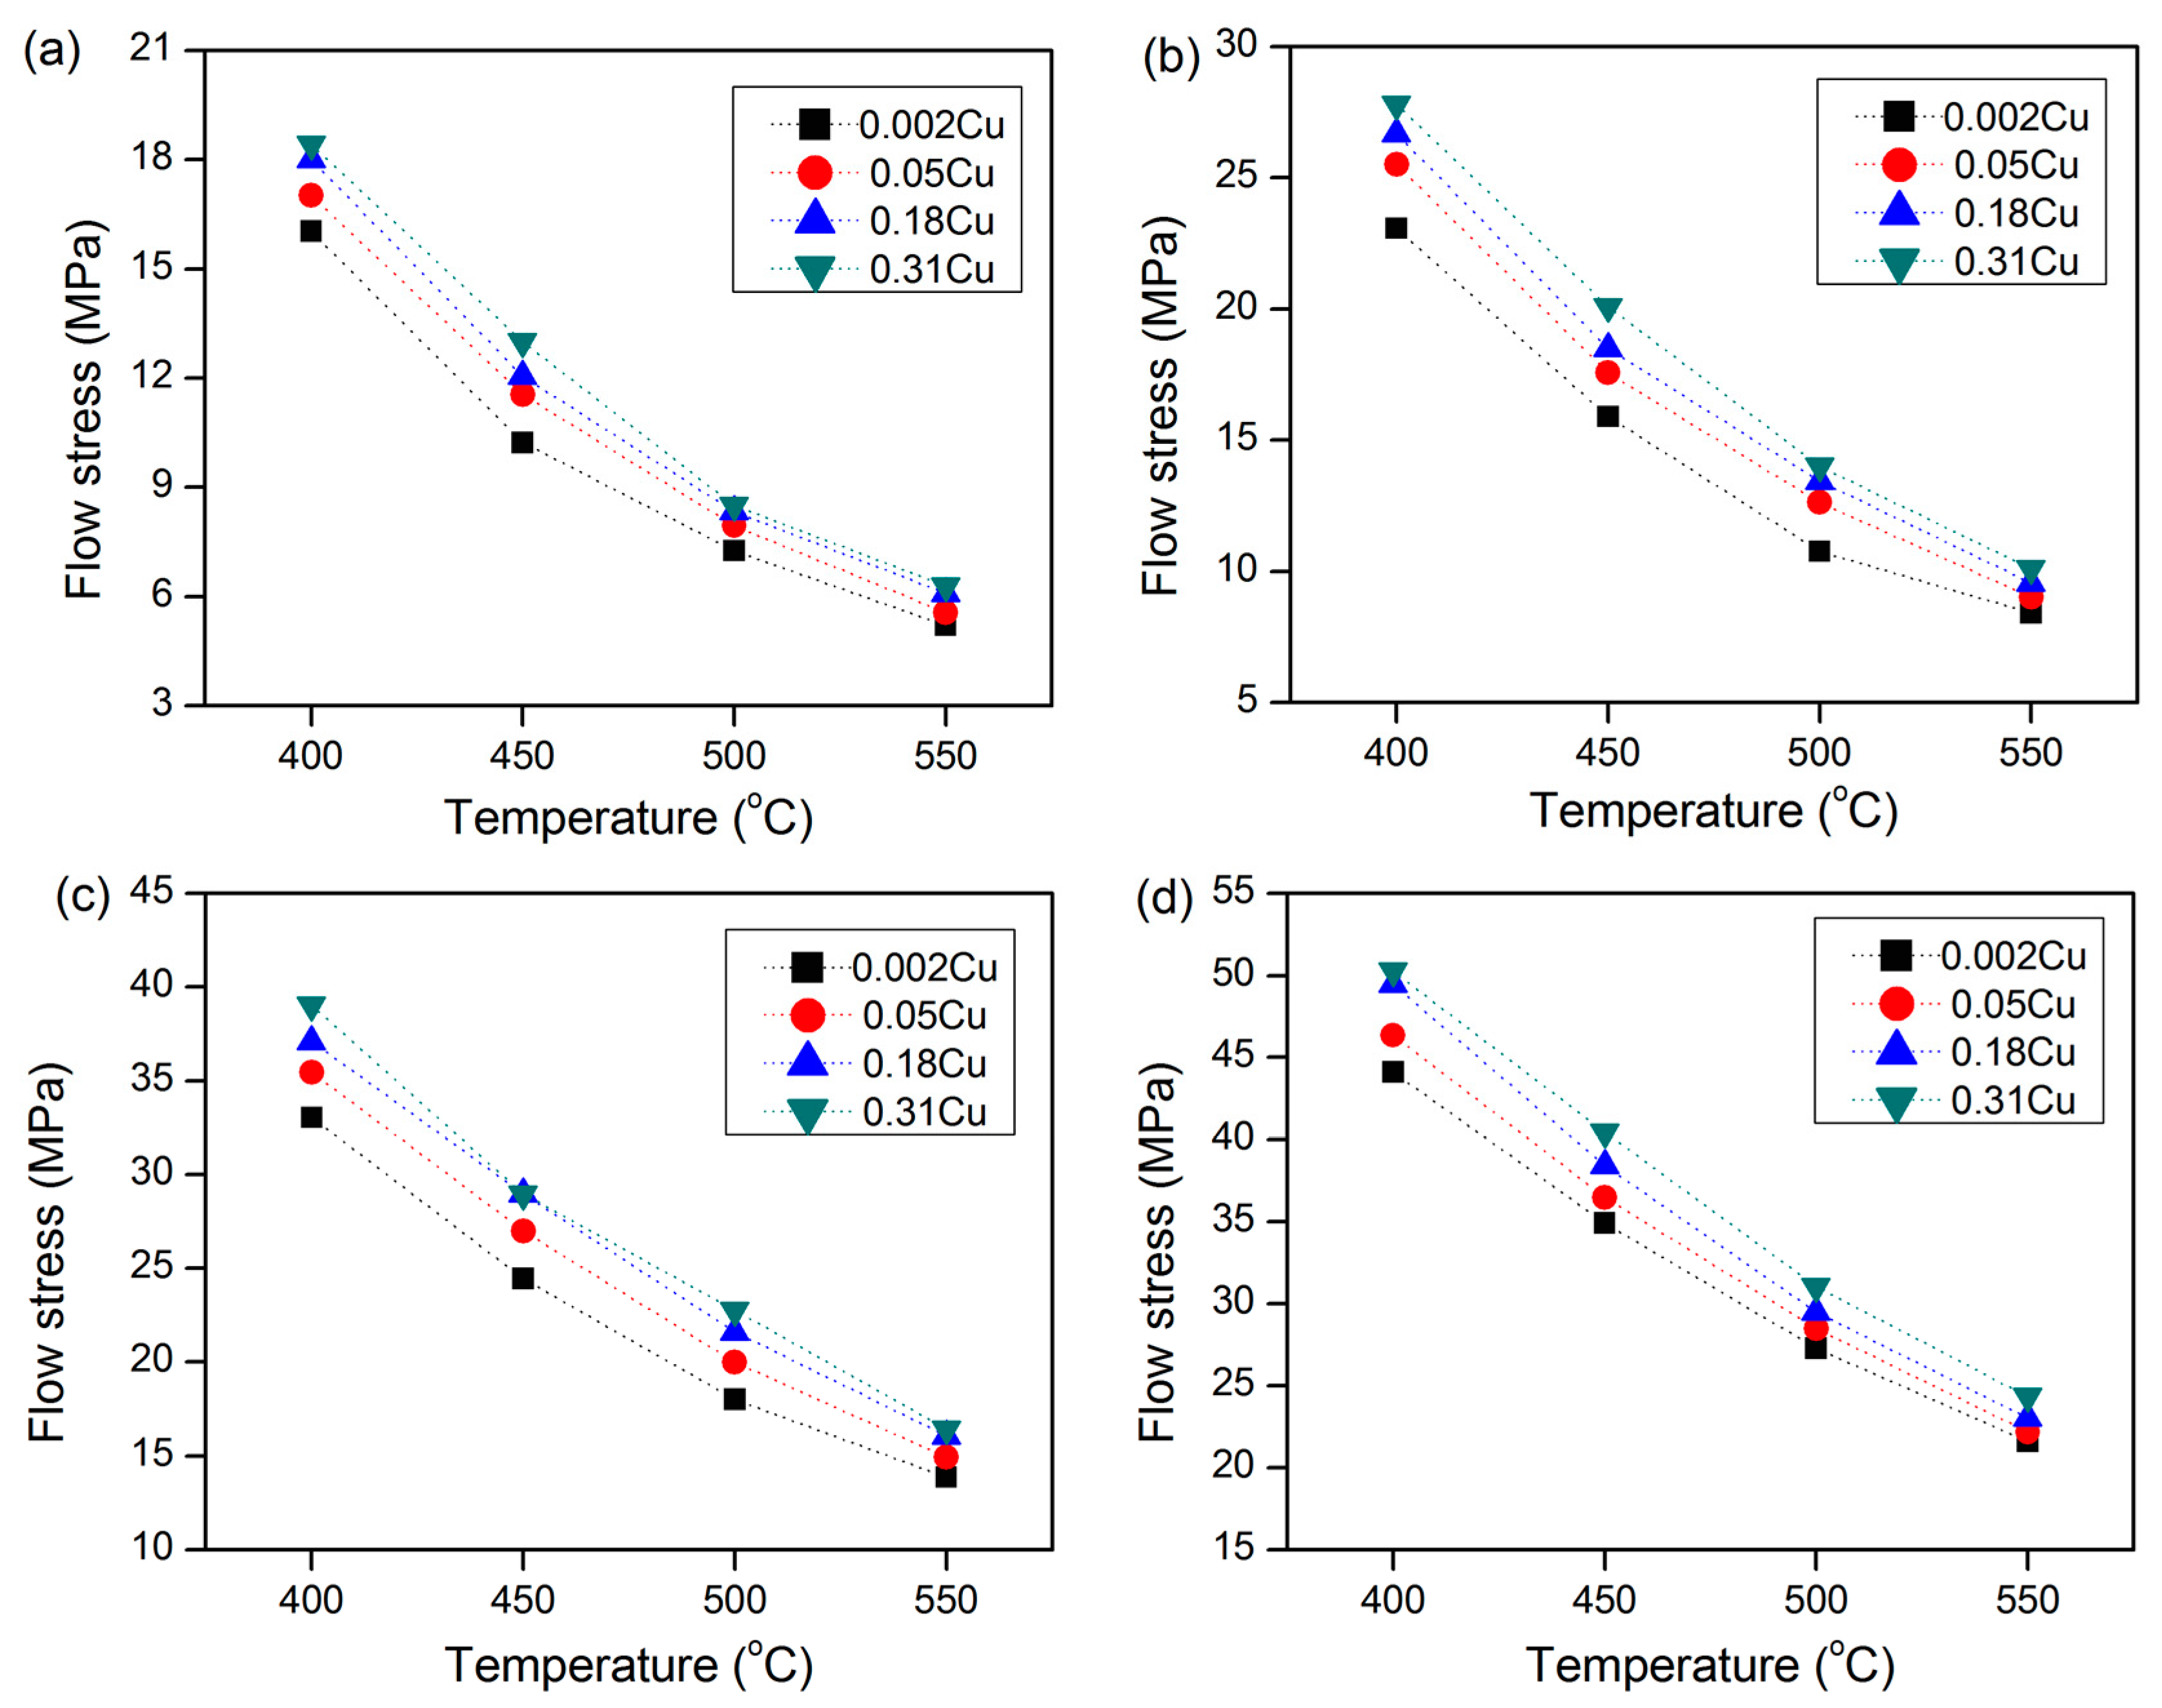
3.1. Effect of Cu Content on Flow Stress Behavior
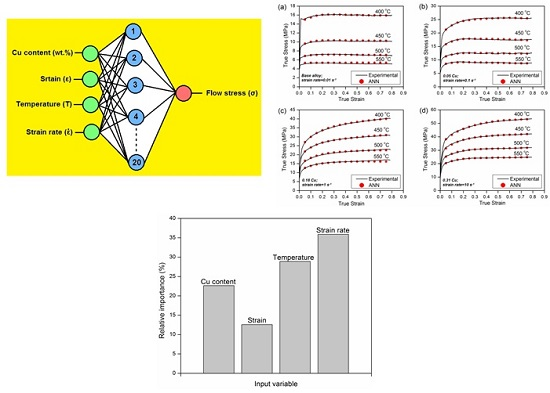
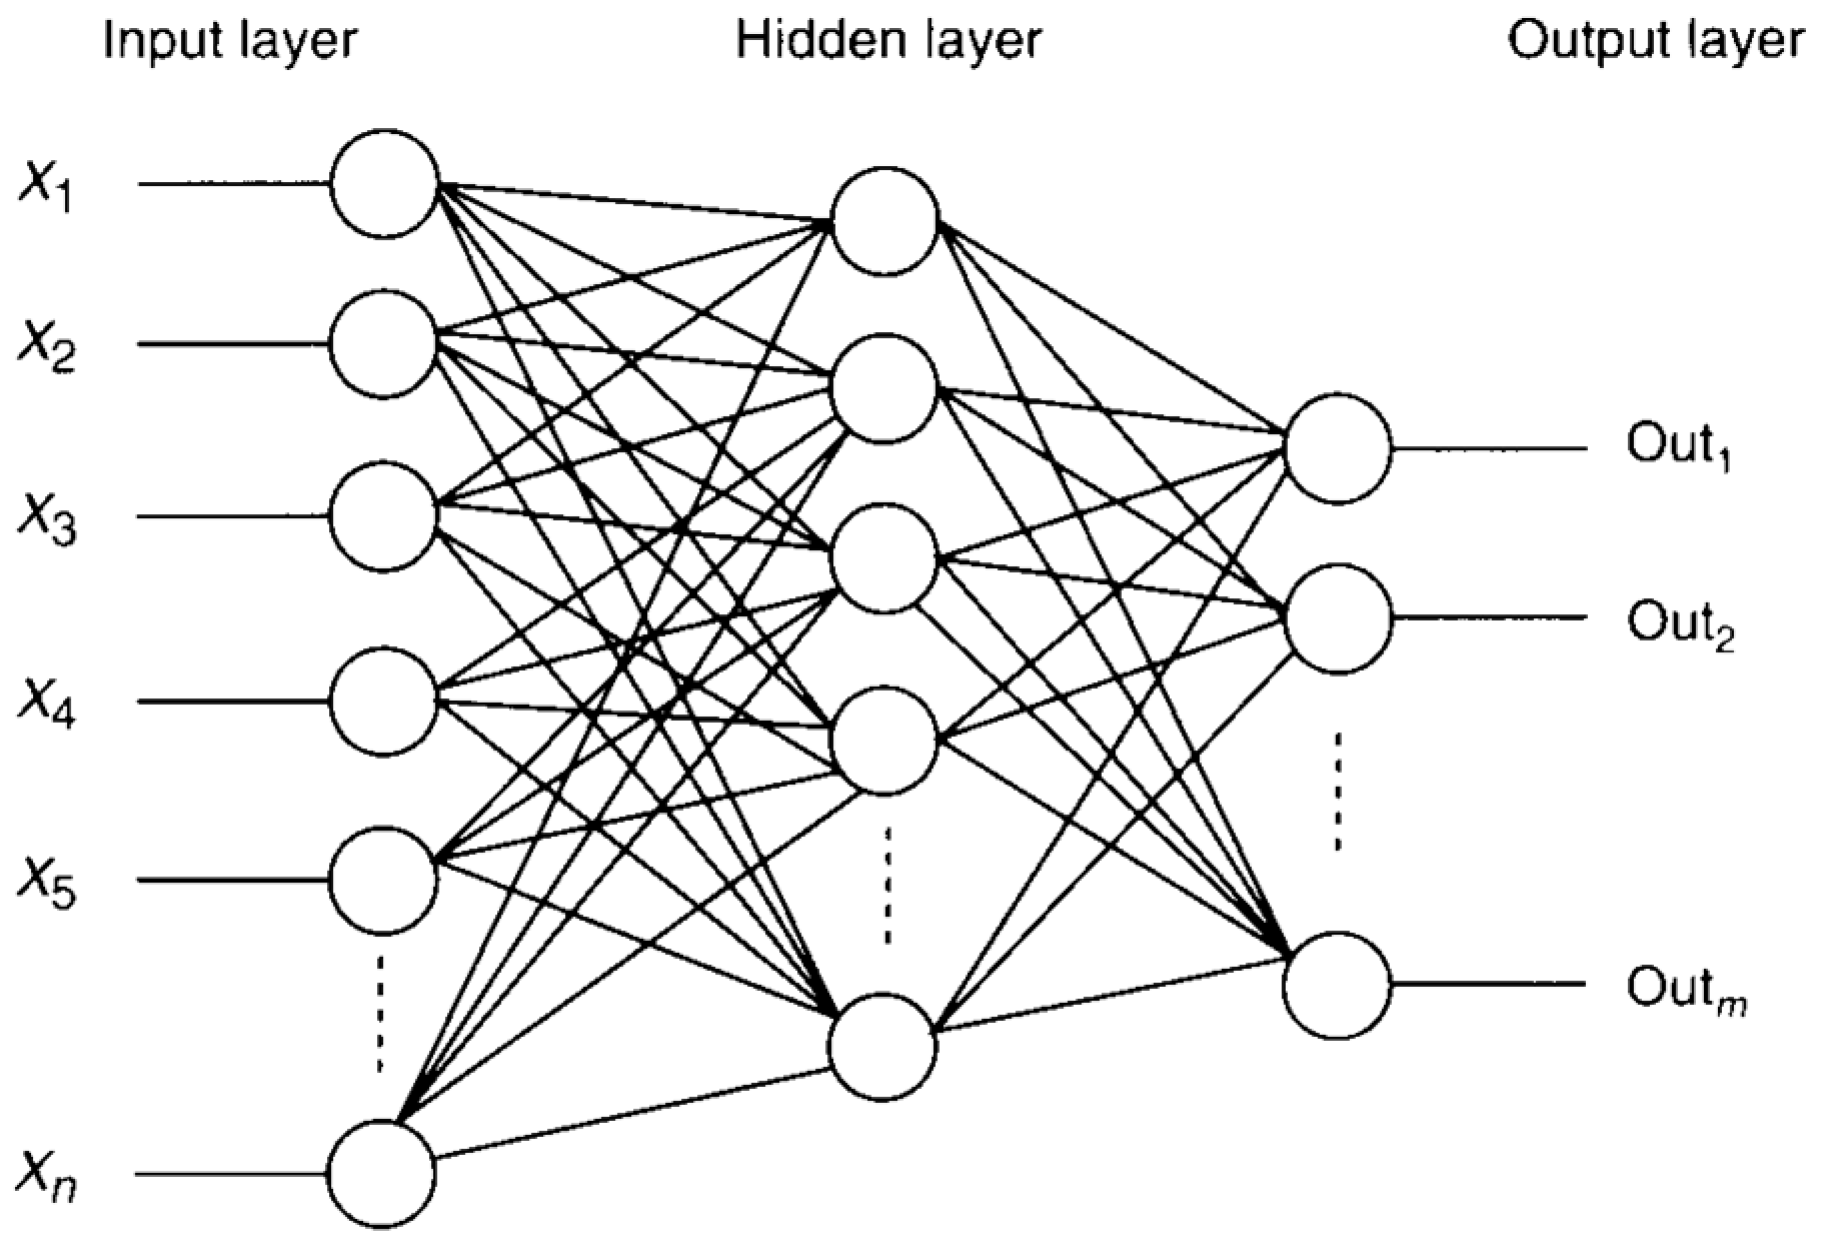
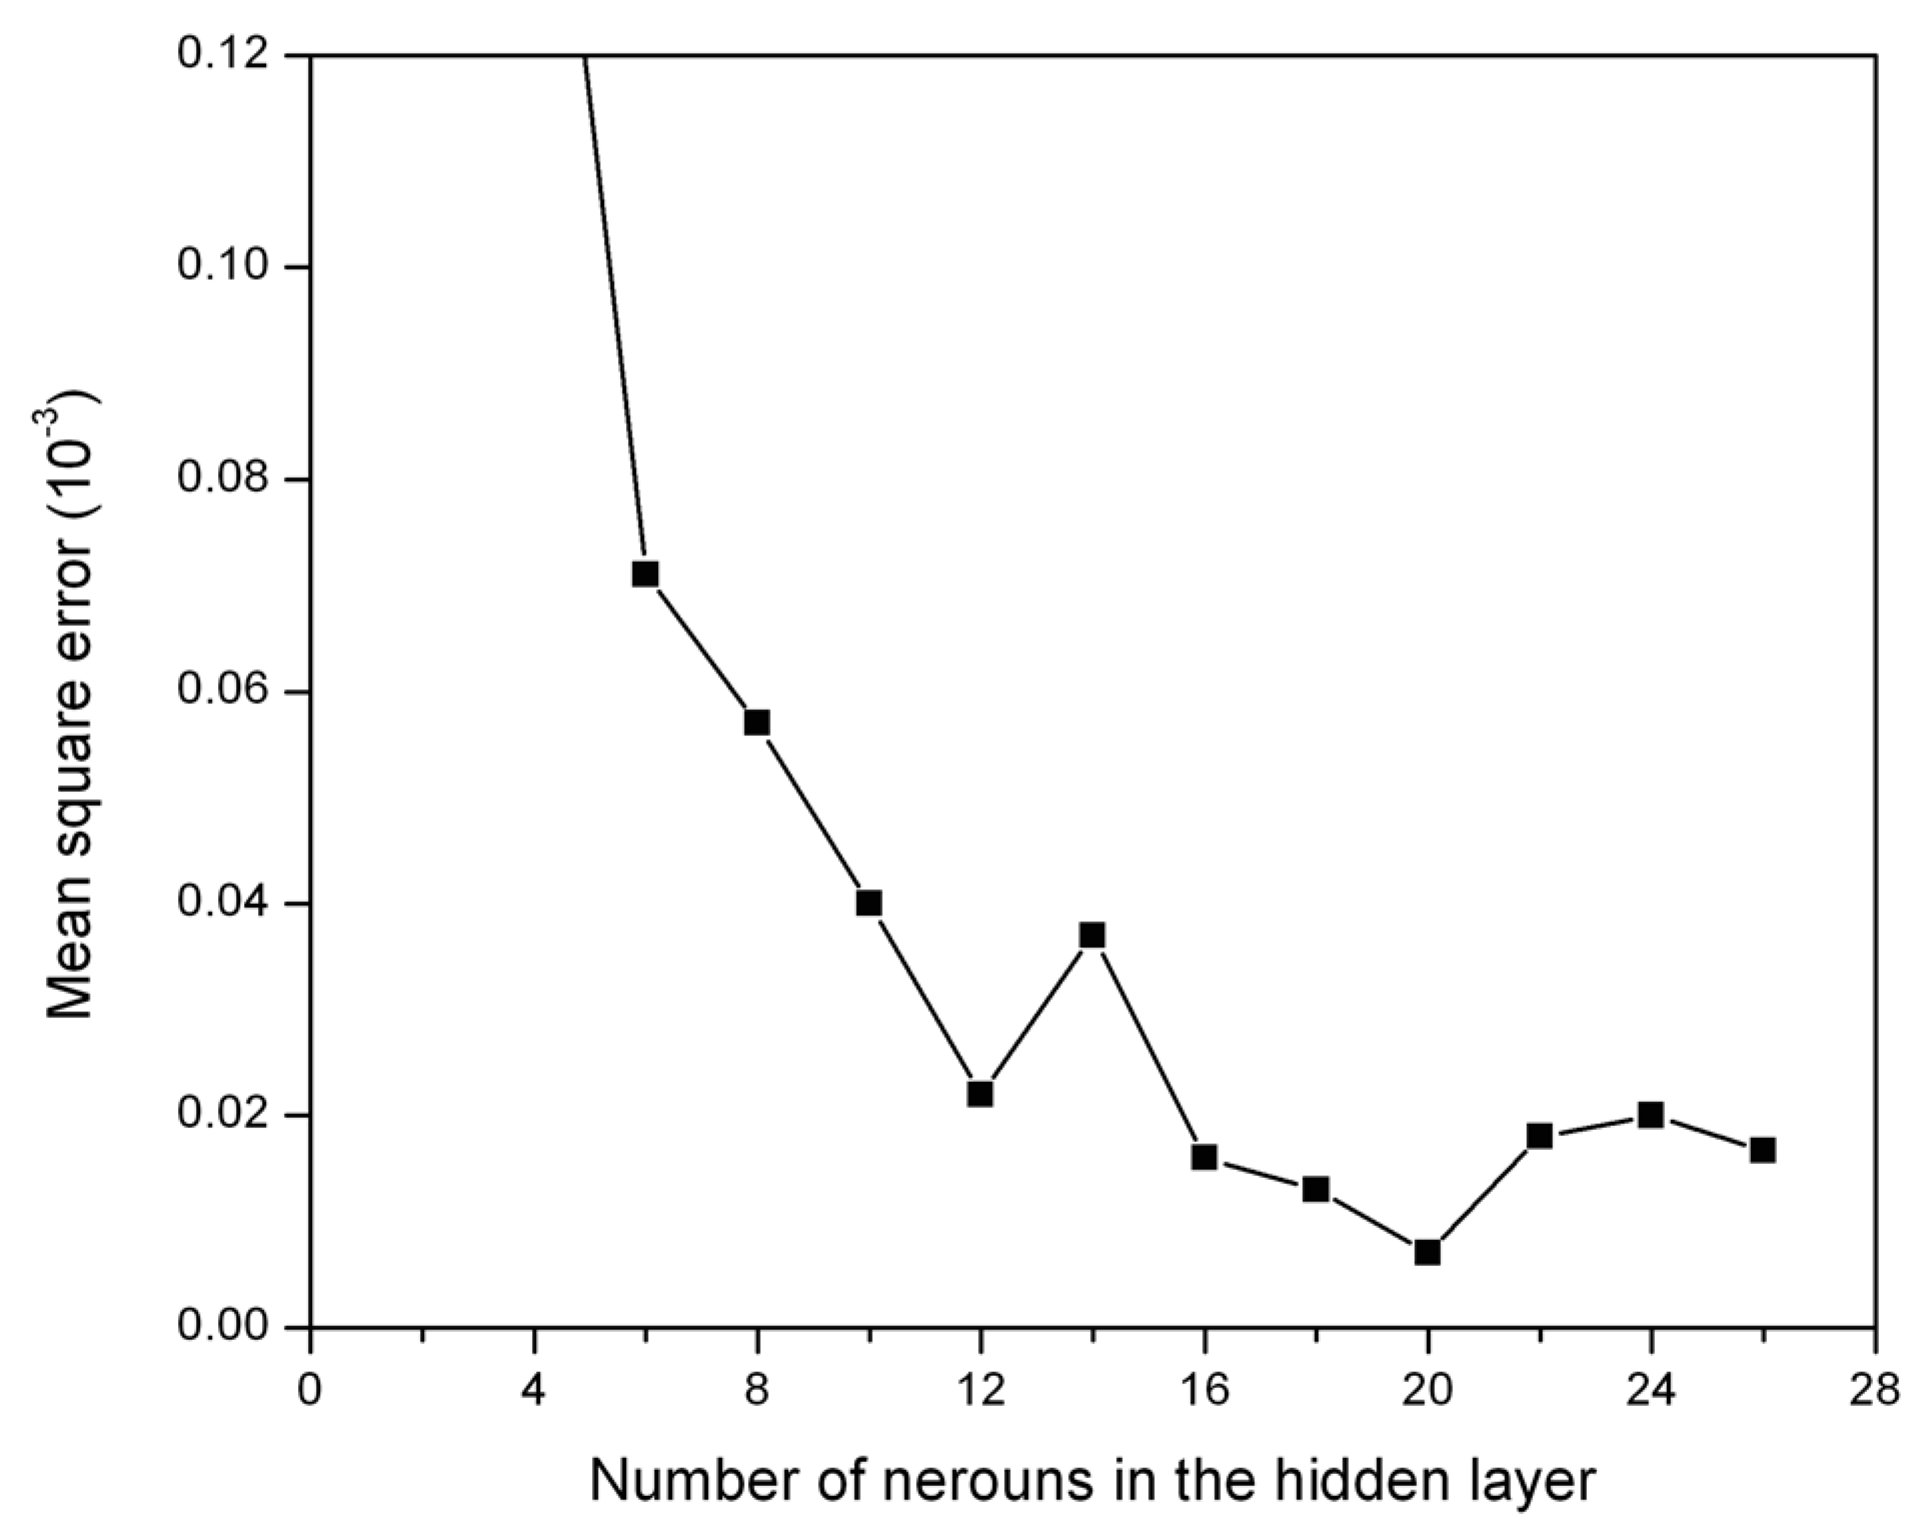
3.2. Development of an Artificial Neural Network Model
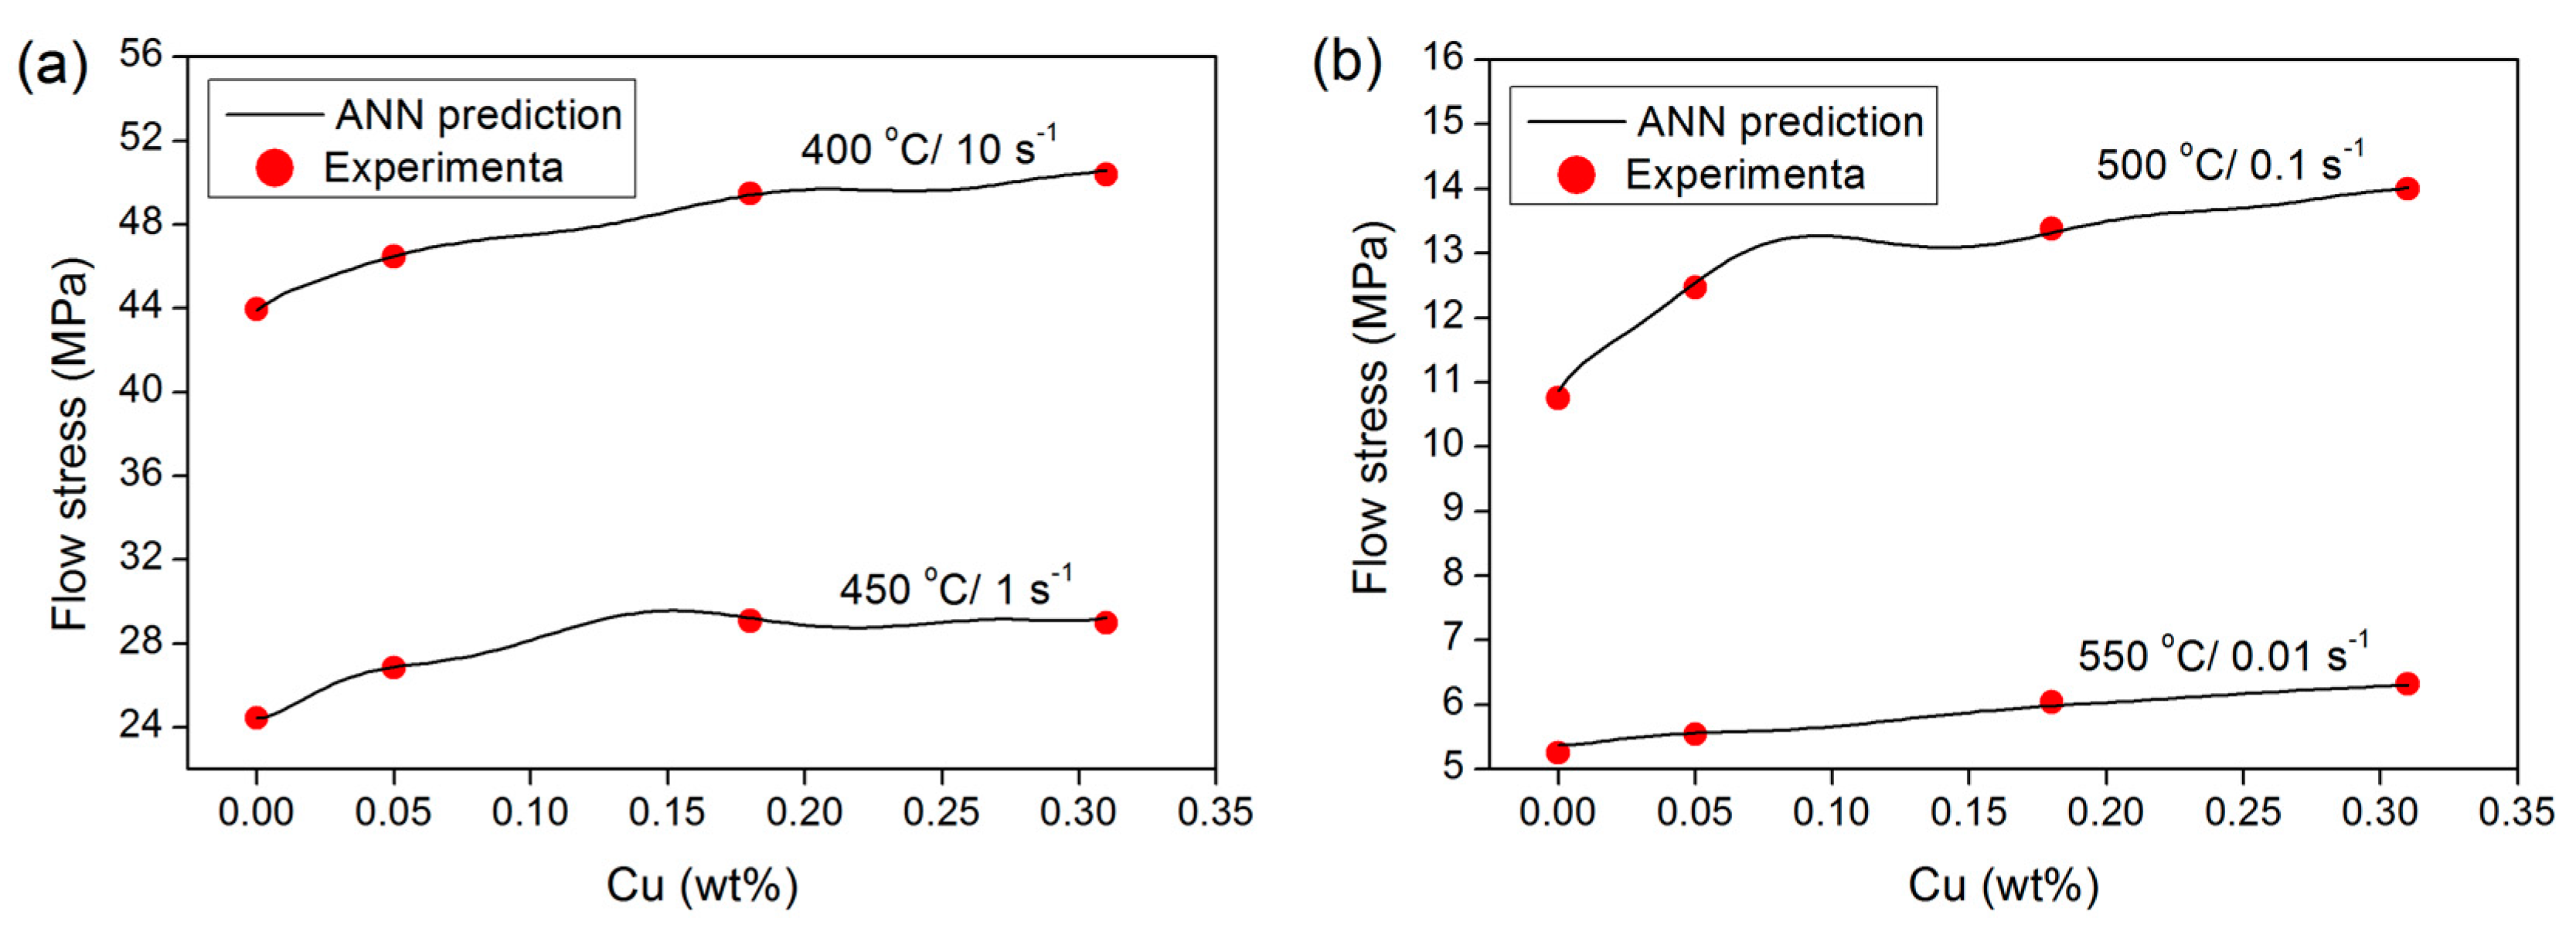
3.2.1. Effect of Cu Addition
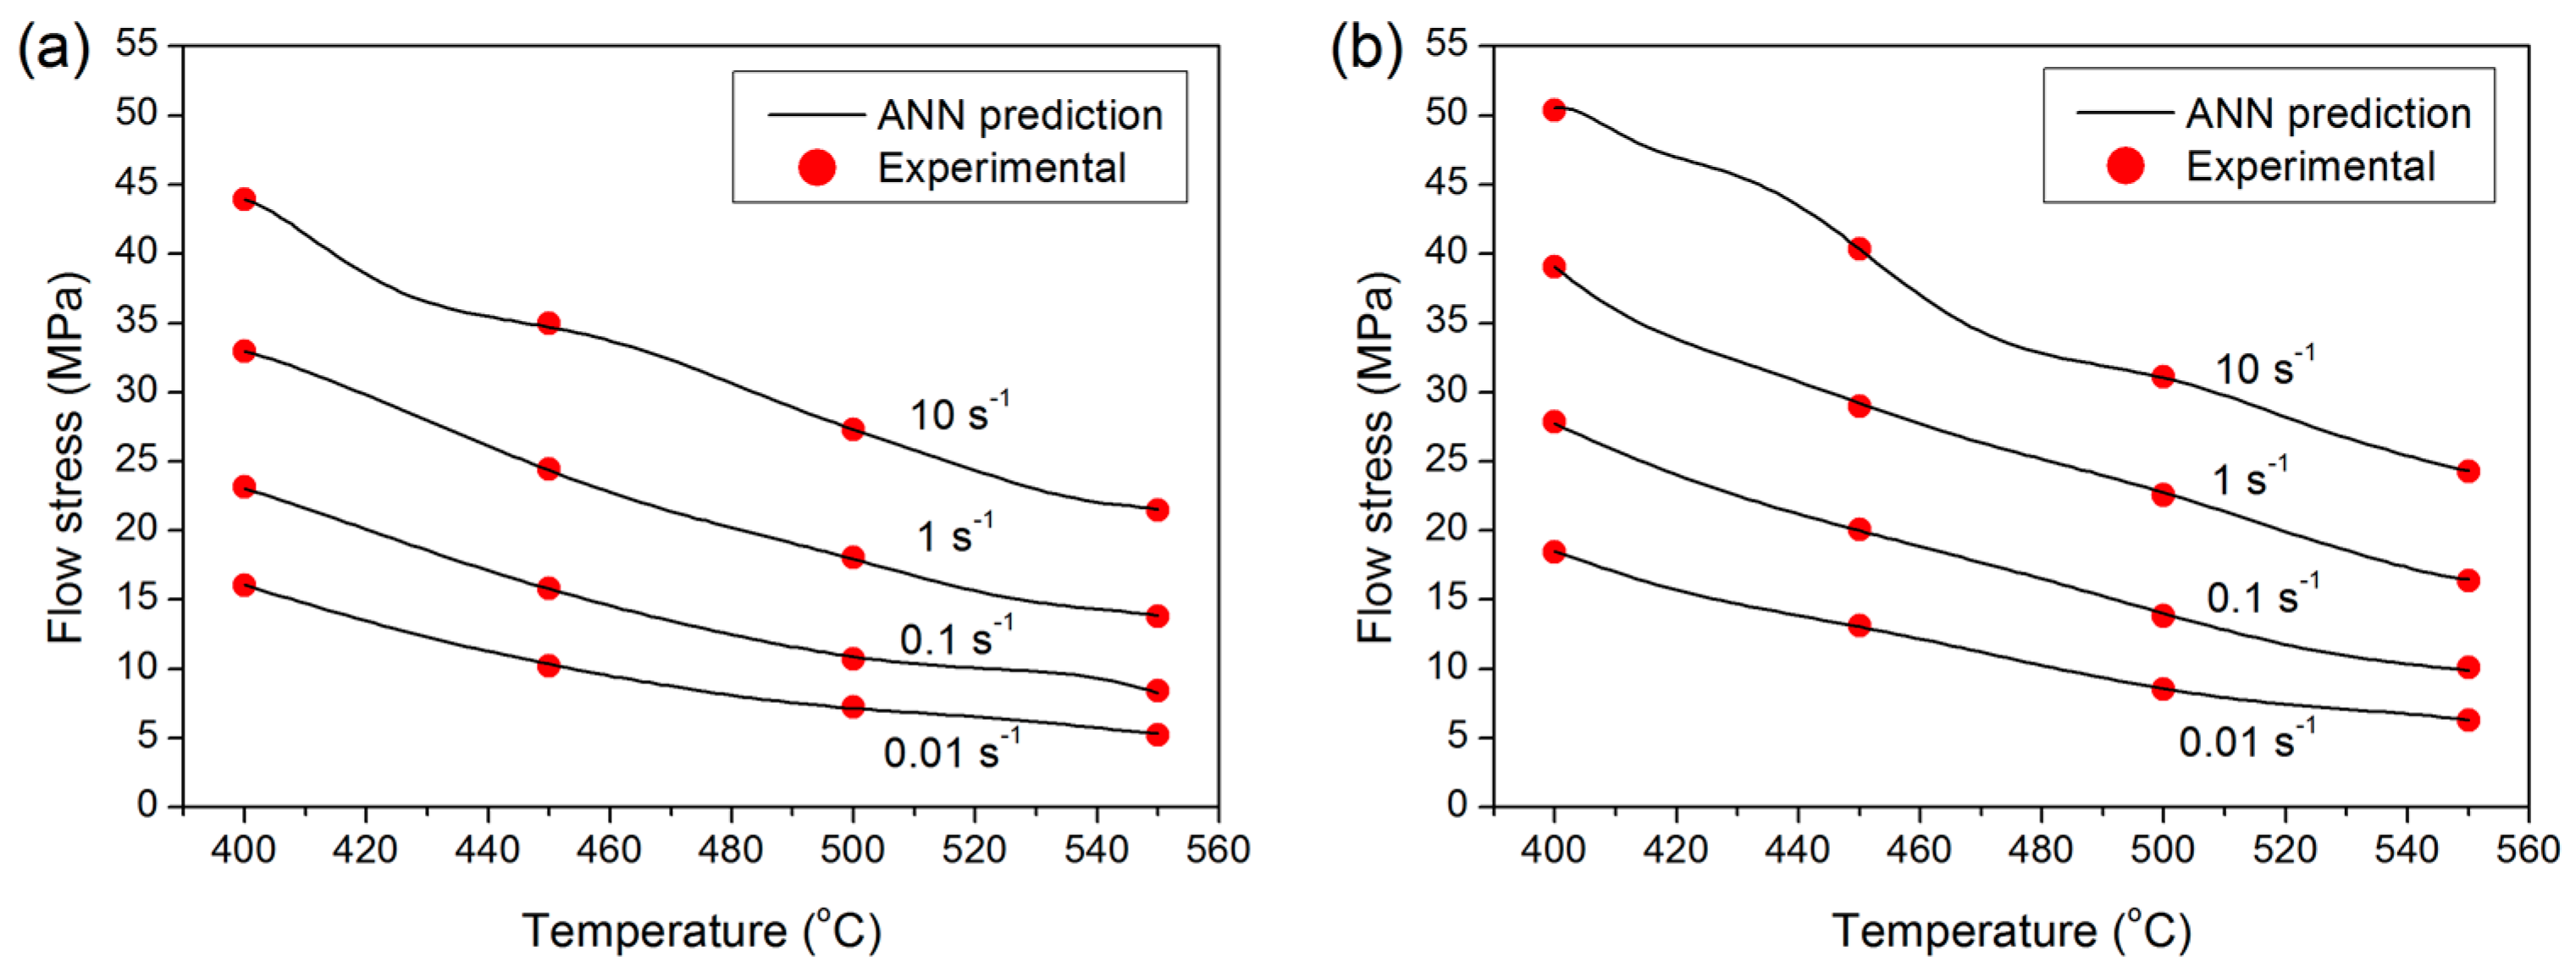
3.2.2. Effect of Temperature
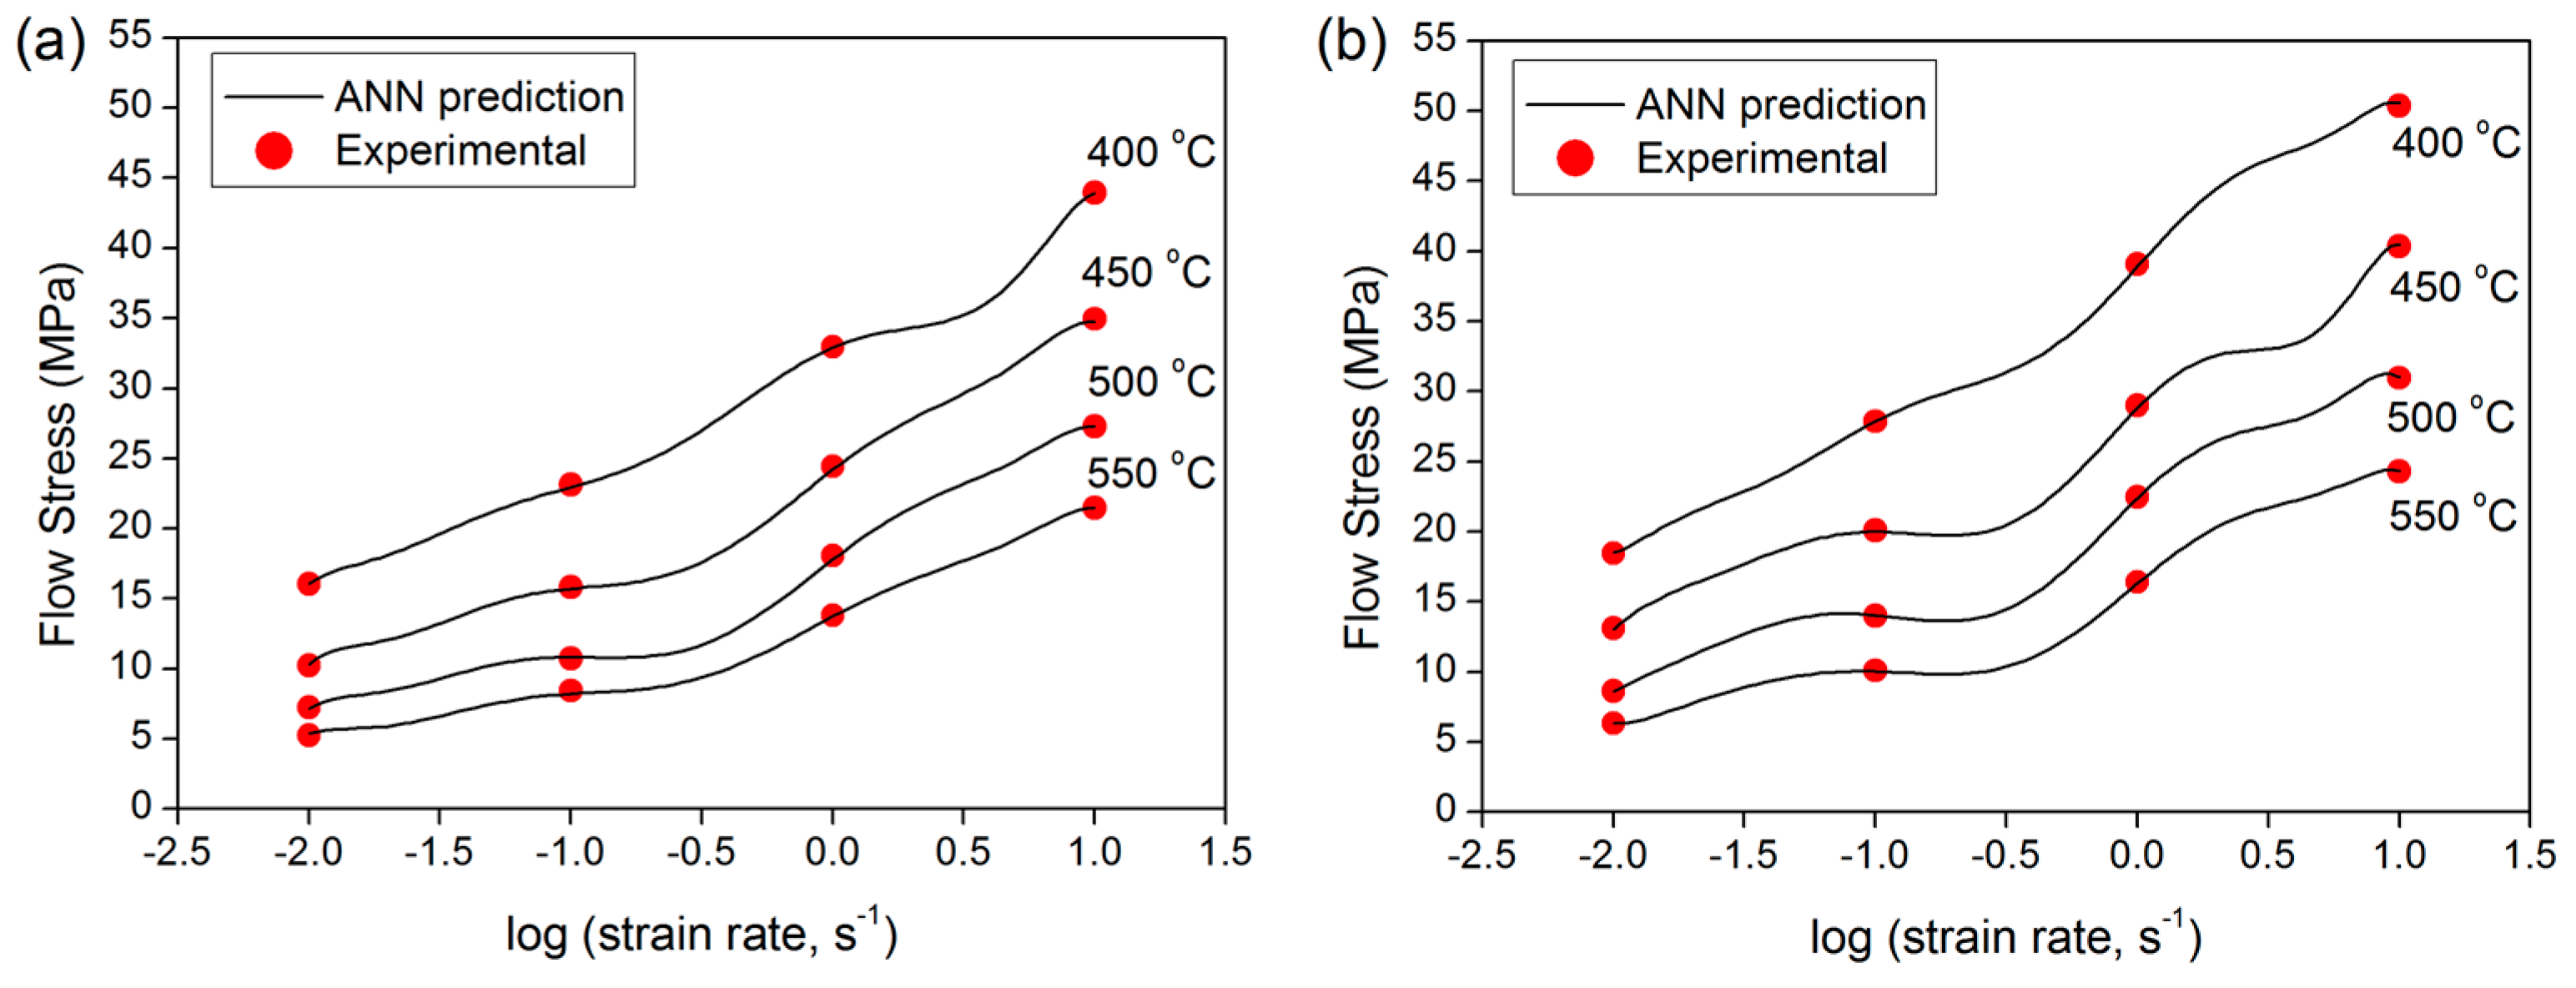
3.2.3. Effect of Strain Rate
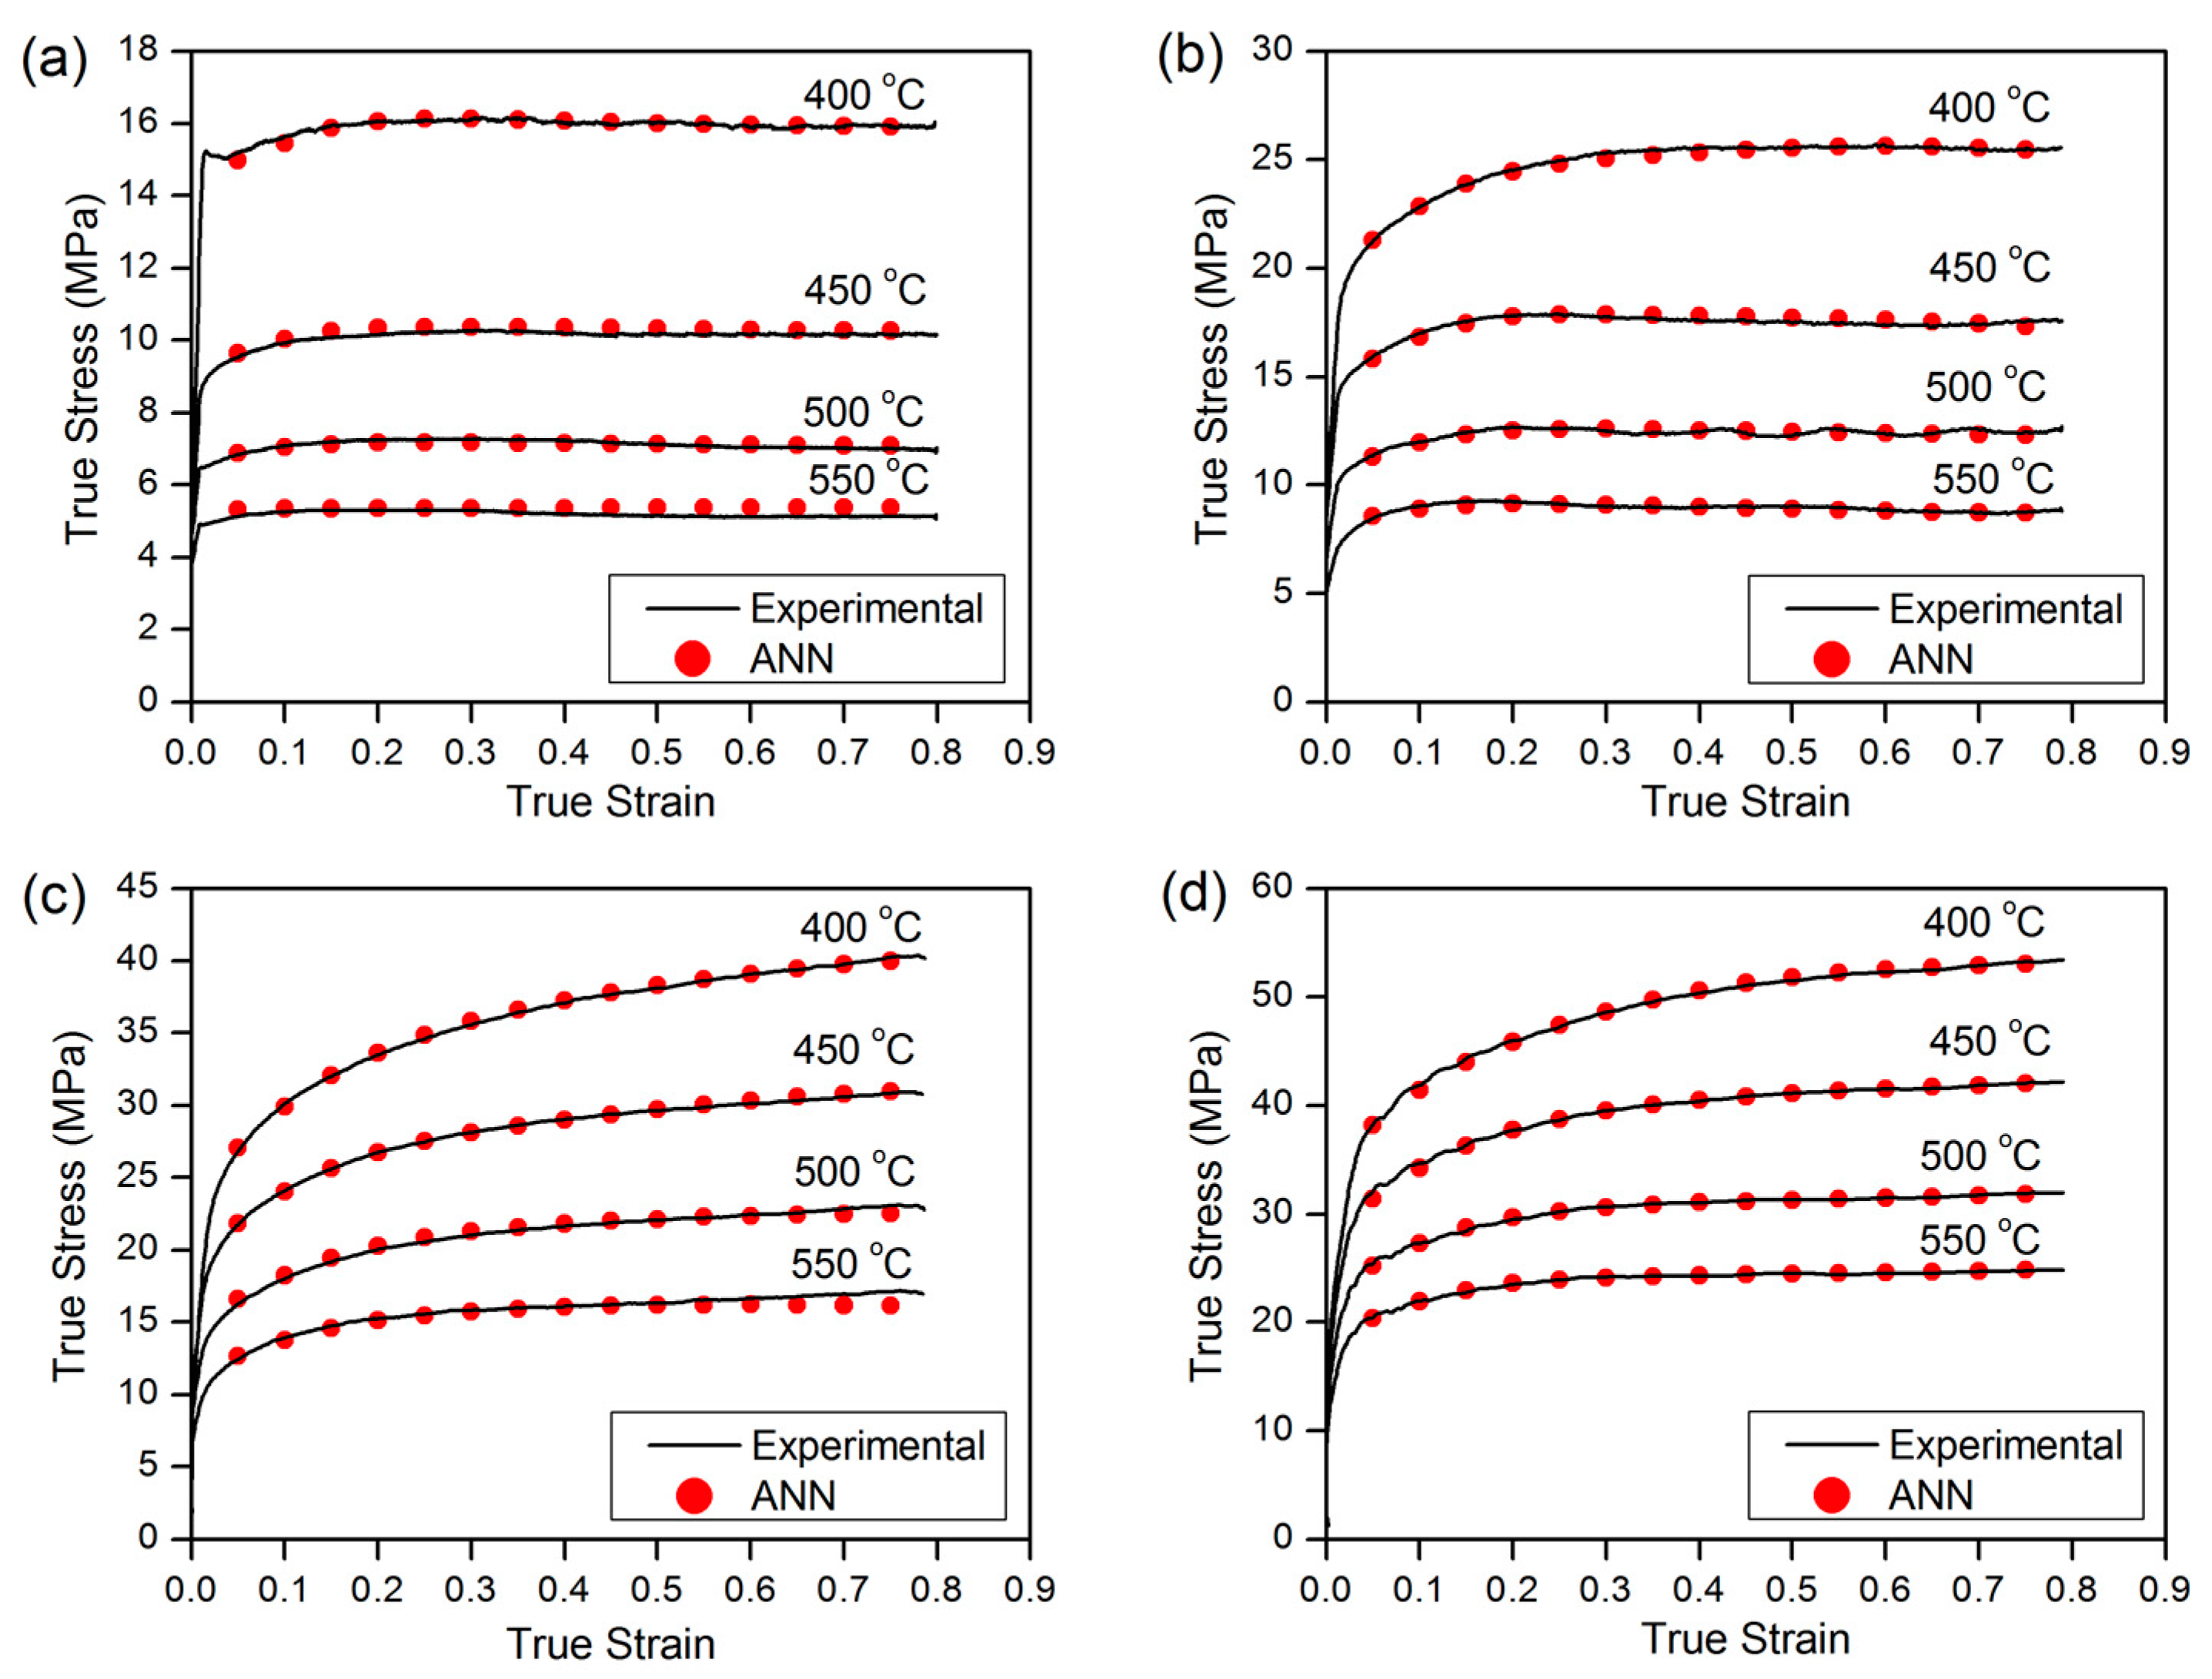
3.2.4. Assessment of the Proposed Model
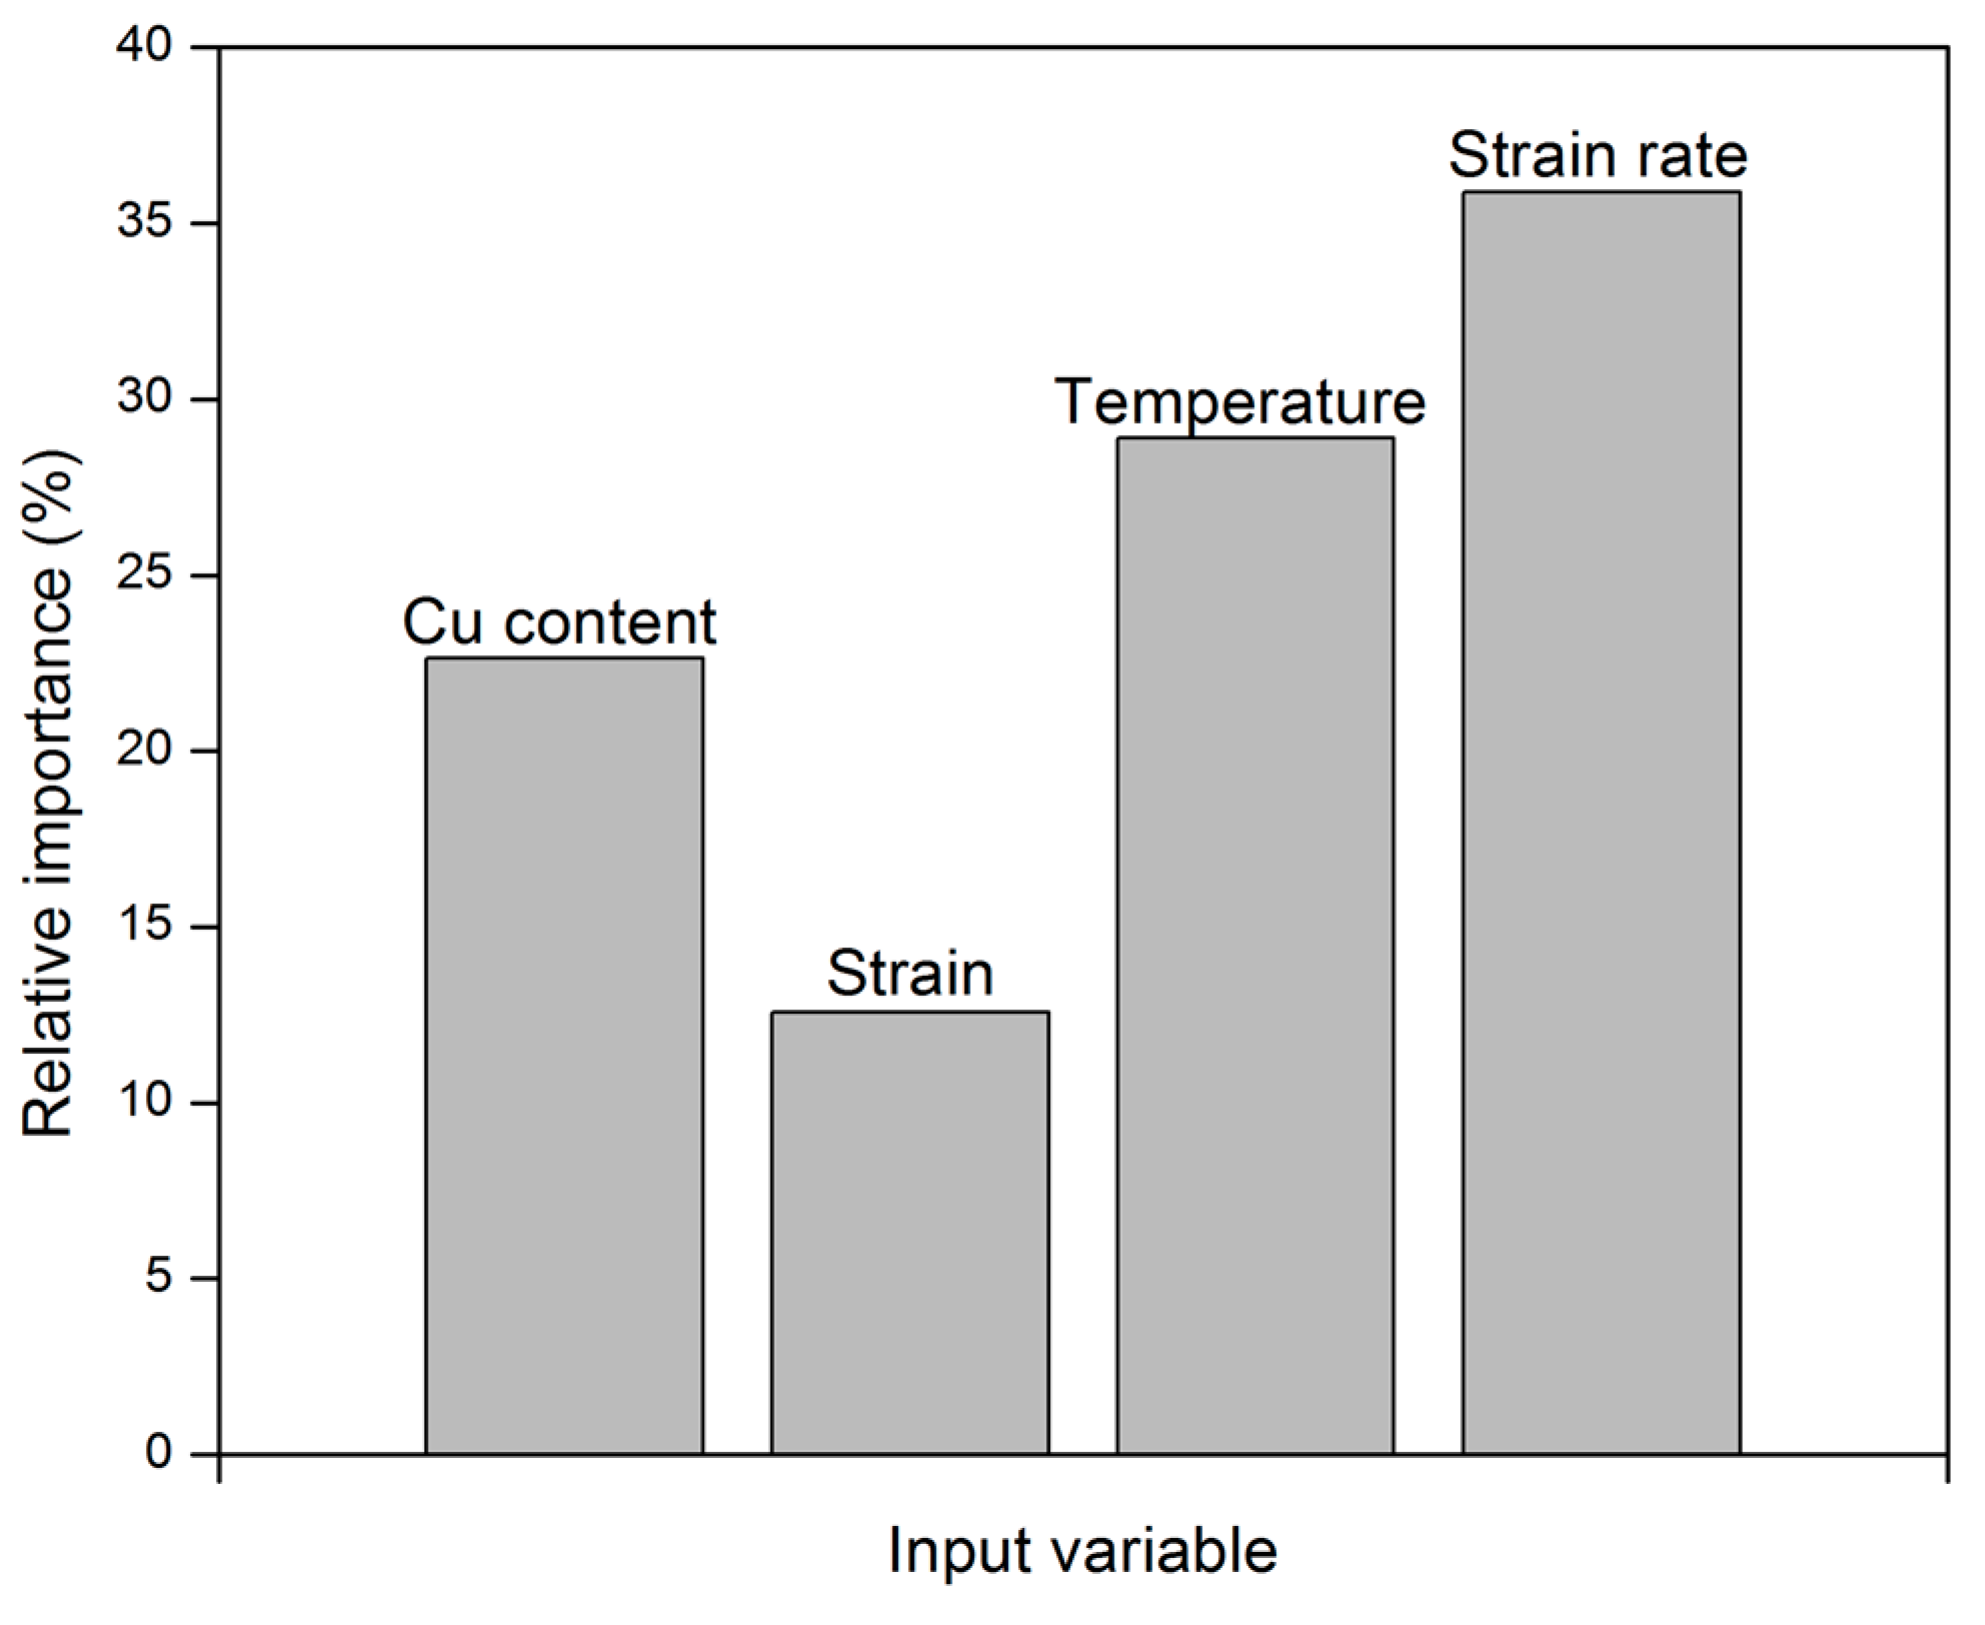
3.2.5. Sensitivity Analysis
4. Conclusions
Acknowledgments
Author Contributions
Conflicts of Interest
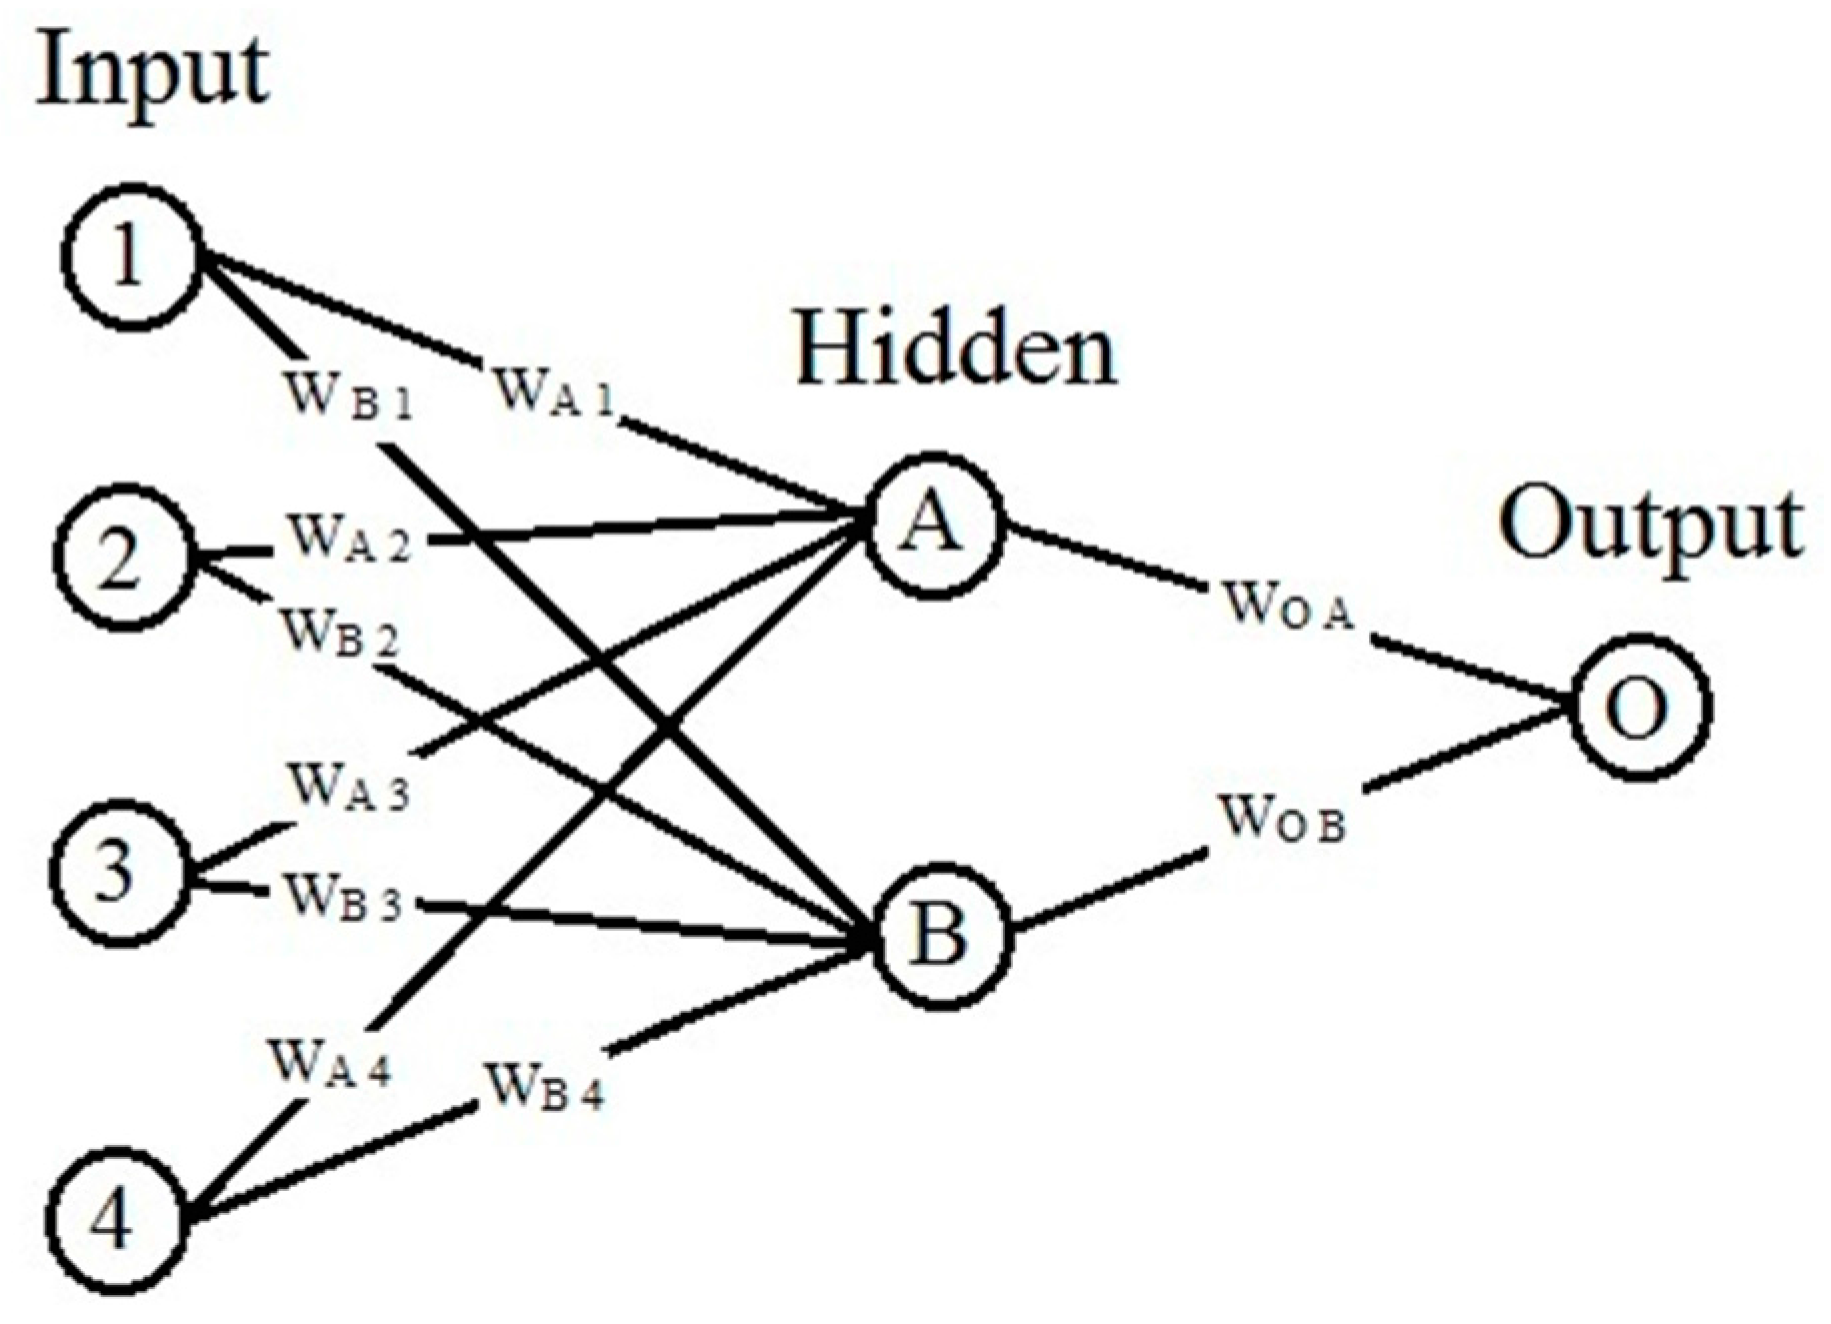
Appendix A. Example Illustrating Garson’s Algorithm

- Matrix containing input-hidden and hidden-output neuron connection weights.

| Neurons | Hidden A | Hidden B |
|---|---|---|
| Input 1 | WA1 = 1.40 | WB1 = 0.82 |
| Input 2 | WA2 = −1.02 | WB2 = 0.62 |
| Input 3 | WA3 = −2.98 | WB3 = 1.04 |
| Input 4 | WA4 = 3.99 | WB4 = −2.26 |
| Output | WOA = −3.17 | WOB = −1.21 |
- 2.
- Contribution of each input neuron to the output via each hidden neuron calculated as the product of the input-hidden connection and the hidden-output connection: e.g., CA1 = WA1 × WOA = 1.4 × −3.17 = −4.44.
| Neurons | Hidden A | Hidden B |
|---|---|---|
| Input 1 | CA1 = −4.44 | CB1 = −0.99 |
| Input 2 | CA2 = 3.23 | CB2 = −0.75 |
| Input 3 | CA3 = 9.45 | CB3 = −1.26 |
| Input 4 | CA4 = 12.65 | CB4 = 2.73 |
- 3.
- Relative contribution of each input neuron to the outgoing signal of each hidden neuron: e.g., rA1 = |CA1|/(|CA1| + |CA2| + |CA3| + |CA4|) = 4.44/(4.44 + 3.23 + 9.45 + 12.65) = 0.15 and the sum of input neuron contributions: e.g., S1 = rA1 + rB1 = 0.15 + 0.17 = 0.14.
| Neurons | Hidden A | Hidden B | Sum |
|---|---|---|---|
| Input 1 | rA1 = 0.15 | rB1 = 0.17 | S1 = 0.32 |
| Input 2 | rA2 = 0.11 | rB2 = 0.13 | S2 = 0.24 |
| Input 3 | rA3 = 0.32 | rB3 = 0.22 | S3 = 0.54 |
| Input 4 | rA4 = 0.42 | rB4 = 0.48 | S4 = 0.9 |
- 4.
- Relative importance (RI) of each input variable: e.g., RI1 = S1/(S1 + S2 + S3 + S4) × 100 = 0.32/(0.32 + 0.24 + 0.54 + 0.9) × 100 = 16%.
| Neurons | Relative Importance (%) |
|---|---|
| Input 1 | 16 |
| Input 2 | 12 |
| Input 3 | 27 |
| Input 4 | 45 |
References
- Davis, J.R. Selection and application of aluminum alloys. In Aluminum and Aluminum Alloys; ASM International: Materials Park, OH, USA, 1993; pp. 59–87. [Google Scholar]
- Kaufman, J.G. Application for aluminum alloys and tempers. In Introduction to Aluminum Alloys and Tempers; ASM International: Materials Park, OH, USA, 2000; pp. 87–118. [Google Scholar]
- Shakiba, M.; Parson, N.; Chen, X.-G. Effect of homogenization treatment and silicon content on the microstructure and hot workability of dilute Al–Fe–Si alloys. Mater. Sci. Eng. A 2014, 619, 180–189. [Google Scholar] [CrossRef]
- Shakiba, M.; Parson, N.; Chen, X.-G. Effect of iron and silicon content on the high-temperature flow behavior of dilute Al-Fe-Si alloys. J. Mater. Eng. Perform. 2015, 24, 404–415. [Google Scholar] [CrossRef]
- Zhao, Q.; Slagsvold, M.; Holmedal, B. Comparison of the influence of Si and Fe in 99.999% purity aluminum and in commercial-purity aluminum. Scr. Mater. 2012, 67, 217–220. [Google Scholar] [CrossRef]
- Spittel, M.; Spittel, T. Flow stress of light metal alloys. In Part 2: Non-ferrous Alloys—Light Metals; Warlimont, H., Ed.; Springer Berlin Heidelberg: Berlin, Germany, 2011; pp. 19–53. [Google Scholar]
- Mcqueen, H.J.; Spigarelli, S.; Kassner, M.E.; Evagelista, E. Hot Deformation and Processing of Aluminum Alloys; CRC Press: Boca Raton, FL, USA, 2011. [Google Scholar]
- Mcqueen, H.J.; Ryan, N.D. Constitutive analysis in hot working. Mater. Sci. Eng. A 2002, 322, 43–63. [Google Scholar] [CrossRef]
- Mcqueen, H.J.; Evangelista, E.; Jin, N.; Kassner, M.E. Energy dissipation efficiency in aluminum dependent on monotonic flow curves and dynamic recovery. Metall. Mater. Trans. A 1995, 26, 1757–1766. [Google Scholar] [CrossRef]
- Luo, J.; Li, M.; Li, X.; Shi, Y. Constitutive model for high temperature deformation of titanium alloys using internal state variables. Mech. Mater. 2010, 42, 157–165. [Google Scholar] [CrossRef]
- Zerilli, F.J.; Armstrong, R.W. Dislocation-mechanics-based constitutive relations for material dynamics calculations. J. Appl. Phys. 1987, 61, 1816–1825. [Google Scholar] [CrossRef]
- Voyiadjis, G.Z.; Almasri, A.H. A physically based constitutive model for fcc metals with applications to dynamic hardness. Mech. Mater. 2008, 40, 549–563. [Google Scholar] [CrossRef]
- Lin, Y.C.; Li, Q.-F.; Xia, Y.-C.; Li, L.-T. A phenomenological constitutive model for high temperature flow stress prediction of Al–Cu–Mg alloy. Mater. Sci. Eng. A 2012, 534, 654–662. [Google Scholar] [CrossRef]
- Davenport, S.B.; Silk, N.J.; Sparks, C.N.; Sellars, C.M. Development of constitutive equations for modeling of hot rolling. Mater. Sci. Technol. 2000, 16, 539–546. [Google Scholar] [CrossRef]
- Johnson, G.R.; Cook, W.H. A constitutive model and data for metals subjected to large strains, high strain rates and high temperatures. In Proceedings of the 7th International Symposium on Ballistics, Hague, The Netherlands, 19–21 April 1983; pp. 541–543.
- Lin, Y.C.; Chen, X.-M. A critical review of experimental results and constitutive descriptions for metals and alloys in hot working. Mater. Des. 2011, 32, 1733–1759. [Google Scholar] [CrossRef]
- Sumantra, M.; Sivaprasad, P.V.; Venugopal, S.; Murthy, K.P.N. Constitutive flow behaviour of austenitic stainless steels under hot deformation: Artificial neural network modeling to understand, evaluate and predict. Model. Simul. Mater. Sci. Eng. 2006, 14, 1053–1070. [Google Scholar]
- Mandal, S.; Sivaprasad, P.V.; Venugopal, S.; Murthy, K.P.N. Artificial neural network modeling to evaluate and predict the deformation behavior of stainless steel type AISI 304L during hot torsion. Appl. Soft Comput. 2009, 9, 237–244. [Google Scholar] [CrossRef]
- Haghdadi, N.; Zarei-Hanzaki, A.; Khalesian, A.R.; Abedi, H.R. Artificial neural network modeling to predict the hot deformation behavior of an A356 aluminum alloy. Mater. Des. 2013, 49, 386–391. [Google Scholar] [CrossRef]
- Toros, S.; Ozturk, F. Flow curve prediction of Al–Mg alloys under warm forming conditions at various strain rates by ANN. Appl. Soft Comput. 2011, 11, 1891–1898. [Google Scholar] [CrossRef]
- Qin, Y.J.; Pan, Q.L.; He, Y.B.; Li, W.B.; Liu, X.Y.; Fan, X. Artificial Neural Network Modeling to Evaluate and Predict the Deformation Behavior of ZK60 Magnesium Alloy During Hot Compression. Mater. Manuf. Process. 2010, 25, 539–545. [Google Scholar] [CrossRef]
- Sun, Y.; Zeng, W.; Ma, X.; Xu, B.; Liang, X.; Zhang, J. A hybrid approach for processing parameters optimization of Ti-22Al-25Nb alloy during hot deformation using artificial neural network and genetic algorithm. Intermetallics 2011, 19, 1014–1019. [Google Scholar] [CrossRef]
- Sun, Y.; Zeng, W.D.; Zhao, Y.Q.; Qi, Y.L.; Ma, X.; Han, Y.F. Development of constitutive relationship model of Ti600 alloy using artificial neural network. Comput. Mater. Sci. 2010, 48, 686–691. [Google Scholar] [CrossRef]
- Jalham, I.S. Modeling capability of the artificial neural network (ANN) to predict the effect of the hot deformation parameters on the strength of Al-base metal matrix composites. Compos. Sci. Technol. 2003, 63, 63–67. [Google Scholar] [CrossRef]
- Mcqueen, H.J.; Blum, W. Dynamic recovery: Sufficient mechanism in the hot deformation of Al. Mater. Sci. Eng. A 2000, 290, 95–107. [Google Scholar] [CrossRef]
- Mcqueen, H.J. Metal forming: Industrial, mechanical computational and microstructural. J. Mater. Process. Technol. 1993, 37, 3–36. [Google Scholar] [CrossRef]
- Rezaei Ashtiani, H.R.; Parsa, M.H.; Bisadi, H. Constitutive equations for elevated temperature flow behavior of commercial purity aluminum. Mater. Sci. Eng. A 2012, 545, 61–67. [Google Scholar] [CrossRef]
- Banerjee, S.; Robi, P.S.; Srinivasan, A.; Praveen Kumar, L. High temperature deformation behavior of Al–Cu–Mg alloys micro-alloyed with Sn. Mater. Sci. Eng. A 2010, 527, 2498–2503. [Google Scholar] [CrossRef]
- Shakiba, M.; Parson, N.; Chen, X.-G. Hot deformation behavior and rate-controlling mechanism in dilute Al–Fe–Si alloys with minor additions of Mn and Cu. Mater. Sci. Eng. A 2015, 636, 572–581. [Google Scholar] [CrossRef]
- Le Gall, R.; Jonas, J.J. Solute drag effects during the dynamic recrystallization of nickel. Acta Mater. 1999, 47, 4365–4374. [Google Scholar] [CrossRef]
- Ryen, Ø.; Holmedal, B.; Nijs, O.; Nes, E.; Sjölander, E.; Ekström, H.-E. Strengthening mechanisms in solid solution aluminum alloys. Metall. Mater. Trans. A 2006, 37, 1999–2006. [Google Scholar] [CrossRef]
- Lu, Z.; Pan, Q.; Liu, X.; Qin, Y.; He, Y.; Cao, S. Artificial neural network prediction to the hot compressive deformation behavior of Al–Cu–Mg–Ag heat-resistant aluminum alloy. Mech. Res. Commun. 2011, 38, 192–197. [Google Scholar] [CrossRef]
- Humphreys, F.J.; Hatherly, M. Recrystallization and Related Annealing Phenomena, 2nd ed.; Elsevier Ltd.: Oxford, UK, 2004. [Google Scholar]
- Priddy, K.L.; Keller, P.E. Artificial Neural Networks: An Introduction; SPIE Press: Bellingham, WA, USA; Washington, DC, USA, 2005; pp. 101–107. [Google Scholar]
- Hastie, T.; Tibshirani, R.; Friedman, J. The Elements of Statistical Learning: Data Mining, Inference, and Prediction, 2nd ed.; Springer: Stanford, CA, USA, 2008; pp. 241–257. [Google Scholar]
- Kohavi, R. A study of cross-validation and bootstrap for accuracy estimation and model selection. In Proceedings of the 14th International Joint Conference on Artificial Intelligence, Montreal, QC, Canada, 20–25 August 1995; Volume 2, pp. 1137–1143.
- Wong, T. Performance evaluation of classification algorithms by k-fold and leave-one-out cross validation. Pattern Recognit. 2015, 48, 2839–2846. [Google Scholar] [CrossRef]
- Olden, J.D.; Jackson, D.A. Illuminating the “black box”: A randomization approach for understanding variable contributions in artificial neural networks. Ecol. Model. 2002, 154, 135–150. [Google Scholar] [CrossRef]
- Olden, J.D.; Joy, M.K.; Death, R.G. An accurate comparison of methods for quantifying variable importance in artificial neural networks using simulated data. Ecol. Model. 2004, 178, 389–397. [Google Scholar] [CrossRef]
- Garson, G.D. Interpreting neural network connection weights. Arti. Intel. Expert 1991, 6, 46–51. [Google Scholar]


| Alloys | Si | Fe | Cu | Mn | Cr | Ni | Ti | Co | Zr | V |
|---|---|---|---|---|---|---|---|---|---|---|
| Base alloy | 0.10 | 0.12 | 0.002 | 0.001 | 0.001 | 0.007 | 0.016 | 0.0003 | 0.0015 | 0.012 |
| Al-0.12Fe-0.1Si-0.05Cu | 0.10 | 0.12 | 0.051 | 0.001 | 0.001 | 0.007 | 0.016 | 0.0003 | 0.0014 | 0.012 |
| Al-0.12Fe-0.1Si-0.18Cu | 0.11 | 0.13 | 0.181 | 0.001 | 0.001 | 0.007 | 0.015 | 0.0003 | 0.0014 | 0.013 |
| Al-0.12Fe-0.1Si-0.31Cu | 0.11 | 0.13 | 0.31 | 0.00 | 0.001 | 0.007 | 0.015 | 0.0003 | 0.0014 | 0.012 |
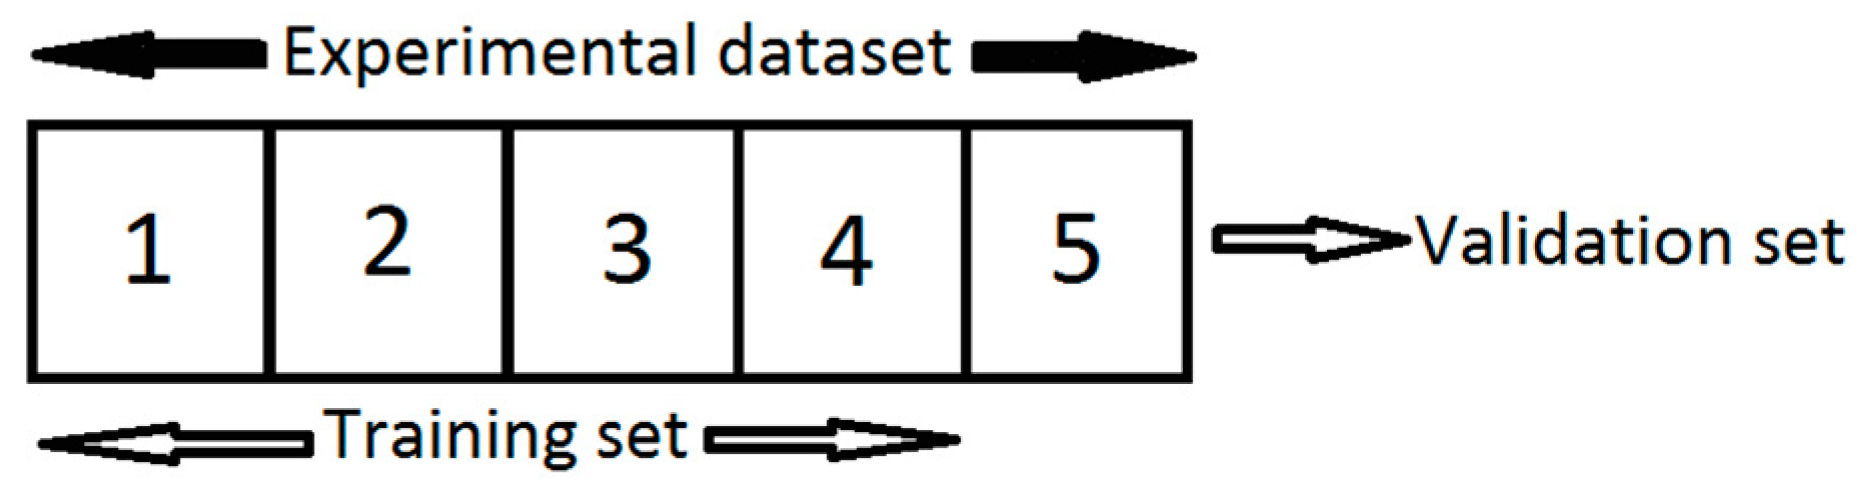
| Validation Fold | 1 | 2 | 3 | 4 | 5 | Average |
|---|---|---|---|---|---|---|
| MSE | 0.063 | 0.046 | 0.052 | 0.072 | 0.059 | 0.058 |
| AARE (%) | 1.36 | 0.94 | 1.07 | 1.63 | 1.28 | 1.26 |
© 2016 by the authors; licensee MDPI, Basel, Switzerland. This article is an open access article distributed under the terms and conditions of the Creative Commons Attribution (CC-BY) license (http://creativecommons.org/licenses/by/4.0/).
Share and Cite
Shakiba, M.; Parson, N.; Chen, X.-G. Modeling the Effects of Cu Content and Deformation Variables on the High-Temperature Flow Behavior of Dilute Al-Fe-Si Alloys Using an Artificial Neural Network. Materials 2016, 9, 536. https://doi.org/10.3390/ma9070536
Shakiba M, Parson N, Chen X-G. Modeling the Effects of Cu Content and Deformation Variables on the High-Temperature Flow Behavior of Dilute Al-Fe-Si Alloys Using an Artificial Neural Network. Materials. 2016; 9(7):536. https://doi.org/10.3390/ma9070536
Chicago/Turabian StyleShakiba, Mohammad, Nick Parson, and X.-Grant Chen. 2016. "Modeling the Effects of Cu Content and Deformation Variables on the High-Temperature Flow Behavior of Dilute Al-Fe-Si Alloys Using an Artificial Neural Network" Materials 9, no. 7: 536. https://doi.org/10.3390/ma9070536
APA StyleShakiba, M., Parson, N., & Chen, X.-G. (2016). Modeling the Effects of Cu Content and Deformation Variables on the High-Temperature Flow Behavior of Dilute Al-Fe-Si Alloys Using an Artificial Neural Network. Materials, 9(7), 536. https://doi.org/10.3390/ma9070536