
In Situ Elevated Temperature Testing of Fly Ash Based Geopolymer Composites

Abstract
:1. Introduction
- Thermal incompatibility between matrix and aggregates
- Pore pressure effects
- Phase transformations
2. Experimental Details
2.1. Materials
2.2. Geopolymer Synthesis
2.3. Mechanical Testing
2.4. Dilatometry
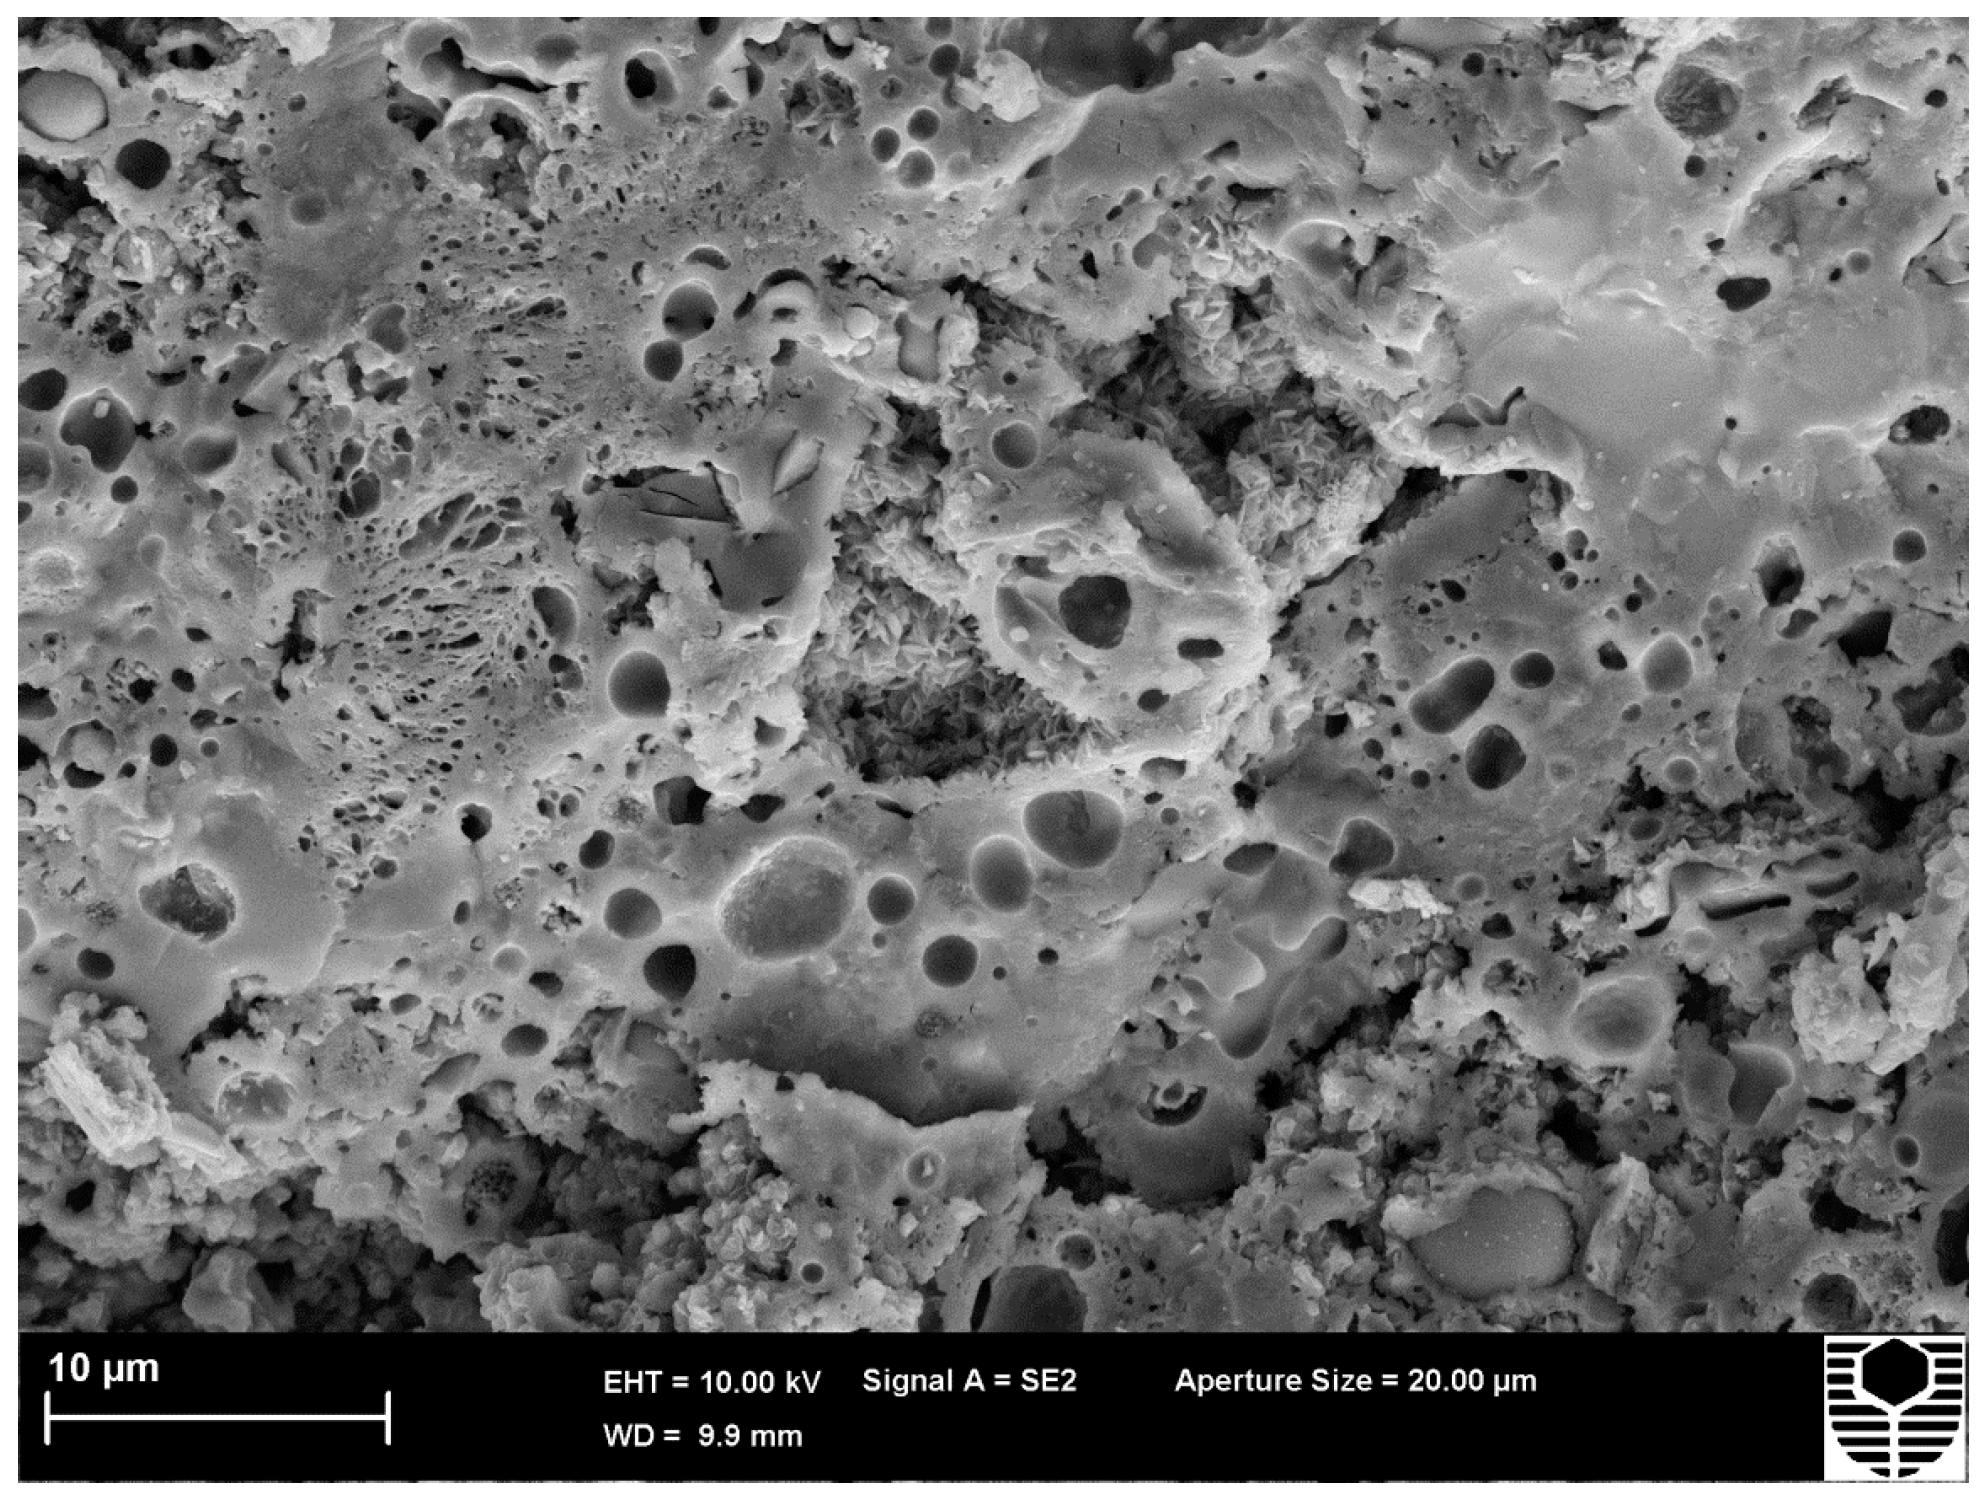
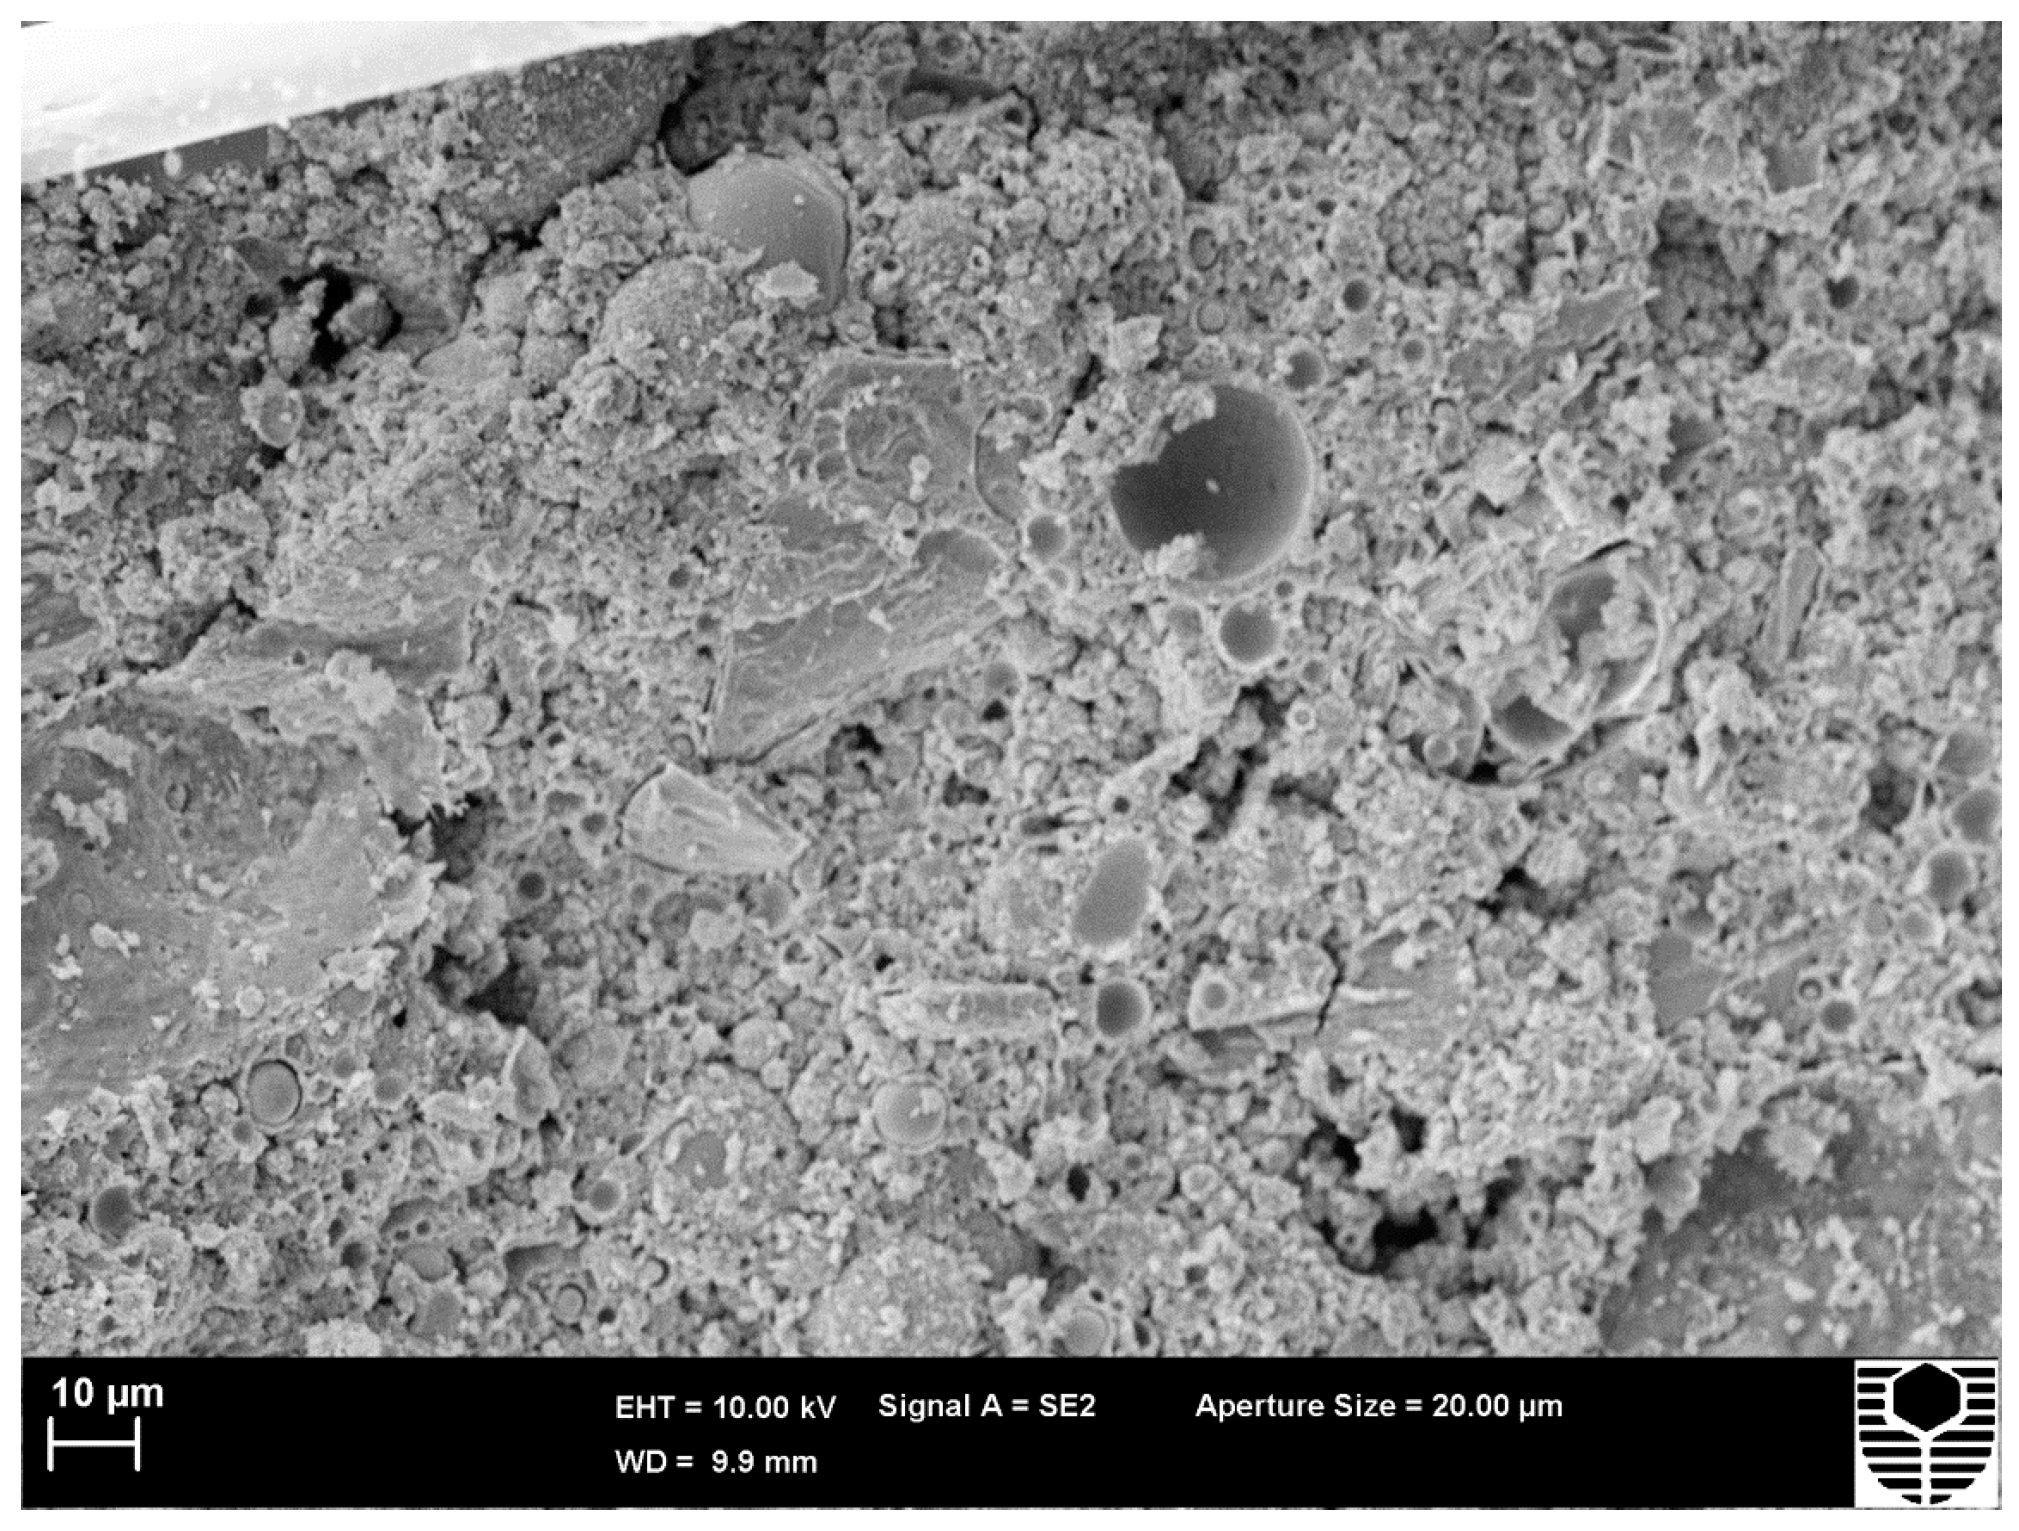
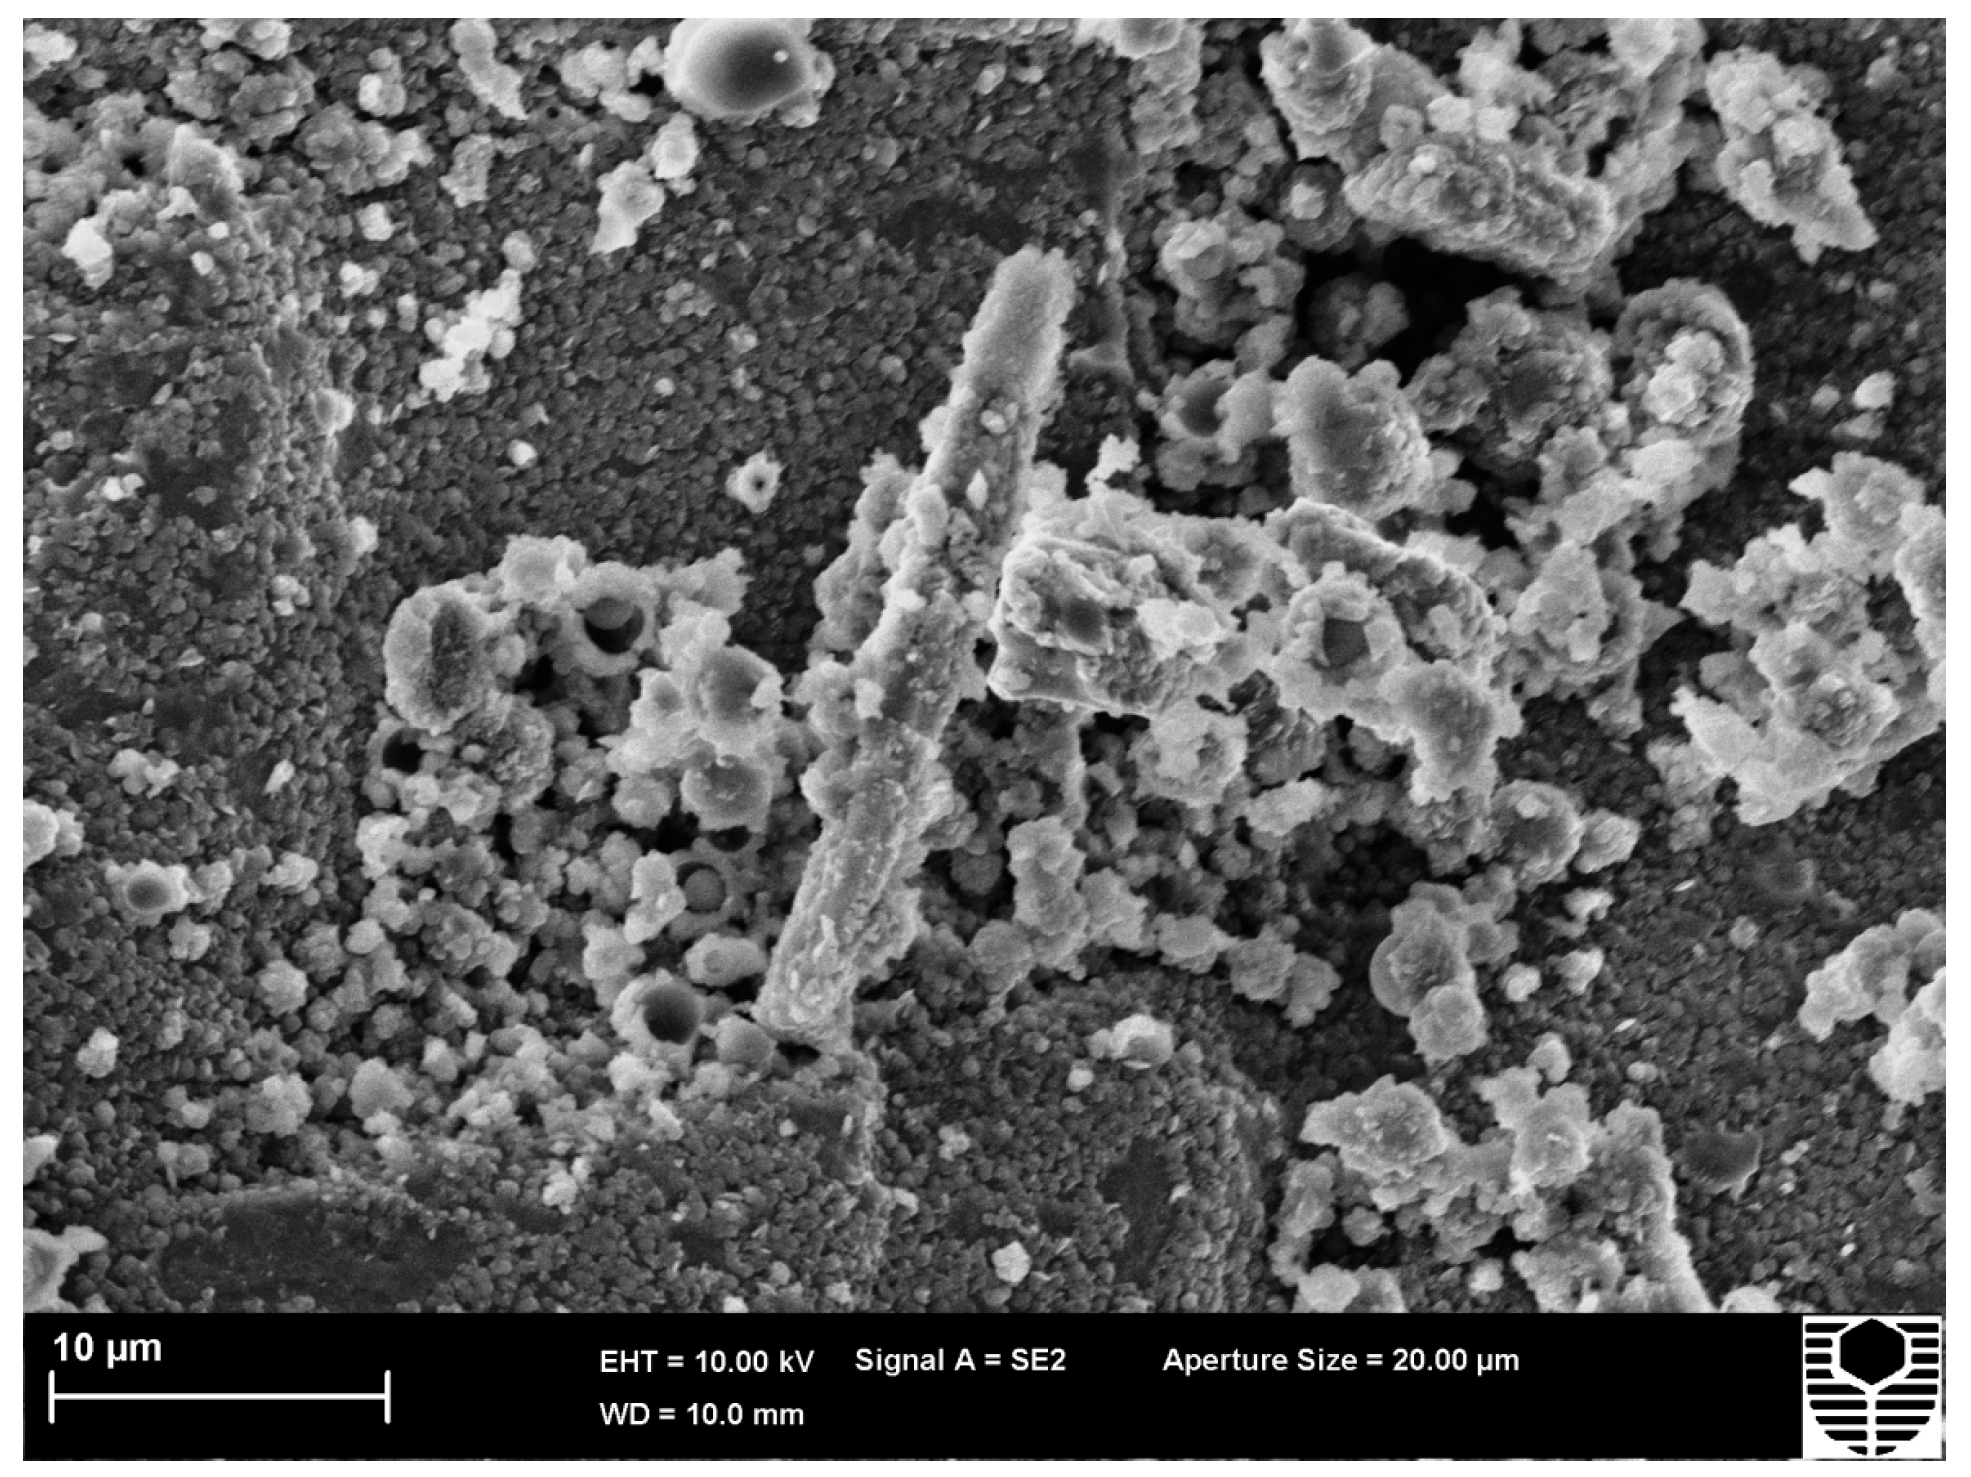
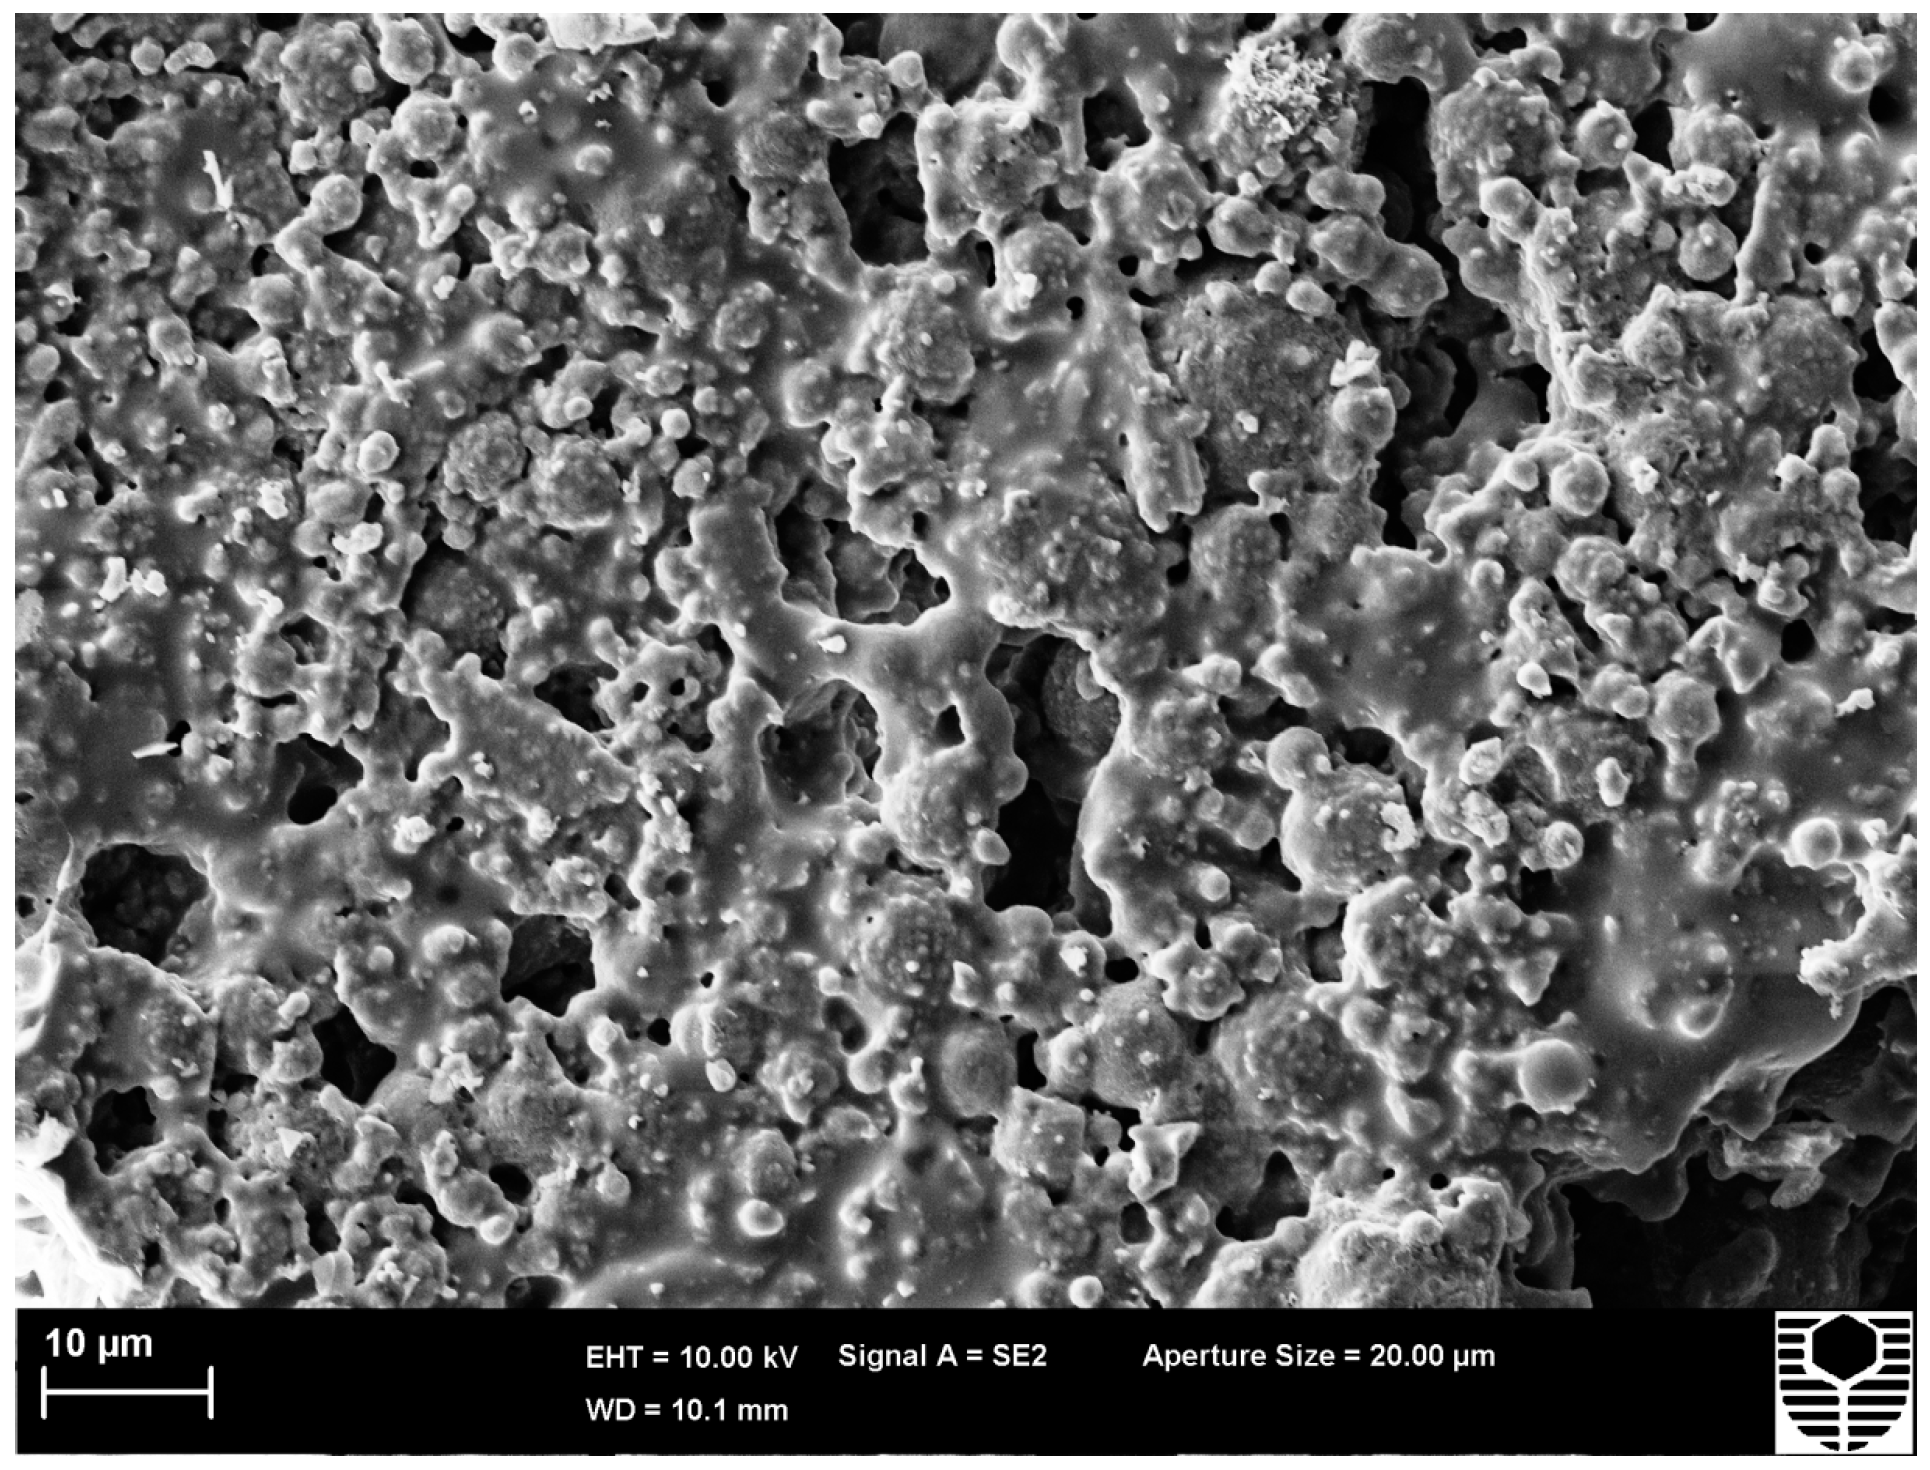
2.5. SEM
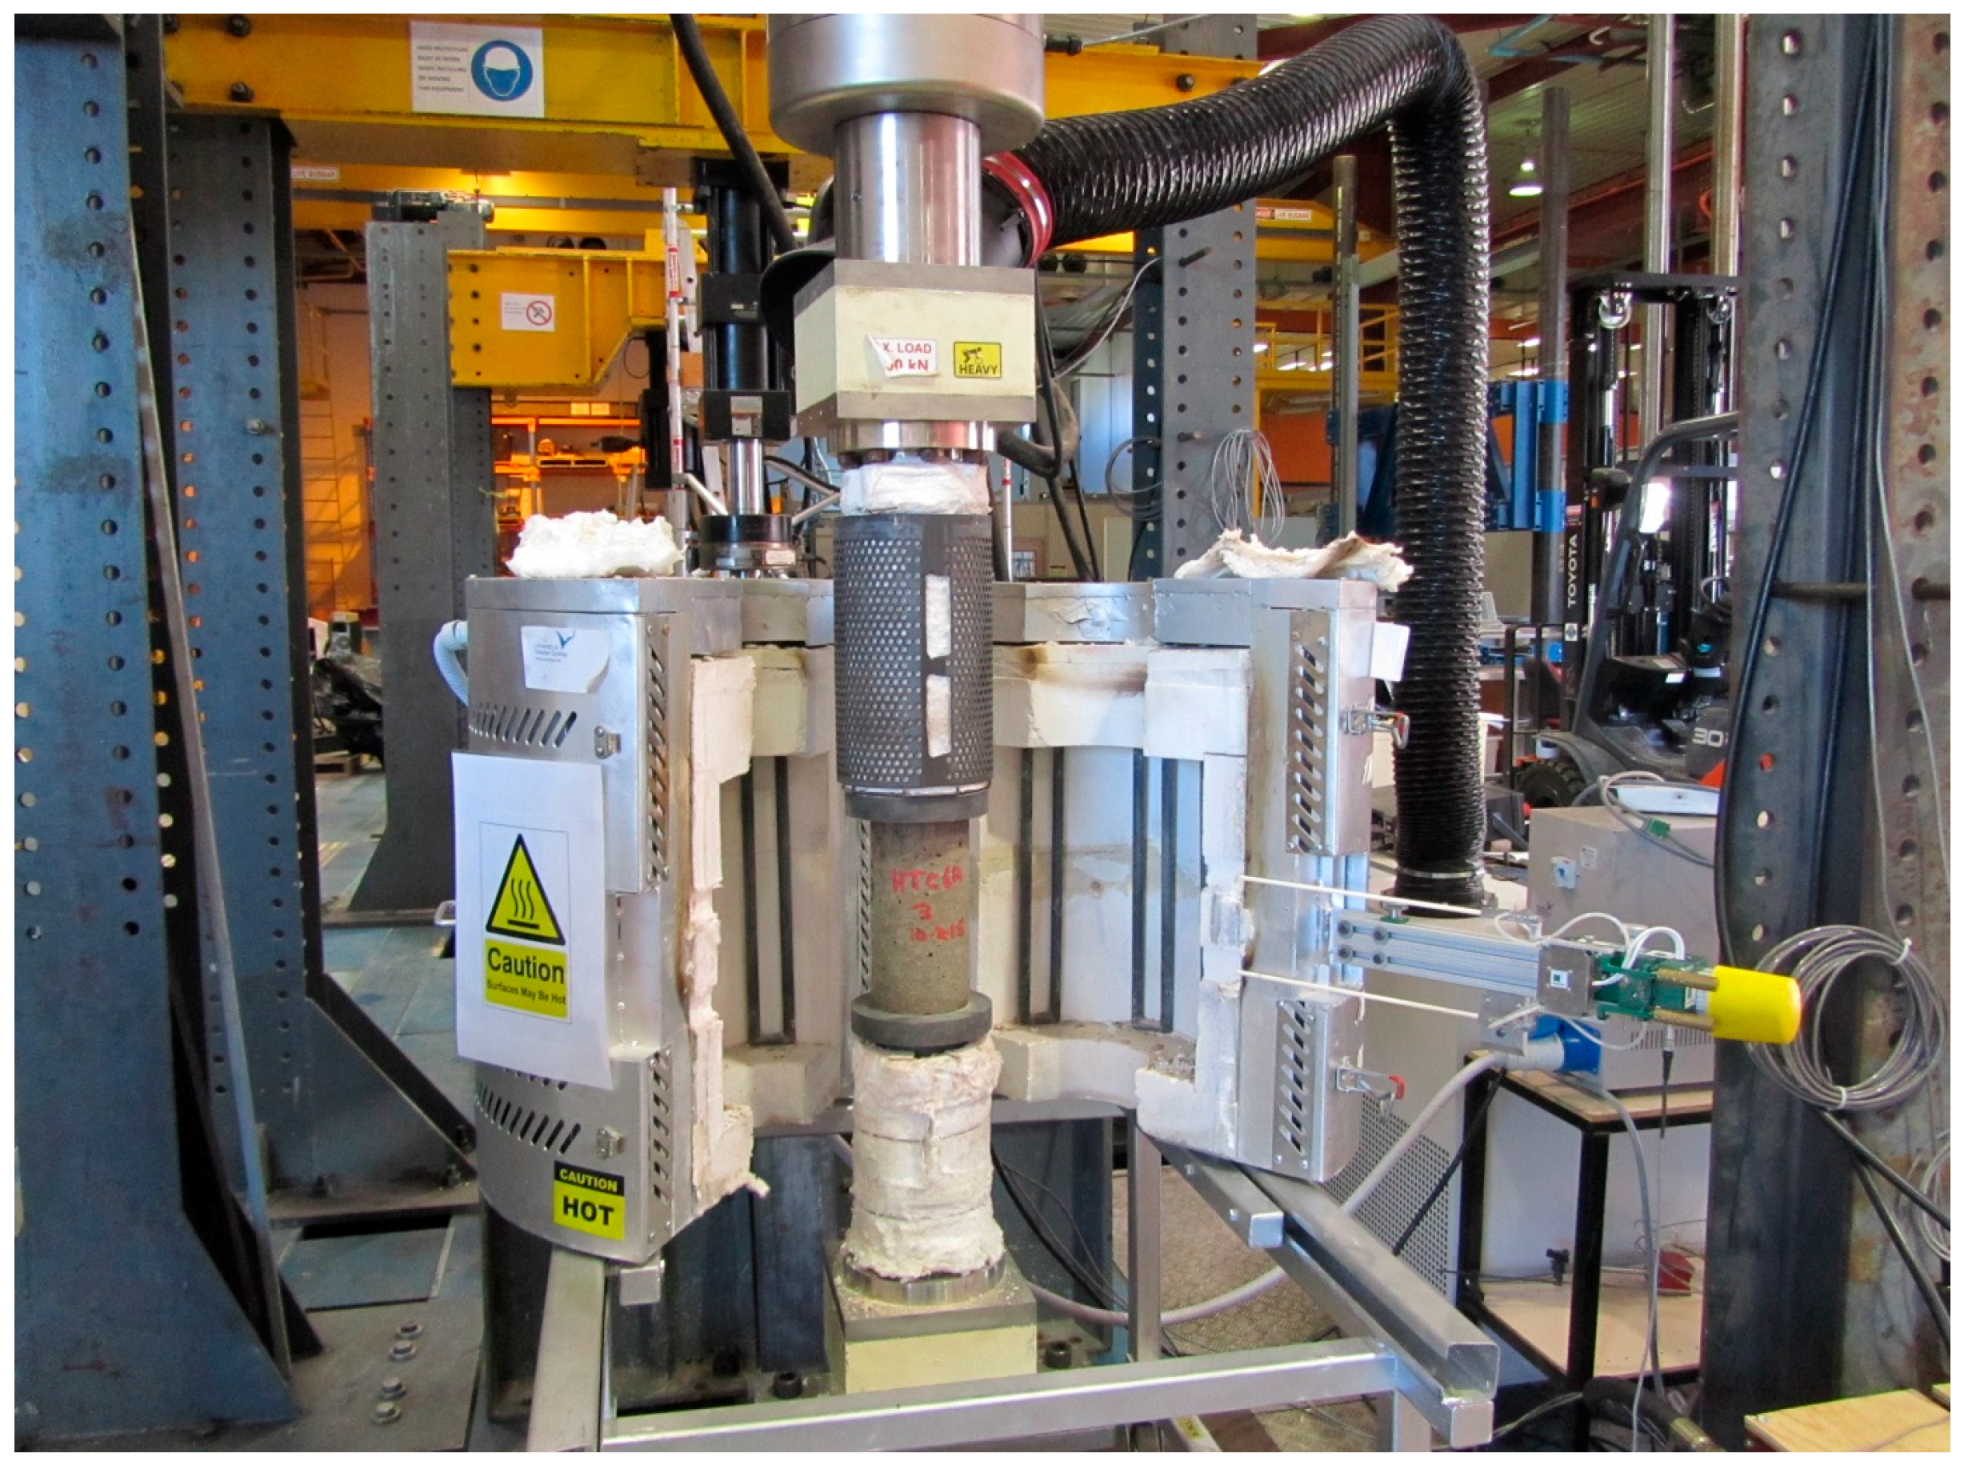
2.6. Fire Testing
3. Results and Discussion
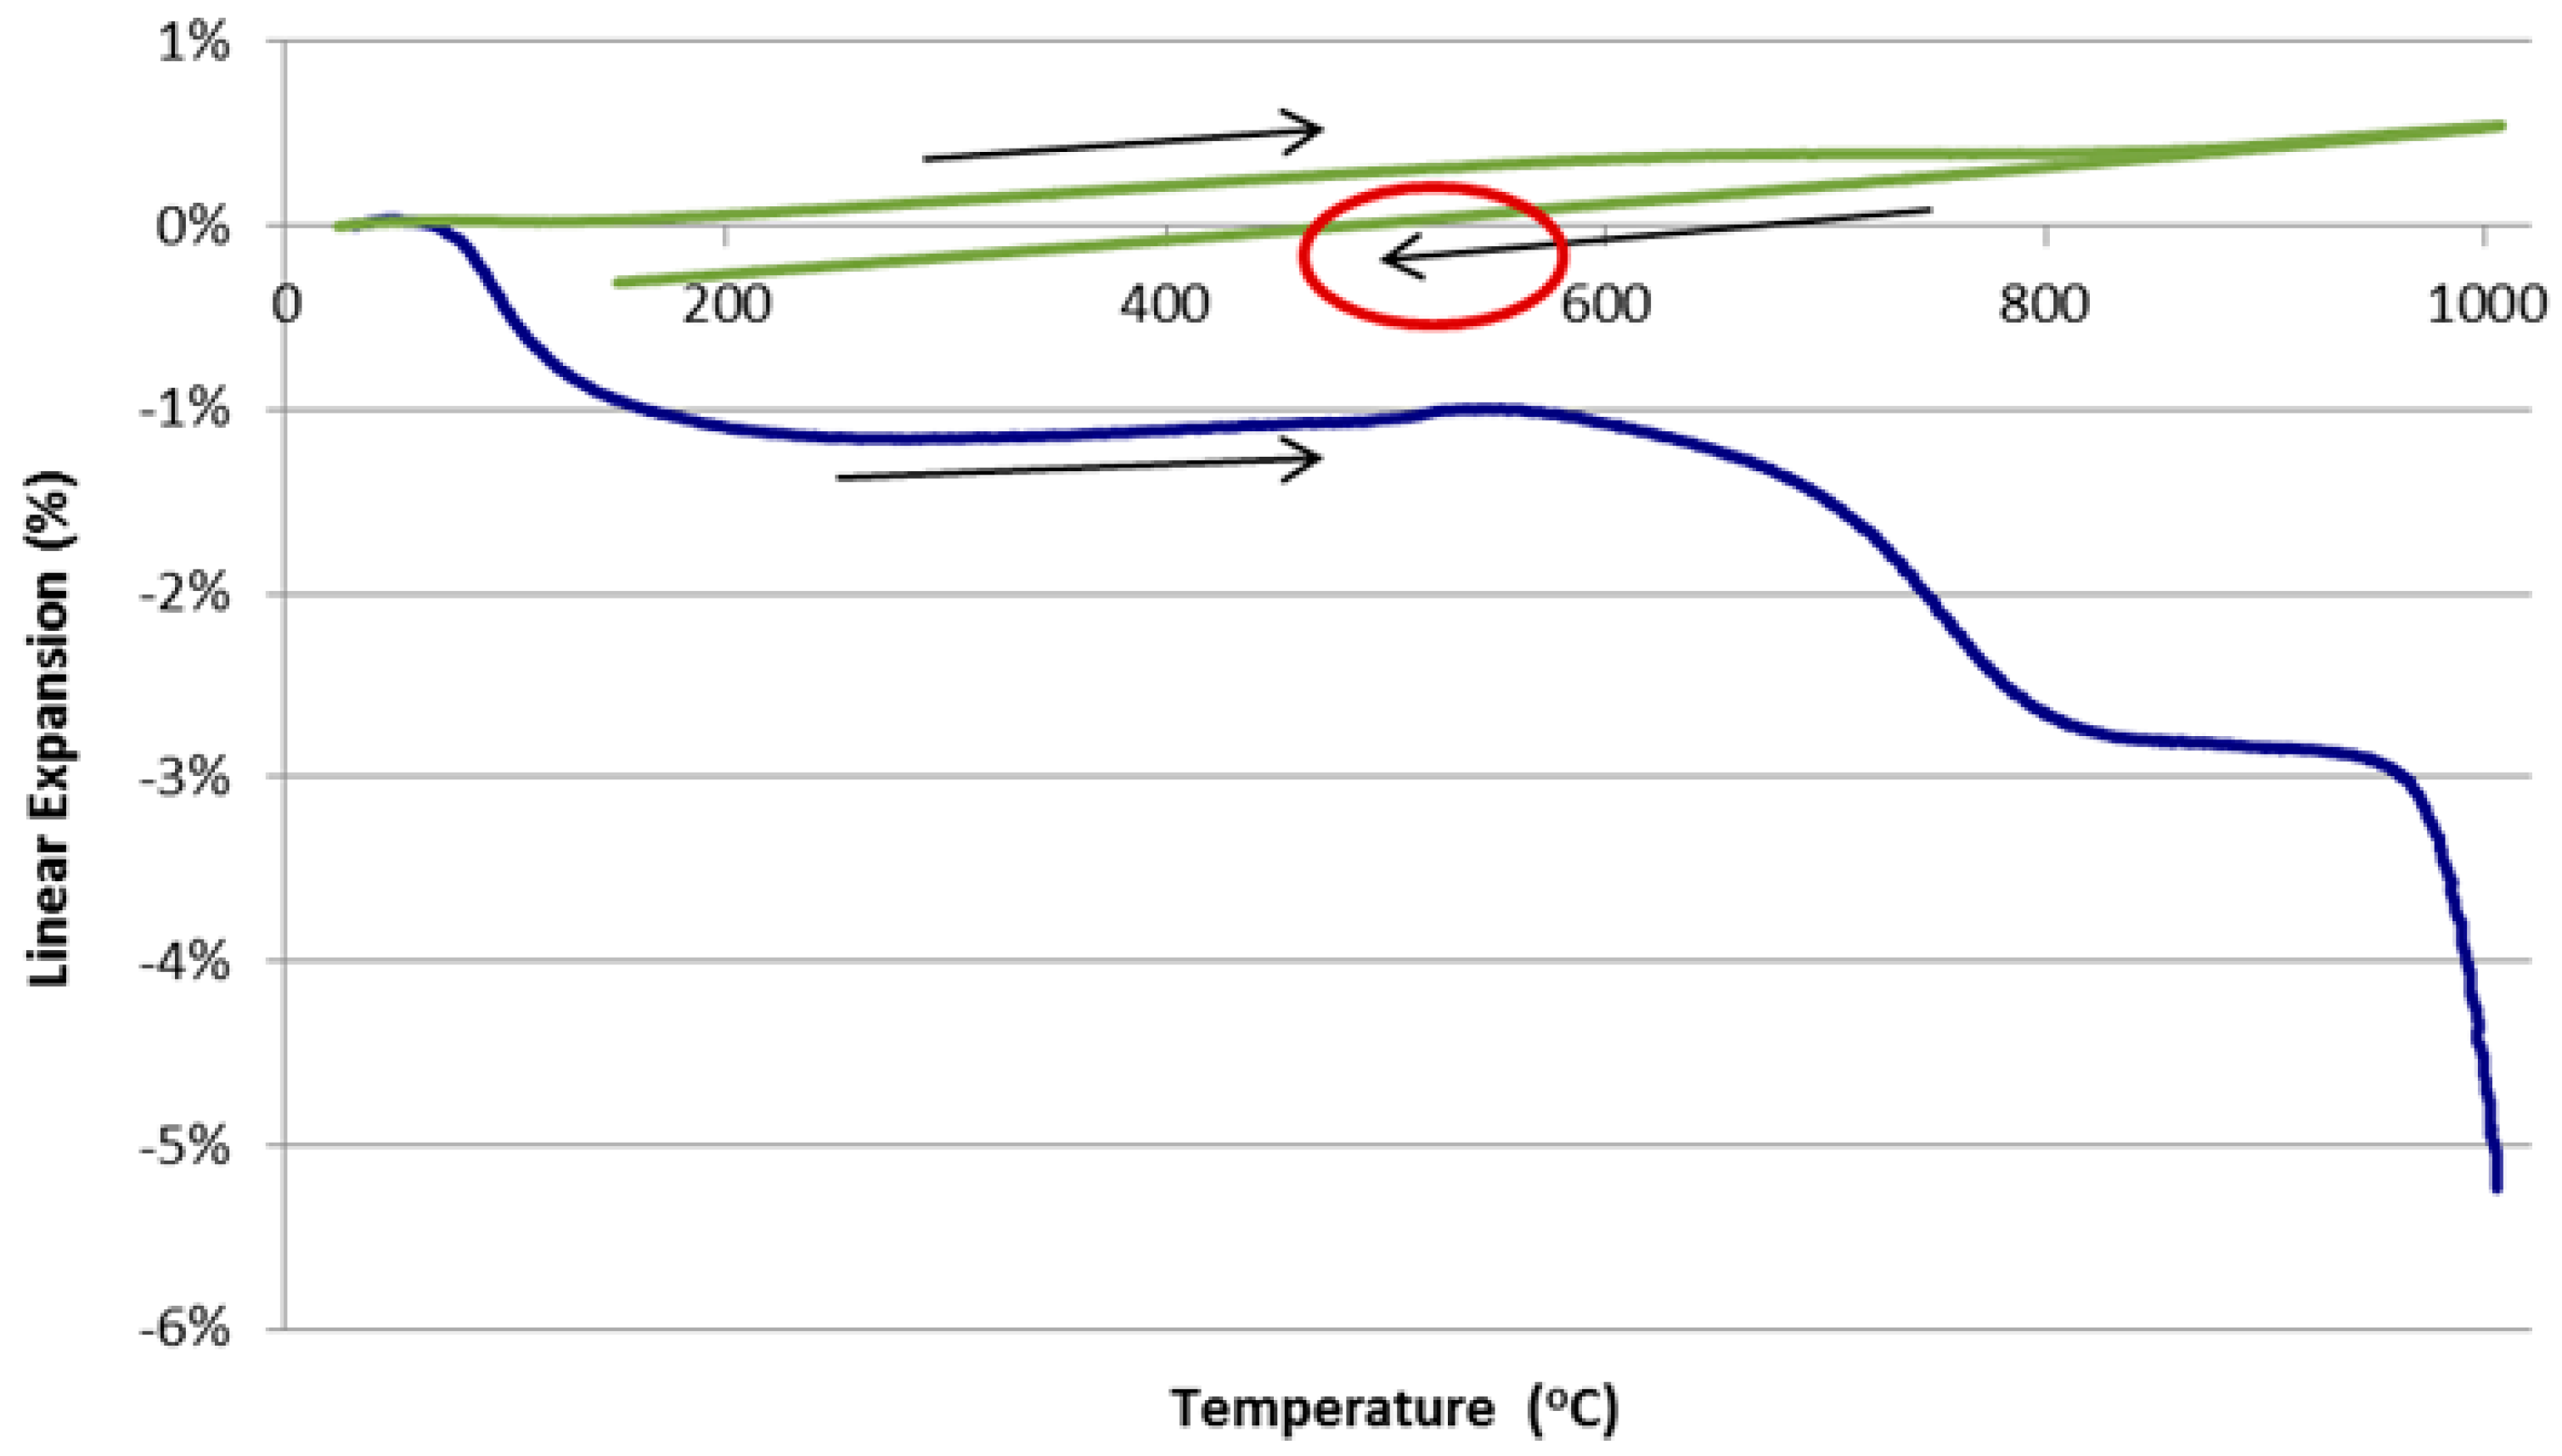
3.1. Dilatometer Tests
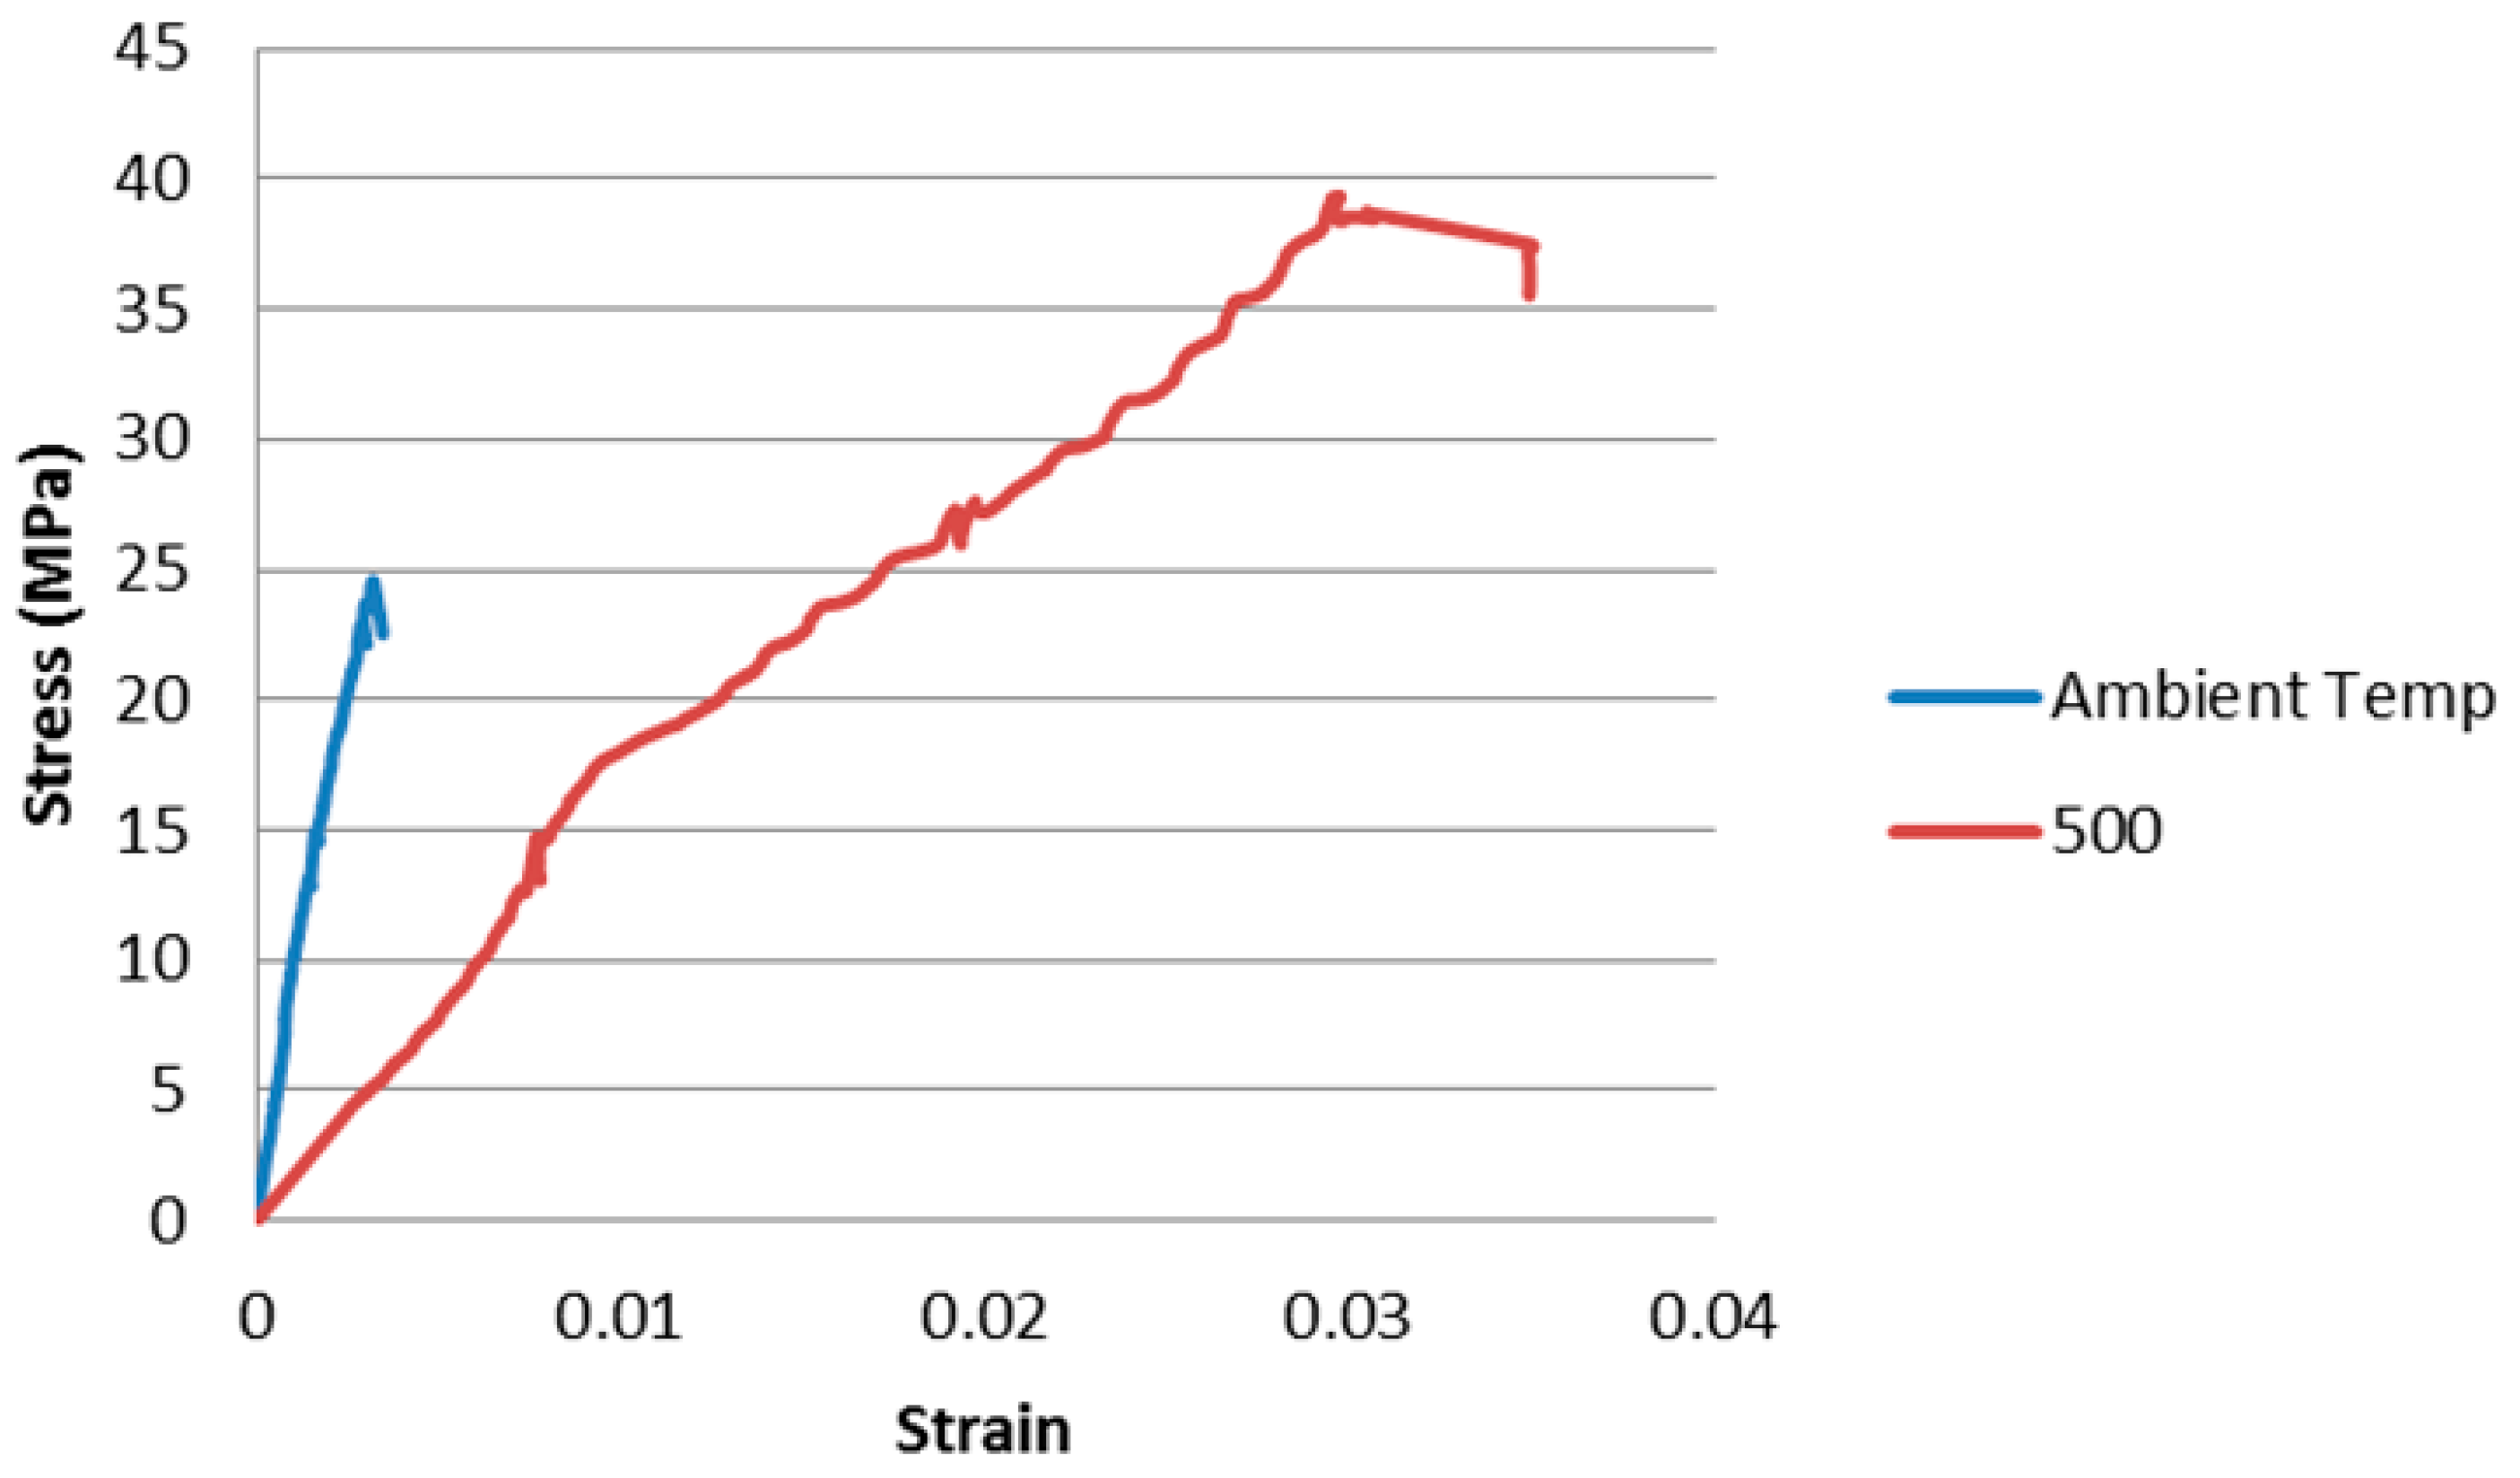
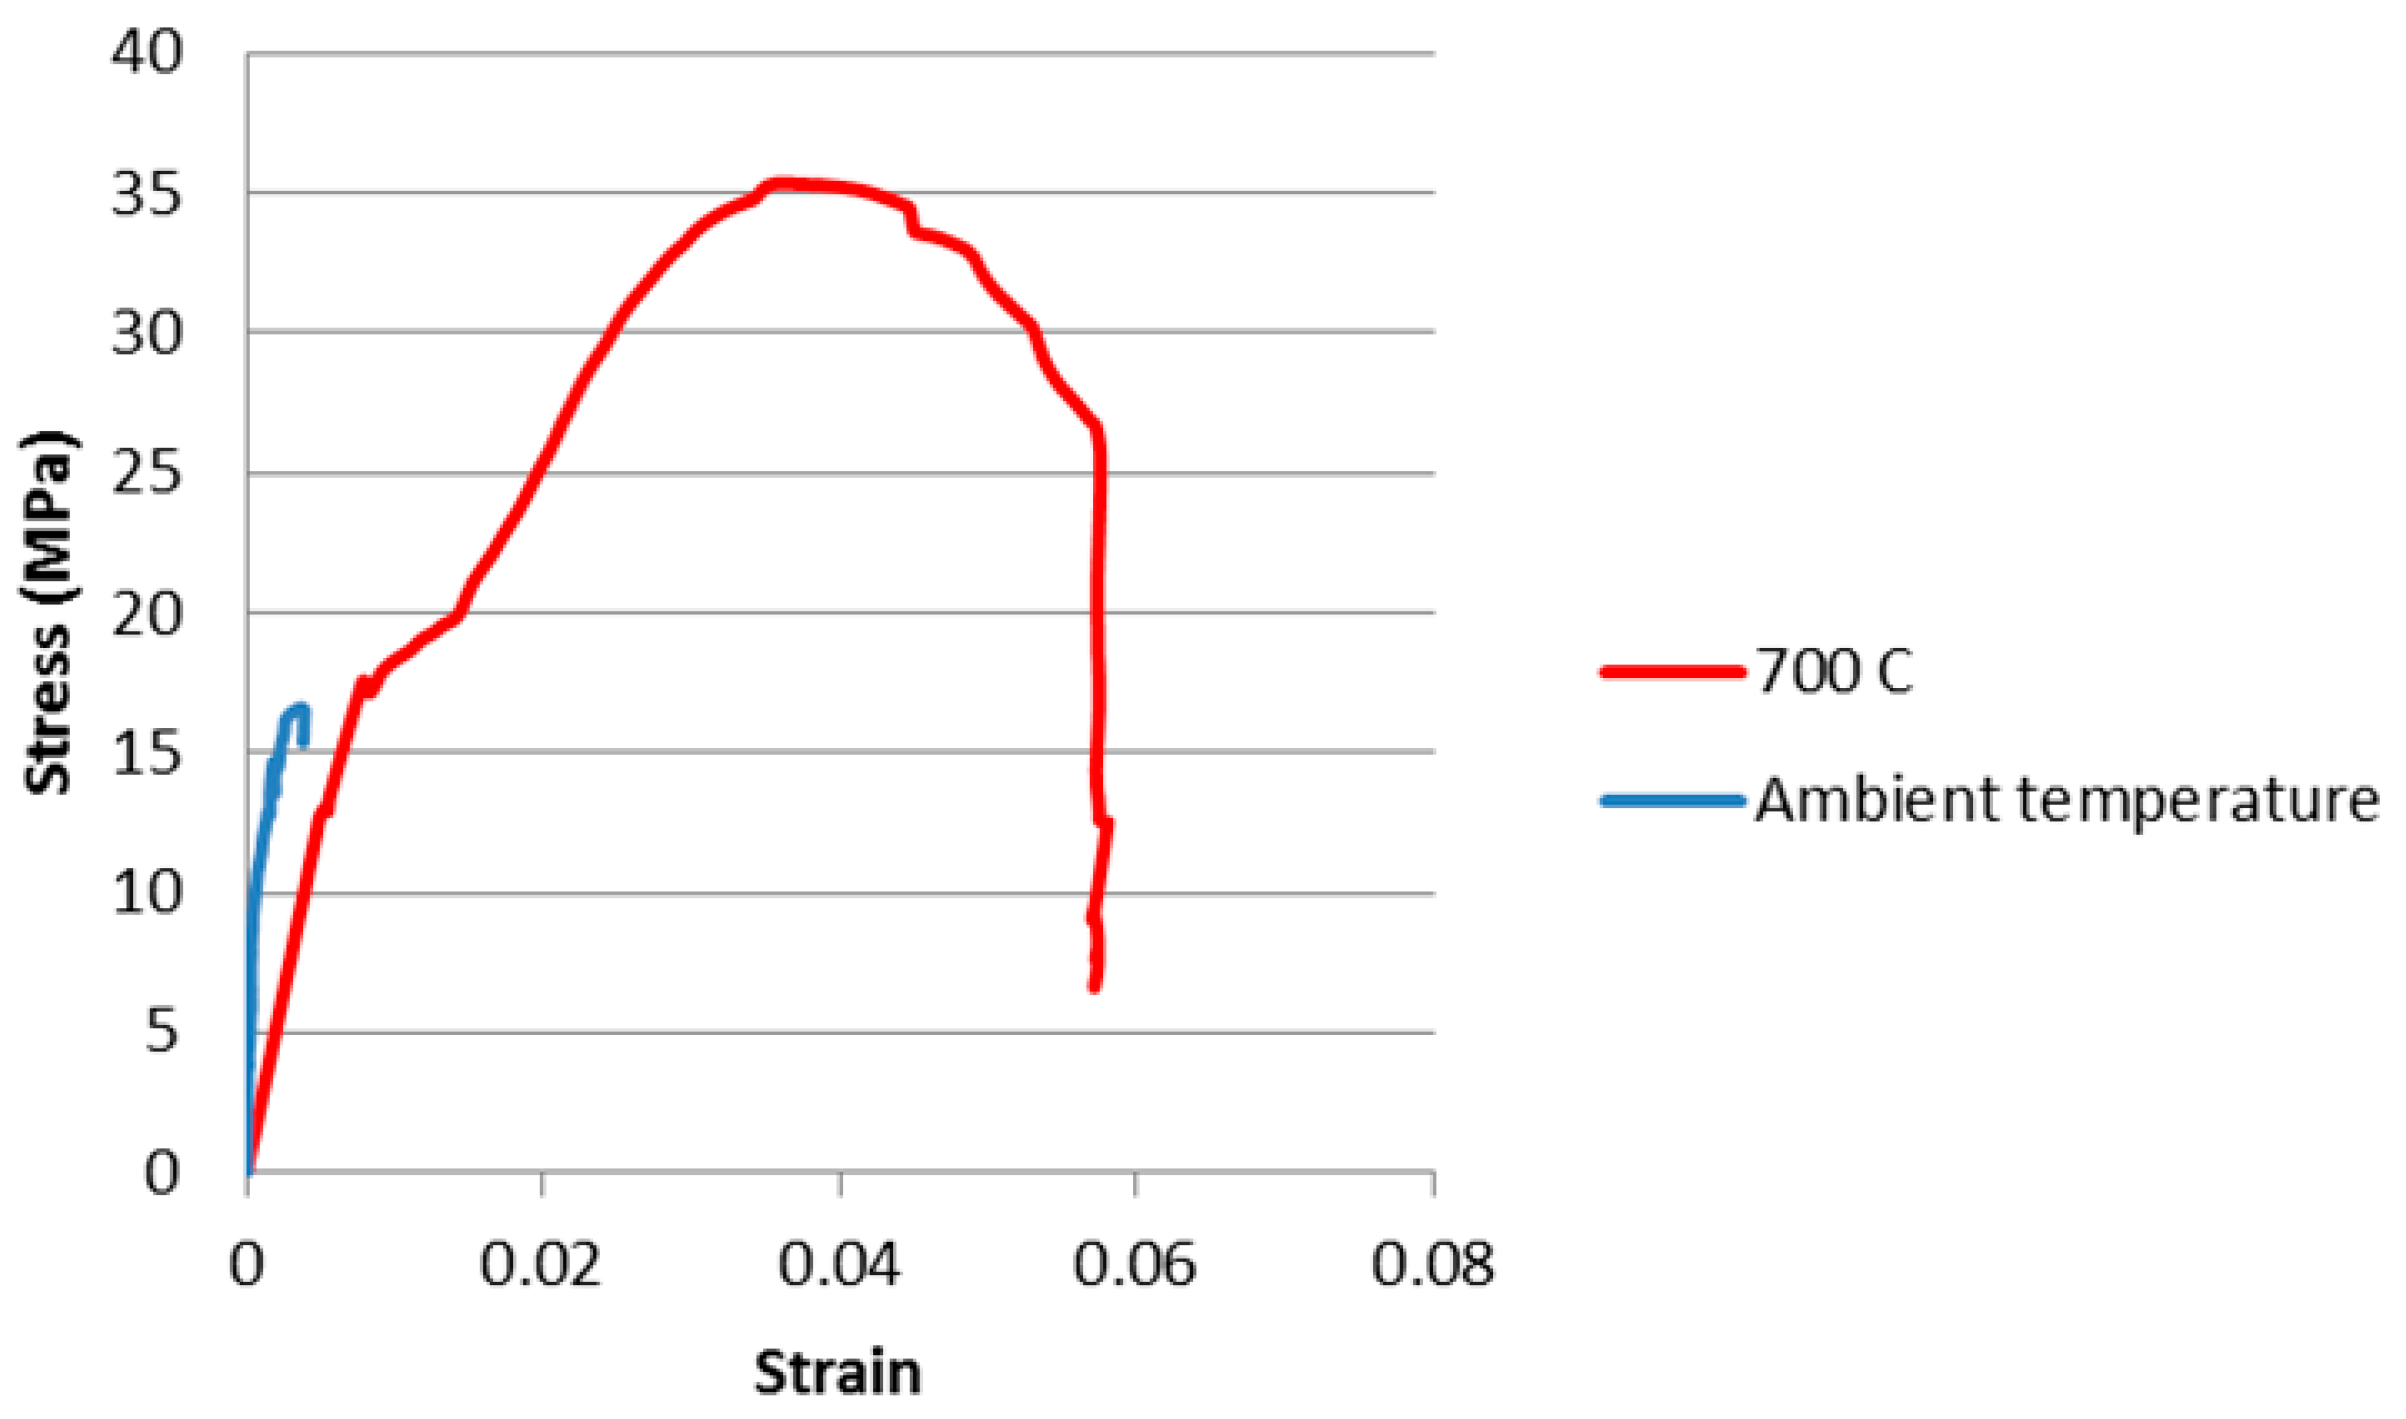
3.2. In Situ Compressive Strength Testing
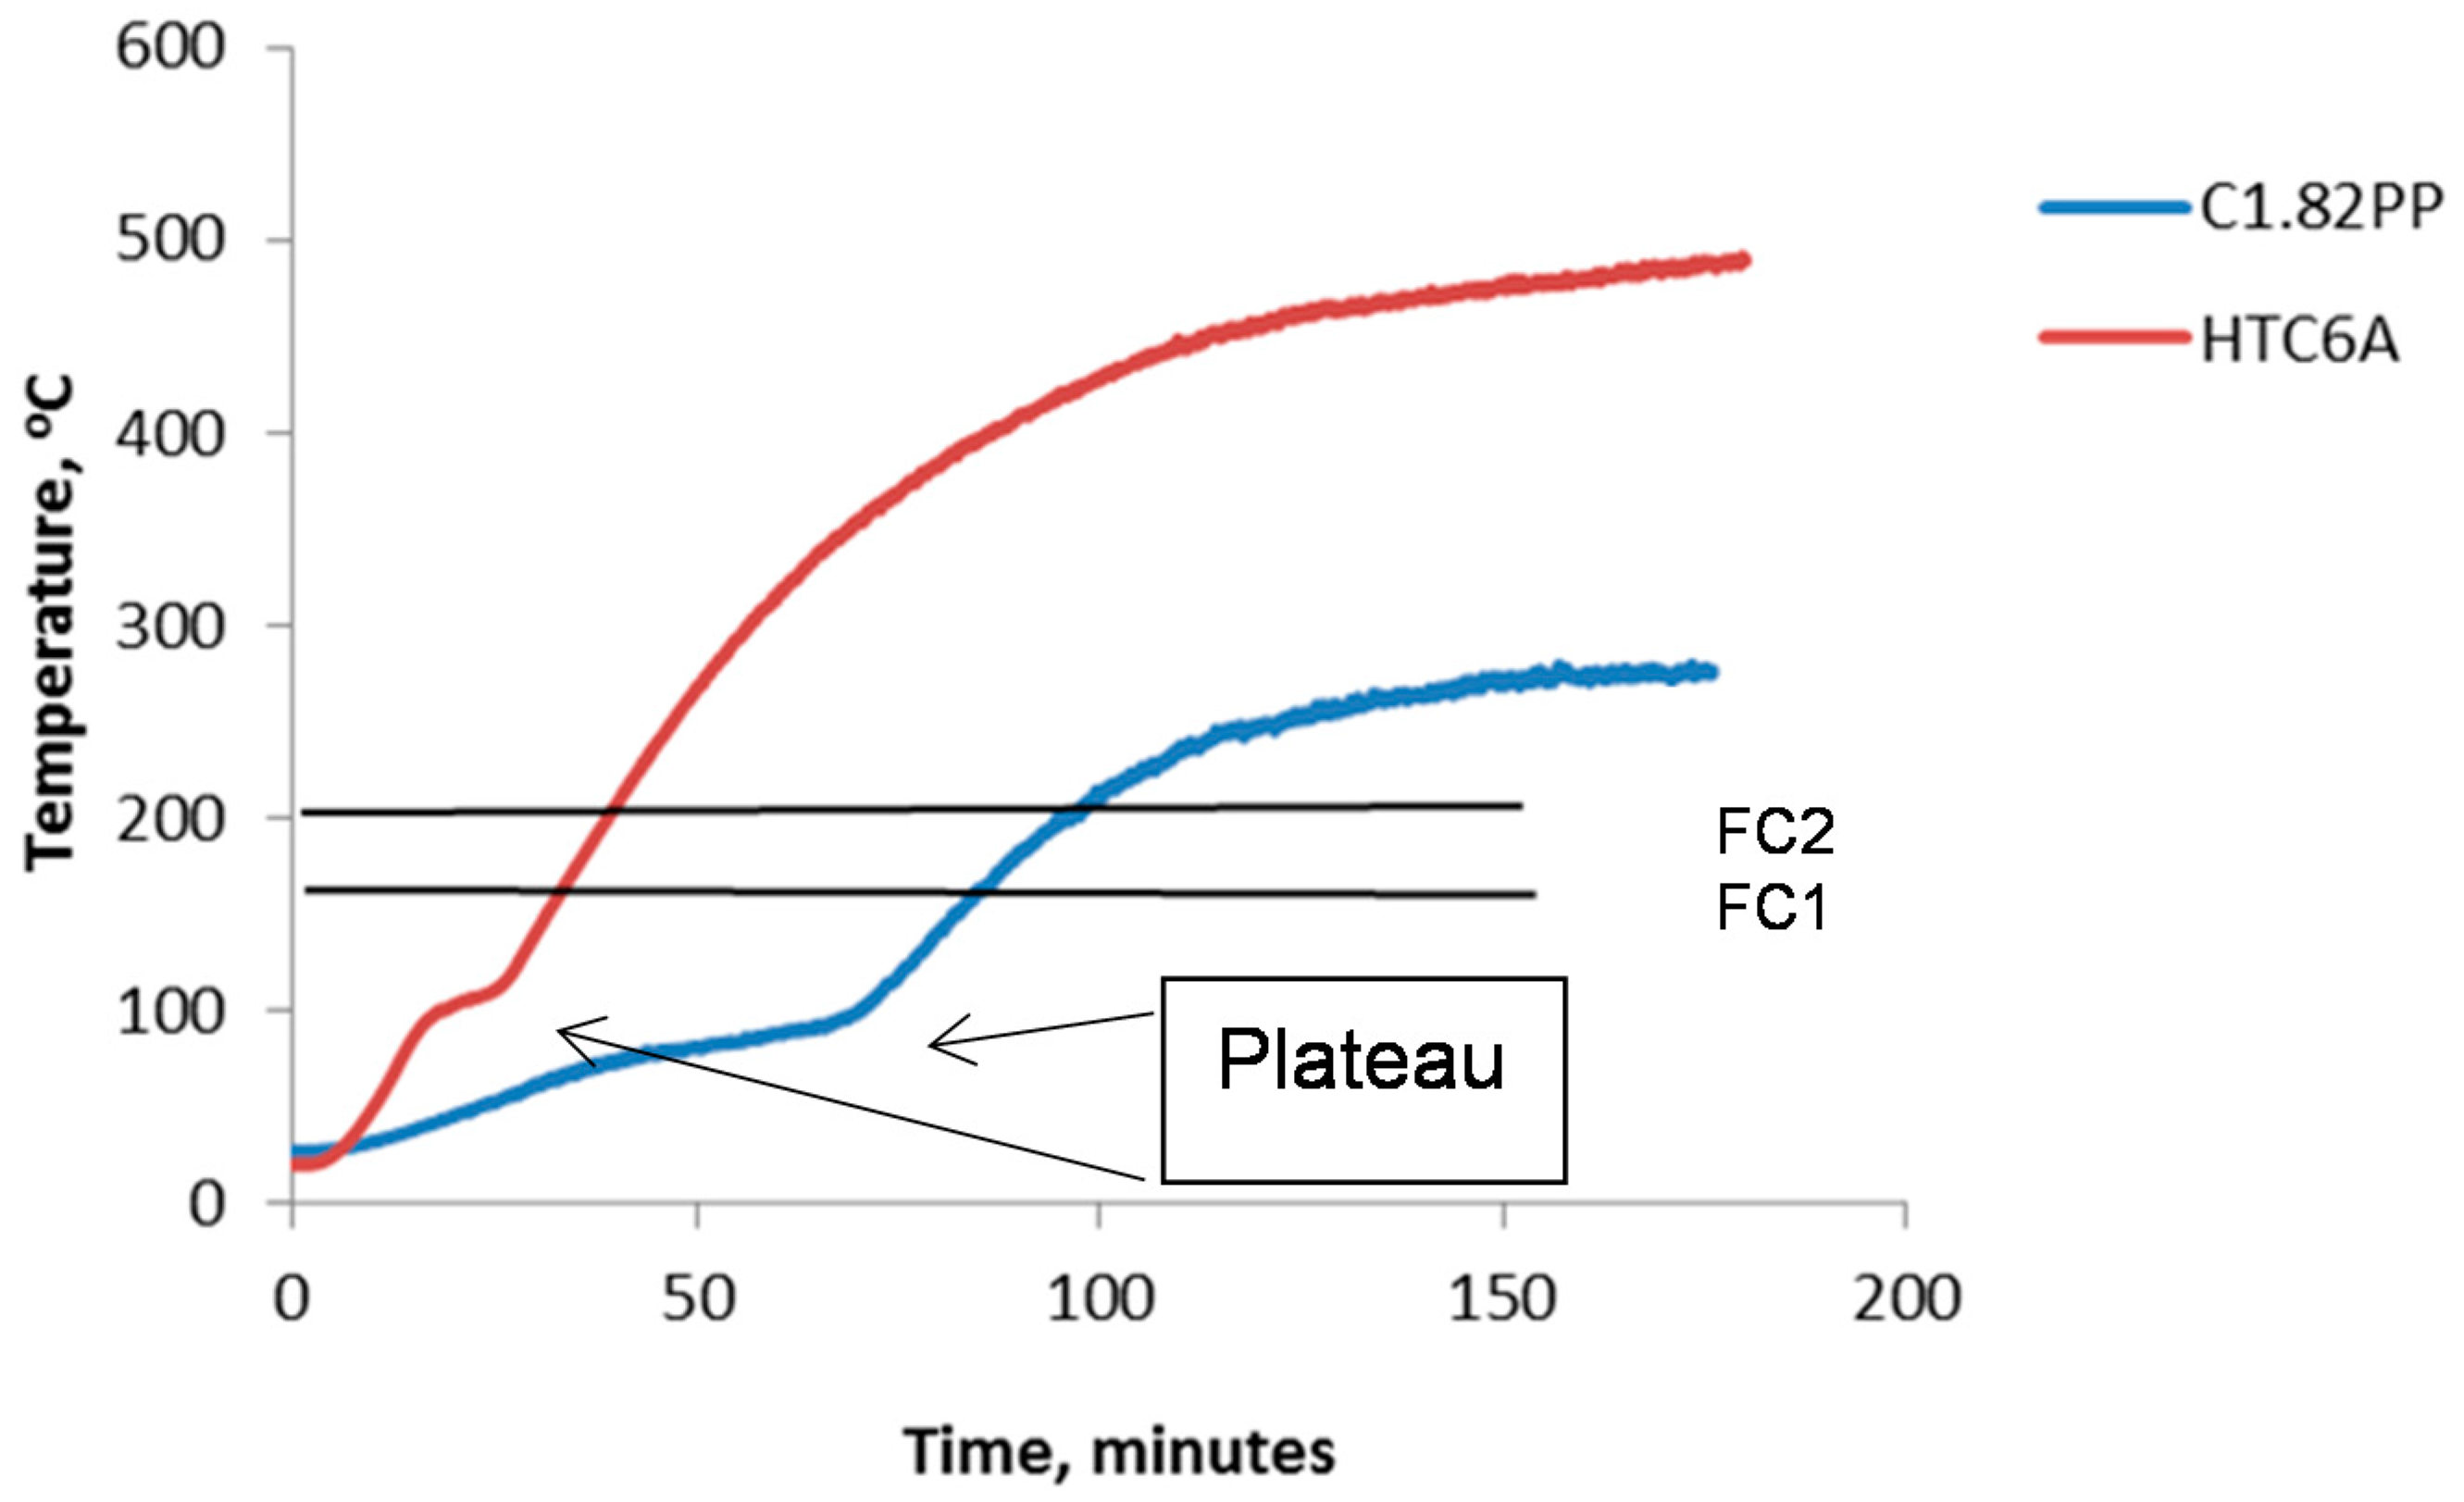
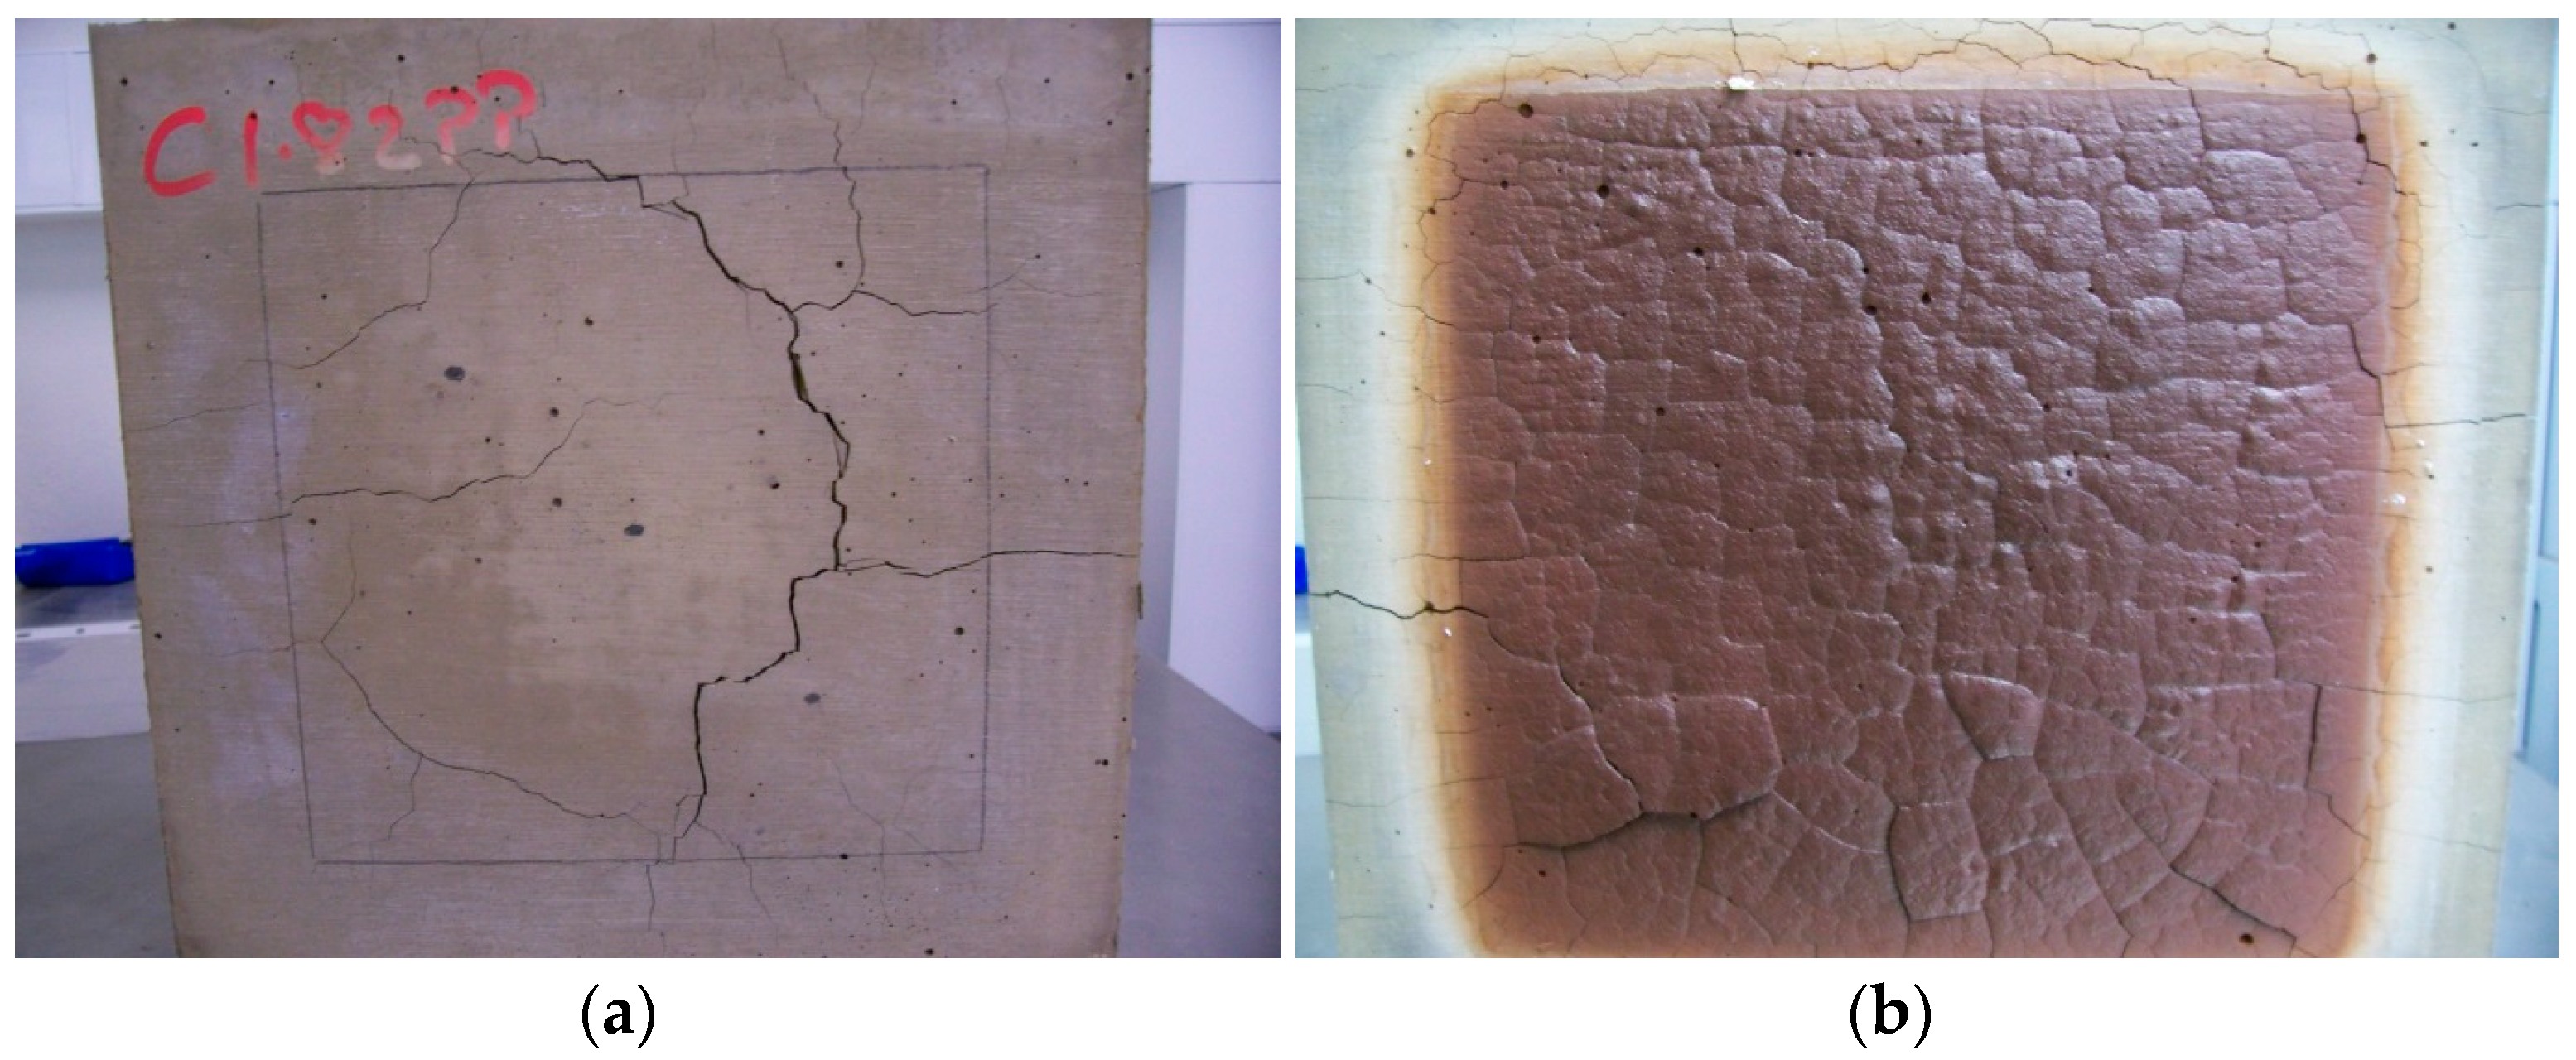
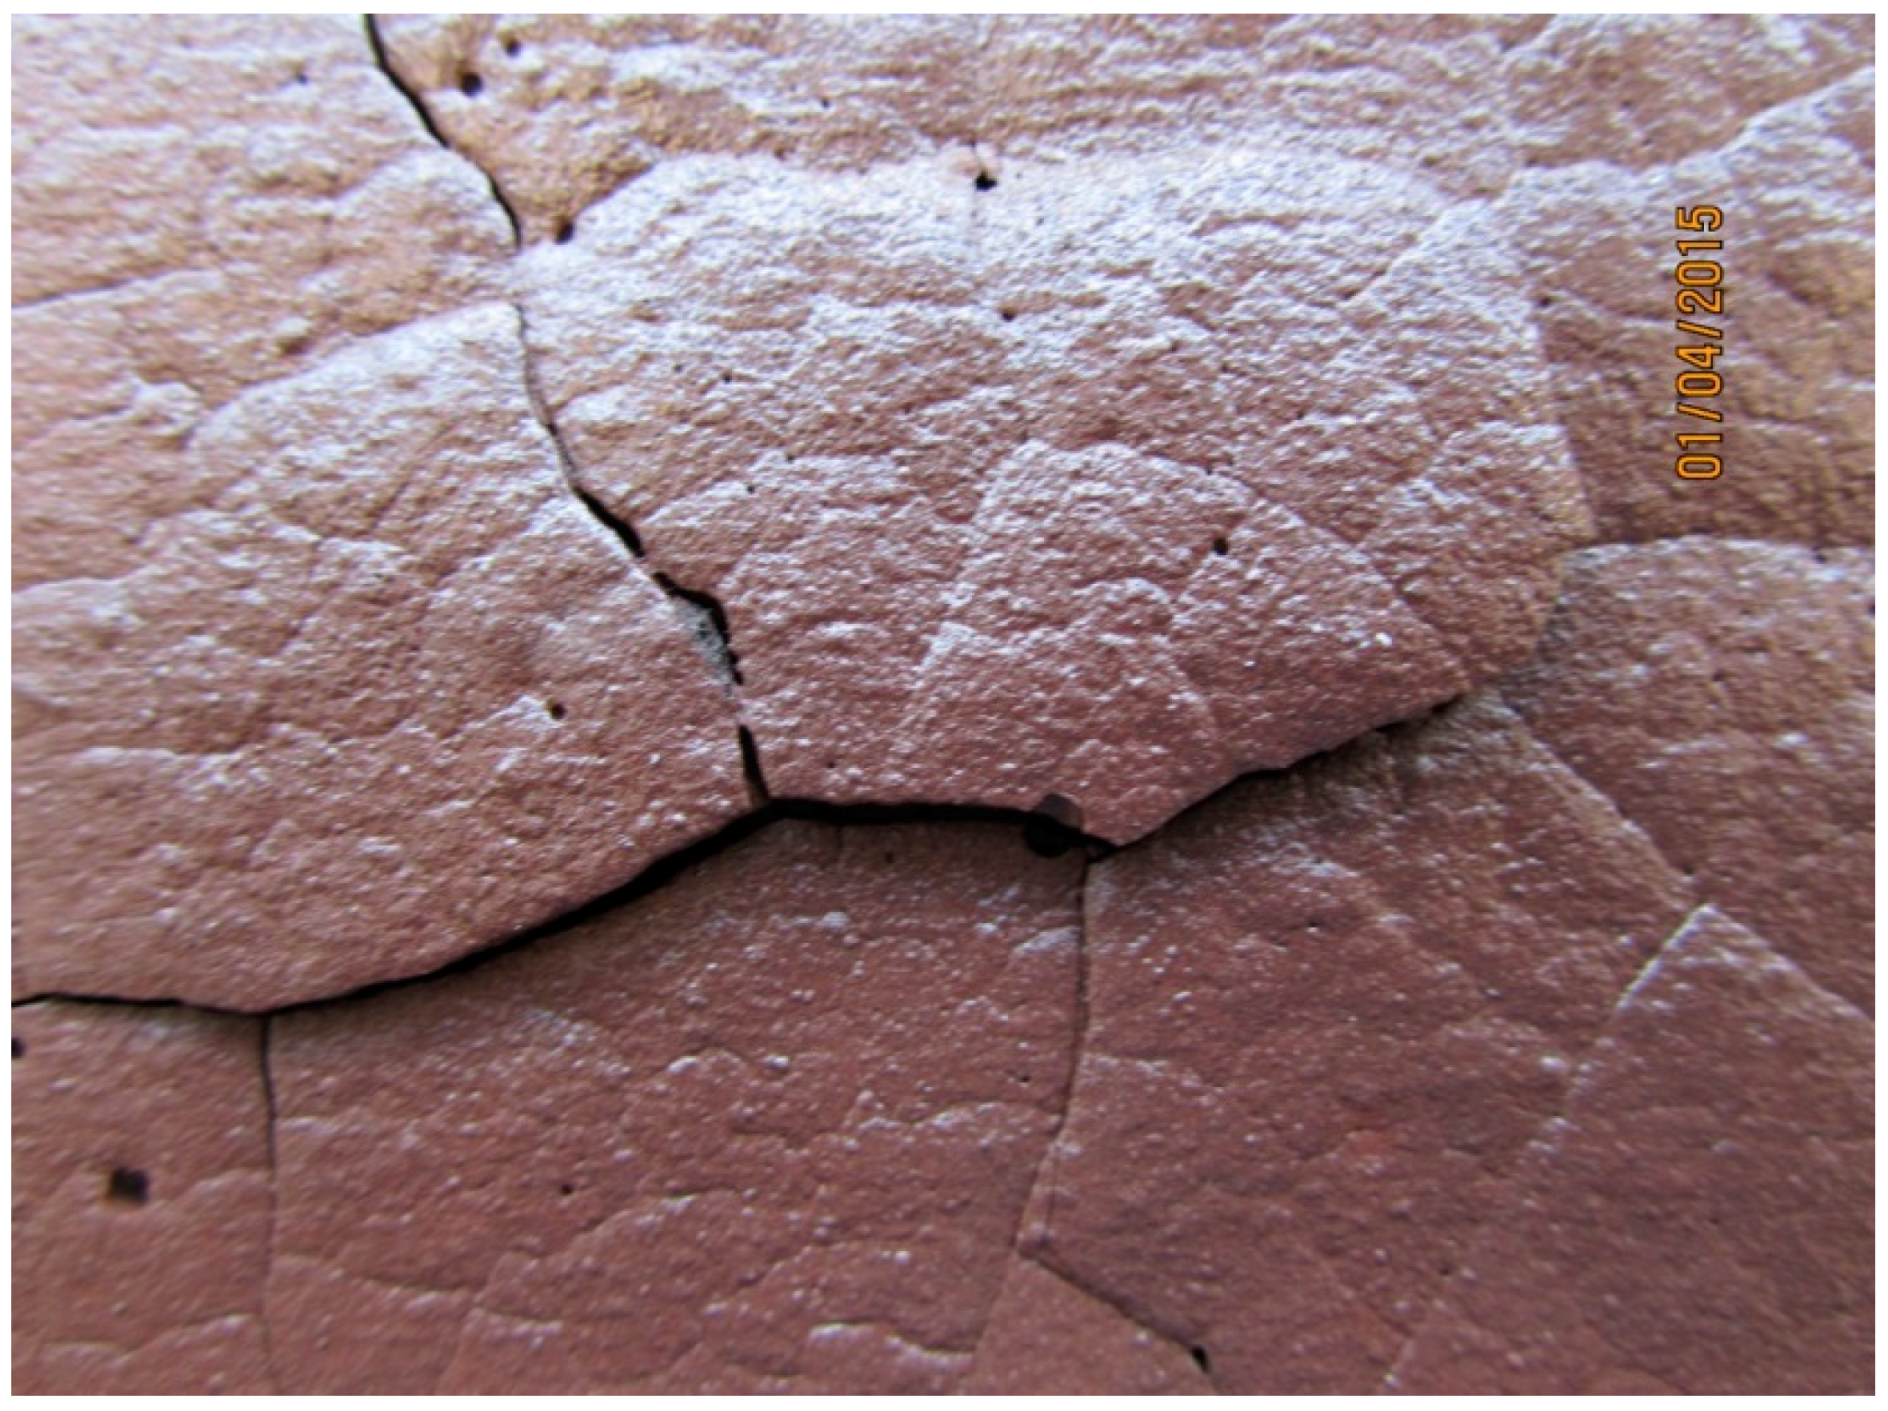
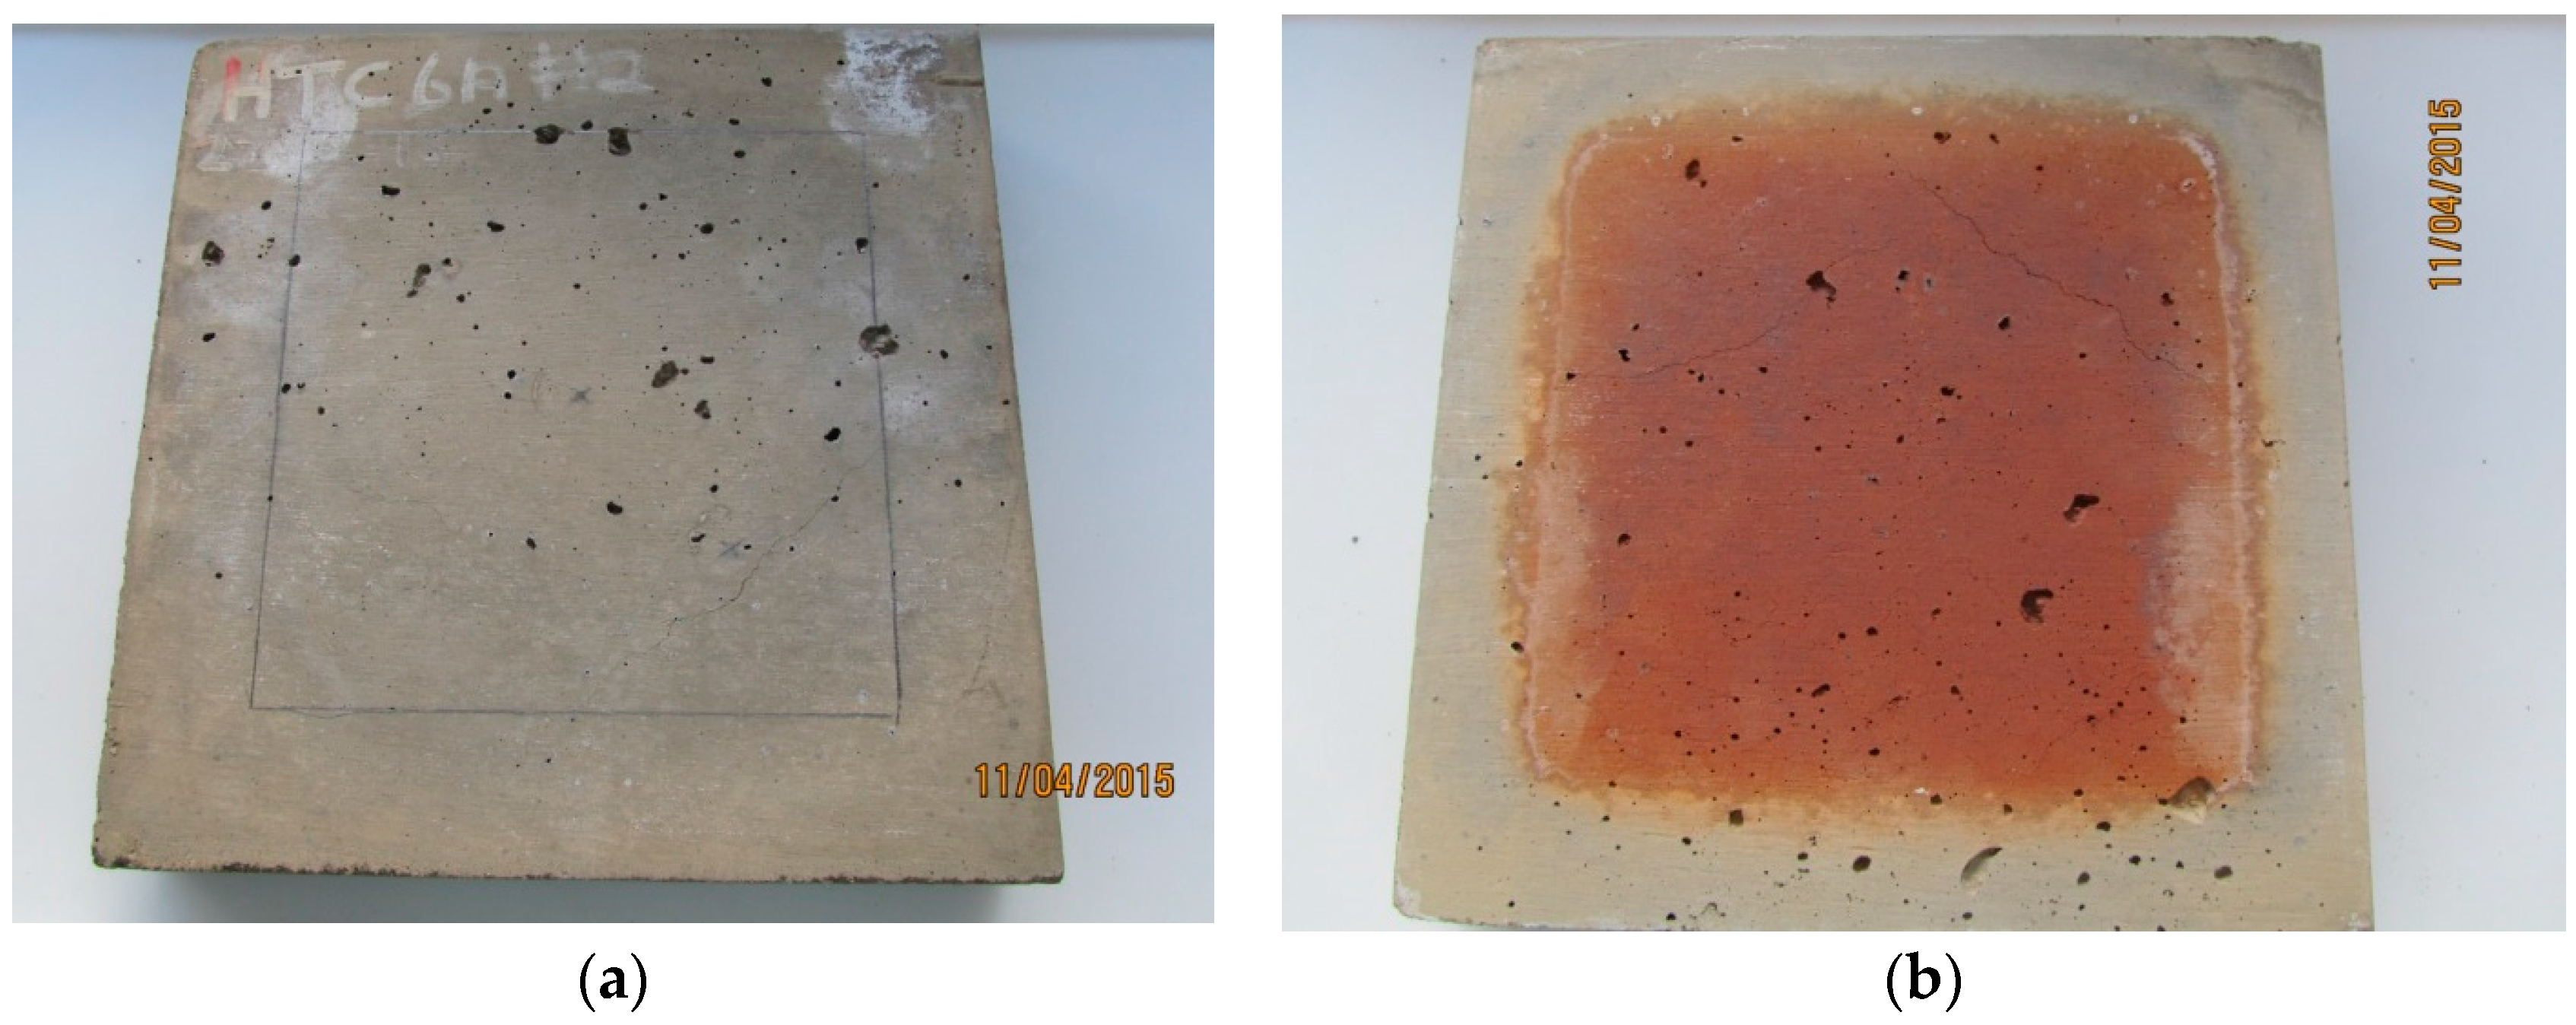
3.3. Fire Testing
- Failure in relation to thermal insulation is determined when measurement of temperature is made by thermocouples on the unexposed face. The specimen is deemed to have failed when:
- (a)
- Failure criteria 1 (FC1): The average temperature of the unexposed face of the test specimen exceeds the initial temperature by more than 140 K; or
- (b)
- Failure criteria 2 (FC2): The temperature at any location on the unexposed face of the test specimen exceeds the initial temperature by more than 180 K.
- Structural adequacy is defined as when a sample either collapses or when the deflection under a given load exceeds that specified in AS1530.4.
- Integrity failure can show three failure criteria:
- Continuous flaming on the cold side surface;
- Through gaps into the furnace, as determined by standard gauges, exceeding the sizes specified in AS1530.4;
- Ignition during the cotton wool pad test.
4. Summary
Author Contributions
Conflicts of Interest
References
- Davidovits, J. Geopolymers and geopolymeric materials. J. Therm. Anal. 1989, 35, 429–441. [Google Scholar] [CrossRef]
- Barbosa, V.F.F.; Mackenzie, K.J.D.; Thaumaturgoa, C. Synthesis and characterisation of materials based on inorganic polymers of alumina and silica: Sodium polysialate polymers. Int. J. Inorg. Mater. 2000, 2, 309–317. [Google Scholar] [CrossRef]
- Palomo, A.; Grutzeck, M.W.; Blanco, M.T. Alkali activated fly ashes: A cement for the future. Cem. Concr. Res. 1999, 29, 1323–1329. [Google Scholar] [CrossRef]
- Arioz, O. Effects of elevated temperatures on properties of concrete. Fire Saf. J. 2007, 42, 516–522. [Google Scholar] [CrossRef]
- Alarcon-Ruiza, L.; Platret, G.; Massieu, E.; Ehrlacher, A. The use of thermal analysis in assessing the effect of temperature on a cement paste. Cem. Concr. Res. 2005, 35, 609–613. [Google Scholar] [CrossRef]
- Van Riessen, A.; Rickard, W.; Sanjayan, J. Thermal properties of geopolymers. In Geopolymers: Structure, Processing, Properties and Industrial Applications; Provis, J.L., van Derventer, J.A.S., Eds.; Woodhead Publishing Ltd.: Cambridge, UK, 2009; pp. 315–342. [Google Scholar]
- Kong, D.; Sanjayan, J.G.; Sagoe-Crentsil, K. Comparative performance of geopolymers made with metakaolin and fly ash after exposure to elevated temperatures. Cem. Concr. Res. 2007, 37, 1583–1589. [Google Scholar] [CrossRef]
- Zhao, R.; Sanjayan, J. Geopolymer and Portland cement concretes in simulated fire. Mag. Concr. Res. 2012, 63, 163–173. [Google Scholar] [CrossRef]
- Ma, Y.; Hu, J.; Ye, G. The pore structure and permeability of alkali activated fly ash. Fuel 2013, 104, 771–780. [Google Scholar] [CrossRef]
- Bakharev, T. Thermal behaviour of geopolymers prepared using class F fly ash and elevated temperature curing. Cem. Concr. Res. 2006, 36, 1134–1147. [Google Scholar] [CrossRef]
- Rickard, W.D.A.; Kealley, C.S.; van Riessen, A. Thermally induced microstructural changes in fly ash geopolymers: Experimental results and proposed model. J. Am. Ceram. Soc. 2015, 98, 929–939. [Google Scholar] [CrossRef]
- Krivenko, P. Development of alkaline cements supported by theory and Practice. In Proceedings of the 4th International Geopolymer Conference, Saint Quentin, France, 29 June–1 July 2005.
- Kovalchuk, G.; Krivenco, P.V. Producing fire and heat resistant geopolymers. In Geopolymers; Structure, Processing, Properties and Structural Applications; Provis, J.L., van Deventer, J.S.J., Eds.; Woodhead Publishing Limited: Oxford, UK, 2009; pp. 227–266. [Google Scholar]
- Duxon, P.; Lukey, G.C.; van Deventer, J.S.J. The thermal evolution of metakaolin geopolymers: Part 2—Phase stability and structural development. J. Non-Cryst. Solids 2007, 353, 2186–2200. [Google Scholar] [CrossRef]
- Williams, R.P.; Van Riessen, A. Determination of the reactive component of fly ashes for geopolymer production using XRF and XRD. Fuel 2010, 89, 3683–3692. [Google Scholar] [CrossRef]
- Rickard, W.D.A.; Temuujin, J.; van Riessen, A. Thermal analysis of geopolymer pastes synthesised from five fly ashes of variable composition. J. Non-Cryst. Solids 2012, 358, 1830–1839. [Google Scholar] [CrossRef]
- Rickard, W.D.A.; Williams, R.; Temuujin, J.; van Riessen, A. Assessing the suitability of three Australian fly ashes as an aluminosilicate source for geopolymers in high temperature applications. Mater. Sci. Eng. A 2011, 528, 3390–3397. [Google Scholar] [CrossRef]
- Silva, F.J.; Mathias, A.F.; Thaumaturgo, C. Evaluation of the fracture toughness in poly (sialate-siloxo) composite matrix. Geopolymere 1999, 99, 97–106. [Google Scholar]
- Dias, D.P.; Thaumaturgo, C. Fracture toughness of geopolymeric concretes reinforced with basalt fibers. Cem. Concr. Compos. 2005, 27, 49–54. [Google Scholar] [CrossRef]
- Rill, E.; Lowry, D.R.; Kriven, W.M. Properties of basalt fiber reinforced geopolymer Composites. In Strategic Materials and Computational Design; John Wiley & Sons, Inc.: Hoboken, NJ, USA, 2010. [Google Scholar]
- Bilodeau, A.; Kodur, V.K.R.; Hoff, G.C. Optimization of the type and amount of polypropylene fibres for preventing the spalling of lightweight concrete subjected to hydrocarbon fire. Cem. Concr. Compos. 2004, 26, 163–174. [Google Scholar] [CrossRef]
- Papworth, F. Affect of Synthetic Fibres and Silica Fume on Explosive Spalling of HPC Exposed to Fire; South East Asia Construction: Singapore, 2000; pp. 1–6. [Google Scholar]
- Kalifa, P.; Chéné, G.; Gallé, C. High-temperature behaviour of HPC with polypropylene fibres: From spalling to microstructure. Cem. Concr. Res. 2001, 31, 1487–1499. [Google Scholar] [CrossRef]
- Lyon, R.E.; Balaguru, P.N.; Foden, M.; Sorathia, U.; Davidovits, J.; Davidovits, D. Fire Resistant Aluminosilicate composites. Fire Mater. 1997, 21, 67–73. [Google Scholar] [CrossRef]
- Pan, Z.; Sanjayan, J.G.; Rangan, B.V. An investigation of the mechanisms for strength gain or loss of geopolymer mortar after exposure to elevated temperature. J. Mater. Sci. 2009, 44, 1873–1880. [Google Scholar] [CrossRef]
- Kong, D.L.Y.; Sanjayan, J.G. Effect of elevated temperatures on geopolymer paste, mortar and concrete. Cem. Concr. Res. 2010, 40, 334–339. [Google Scholar] [CrossRef]
- Pan, Z.; Sanjayan, J.G. Stress-strain behaviour and abrupt loss of stiffness of geopolymer at elevated temperatures. Cem. Concr. Compos. 2010, 32, 657–664. [Google Scholar] [CrossRef]
- Vickers, L.; van Riessen, A.; Rickard, W.D.A. Strategies to control the high temperature shrinkage of fly ash based geopolymers. Thermochim. Acta 2014, 580, 20–27. [Google Scholar] [CrossRef]
- Rilem Tc129mht Committee. 129-MHT Test Methods for mechanical properties of concrete at high temperature. Mater. Struct. 1995, 28, 410–414. [Google Scholar]
- Rilem Tc129mht Committee. Recommendations: Part 6 Thermal strains. Mater. Struct. 1997, 30, 17–21. [Google Scholar]
- ASTM Committee E37. Standard Test Method for Linear Thermal Expansion of Solid Materials with a Push-Rod Dilatometer; E228-11; ASTM Standard; American Society of Testing Materials (ASTM): West Conshohocken, PA, USA, 2011. [Google Scholar]
- Pan, Z.; Sanjayan, J.G. Factors influencing softening temperature and hot-strength of geopolymers. Cem. Concr. Compos. 2012, 34, 261–264. [Google Scholar] [CrossRef]
- Rickard, W.D.A.; van Riessen, A. Performance of solid and cellular structured fly ash geopolymers exposed to a simulated fire. Cem. Concr. Compos. 2014, 48, 75–82. [Google Scholar] [CrossRef]
- Duxon, P.; Lukey, G.C.; van Deventer, J.S.J. Physical evolution of Na-geopolymer derived from metakaolin up to 1000 °C. J. Mater. Sci. 2007, 42, 3044–3054. [Google Scholar] [CrossRef]


| Total Oxide (wt %) | Collie Fly Ash |
|---|---|
| SiO2 | 51.38 |
| Al2O3 | 26.90 |
| Fe2O3 | 13.20 |
| CaO | 1.74 |
| Bulk Si:Al molar | 1.62 |
| Amorphous content, % | 54.00 |
| Amorphous Aluminosilicates, % | 36.29 |
| Amorphous Si:Al molar | 1.15 |
| Components | C1.82PP Paste | HTC 6A Composite |
|---|---|---|
| Collie Fly Ash | 100.0 | 100.0 |
| Alkaline Activating Solution | 39.5 | 39.5 |
| Polypropylene Fibre | 0.15 | 0.15 |
| Basalt Fibre | - | 1.0 |
| Wollastonite | - | 10.0 |
| Alumina aggregate 3–5 mm | - | 175.0 |
| Alumina aggregate 1–2 mm | - | 105.0 |
| Alumina aggregate 0.2–0.5 mm | - | 70.0 |
| Additional water | - | 7.5 |
| Total Parts by Weight | 139.65 | 508.15 |
| Water content, wt % | 20 | 7.2 |
| Alumina content, vol% | 0 | 51.0 |
| As Cured Properties | C1.82PP | HTC 6A |
|---|---|---|
| Density, g·cm−3 | 1.98 (1) | 2.74 (2) |
| Compressive strength, MPa | 24.5 (12) | 16.6 (19) |
| Young’s Modulus, GPa | 9.8 (5) | 10.23 (50) |
| Tested at | 500 °C | 700 °C |
| Compressive strength, MPa | 38.7 (20) | 35.3 (18) |
| Young’s Modulus, GPa | 2.1 (1) | 2.6 (1) |
| Density, g·cm−3 after 1000 °C | 1.89 (1) | 2.73 (1) |
| Weight loss,% after 1000 °C | 19.4 (1) | 2.9 (1) |
| Volume shrinkage,% after 1000 °C | 11.8 (11) | 1.3 (1) |
| Results | C1.82PP | HTC 6A |
|---|---|---|
| vol % alumina | 0 | 51 |
| Calculated wt % water | 20 | 7.2 |
| Weight loss, % | 12.0 | 3.2 |
| Start of plateau, min | 37.4 | 15.9 |
| Plateau duration, min | 32.5 | 7.5 |
| Plateau gradient, °C·min−1 | 0.65 | 1.56 |
| Cold side temperature at 120 min, °C | 247 | 444 |
| Cold side temperature at 180 min, °C | 279 | 476 |
| FC 1, min | 87 | 32.3 |
© 2016 by the authors; licensee MDPI, Basel, Switzerland. This article is an open access article distributed under the terms and conditions of the Creative Commons Attribution (CC-BY) license (http://creativecommons.org/licenses/by/4.0/).
Share and Cite
Vickers, L.; Pan, Z.; Tao, Z.; Van Riessen, A. In Situ Elevated Temperature Testing of Fly Ash Based Geopolymer Composites. Materials 2016, 9, 445. https://doi.org/10.3390/ma9060445
Vickers L, Pan Z, Tao Z, Van Riessen A. In Situ Elevated Temperature Testing of Fly Ash Based Geopolymer Composites. Materials. 2016; 9(6):445. https://doi.org/10.3390/ma9060445
Chicago/Turabian StyleVickers, Les, Zhu Pan, Zhong Tao, and Arie Van Riessen. 2016. "In Situ Elevated Temperature Testing of Fly Ash Based Geopolymer Composites" Materials 9, no. 6: 445. https://doi.org/10.3390/ma9060445
APA StyleVickers, L., Pan, Z., Tao, Z., & Van Riessen, A. (2016). In Situ Elevated Temperature Testing of Fly Ash Based Geopolymer Composites. Materials, 9(6), 445. https://doi.org/10.3390/ma9060445