Article

Fabrication of Pt/Ti/TiO2 Photoelectrodes by RF-Magnetron Sputtering for Separate Hydrogen and Oxygen Production

1
Dipartimento di Chimica, Università degli Studi di Milano, via Golgi 19, Milano 20133, Italy
2
Dipartimento di Chimica, Università degli Studi di Pavia, viale Taramelli 16, Pavia 27100, Italy
*
Author to whom correspondence should be addressed.
Materials 2016, 9(4), 279; https://doi.org/10.3390/ma9040279
Submission received: 3 February 2016 / Revised: 31 March 2016 / Accepted: 5 April 2016 / Published: 8 April 2016
(This article belongs to the Special Issue Advancement of Photocatalytic Materials 2016)

Abstract

:
Evolution of pure hydrogen and oxygen by photocatalytic water splitting was attained from the opposite sides of a composite Pt/Ti/TiO2 photoelectrode. The TiO2 films were prepared by radio frequency (RF)-Magnetron Sputtering at different deposition time ranging from 1 up to 8 h and then characterized by X-ray diffraction (XRD), scanning electron microscopy (SEM) and ultraviolet-visible-near infrared (UV-vis-NIR) diffuse reflectance spectroscopy. The photocatalytic activity was evaluated by incident photon to current efficiency (IPCE) measurements and by photocatalytic water splitting measurements in a two-compartment cell. The highest H2 production rate was attained with the photoelectrode prepared by 6 h-long TiO2 deposition thanks to its high content in the rutile polymorph, which is active under visible light. By contrast, the photoactivity dropped for longer deposition time, because of the increased probability of electron-hole recombination due to the longer electron transfer path.

1. Introduction

Photocatalytic water splitting into hydrogen and oxygen is one of the most promising ways to produce a renewable and environmentally friendly fuel by converting solar into chemical energy. A separate stream of pure hydrogen can be attained using two-compartment photocatalytic cells [1,2,3,4,5,6,7]. The main issue in the development of such devices is the preparation of photoactive, stable, and cost effective photoanodes in the form of thin layers. Among all of the existing techniques for thin films deposition [8], radio frequency (RF) magnetron sputtering proved to be an effective method to prepare photoactive semiconductor coatings [4,9,10,11]. Moreover, this technique is already available for large surface deposition and scale production (e.g., roll-to-roll magnetron sputtering). A precise control of all the deposition parameters (RF power, total pressure inside the chamber, deposition time, temperature and distance of the substrate) allows one to tune the characteristics of the deposited film. For example, Ebrahimi et al. [12] showed that the crystal phase composition of a TiO2 film can be changed from pure rutile to a mixture of anatase and rutile by increasing the total Ar pressure during deposition. In a previous work [4], we showed that almost pure anatase is obtained by keeping the substrate temperature at 450 °C, whereas prevalently rutile is obtained at 600 °C. Furthermore, both cation (e.g., Cr, Fe, V and Cu) [13,14,15] or anion (N and/or C) [16,17,18] doping of the TiO2 coatings have been reported by co-deposition or reactive magnetron sputtering, respectively. Chemical post treatment with HF etching [19] or hydrothermal treatment with NaOH [20] have also been reported to increase the photocatalytic performance.
In this work, we present the photocatalytic water splitting results obtained employing composite Pt/Ti/TiO2 photoelectrodes prepared by RF magnetron sputtering, which allow the cleavage of H2O into H2 and O2 on the two opposite sides upon illumination. In particular, we focus on the effects that the deposition time has on the properties of the TiO2 coating and on its photocatalytic performance.

2. Materials and Methods

2.1. Preparation of the Photoelectrodes

TiO2 thin films (9.6 cm2) were deposited on pure titanium disks (TI000420/8, Goodfellow, Huntingdon, UK) starting from a TiO2 powder target (Puratronic, 99.995%, Alfa Aesar, Haverhill, MA, USA), employing a RF magnetron sputtering system (Rial Vacuum, Chiozzola, Italy). Prior to deposition, titanium disks were immersed for 1 min in a pickling aqueous solution (DeTitan 90, Kemar, Leggiuno, Italy) containing HF, H2SO4 and H2O2. All depositions were carried out in pure Ar at constant sputtering power (200 W) and total gas pressure inside the chamber (2.0 Pa). The Ti disk substrate was placed at a distance of 50 mm above the TiO2 target and kept at 600 °C during the deposition. Four samples were prepared at different deposition times (1, 3, 6 and 8 h).
A thin platinum coating (ca. 20 mg·cm−2 loading) was deposited on the opposite side of all titanium disks in a vacuum evaporator, finally obtaining the Pt/Ti/TiO2 photoelectrodes.

2.2. Characterization of the Photoelectrodes

The film morphology was investigated by scanning electron microscopy (SEM) employing a LEO 1430 microscope (Zeiss, Jena, Germany). X-ray diffraction (XRD) patterns of the deposited TiO2 coatings were acquired with a PW3020 powder diffractometer (Philips, Amsterdam, The Netherlands), using the Cu Kα radiation (λ = 1.5418 Å) in the 20°–80° 2θ range with a time step of 0.05° and a fixed counting time of 2 s per step. Quantitative phase analysis was made by the Rietveld refinement method [21,22], using the “Quanto” software [23]. UV-Vis-NIR diffuse reflectance (DR) spectra were recorded in the 220 nm < λ < 2600 nm range with a UV3600 Plus spectrophotometer (Shimadzu, Kyoto, Japan) equipped with an ISR-603 integrating sphere.

2.3. IPCE Measurements

Incident photon to current efficiency (IPCE) curves were measured with a homemade single compartment Plexiglas cell with a Pyrex glass window by connecting the irradiated TiO2 film (anode) with a platinum counter electrode (cathode) through an external circuit including a DMM4040 digital multimeter (Tektronix, Beaverton, OR, USA) for photocurrent measurement. For these tests the Pt coating was covered by pressing the Ti disk against a silicone rubber foil. A 300 W Xe lamp with a Omni-λ 150 monochromator (LOT-Oriel, Darmstadt, Germany) was used as monochromatic irradiation source. The photocurrent was measured in a 1.0 M NaOH electrolyte solution without any external applied voltage in the 300–500 nm wavelength range with a 2 nm step and a 4 s time per step. The incident light power was measured with the same scan parameters using a S130VC calibrated photodiode (Thorlabs, Newton, NJ, USA) with the Pyrex window placed between the light source and the photodiode, to account for the transmittance of the cell window. The percent IPCE at each wavelength was calculated with the following formula:
% I P C E =   I λ   × 1240 P λ × λ × 100
where Iλ is the photocurrent density (mA·cm−2); Pλ is the incident power density (mW·cm−2); λ (nm) is the incident wavelength; and 1240 (J·nm·C−1) = h·c·e−1 (h being the Planck constant, c the speed of light and e the charge of a single electron).

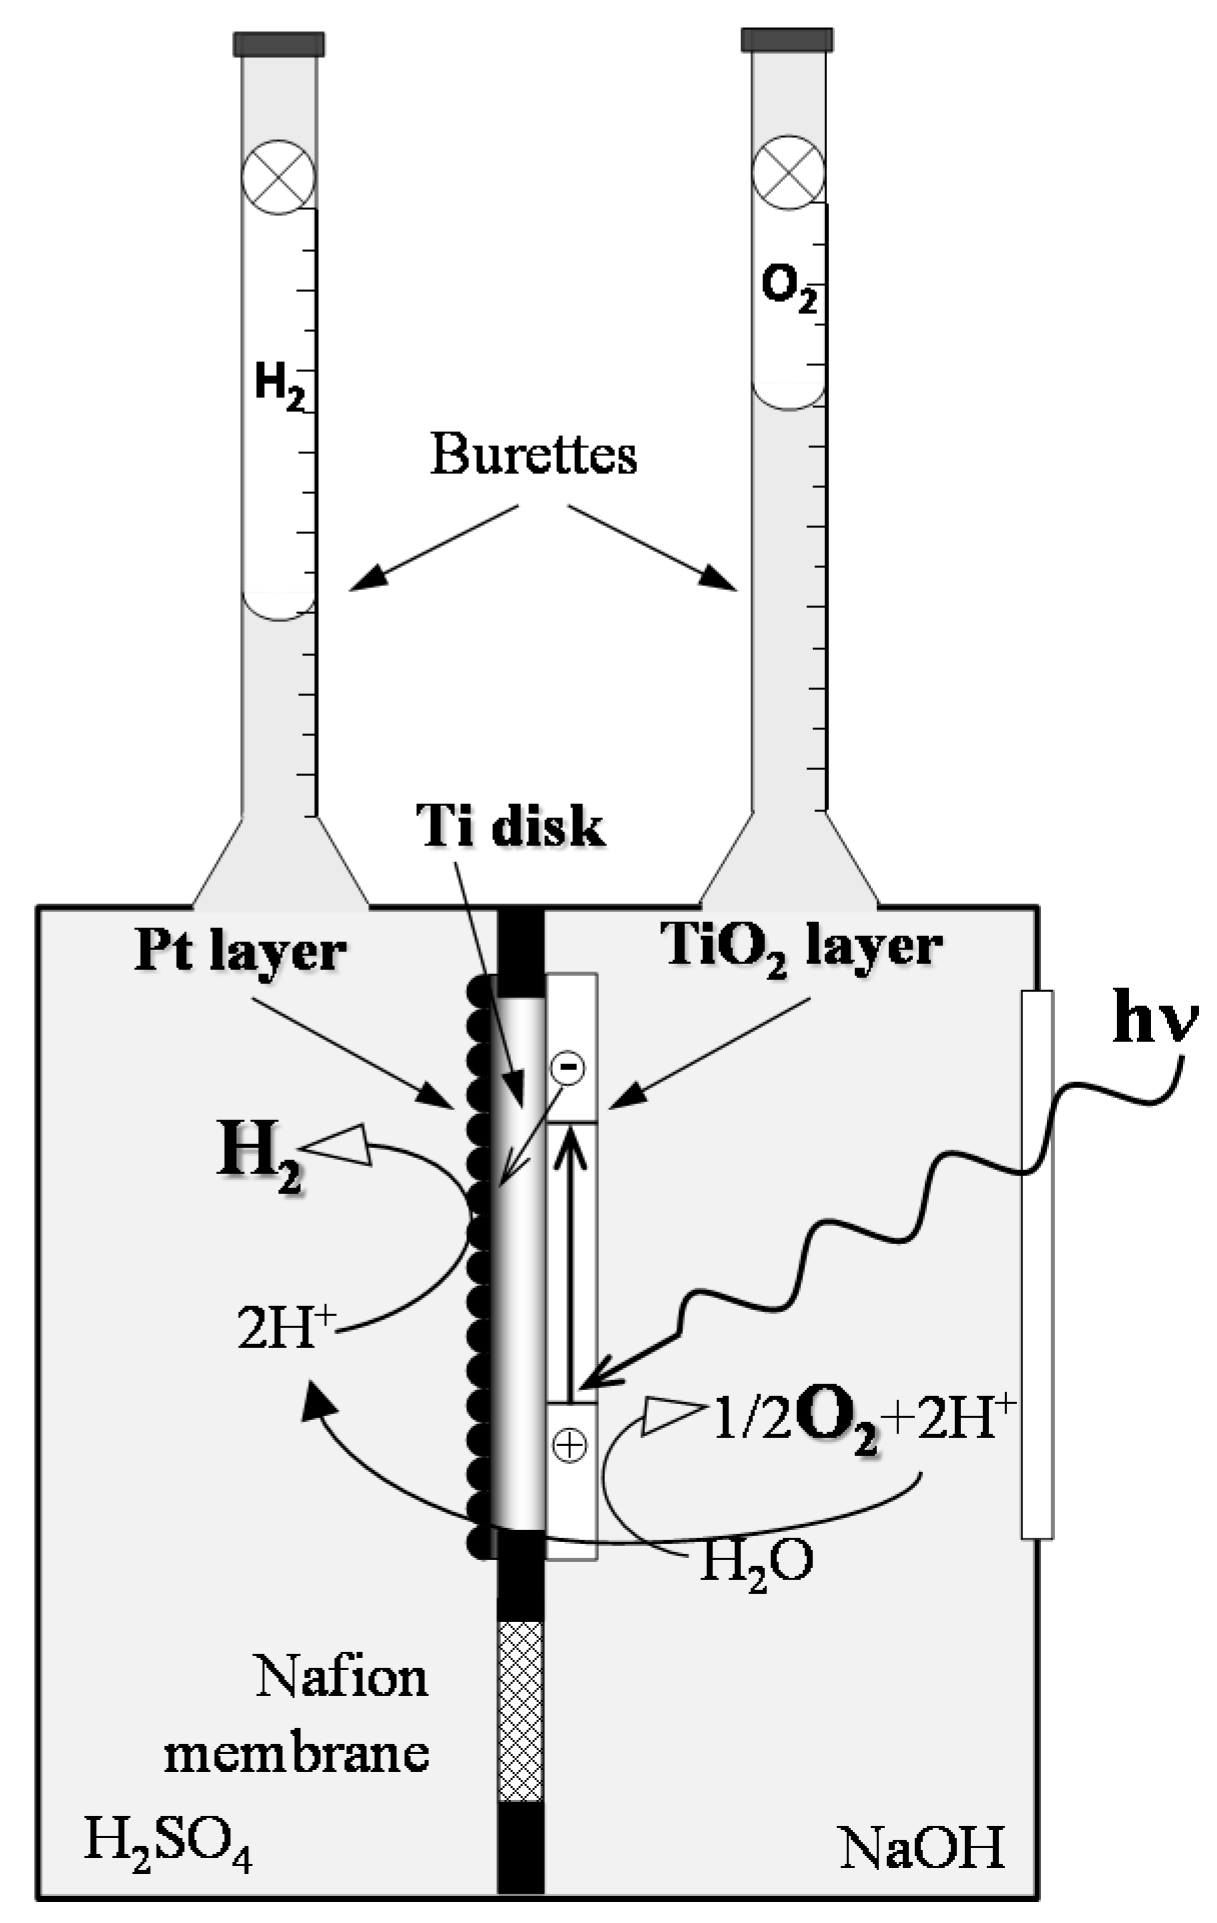
2.4. Separate H2 and O2 Photocatalytic Production Tests

The thus-obtained photoelectrodes were tested in a two-compartment photocatalytic Plexiglas cell, including a Pyrex glass optical window, which allows the separate evolution of pure hydrogen and oxygen from the aqueous solutions contained in the two compartments (Figure 1).
The cell has been fully described elsewhere [4]. The photoactive electrode was placed within the frame separating the two compartments, which were filled with 1.0 M NaOH and 0.5 M H2SO4 aqueous solutions, so that the illuminated anodic oxide coating was in contact with the alkaline solution, whereas the cathodic Pt-coated side of the titanium disk faced the acidic solution. Thus, a chemical bias was produced to assist the transfer of photopromoted electrons from the TiO2 film toward the Pt-coated side of the photoelectrode (Figure 1). The two solutions were separated by a Nafion 117 cation exchange membrane placed below the photoelectrode.
During irradiation, the evolved gases were collected into the two upside-down graduated burettes surmounting each cell compartment. The amounts of H2 and O2 were determined from the displacement of the solutions within each burette. The composition of the evolved gases was determined by gas-chromatographic analysis, after having sampled them with a gas-tight syringe. The irradiation source, which was switched on 15 min prior to the beginning of the runs, was a UV-vis iron halogenide mercury arc lamp (HG200, 250 W, Jelosil, Vimodrone, Italy) emitting in the 350 nm < λ < 450 nm range, with a full irradiation power density on the sample of ca. 19.7 mW·cm−2. The emission spectrum of the lamp was measured with a compact CCD (charge-coupled device) spectrometer (CCS100, Thorlabs, Newton, NJ, USA).

3. Results and Discussion

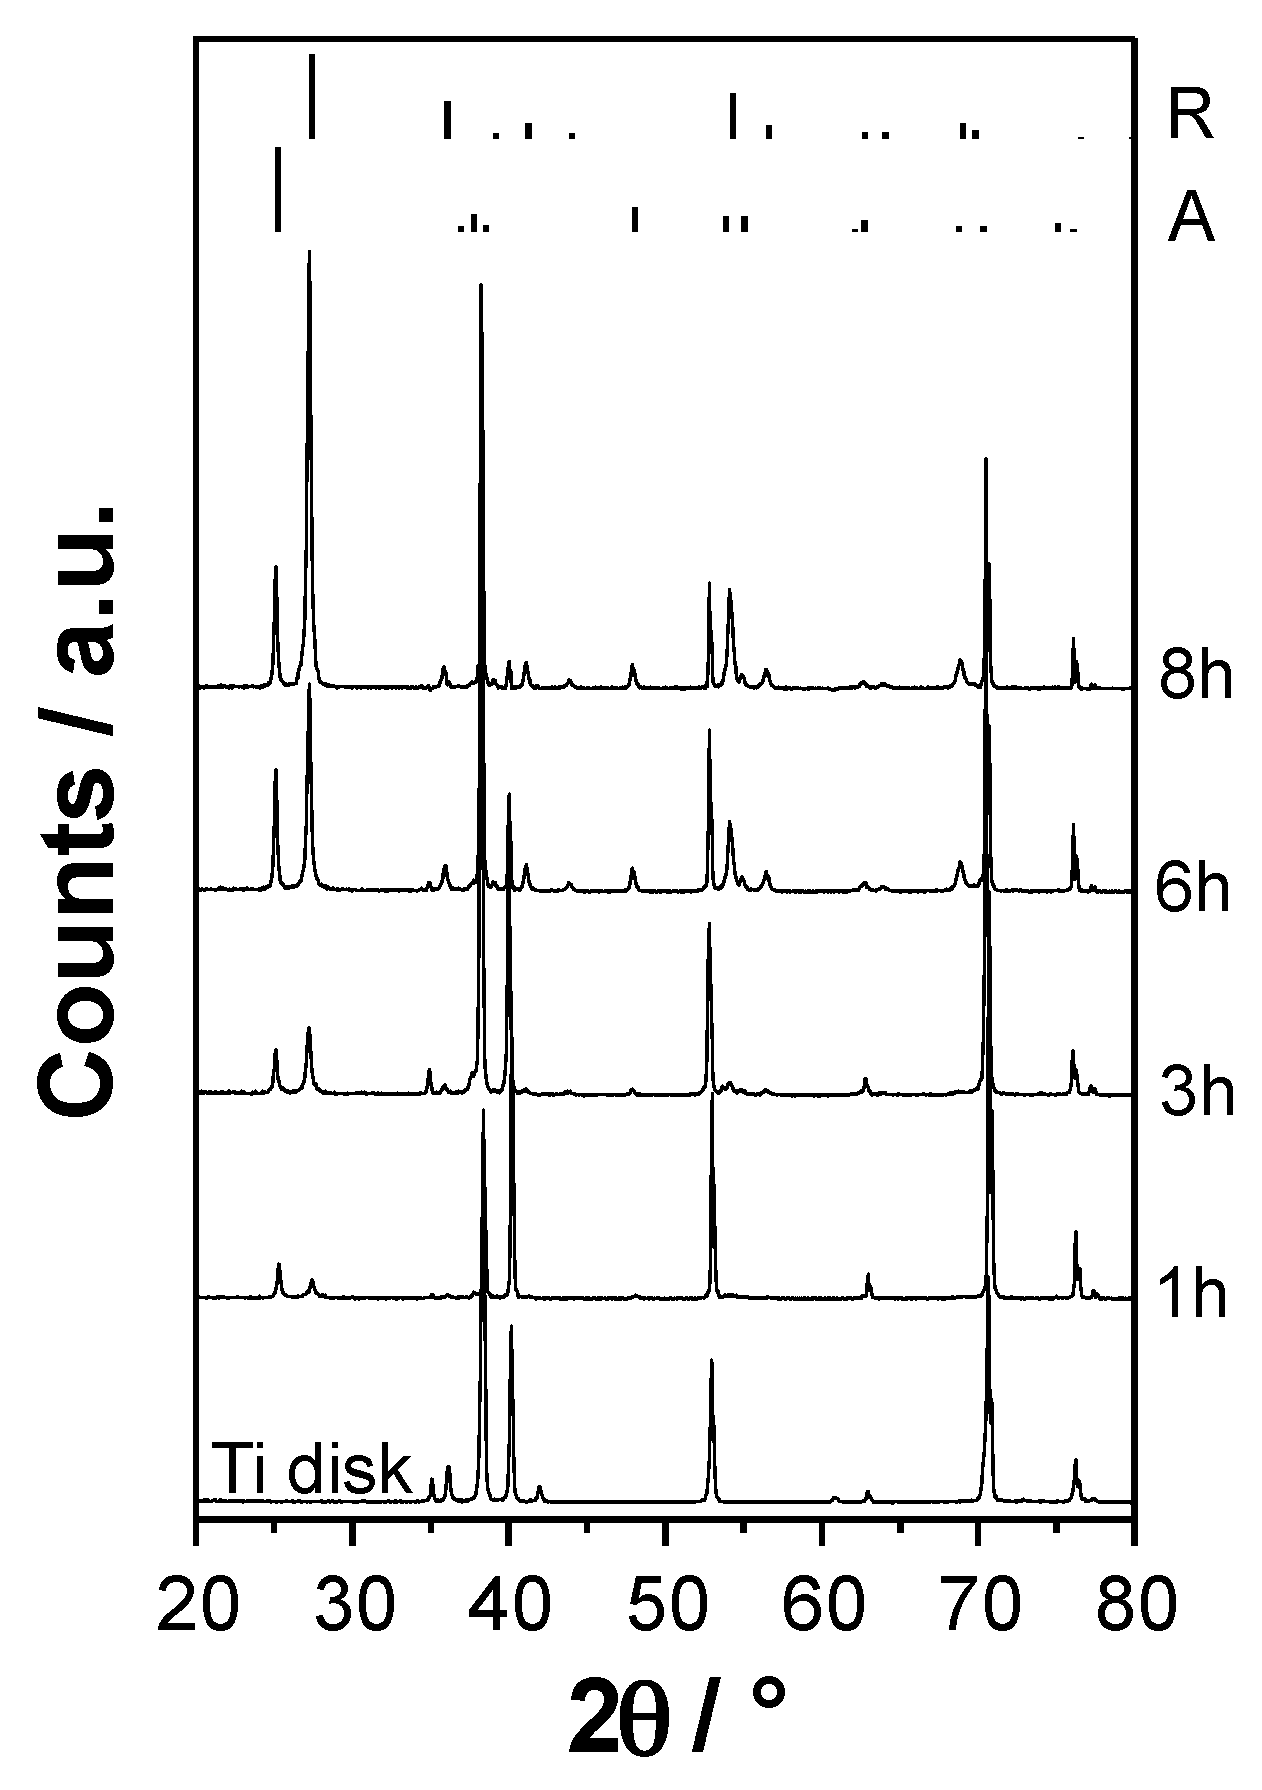
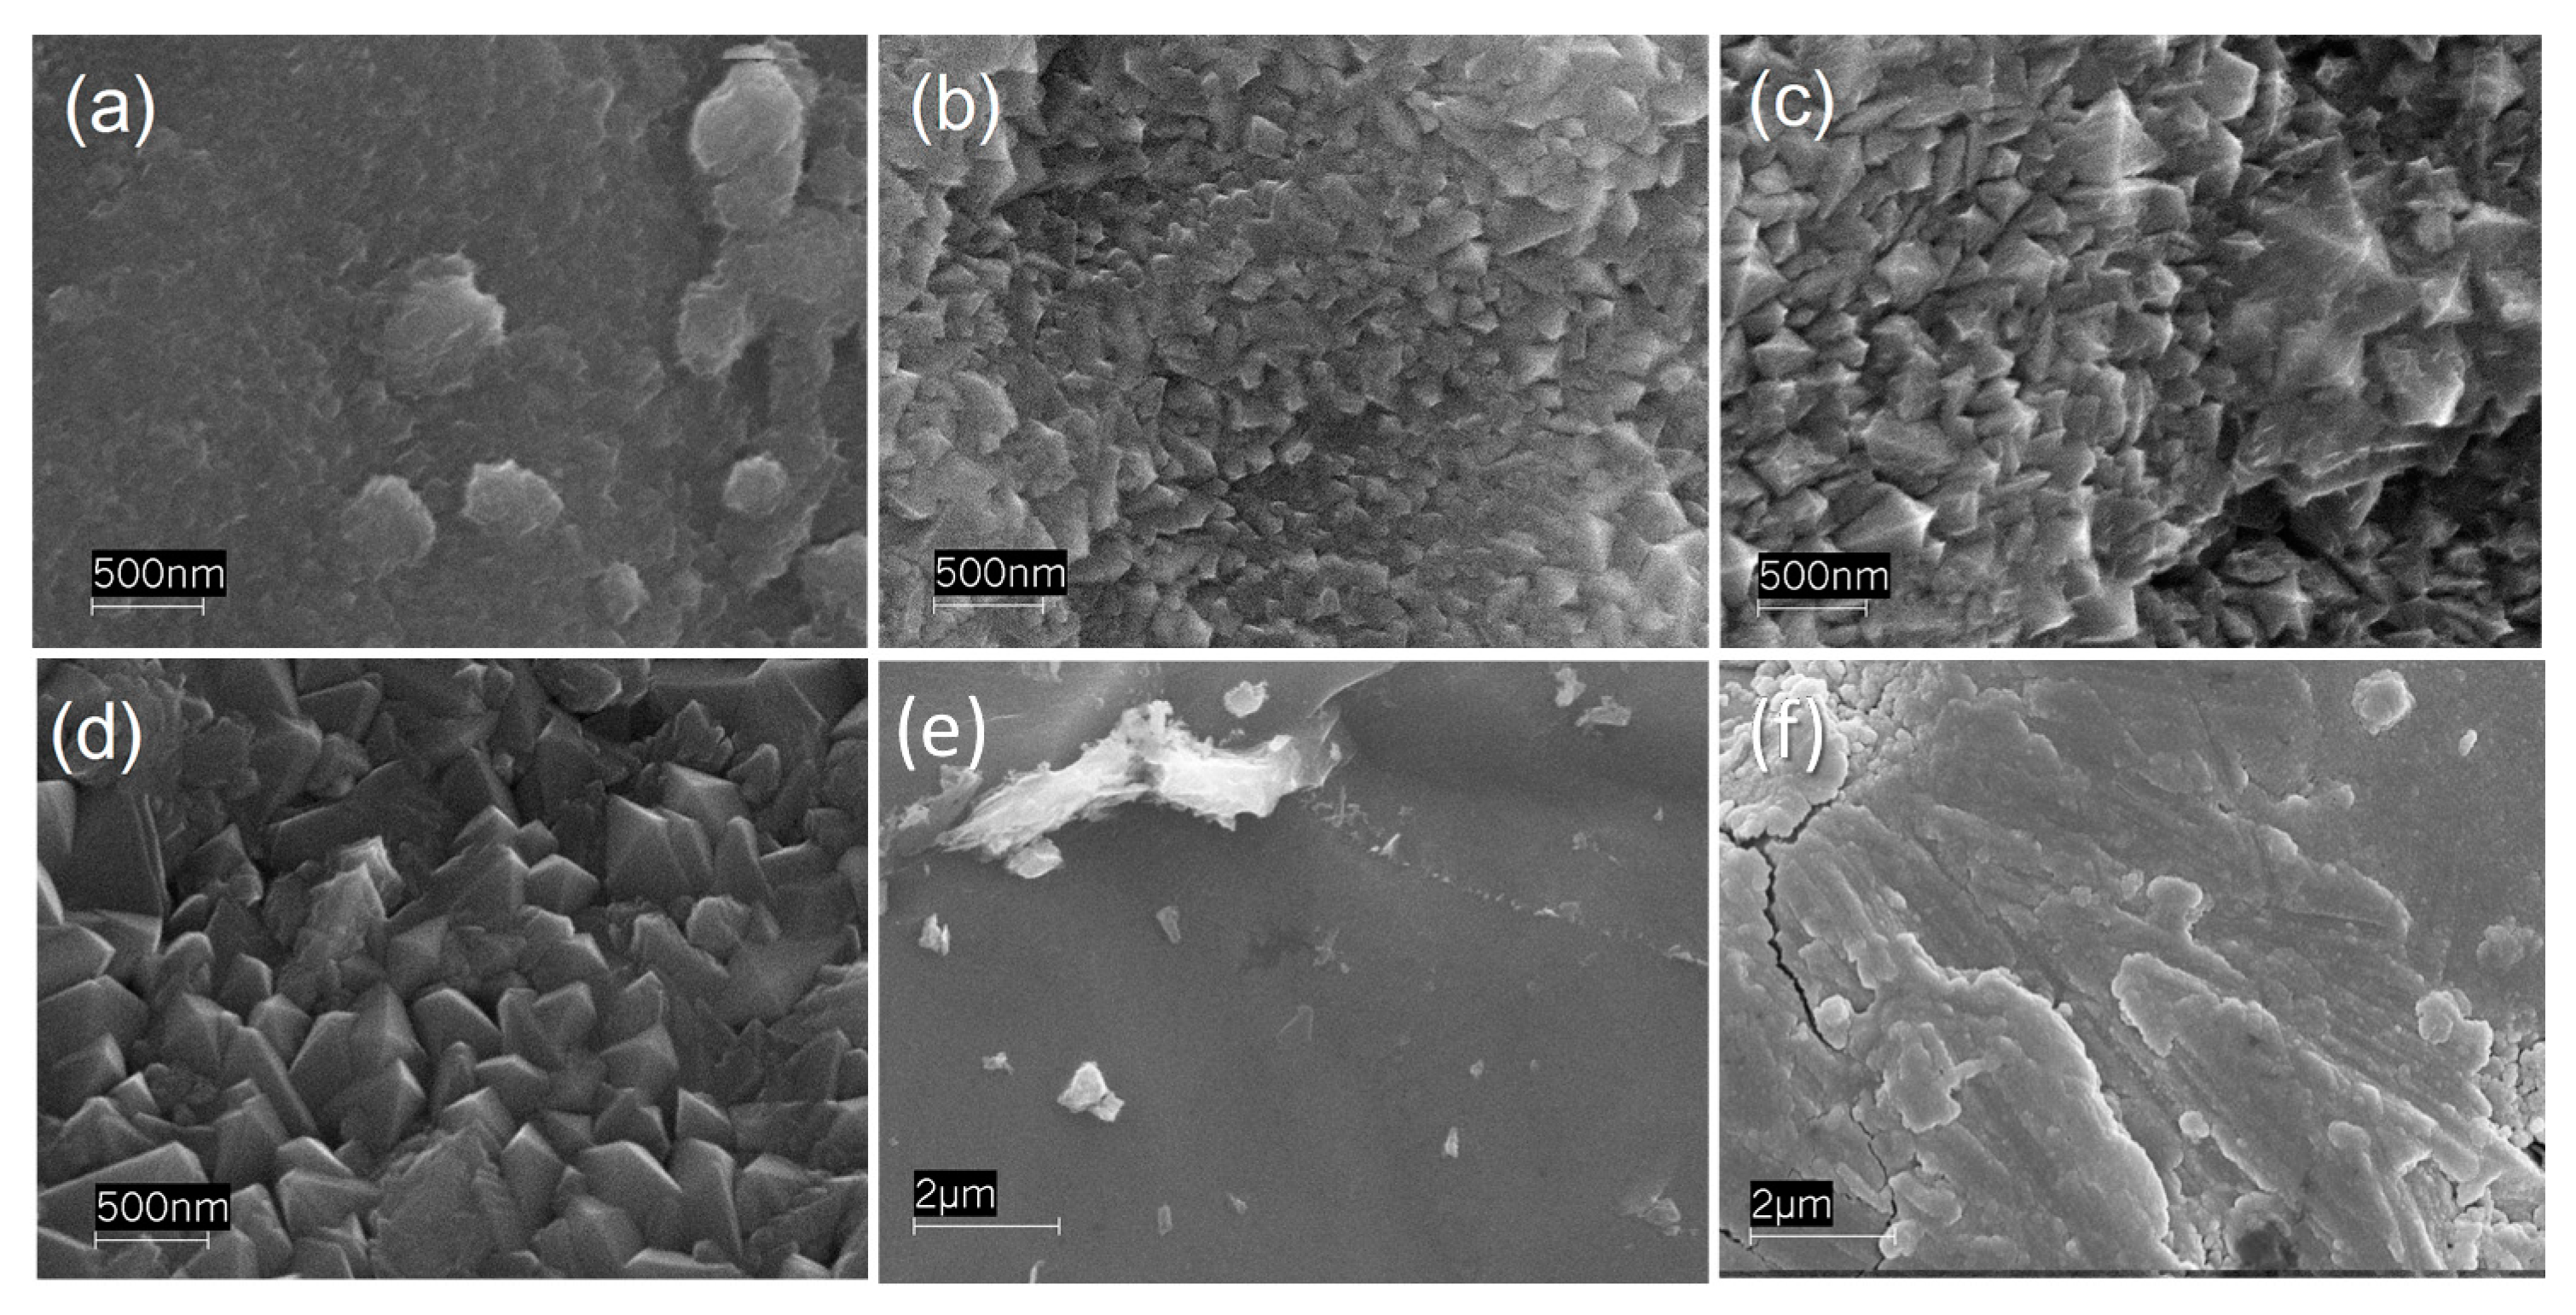
3.1. XRD and SEM Investigation

Figure 2 shows the XRD patterns of the investigated TiO2 films deposited in pure Ar at the same substrate temperature (600 °C) for different deposition times (1, 3, 6 and 8 h) together with that of the pristine metal Ti disk.
All RF magnetron sputtered coatings were composed of a mixture of anatase and rutile. The intensity of the main reflections of the two phases (2θ ca. 25° and ca. 27.5° for anatase and rutile, respectively) increased with an increase in the deposition time, while those of the metal Ti support decreased because of the growth of the TiO2 film thickness. The sample obtained after 1 h deposition was composed of ca. 54% anatase and 46% rutile, whereas the amount of rutile increased to ca. 70% for longer deposition time (Table 1). No evidence of the brookite polymorph was ever detected. A similar phase composition has been previously reported for coatings prepared by RF magnetron sputtering at a substrate temperature of 600 °C and Ar pressure of 2.0 Pa [12]. Moreover, the relative intensity of the reflection of the rutile phase at 2θ = 27.5° (corresponding to the (110) reflection) with respect to those at 2θ = 36.1° (101) and 2θ = 54.3° (211) is much larger compared to the reference one reported on top of Figure 2. This suggests that, during the sputtering process, the particles grow along a preferred orientation on the Ti support.
The surface morphology of the films was analyzed by SEM. The sample prepared after 1 h-long deposition (Figure 3a) shows a relatively smooth surface with some irregularities mostly arising from the Ti substrate underneath (Figure 3e).
By contrast, well defined TiO2 particles with pyramidal shape form after longer deposition time. During the evaporation process, the sputtered atoms, possessing relatively high kinetic energy, gradually add to the crystals growing on the substrate. According to the Wulff construction principle [24], the crystals assume the most thermodynamically stable shape in order to minimize the surface energy. Both anatase [24,25] and rutile [26] single crystals show a pyramidal shape.
Finally, the SEM images show that the particle size, and consequently the surface roughness, considerably increases from some tens to some hundreds of nanometers with an increase of the deposition time. Thus, the deposition time affects not only the thickness of the TiO2 film, but also its surface morphology, particle size and crystallinity.

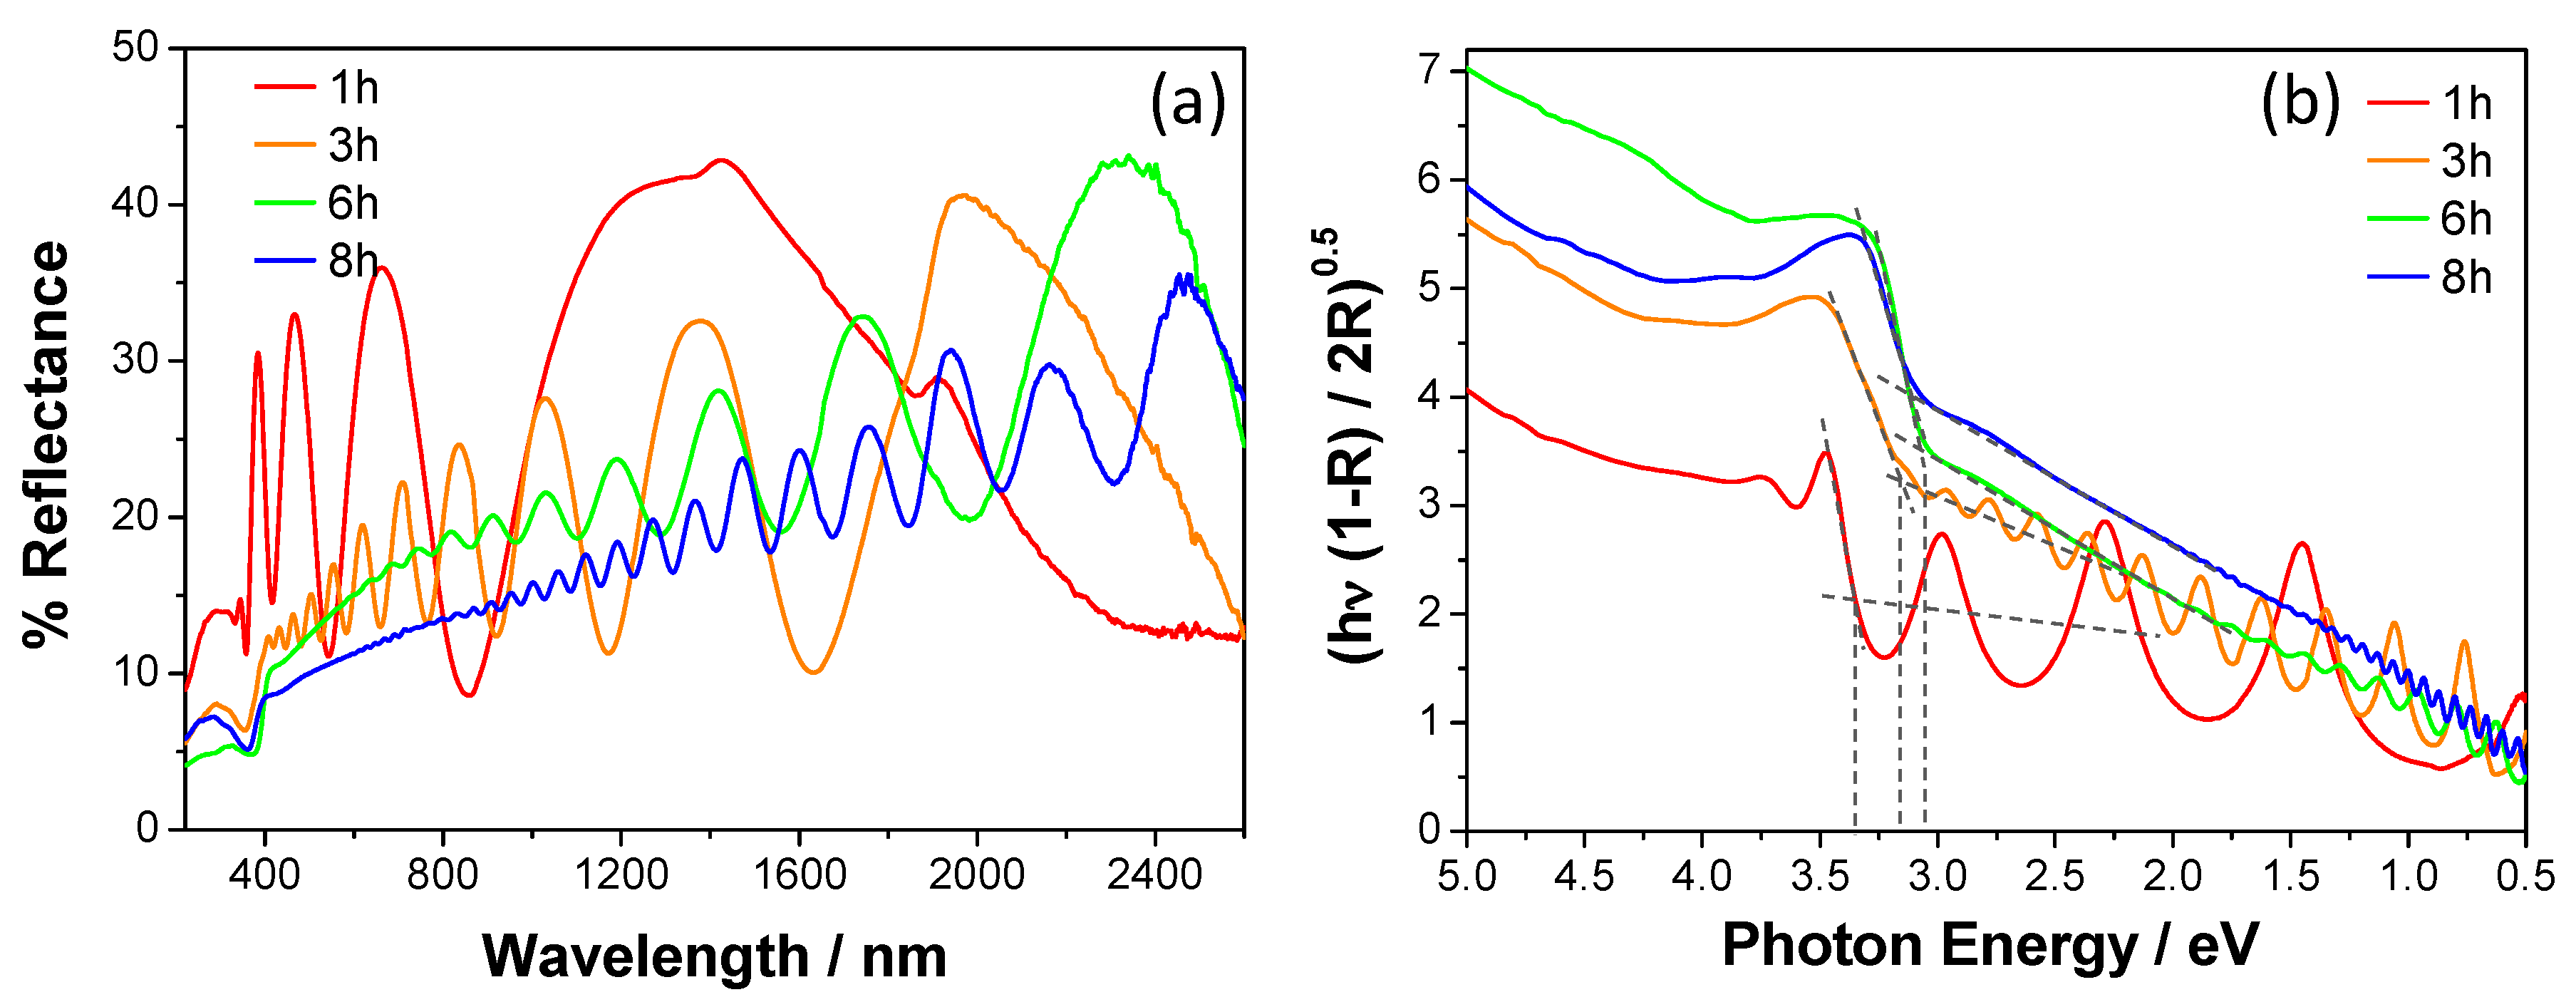
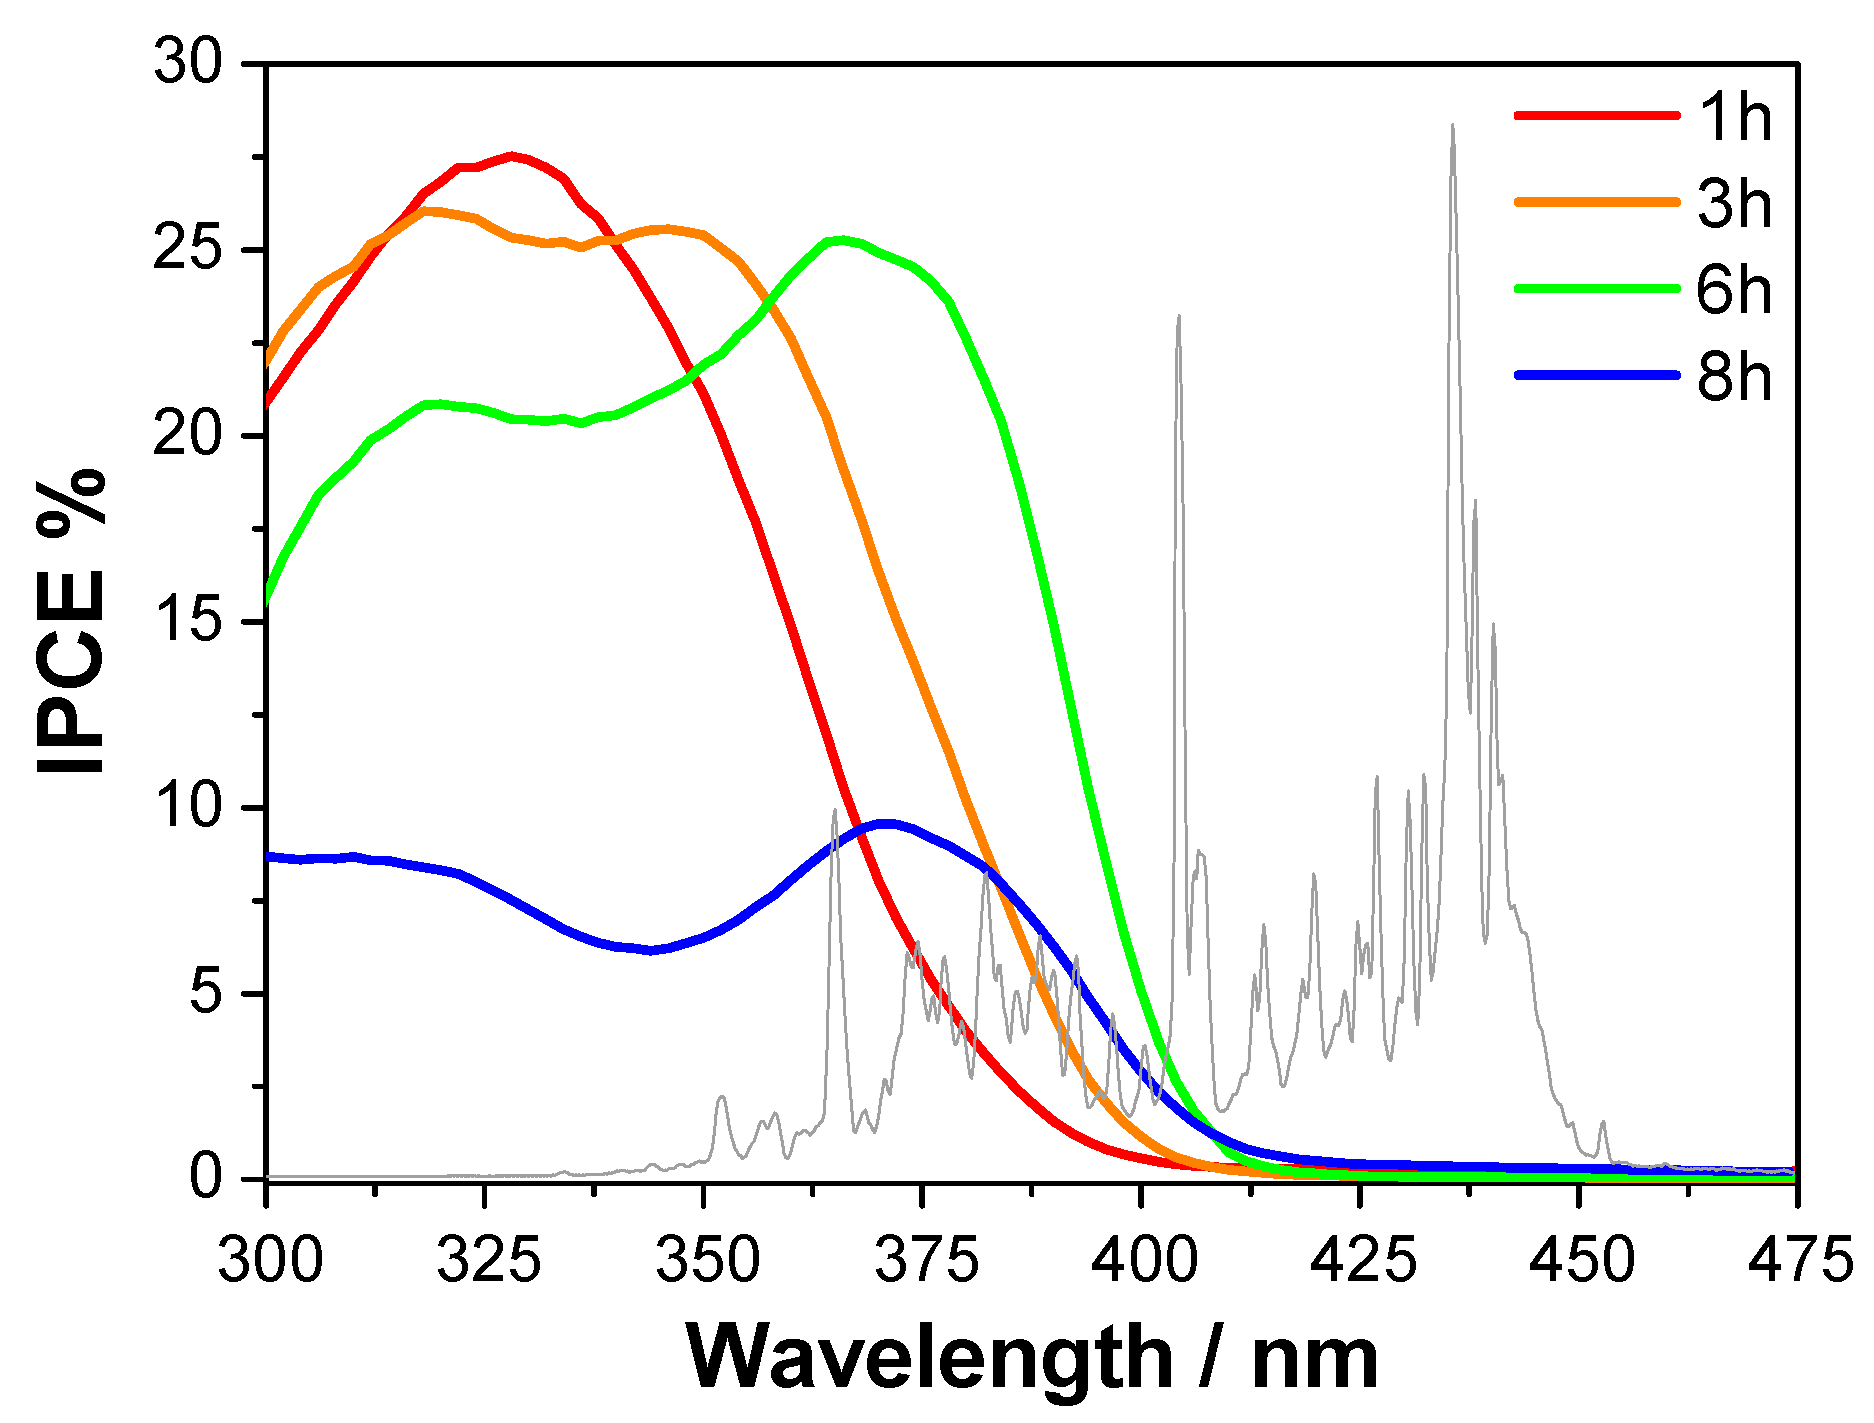
3.2. UV-vis-NIR Diffuse Reflectance and IPCE Measurements

The UV-vis-NIR DRS spectra of all investigated samples exhibit the interference fringes typical of thin films in the vis-NIR region (Figure 4). These fringes originate from the interference of the waves reflected by the upper surface with those penetrating the film and reflected by the bottom surface. The frequency and the amplitude of the fringes depend on the film thickness. In particular, Figure 4 shows that the frequency increases and the amplitude decreases with an increase in the deposition time of the coatings (i.e., an increase in the film thickness). The fringes are expected to vanish for very thick films, depending on the penetration depth of the incident light through the film itself.
The interference fringes are relevant in the characterization of thin films because they allow the evaluation of the film thickness [5]. In this work, we have used a dedicated tool of the spectrophotometer software and the obtained values are collected in Table 1. As expected, the thickness linearly increases as a function of the deposition time with a growth rate of ca. 350 nm·h−1.
The semiconductor absorption edges of the films are located below 420 nm. The band gap can be calculated from the Kubelka-Munk transform spectra (Figure 4b). This is usually done by taking the value at the intersection between a straight line interpolating the absorption edge and the abscissa axis, reporting the photon energy. However, the investigated films possess a very low reflectance in the vis-NIR region that linearly decreases towards lower wavelengths, likely due to the surface roughness of the films and the presence of the interference fringes. Consequently, all spectra appear shifted at higher [f(R)hν]0.5 values. Thus, band gap values have been here evaluated as the photon energy value at the crossing point between the straight line interpolating the portion of the spectrum at energy lower than the absorption edge (i.e., the background) and the straight line interpolating the absorption edge (see dotted lines in Figure 4b). The band gap of bulk anatase and rutile notoriously are 3.2 eV and 3.0 eV, respectively. However, slightly larger values have been obtained for the coatings prepared after 1 h-long (3.30 eV) and 3 h-long (3.18 eV) deposition, despite of their high rutile content, whereas the same band gap of 3.05 eV has been obtained for those prepared by 6 h- and 8 h-long deposition, in line with the band gap of bulk rutile. It is known that the band gap of a semiconductor material can be affected by the particle size due to the confinement of the movement of electrons. The XRD and SEM investigations revealed that the deposition time affects not only the film thickness but also the crystal size. Thus, the unexpected larger band gap values of the two thinner TiO2 coatings (i.e., 1 h- and 3 h-long deposited films) can be attributed to the size quantization effects that can widen the semiconductor band gap (i.e., blue shift the absorption threshold) of small nanoparticles [27,28,29].
The IPCE curves (Figure 5) show that the photoactivity threshold of the investigated series of samples progressively red-shifts with an increase in the coating thickness, in agreement with the calculated band gaps. In particular, the films prepared after 6 h- and 8 h-long deposition exhibit photoactivity above 390 nm, i.e., in the visible region.
Two efficiency maxima can be distinguished in the IPCE curves, whereas curves measured on films of pure anatase or pure rutile usually show a single maximum (e.g., [5]). Thus, the first IPCE maximum, located around 325 nm, can be attributed to the anatase phase, while the second one, located at longer wavelengths (it appears as a shoulder in the 1 h-long deposited sample) can be attributed to the rutile phase. The latter maximum red-shifts together with the photoactivity edge.
It is interesting to note that the maximum IPCE is only partially related to the film thickness. Indeed, the first three photoelectrodes (deposition time ≤ 6 h) reach similar maximum efficiency values up to 27.5%, whereas IPCE considerably drops below 10% for the thickest one. In fact, increasing the semiconductor film thickness might lead to an increase in the fraction of the absorbed incident photons up to a boundary limit. On the other hand, the thicker the film is, the longer the electron transfer path is, with the consequent increase of electron-hole recombination probability. This latter phenomenon explains the sudden efficiency drop of the 8 h-long deposited sample.

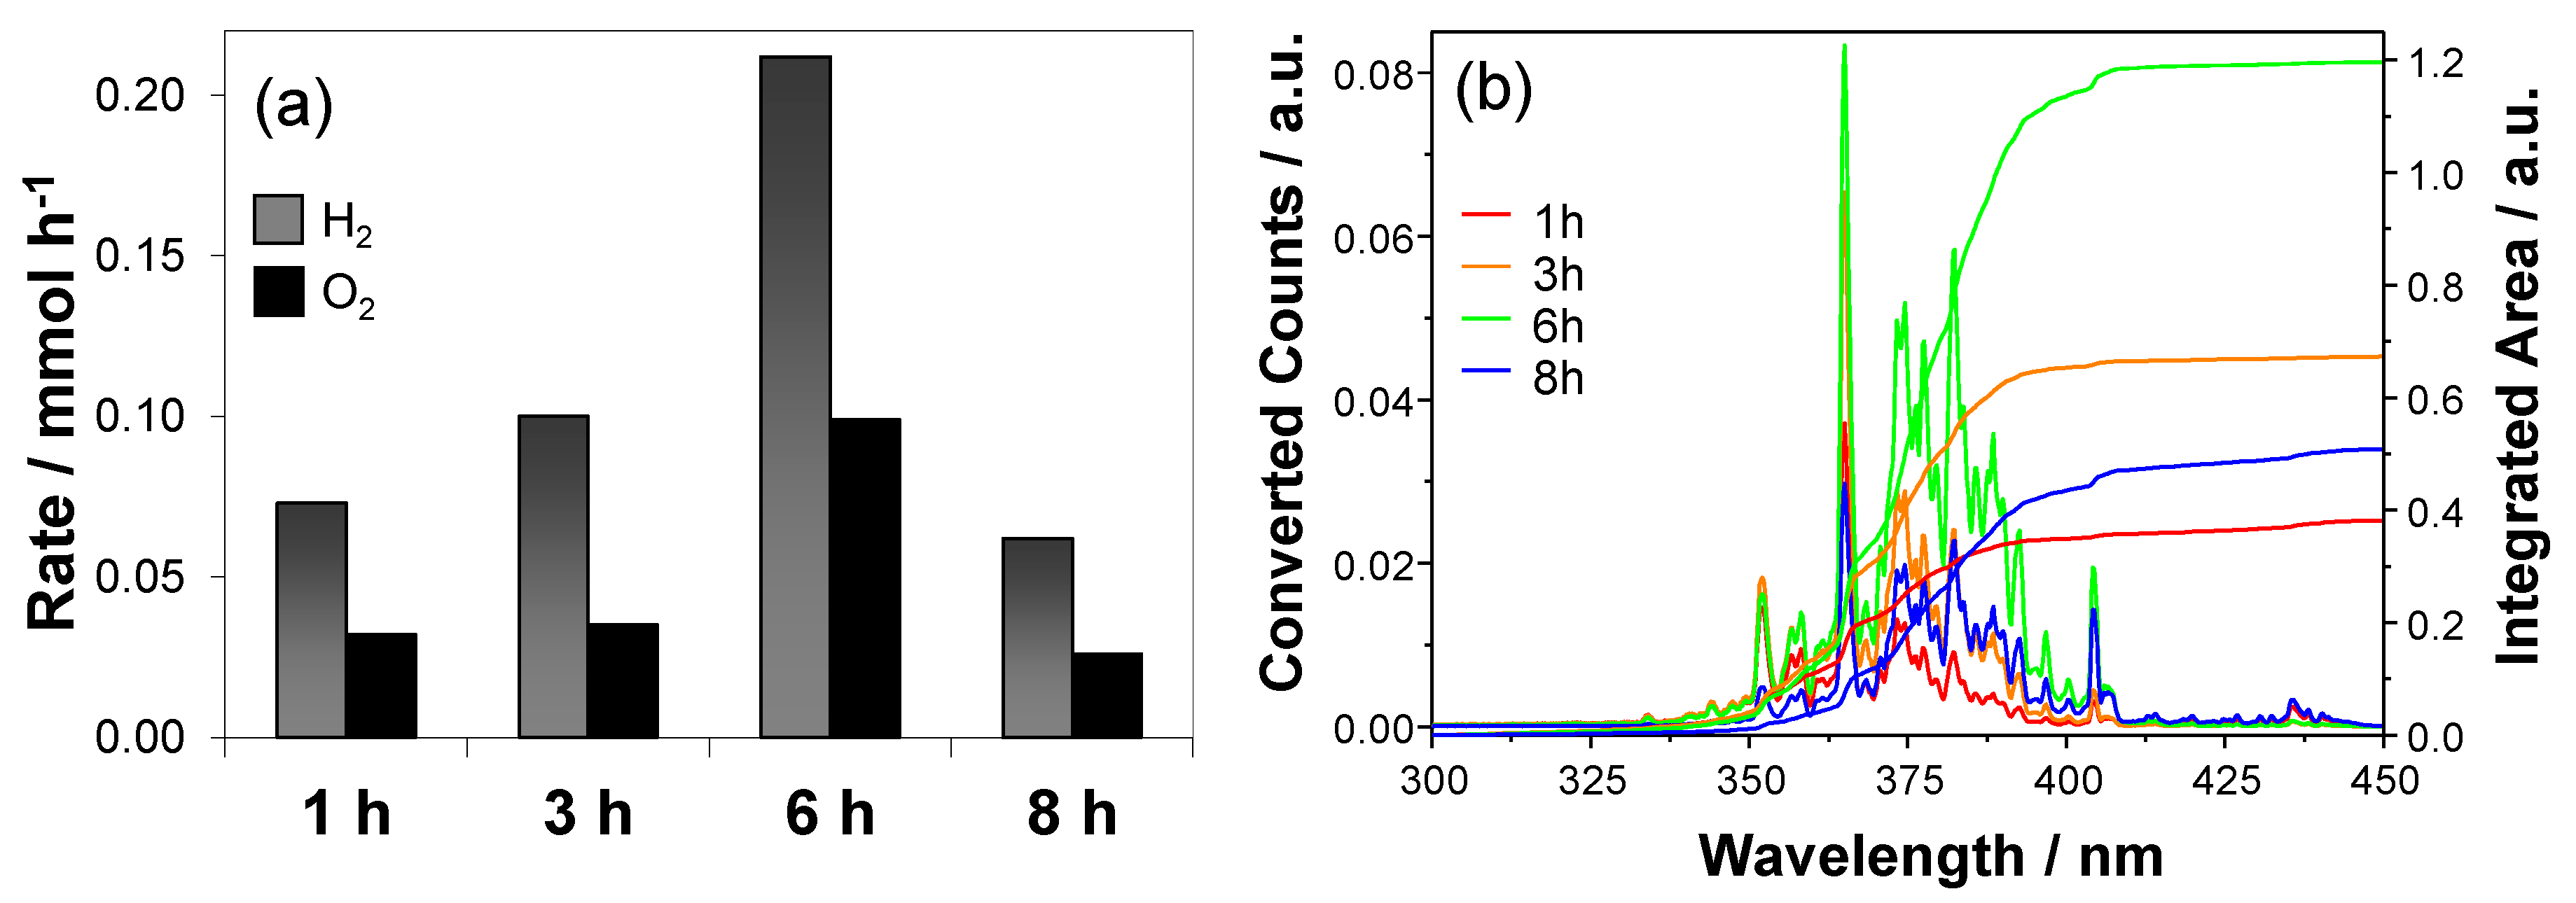
3.3. Photocatalytic Water Splitting Test

The photocatalytic activity under polychromatic irradiation is strictly related to the IPCE curve, the emission spectrum of the light source, the incident power, and, in this case, the chemical bias (i.e., the ΔpH between the two compartments of the photocatalytic cell).
Hydrogen and oxygen evolution occurred at a constant rate during irradiation, according to a pseudo zero order kinetics. The production rates obtained with the investigated series of photoelectrodes are listed in Table 2 and shown in Figure 6a.
As expected by the IPCE curves, the photocatalytic performance increased with an increase of the film thickness, reaching a maximum with the sample prepared after 6-h long deposition (0.21 mmolH2·h−1, corresponding to ca. 5.3 NL h−1 per square meter of irradiated photoelectrode area) and then dropped for the thickest film. The increase of hydrogen production rate, rH2, with increasing film thickness is clearly paralleled by a progressive red shift of the IPCE curves that allows the absorption and conversion of a larger portion of the incident light spectrum, as shown in Figure 6b.
This result is in line with the larger amount of the rutile phase having a narrower band gap with respect to anatase. The evolved hydrogen to oxygen ratio is slightly higher than the stoichiometric value of 2, as already observed and discussed recently [5].
Finally, two different types of photocatalytic efficiency in hydrogen production can be calculated. The first one is the expected efficiency, φexp, calculated from the IPCE curves and the light emission spectrum, as:
φexp = Aconv./Ai.s. × 100
where Aconv. and Ai.s. are the integrated areas of the converted portion (Figure 6b) and of the incident spectrum, respectively.
The second one is the effective efficiency, φeff, i.e., the efficiency in conversion of the incident light power density P (=19.7 mW·cm−2) into chemical energy [6], calculated by the following equation:
ϕ eff = r H 2 × Δ G ° A × P × 100
where ΔG° is the standard Gibbs free energy of the water spitting reaction (237 kJ·mol−1); and A (9.6 cm2) is the irradiated area of the photoelectrode.
The two efficiencies can slightly differ one from the other because φexp is calculated form transient experiment (the IPCE curves are measured while scanning λ), whereas φeff is calculated from the rH2 values obtained under full lamp irradiation. The obtained efficiency values reported in Table 2, are relatively low, in line with the fact that the irradiation source employed in photocatalytic water splitting tests mainly emits in the 400–450 nm range, i.e., above the photoactivity threshold of our samples. Notably, similar efficiency values were obtained for the same sample, although they were calculated from two different experiments and approaches. However, it is interesting to notice that φeff < φexp for samples showing rH2/rO2 > 2.3.

4. Conclusions

This work demonstrates that a more straightforward interpretation of photocatalytic water splitting results can be obtained by comparing them with those of IPCE measurements. In fact, the increase of hydrogen production rate obtained with an increase in the film thickness should not be attributed to an increased photocatalyst amount, but rather to a red-shift in photoactivity threshold in accordance with the increased amount of rutile phase.

Acknowledgments

The authors thank Eliana Quartarone for her skillful help in photoelectrodes preparation and Benedetta Sacchi for SEM analysis. Financial support from Regione Lombardia and Cariplo Foundation (Grant No. 2013-1766) within the SmartMatLab Centre project is gratefully acknowledged.

Author Contributions

Cristina Tealdi prepared the photoelectrodes supervised by Piercarlo Mustarelli; Gian Luca Chiarello and Elena Selli conceived and designed the experiments; Gian Luca Chiarello performed the XRD and UV-vis-NIR DRS analysis and the photocatalytic experiments; Elena Selli contributed to the results discussion; Gian Luca Chiarello wrote the paper.

Conflicts of Interest

The authors declare no conflict of interest.

Abbreviations

The following abbreviations are used in this manuscript:
RFRadio frequency
XRDX-ray diffraction
SEMScanning electron microscopy
DRSDiffuse reflectance spectroscopy
IPCEIncident photon to current efficiency

References

  1. Li, J.; Wu, N. Semiconductor-based photocatalysts and photoelectrochemical cells for solar fuel generation: A review. Catal. Sci. Technol. 2015, 5, 1360–1384. [Google Scholar] [CrossRef]
  2. Lianos, P. Production of electricity and hydrogen by photocatalytic degradation of organic wastes in a photoelectrochemical cell. The concept of the Photofuelcell: A review of a re-emerging research field. J. Hazard. Mater. 2011, 185, 575–590. [Google Scholar] [CrossRef] [PubMed]
  3. Horiuchi, Y.; Toyao, T.; Takeuchi, M.; Matsuoka, M.; Anpo, M. Recent advances in visible-light-responsive photocatalysts for hydrogen production and solar energy conversion—From semiconducting TiO2 to MOF/PCP photocatalysts. Phys. Chem. Chem. Phys. 2013, 15, 13243–13253. [Google Scholar] [CrossRef] [PubMed]
  4. Selli, E.; Chiarello, G.L.; Quartarone, E.; Mustarelli, P.; Rossetti, I.; Forni, L. A photocatalytic water splitting device for separate hydrogen and oxygen evolution. Chem. Commun. 2007, 47, 5022–5024. [Google Scholar]
  5. Chiarello, G.L.; Zuliani, A.; Ceresoli, D.; Martinazzo, R.; Selli, E. Exploiting the photonic crystal properties of TiO2 nanotube arrays to enhance photocatalytic hydrogen production. ACS Catal. 2016, 6, 1345–1353. [Google Scholar] [CrossRef]
  6. Chen, Z.; Jaramillo, T.F.; Deutsch, T.G.; Kleiman-Shwarsctein, A.; Forman, A.J.; Gaillard, N.; Garland, R.; Takanabe, K.; Heske, C.; Sunkara, M.; et al. Accelerating materials development for photoelectrochemical hydrogen production: Standards for methods, definitions, and reporting protocols. J. Mater. Res. 2010, 25, 3–16. [Google Scholar] [CrossRef]
  7. Molinari, R.; Marino, T.; Argurio, P. Photocatalytic membrane reactors for hydrogen production from water. Int. J. Hydrog. Energy 2014, 39, 7247–7261. [Google Scholar] [CrossRef]
  8. Pessoa, R.S.; Fraga, M.A.; Santos, L.V.; Massi, M.; Maciel, H.S. Nanostructured thin films based on TiO2 and/or SiC for use in photoelectrochemical cells: A review of the material characteristics, synthesis and recent applications. Mater. Sci. Semicond. Process. 2014, 29, 56–68. [Google Scholar] [CrossRef]
  9. Liao, C.-H.; Huang, C.-W.; Wu, J.C.S. Novel dual-layer photoelectrode prepared by RF magnetron sputtering for photocatalytic water splitting. Int. J. Hydrog. Energy 2012, 37, 11632–11639. [Google Scholar] [CrossRef]
  10. Tealdi, C.; Quartarone, E.; Galinetto, P.; Grandi, M.S.; Mustarelli, P. Flexible deposition of TiO2 electrodes for photocatalytic applications: Modulation of the crystal phase as a function of the layer thickness. J. Solid State Chem. 2013, 199, 1–6. [Google Scholar] [CrossRef]
  11. Binetti, E.; El Koura, Z.; Patel, N.; Dashora, A.; Miotello, A. Rapid hydrogenation of amorphous TiO2 to produce efficient H-doped anatase for photocatalytic water splitting. Appl. Catal. A Gen. 2014, 500, 69–73. [Google Scholar] [CrossRef]
  12. Ebrahimi, A.; Kitano, M.; Iyatani, K.; Horiuchi, Y.; Takeuchi, M.; Matsuoka, M.; Anpo, M. Effect of the sputtering parameters on the physical properties and photocatalytic reactivity of TiO2 thin films prepared by an RF magnetron sputtering deposition method. Res. Chem. Intermed. 2012, 39, 1593–1602. [Google Scholar] [CrossRef]
  13. Dholam, R.; Patel, N.; Adami, M.; Miotello, A. Hydrogen production by photocatalytic water-splitting using Cr- or Fe-doped TiO2 composite thin films photocatalyst. Int. J. Hydrog. Energy 2009, 34, 5337–5346. [Google Scholar] [CrossRef]
  14. Wu, M.; Liu, J.; Jin, J.; Wang, C.; Huang, S.; Deng, Z.; Li, Y.; Su, B.L. Probing significant light absorption enhancement of titania inverse opal films for highly exalted photocatalytic degradation of dye pollutants. Appl. Catal. B Environ. 2014, 150–151, 411–420. [Google Scholar] [CrossRef]
  15. El Koura, Z.; Patel, N.; Edla, R.; Miotello, A. Multilayer films of indium tin oxide/TiO2 codoped with vanadium and nitrogen for efficient photocatalytic water splitting. Int. J. Nanotechnol. 2014, 11, 1017–1027. [Google Scholar] [CrossRef]
  16. Rahman, M.; Dang, B.H.Q.; McDonnell, K.; MacElroy, J.M.D.; Dowling, D.P. Effect of doping (C or N) and co-doping (C + N) on the photoactive properties of magnetron sputtered titania coatings for the application of solar water-splitting. J. Nanosci. Nanotechnol. 2012, 12, 4729–4735. [Google Scholar] [CrossRef] [PubMed]
  17. Wang, C.; Hu, Q.Q.; Huang, J.Q.; Deng, Z.H.; Shi, H.L.; Wu, L.; Liu, Z.G.; Cao, Y.G. Effective water splitting using N-doped TiO2 films: Role of preferred orientation on hydrogen production. Int. J. Hydrog. Energy 2014, 39, 1967–1971. [Google Scholar] [CrossRef]
  18. Fakhouri, H.; Pulpytel, J.; Smith, W.; Zolfaghari, A.; Mortaheb, H.R.; Meshkini, F.; Jafari, R.; Sutter, E.; Arefi-Khonsari, F. Control of the visible and UV light water splitting and photocatalysis of nitrogen doped TiO2 thin films deposited by reactive magnetron sputtering. Appl. Catal. B Environ. 2014, 144, 12–21. [Google Scholar] [CrossRef]
  19. Kitano, M.; Iyatani, K.; Tsujimaru, K.; Matsuoka, M.; Takeuchi, M.; Ueshima, M.; Thomas, J.M.; Anpo, M. The effect of chemical etching by HF solution on the photocatalytic activity of visible light-responsive TiO2 thin films for solar water splitting. Top. Catal. 2008, 49, 24–31. [Google Scholar] [CrossRef]
  20. Matsuoka, M.; Kitano, M.; Fukumoto, S.; Iyatani, K.; Takeuchi, M.; Anpo, M. The effect of the hydrothermal treatment with aqueous NaOH solution on the photocatalytic and photoelectrochemical properties of visible light-responsive TiO2 thin films. Catal. Today 2008, 132, 159–164. [Google Scholar] [CrossRef]
  21. Rietveld, H.M. A profile refinement method for nuclear and magnetic structures. J. Appl. Crystallogr. 1969, 2, 65–71. [Google Scholar] [CrossRef]
  22. Bish, D.L.; Howard, S.A. Quantitative phase analysis using the Rietveld method. J. Appl. Crystallogr. 1988, 21, 86–91. [Google Scholar] [CrossRef]
  23. Altomare, A.; Burla, M.C.; Giacovazzo, C.; Guagliardi, A.; Moliterni, A.G.G.; Polidori, G.; Rizzi, R. Quanto: A Rietveld program for quantitative phase analysis of polycrystalline mixtures. J. Appl. Crystallogr. 2001, 34, 392–397. [Google Scholar] [CrossRef]
  24. Lazzeri, M.; Vittadini, A.; Selloni, A. Structure and energetics of stoichiometric TiO2 anatase surfaces. Phys. Rev. B 2001, 63. [Google Scholar] [CrossRef]
  25. Barnard, A.S.; Curtiss, L.A. Prediction of TiO2 nanoparticle phase and shape transitions controlled by surface chemistry. Nano Lett. 2005, 5, 1261–1266. [Google Scholar] [CrossRef] [PubMed]
  26. Ramamoorthy, M.; Vanderbilt, D.; King-Smith, R.D. First-principles calculations of the energetics of stoichiometric TiO2 surfaces. Phys. Rev. B 1994, 49, 16721–16727. [Google Scholar] [CrossRef]
  27. Kormann, C.; Bahnemann, D.W.; Hoffmann, M.R. Preparation and characterization of quantum-size titanium dioxide. J. Phys. Chem. 1988, 92, 5196–5201. [Google Scholar] [CrossRef]
  28. Chiarello, G.L.; Di Paola, A.; Palmisano, L.; Selli, E. Effect of titanium dioxide crystalline structure on the photocatalytic production of hydrogen. Photochem. Photobiol. Sci. 2011, 10, 355–360. [Google Scholar] [CrossRef] [PubMed] [Green Version]
  29. Ekimov, A.I.; Efros, A.L.; Onushchenko, A.A. Quantum size effect in semiconductor microcrystals. Solid State Commun. 1985, 56, 921–924. [Google Scholar] [CrossRef]
Figure 1. Schematic representation of the two-compartment photocatalytic cell.
Materials 09 00279 g001
Figure 2. XRD patterns of the pristine Ti disk and of the TiO2 coatings grown for different deposition time (1, 3, 6, and 8 h). The peak positions and relative intensities of the anatase (A) and rutile (R) phases are reported at the top of the figure for comparison.
Materials 09 00279 g002
Figure 3. SEM images of TiO2 coatings prepared by radio frequency (RF) magnetron sputtering with (a) 1 h; (b) 3 h; (c) 6 h; and (d) 8 h deposition times; (e) Surface of the bare metal Ti disk surface; and (f) Pt film deposited on the back side of the titanium disk.
Materials 09 00279 g003
Figure 4. UV-vis-NIR diffuse reflectance spectra of the TiO2 coatings on a metal Ti disk for different deposition time. (a) Percent reflectance vs. wavelength spectra; and (b) corresponding Kubelka-Munk transform used for band gap calculation.
Materials 09 00279 g004
Figure 5. Effect of the deposition time on the incident photon to current efficiency (IPCE) curves of the TiO2-based photoelectrodes as a function of the incident wavelength. The emission spectrum of the Hg vapor lamp used as light source in separate H2 and O2 evolution photocatalytic tests is also shown (gray line).
Materials 09 00279 g005
Figure 6. (a) Rate of hydrogen and oxygen production under polychromatic light irradiation obtained with the photoelectrodes obtained with different deposition times; (b) expected portion of converted incident spectrum and corresponding integrated area (calculated as the product of the IPCE curves times the emission spectrum of the light source).
Materials 09 00279 g006
Table 1. Film thickness, crystal phase composition, and band gap of the investigated TiO2 coatings.
Deposition Time (h)Film Thickness (nm) 1Anatase (wt.%)Rutile (wt.%)Band Gap (eV)
132054463.30
3106631693.18
6182330703.05
8303028723.05
1 Calculated by the UV-vis-NIR DRS spectra.
Table 2. Effect of the deposition time on the photocatalytic performance of water splitting.
Deposition Time (h)rH2 (μmol·h−1)rO2 (μmol·h−1)rH2/rO2φexpφeff
172.94 ± 0.0631.62 ± 0.032.32.32.5
3100.15 ± 0.0940.3 ± 0.12.54.03.5
6212.30 ± 0.0398.4 ± 0.12.27.17.3
852.35 ± 0.0821.81 ± 0.052.43.02.2

