
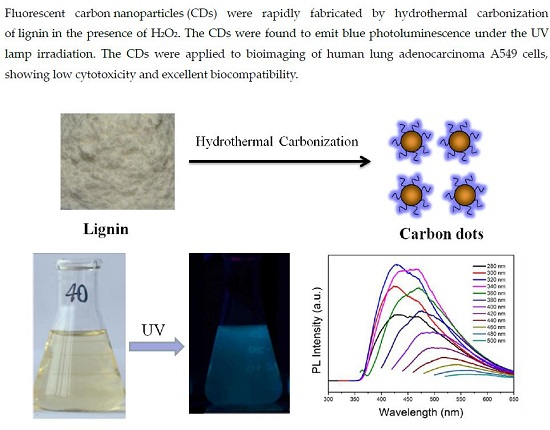
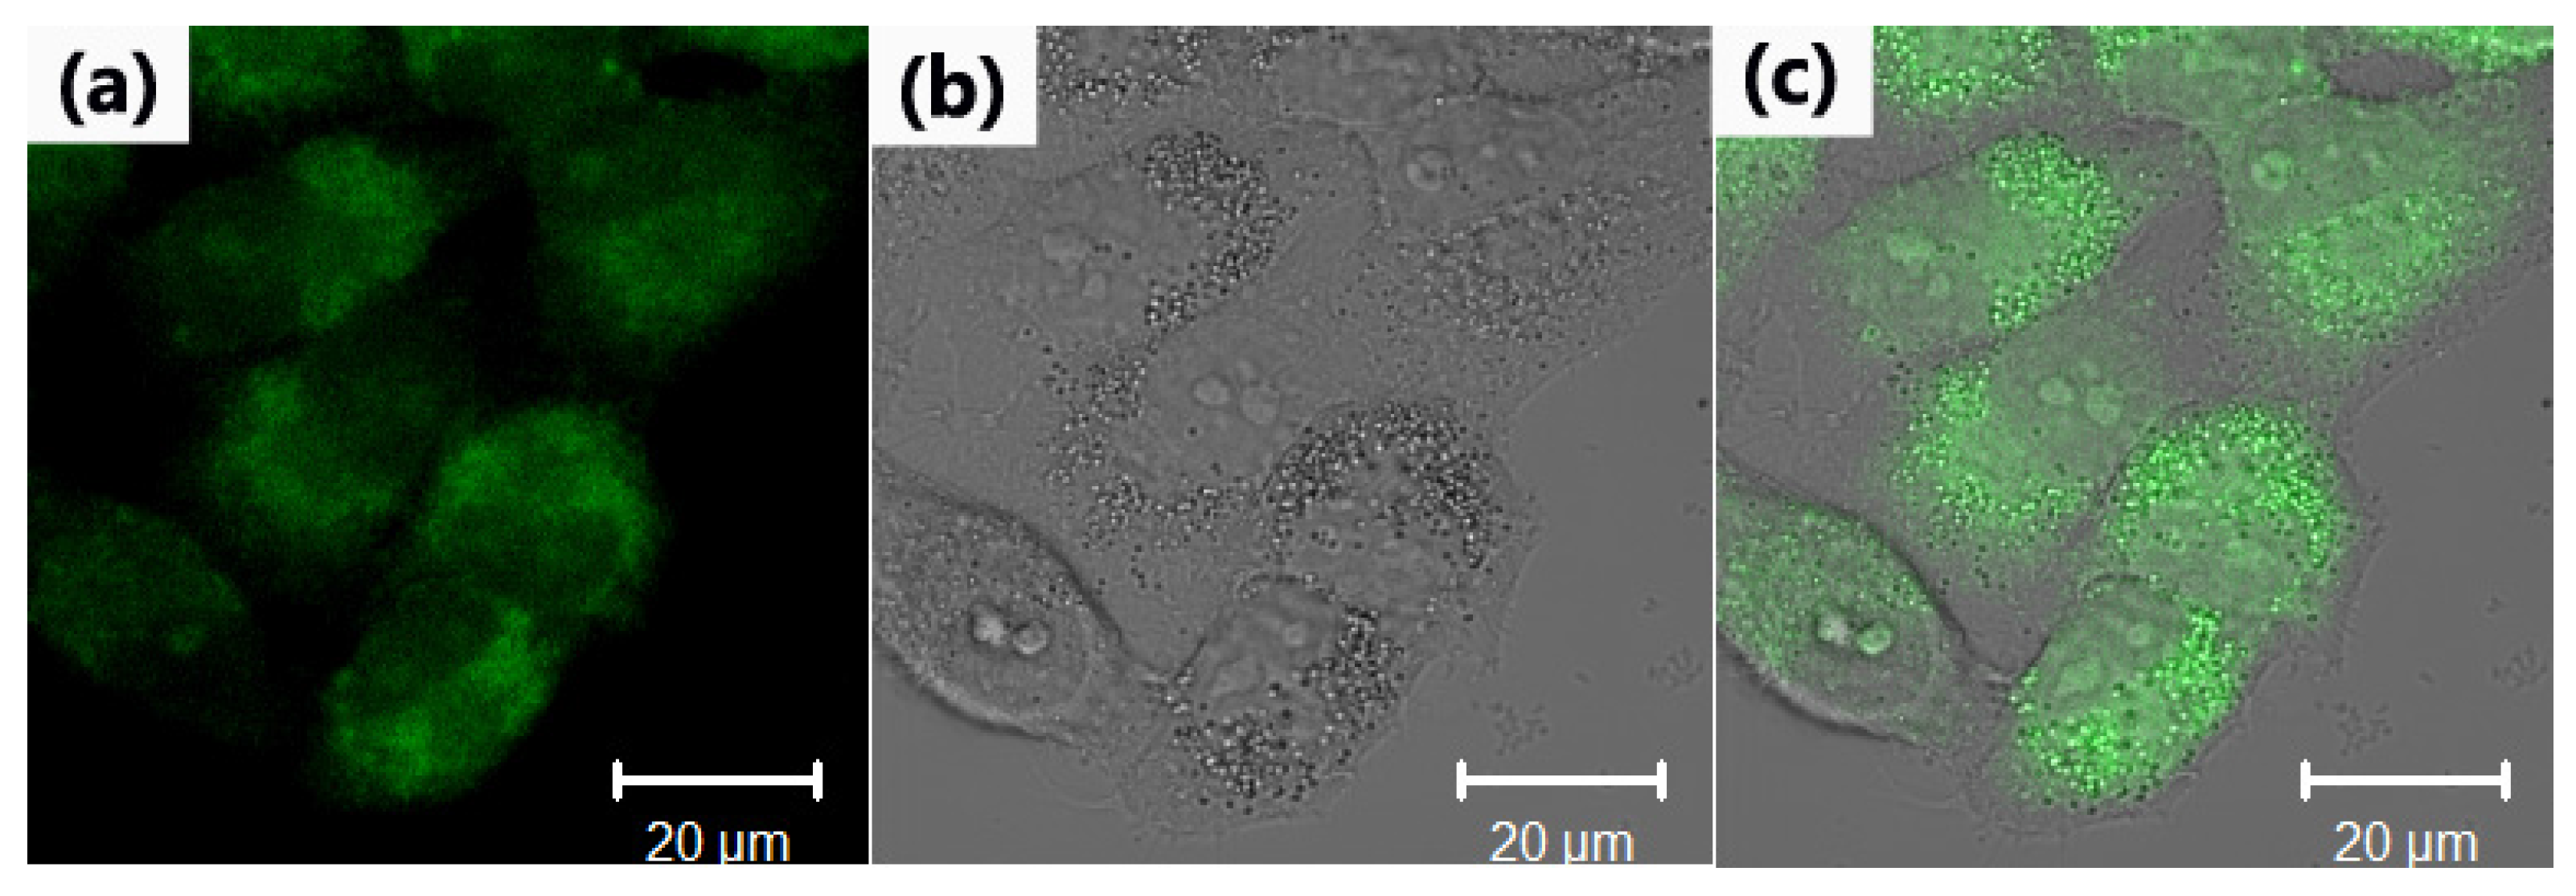
Rapid Synthesis of Carbon Dots by Hydrothermal Treatment of Lignin

Abstract
:
1. Introduction
2. Results and Discussion
3. Materials and Methods
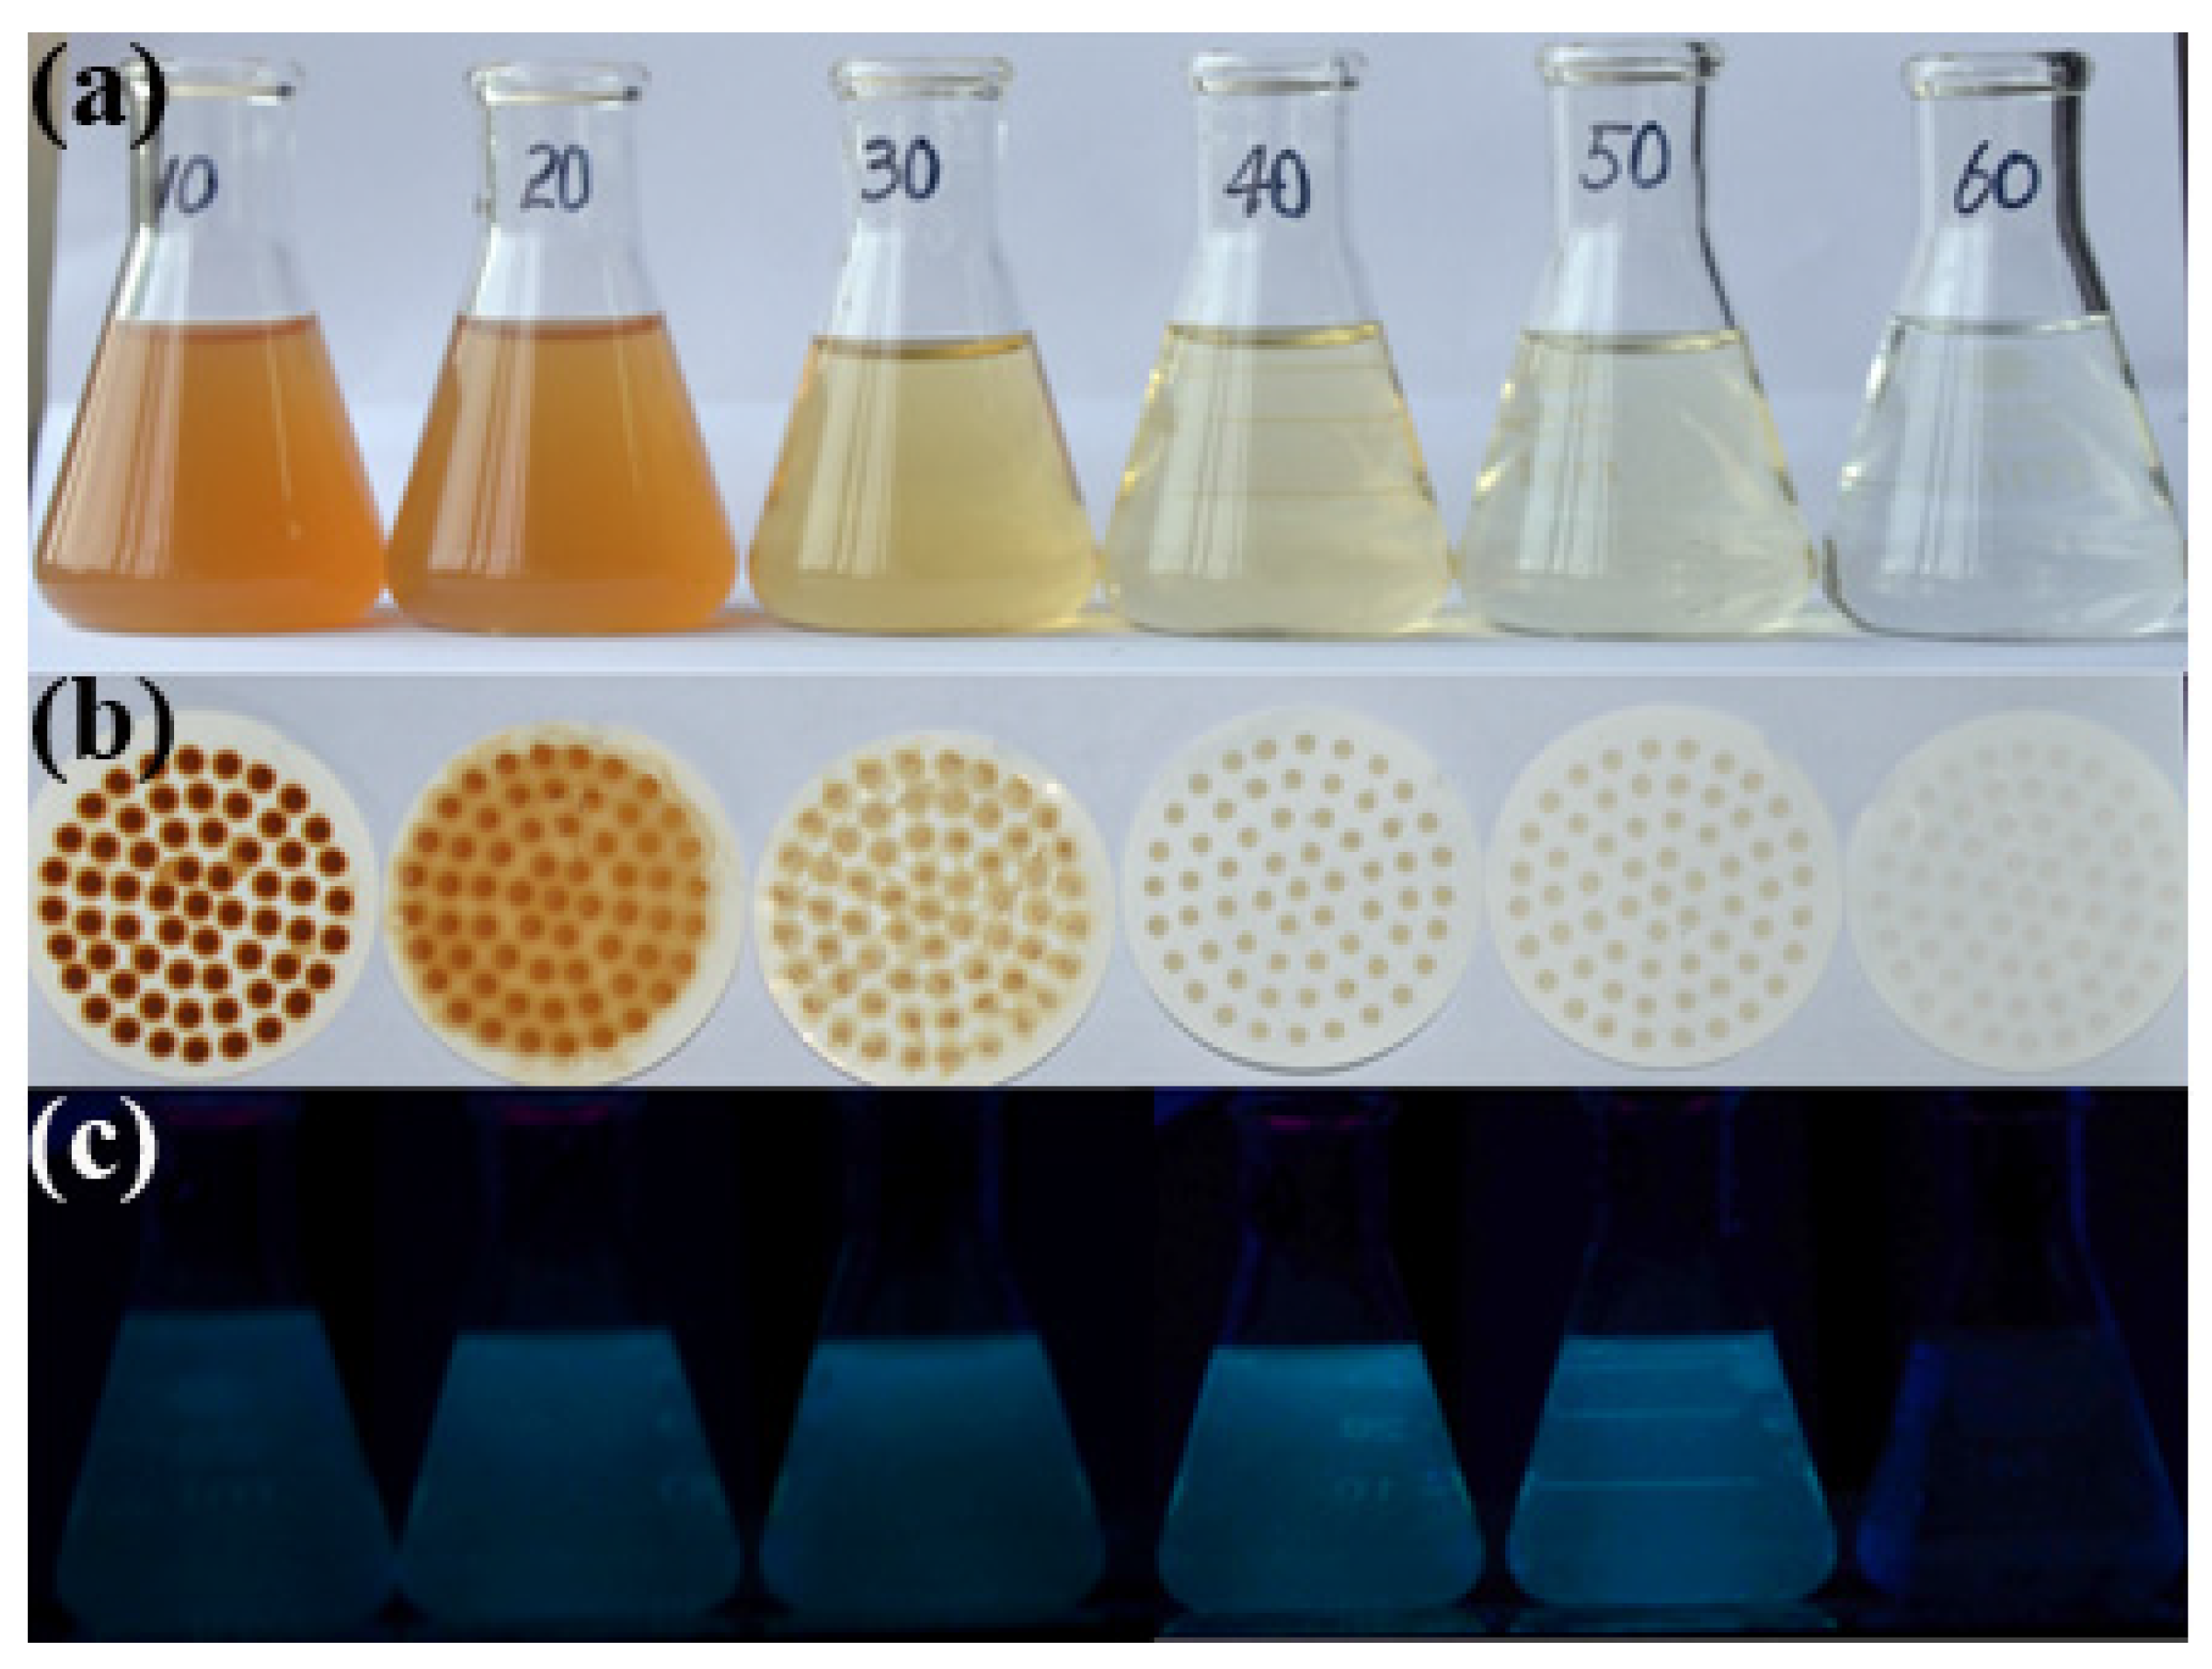
3.1. Preparation of the Fluorescent CDs
3.2. Characterization Methods
3.3. Fluorescence Imaging Experiments
4. Conclusions
Acknowledgments
Author Contributions
Conflicts of Interest
Abbreviations
| CDs | carbon dots |
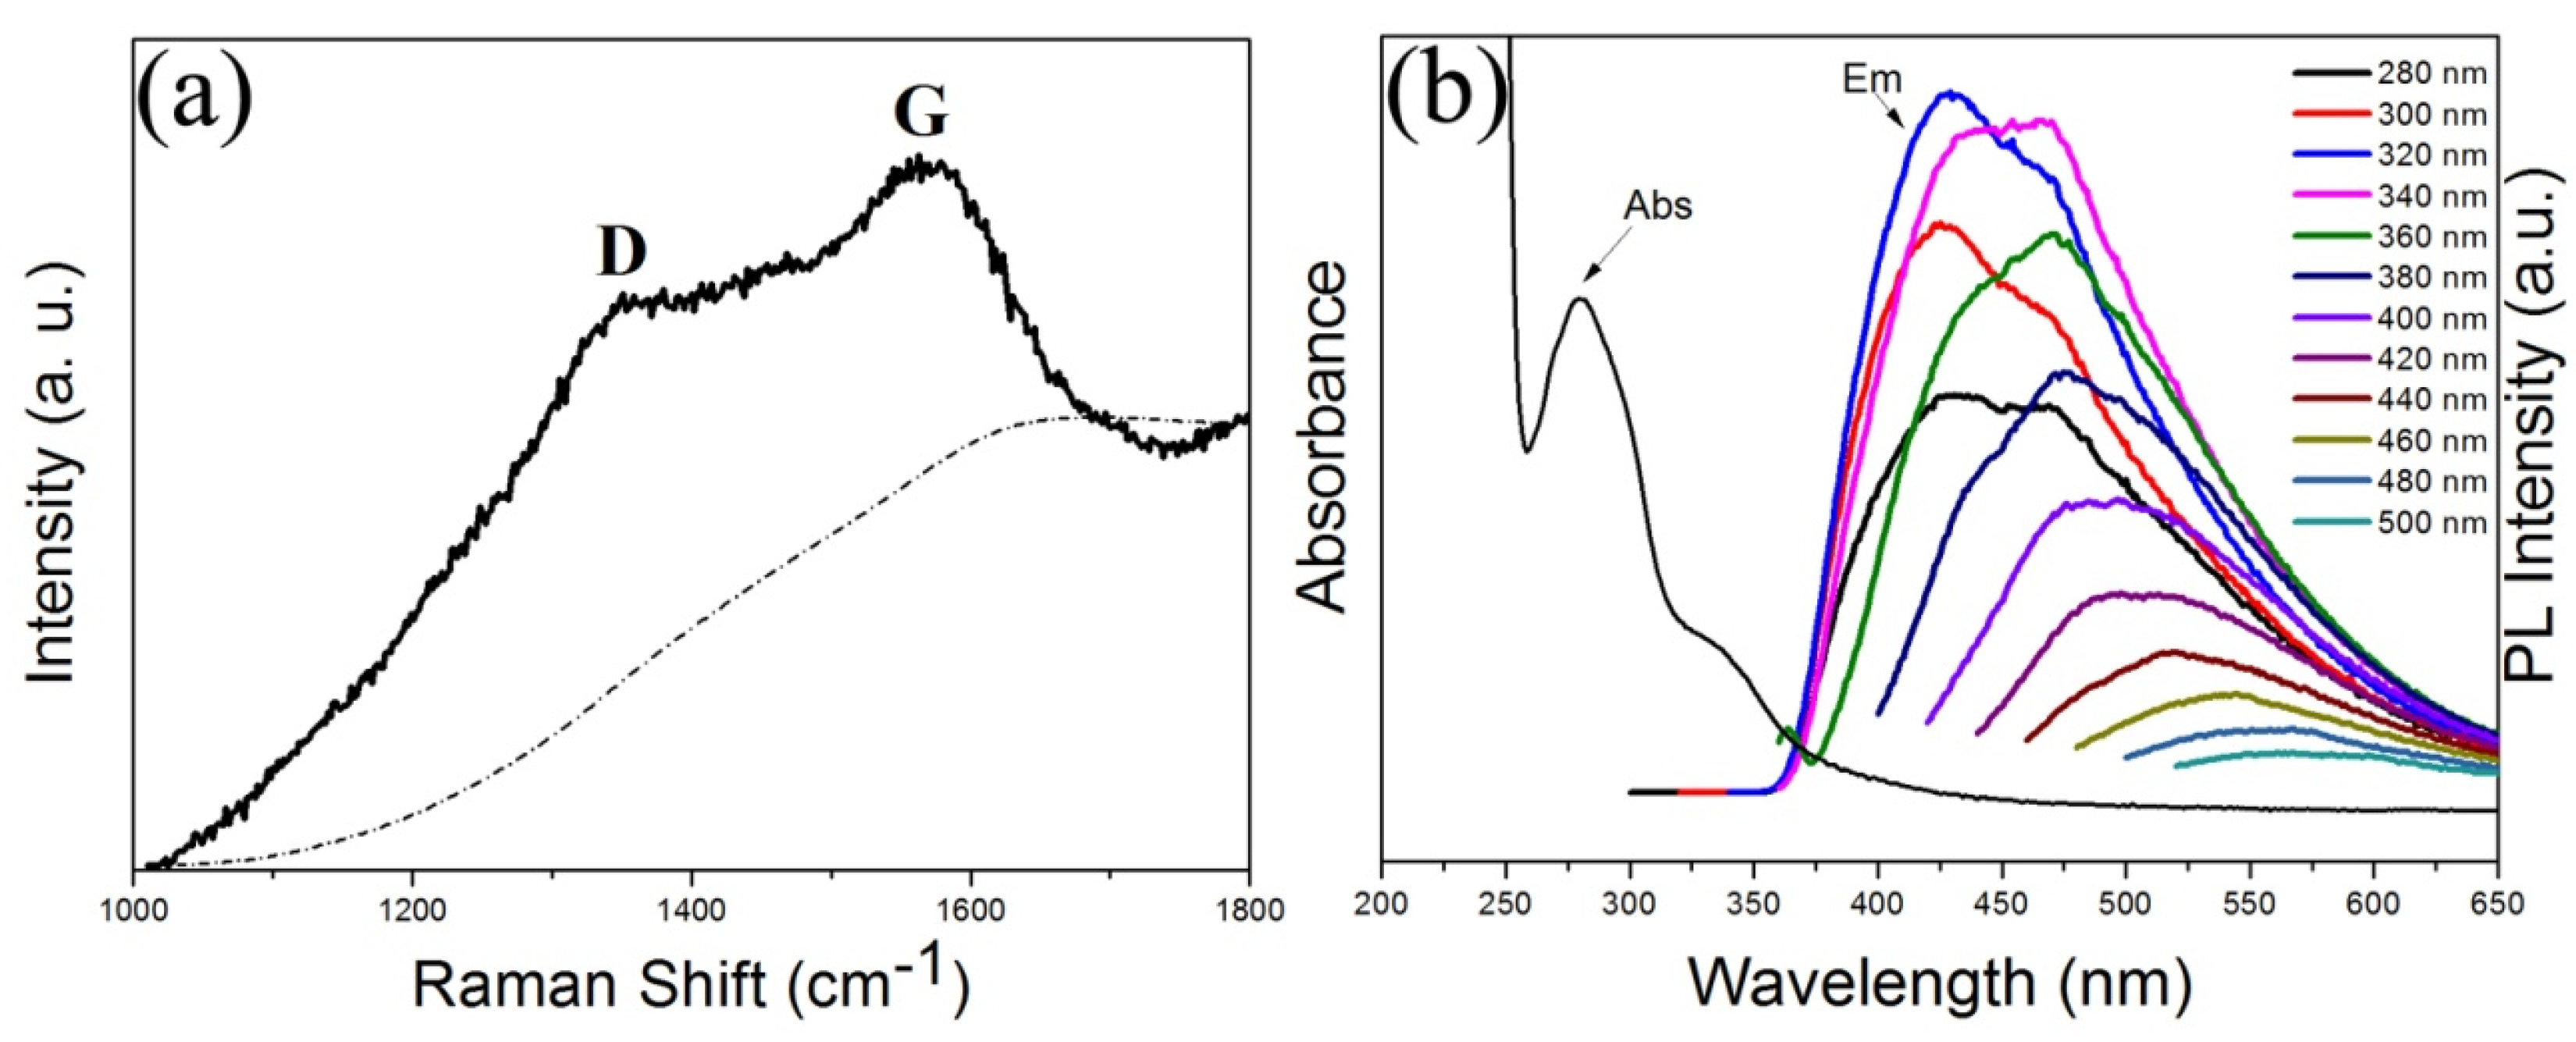
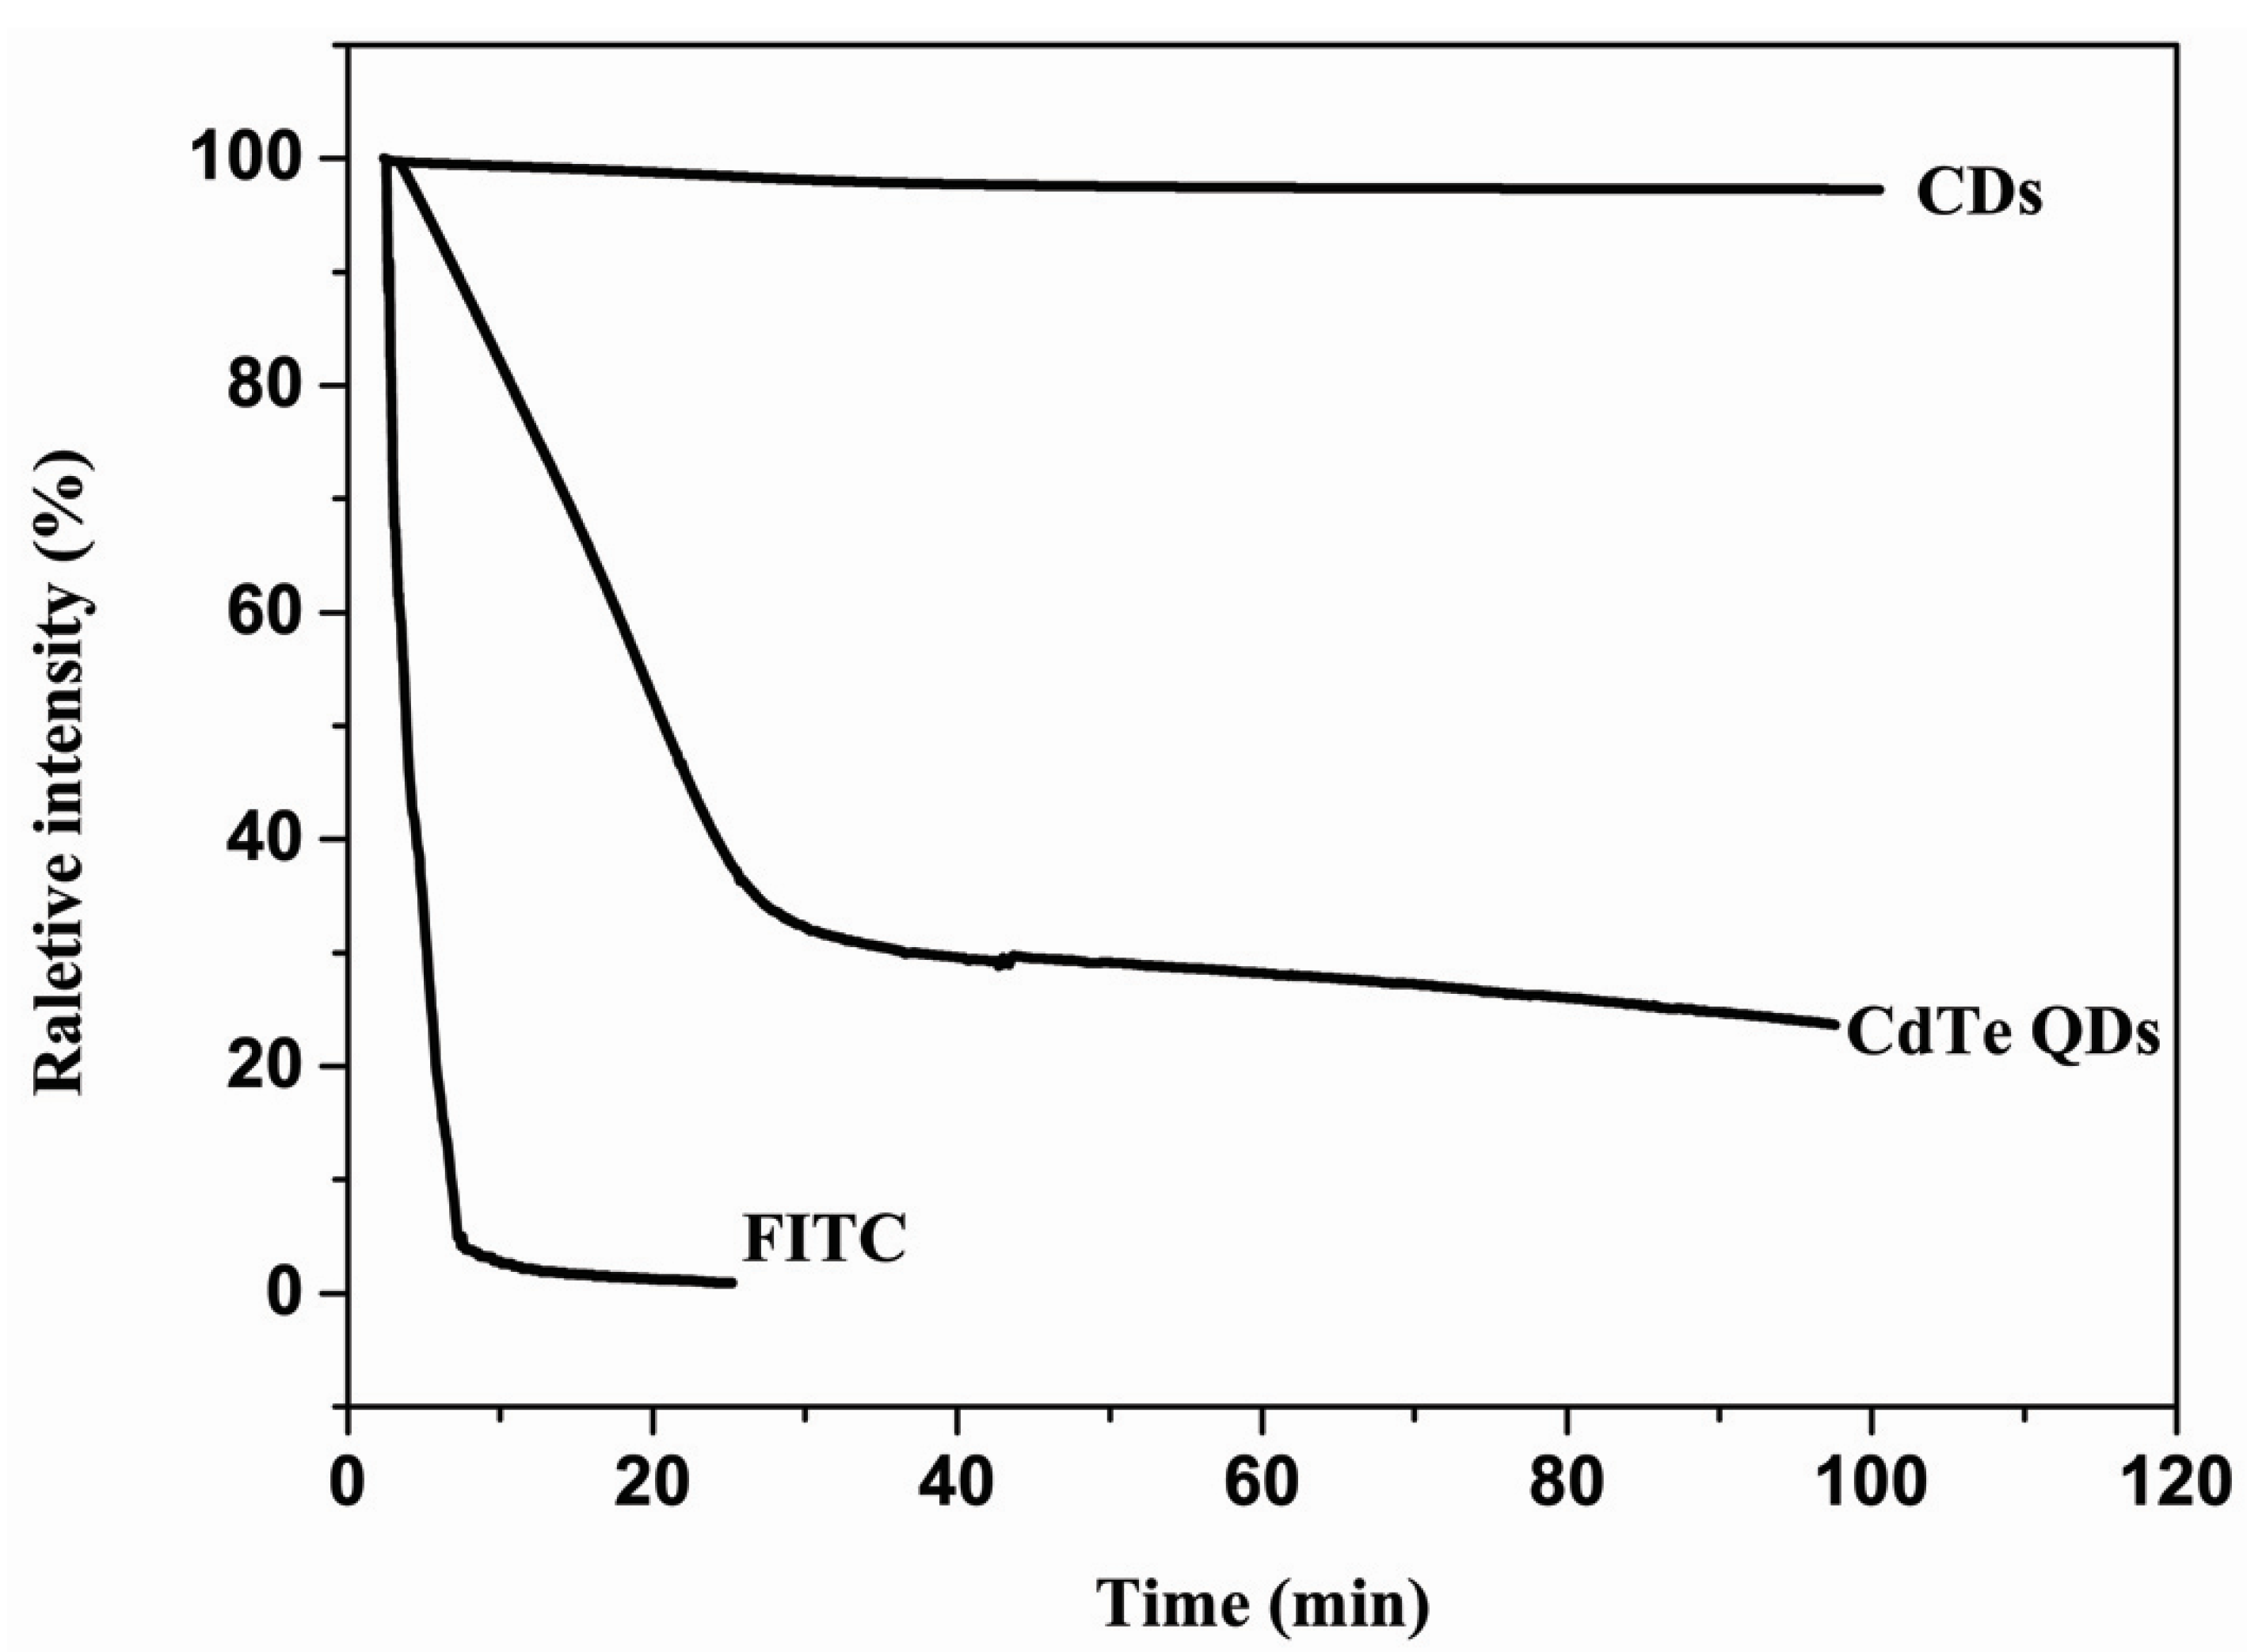
| PL | photoluminescence |
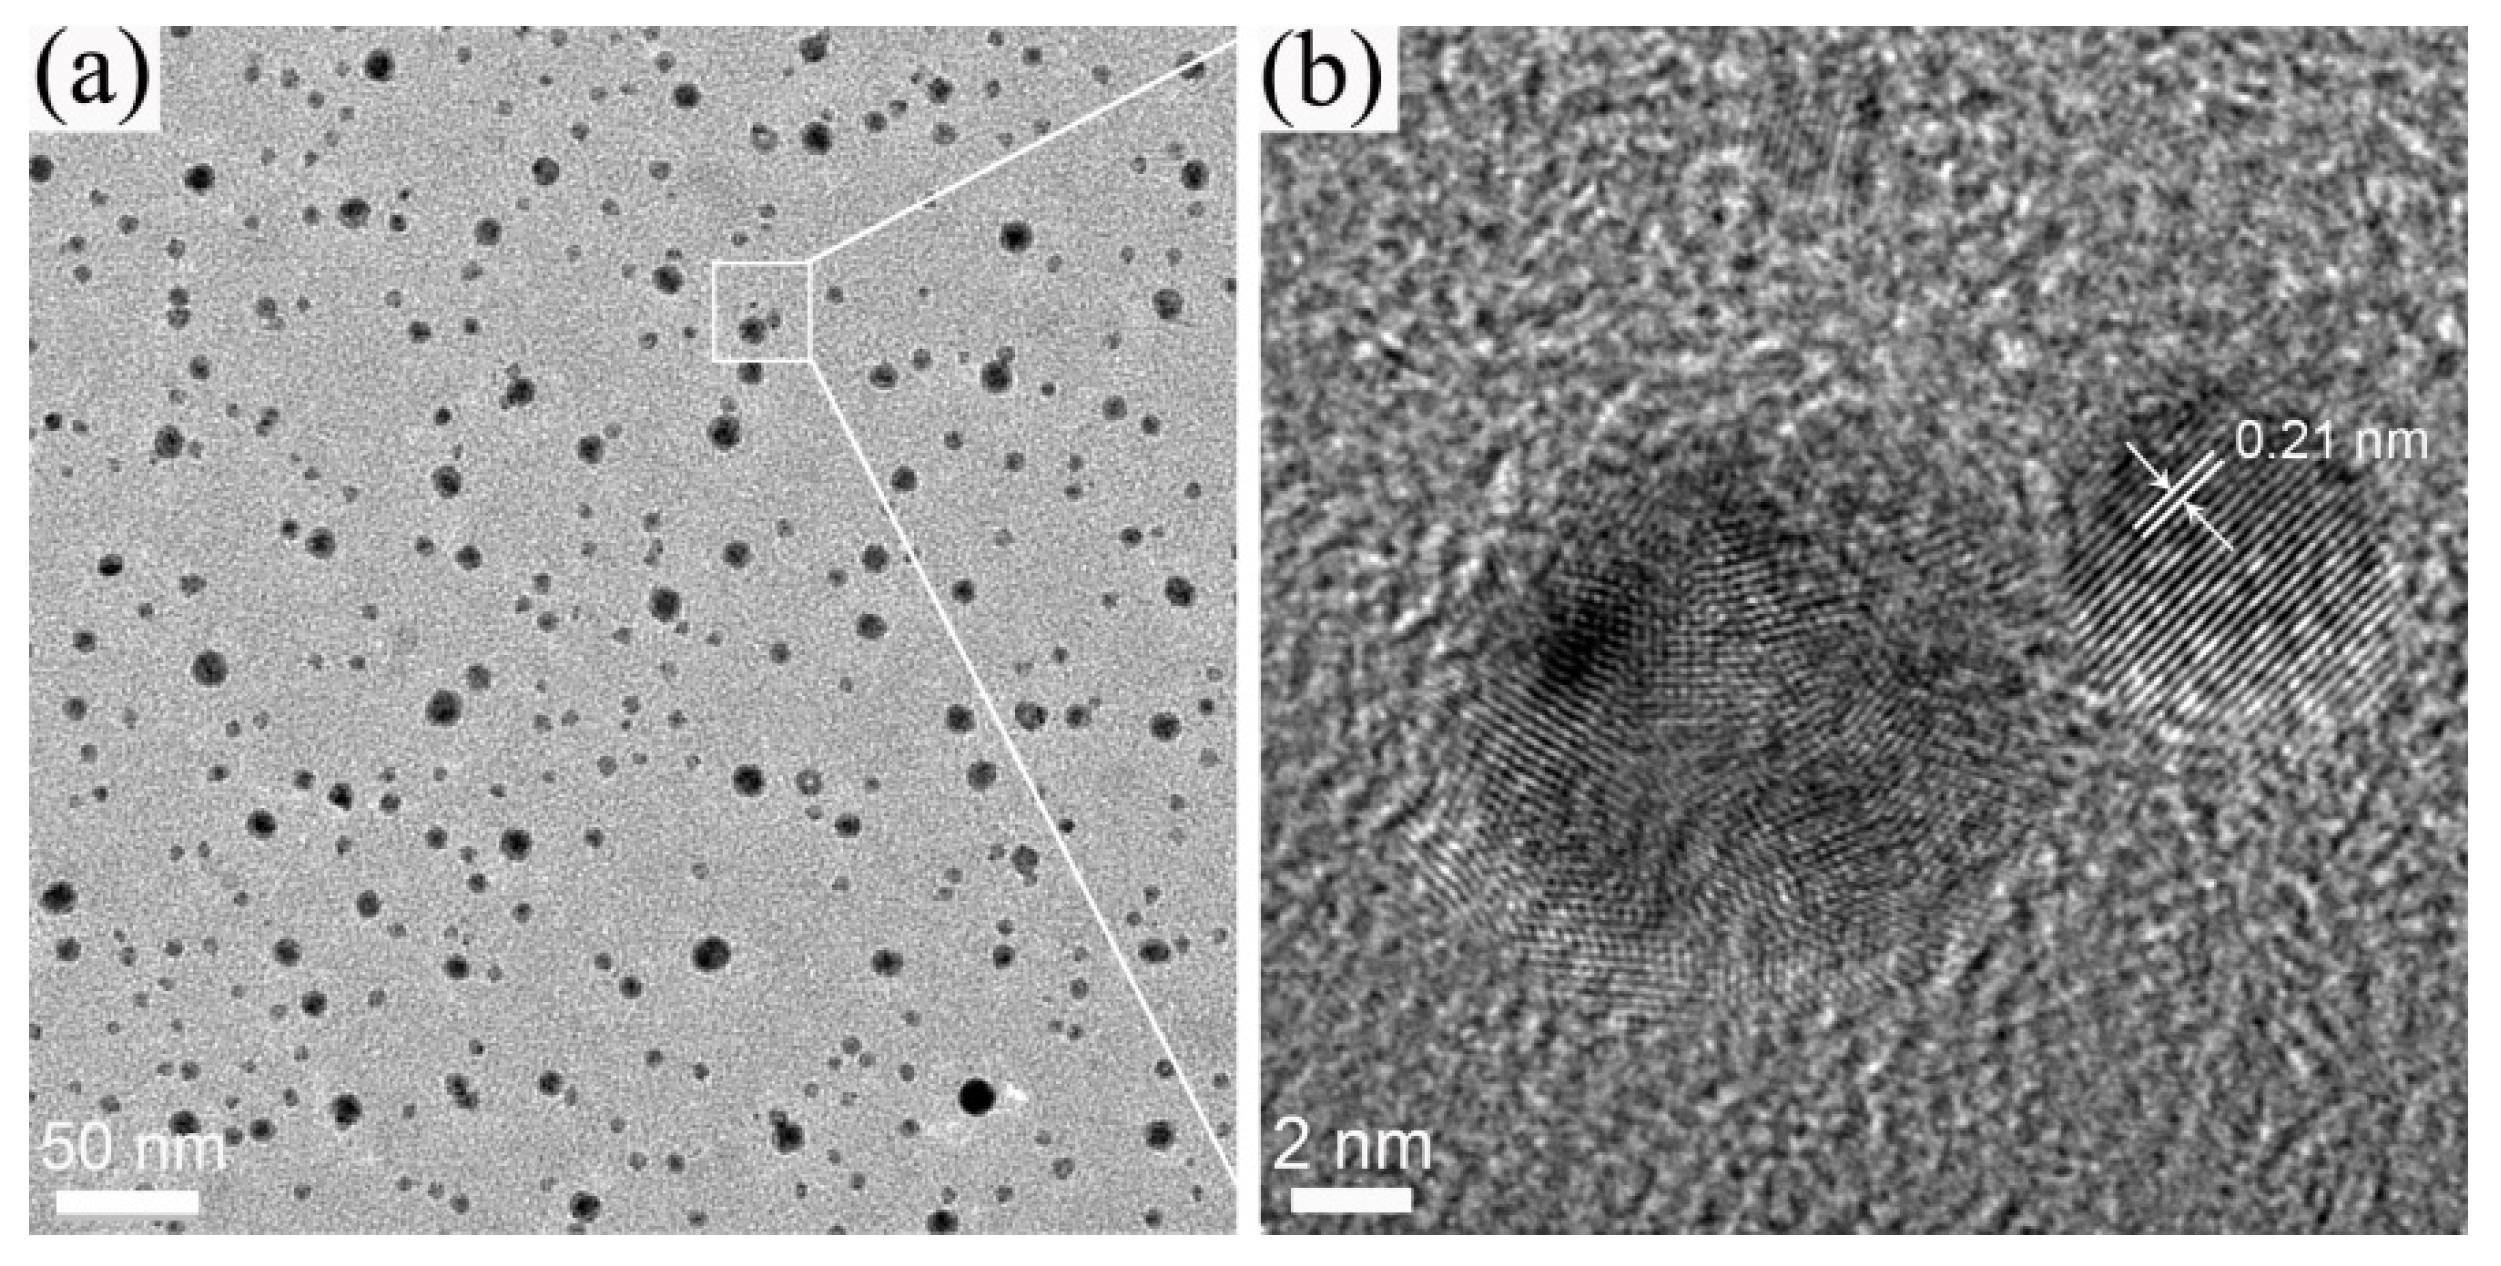
| TEM | transmission electron microscopy |
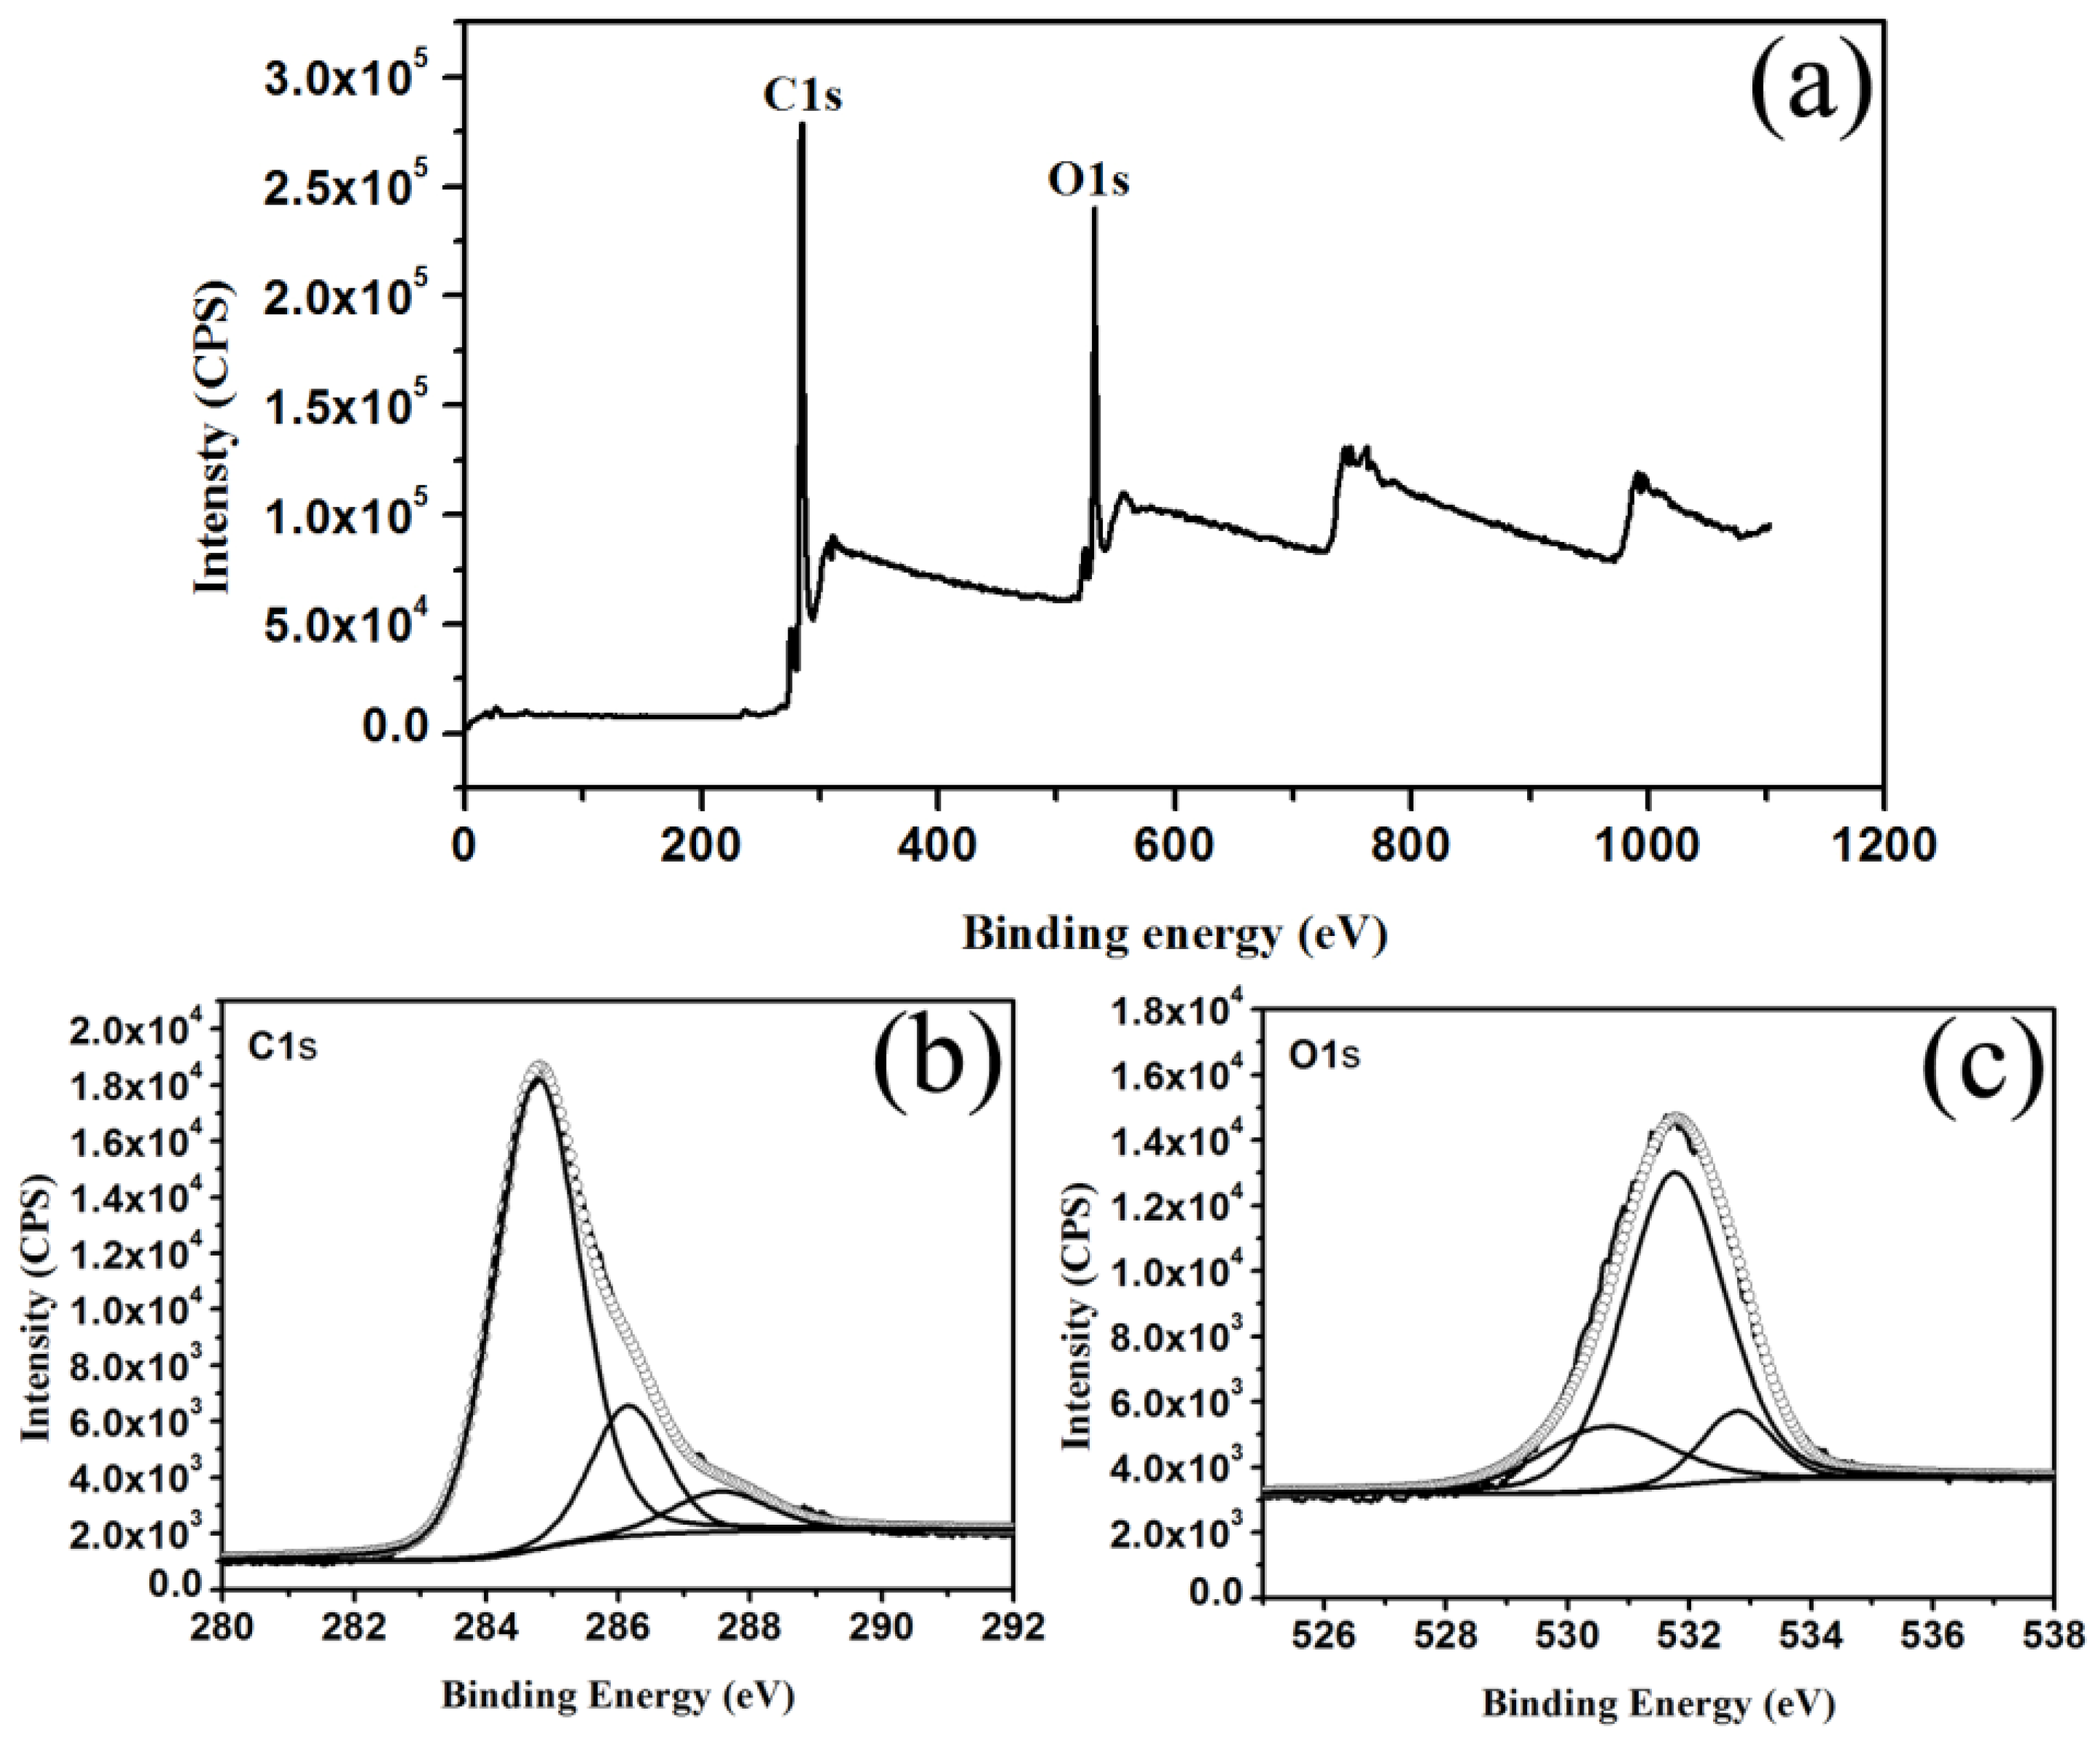
| XPS | X-ray photo-electron spectroscopy |
| PBS | phosphate buffered saline |
References
- Cao, L.; Wang, X.; Meziani, M.J.; Lu, F.S.; Wang, H.F.; Luo, P.G.J.; Lin, Y.; Harruff, B.A.; Veca, L.M.; Murray, D.; et al. Carbon dots for multiphoton bioimaging. J. Am. Chem. Soc. 2007, 129, 11318–11319. [Google Scholar] [CrossRef] [PubMed]
- Sun, Y.P.; Wang, X.; Lu, F.S.; Cao, L.; Meziani, M.J.; Luo, P.G.J.; Gu, L.R.; Veca, M. Doped carbon nanoparticles as a new platform for highly photoluminescent dots. J. Phys. Chem. C 2008, 112, 18295–18298. [Google Scholar] [CrossRef] [PubMed]
- Sun, Y.P.; Zhou, B.; Lin, Y.; Wang, W.; Fernando, K.A.S.; Pathak, P.; Meziani, M.J.; Harruff, B.A.; Wang, X.; Wang, H.F.; et al. Quantum-sized carbon dots for bright and colorful photoluminescence. J. Am. Chem. Soc. 2006, 128, 7756–7757. [Google Scholar] [CrossRef] [PubMed]
- Cai, X.; Tan, S.Z.; Lin, M.S.; Xie, A.G.; Mai, W.J.; Zhang, X.J.; Lin, Z.D.; Wu, T.; Liu, Y.L. Synergistic antibacterial brilliant blue/reduced graphene oxide/quaternary phosphonium salt composite with excellent water solubility and specific targeting capability. Langmuir 2011, 27, 7828–7835. [Google Scholar] [CrossRef] [PubMed]
- Jia, X.F.; Li, J.; Wang, E.K. One-pot green synthesis of optically pH-sensitive carbon dots with upconversion luminescence. Nanoscale 2012, 4, 5572–5575. [Google Scholar] [CrossRef] [PubMed]
- Rahim, R.A.; Kurahashi, H.; Uesugi, K.; Fukuda, H. Carbon nano dots scale by focused ion beam system for MIS diode nano devices. Surf. Sci. 2007, 601, 5112–5115. [Google Scholar] [CrossRef]
- Wang, F.; Pang, S.P.; Wang, L.; Li, Q.; Kreiter, M.; Liu, C.Y. One-step synthesis of highly luminescent carbon dots in noncoordinating solvents. Chem. Mater. 2010, 22, 4528–4530. [Google Scholar] [CrossRef]
- Yang, S.T.; Cao, L.; Luo, P.G.J.; Lu, F.S.; Wang, X.; Wang, H.F.; Meziani, M.; Liu, Y.F.; Qi, G.; Sun, Y.P. Carbon dots for optical imaging in vivo. J. Am. Chem. Soc. 2009, 131, 11308–11309. [Google Scholar] [CrossRef] [PubMed]
- Zhang, P.; Li, W.C.; Zhai, X.Y.; Liu, C.J.; Dai, L.M.; Liu, W.G. A facile and versatile approach to biocompatible “fluorescent polymers” from polymerizable carbon nanodots. Chem. Commun. 2012, 48, 10431–10433. [Google Scholar] [CrossRef] [PubMed]
- Zhang, X.Y.; Wang, S.Q.; Zhu, C.Y.; Liu, M.Y.; Ji, Y.; Feng, L.; Tao, L.; Wei, Y.J. Carbon-dots derived from nanodiamond: Photoluminescence tunable nanoparticles for cell imaging. J. Colloid Interface Sci. 2013, 397, 39–44. [Google Scholar] [CrossRef] [PubMed]
- Zhao, A.D.; Zhao, C.Q.; Li, M.; Ren, J.S.; Qu, X.G. Ionic liquids as precursors for highly luminescent, surface-different nitrogen-doped carbon dots used for label-free detection of Cu2+/Fe3+ and cell imaging. Anal. Chim. Acta 2014, 809, 128–133. [Google Scholar] [CrossRef] [PubMed]
- De, B.; Karak, N. A green and facile approach for the synthesis of water soluble fluorescent carbon dots from banana juice. Rsc. Adv. 2013, 3, 8286–8290. [Google Scholar] [CrossRef]
- Prasannan, A.; Imae, T. One-pot synthesis of fluorescent carbon dots from orange waste peels. Ind. Eng. Chem. Res. 2013, 52, 15673–15678. [Google Scholar] [CrossRef]
- Yan, X.L.; Li, X.J.; Yan, Z.F.; Komarneni, S. Porous carbons prepared by direct carbonization of MOFs for supercapacitors. Appl. Surf. Sci. 2014, 308, 306–310. [Google Scholar] [CrossRef]
- Zhang, Z.; Hao, J.H.; Zhang, J.; Zhang, B.L.; Tang, J.L. Protein as the source for synthesizing fluorescent carbon dots by a one-pot hydrothermal route. Rsc. Adv. 2012, 2, 8599–8601. [Google Scholar] [CrossRef]
- Zhou, J.J.; Sheng, Z.H.; Han, H.Y.; Zou, M.Q.; Li, C.X. Facile synthesis of fluorescent carbon dots using watermelon peel as a carbon source. Mater. Lett. 2012, 66, 222–224. [Google Scholar] [CrossRef]
- Fu, K.F.; Yue, Q.Y.; Gao, B.Y.; Sun, Y.Y.; Zhu, L.J. Preparation, characterization and application of lignin-based activated carbon from black liquor lignin by steam activation. Chem. Eng. J. 2013, 228, 1074–1082. [Google Scholar] [CrossRef]
- Ragan, S.; Megonnell, N. Activated carbon from renewable resources-Lignin. Cellul. Chem. Technol. 2011, 45, 527–531. [Google Scholar]
- Ruiz-Rosas, R.; Bedia, J.; Lallave, M.; Loscertales, I.G.; Barrero, A.; Rodríguez-Mirasol, J.; Cordero, T. The production of submicron diameter carbon fibers by the electrospinning of lignin. Carbon 2010, 48, 696–705. [Google Scholar] [CrossRef]
- Titirici, M.-M.; Antonietti, M.; Baccile, N. Hydrothermal carbon from biomass: A comparison of the local structure from poly-to monosaccharides and pentoses/hexoses. Green Chem. 2008, 10, 1204–1212. [Google Scholar] [CrossRef]
- Zhou, X.; Zhang, Y.; Wang, C.; Wu, X.; Yang, Y.; Zheng, B.; Wu, H.; Guo, S.; Zhang, J. Photo-Fenton reaction of graphene oxide: A new strategy to prepare graphene quantum dots for DNA cleavage. ACS Nano 2012, 6, 6592–6599. [Google Scholar] [CrossRef] [PubMed]
- Pan, D.Y.; Guo, L.; Zhang, J.C.; Xi, C.; Xue, Q.; Huang, H.; Li, J.H.; Zhang, Z.W.; Yu, W.J.; Chen, Z.W.; et al. Cutting sp(2) clusters in graphene sheets into colloidal graphene quantum dots with strong green fluorescence. J. Mater. Chem. 2012, 22, 3314–3318. [Google Scholar] [CrossRef]
- Bhunia, S.K.; Saha, A.; Maity, A.R.; Ray, S.C.; Jana, N.R. Carbon nanoparticle-based fluorescent bioimaging probes. Sci. Rep. 2013, 3. [Google Scholar] [CrossRef] [PubMed]
- Yuan, M.; Zhong, R.B.; Gao, H.Y.; Li, W.R.; Yun, X.L.; Liu, J.R.; Zhao, X.M.; Zhao, G.F.; Zhang, F. One-step, green, and economic synthesis of water-soluble photoluminescent carbon dots by hydrothermal treatment of wheat straw, and their bio-applications in labeling, imaging, and sensing. Appl. Surf. Sci. 2015, 355, 1136–1144. [Google Scholar] [CrossRef]
- Yang, Y.H.; Cui, J.H.; Zheng, M.T.; Hu, C.F.; Tan, S.Z.; Xiao, Y.; Yang, Q.; Liu, Y.L. One-step synthesis of amino-functionalized fluorescent carbon nanoparticles by hydrothermal carbonization of chitosan. Chem. Commun. 2012, 48, 380–382. [Google Scholar] [CrossRef] [PubMed]


© 2016 by the authors; licensee MDPI, Basel, Switzerland. This article is an open access article distributed under the terms and conditions of the Creative Commons by Attribution (CC-BY) license (http://creativecommons.org/licenses/by/4.0/).
Share and Cite
Chen, W.; Hu, C.; Yang, Y.; Cui, J.; Liu, Y. Rapid Synthesis of Carbon Dots by Hydrothermal Treatment of Lignin. Materials 2016, 9, 184. https://doi.org/10.3390/ma9030184
Chen W, Hu C, Yang Y, Cui J, Liu Y. Rapid Synthesis of Carbon Dots by Hydrothermal Treatment of Lignin. Materials. 2016; 9(3):184. https://doi.org/10.3390/ma9030184
Chicago/Turabian StyleChen, Wenxin, Chaofan Hu, Yunhua Yang, Jianghu Cui, and Yingliang Liu. 2016. "Rapid Synthesis of Carbon Dots by Hydrothermal Treatment of Lignin" Materials 9, no. 3: 184. https://doi.org/10.3390/ma9030184
APA StyleChen, W., Hu, C., Yang, Y., Cui, J., & Liu, Y. (2016). Rapid Synthesis of Carbon Dots by Hydrothermal Treatment of Lignin. Materials, 9(3), 184. https://doi.org/10.3390/ma9030184