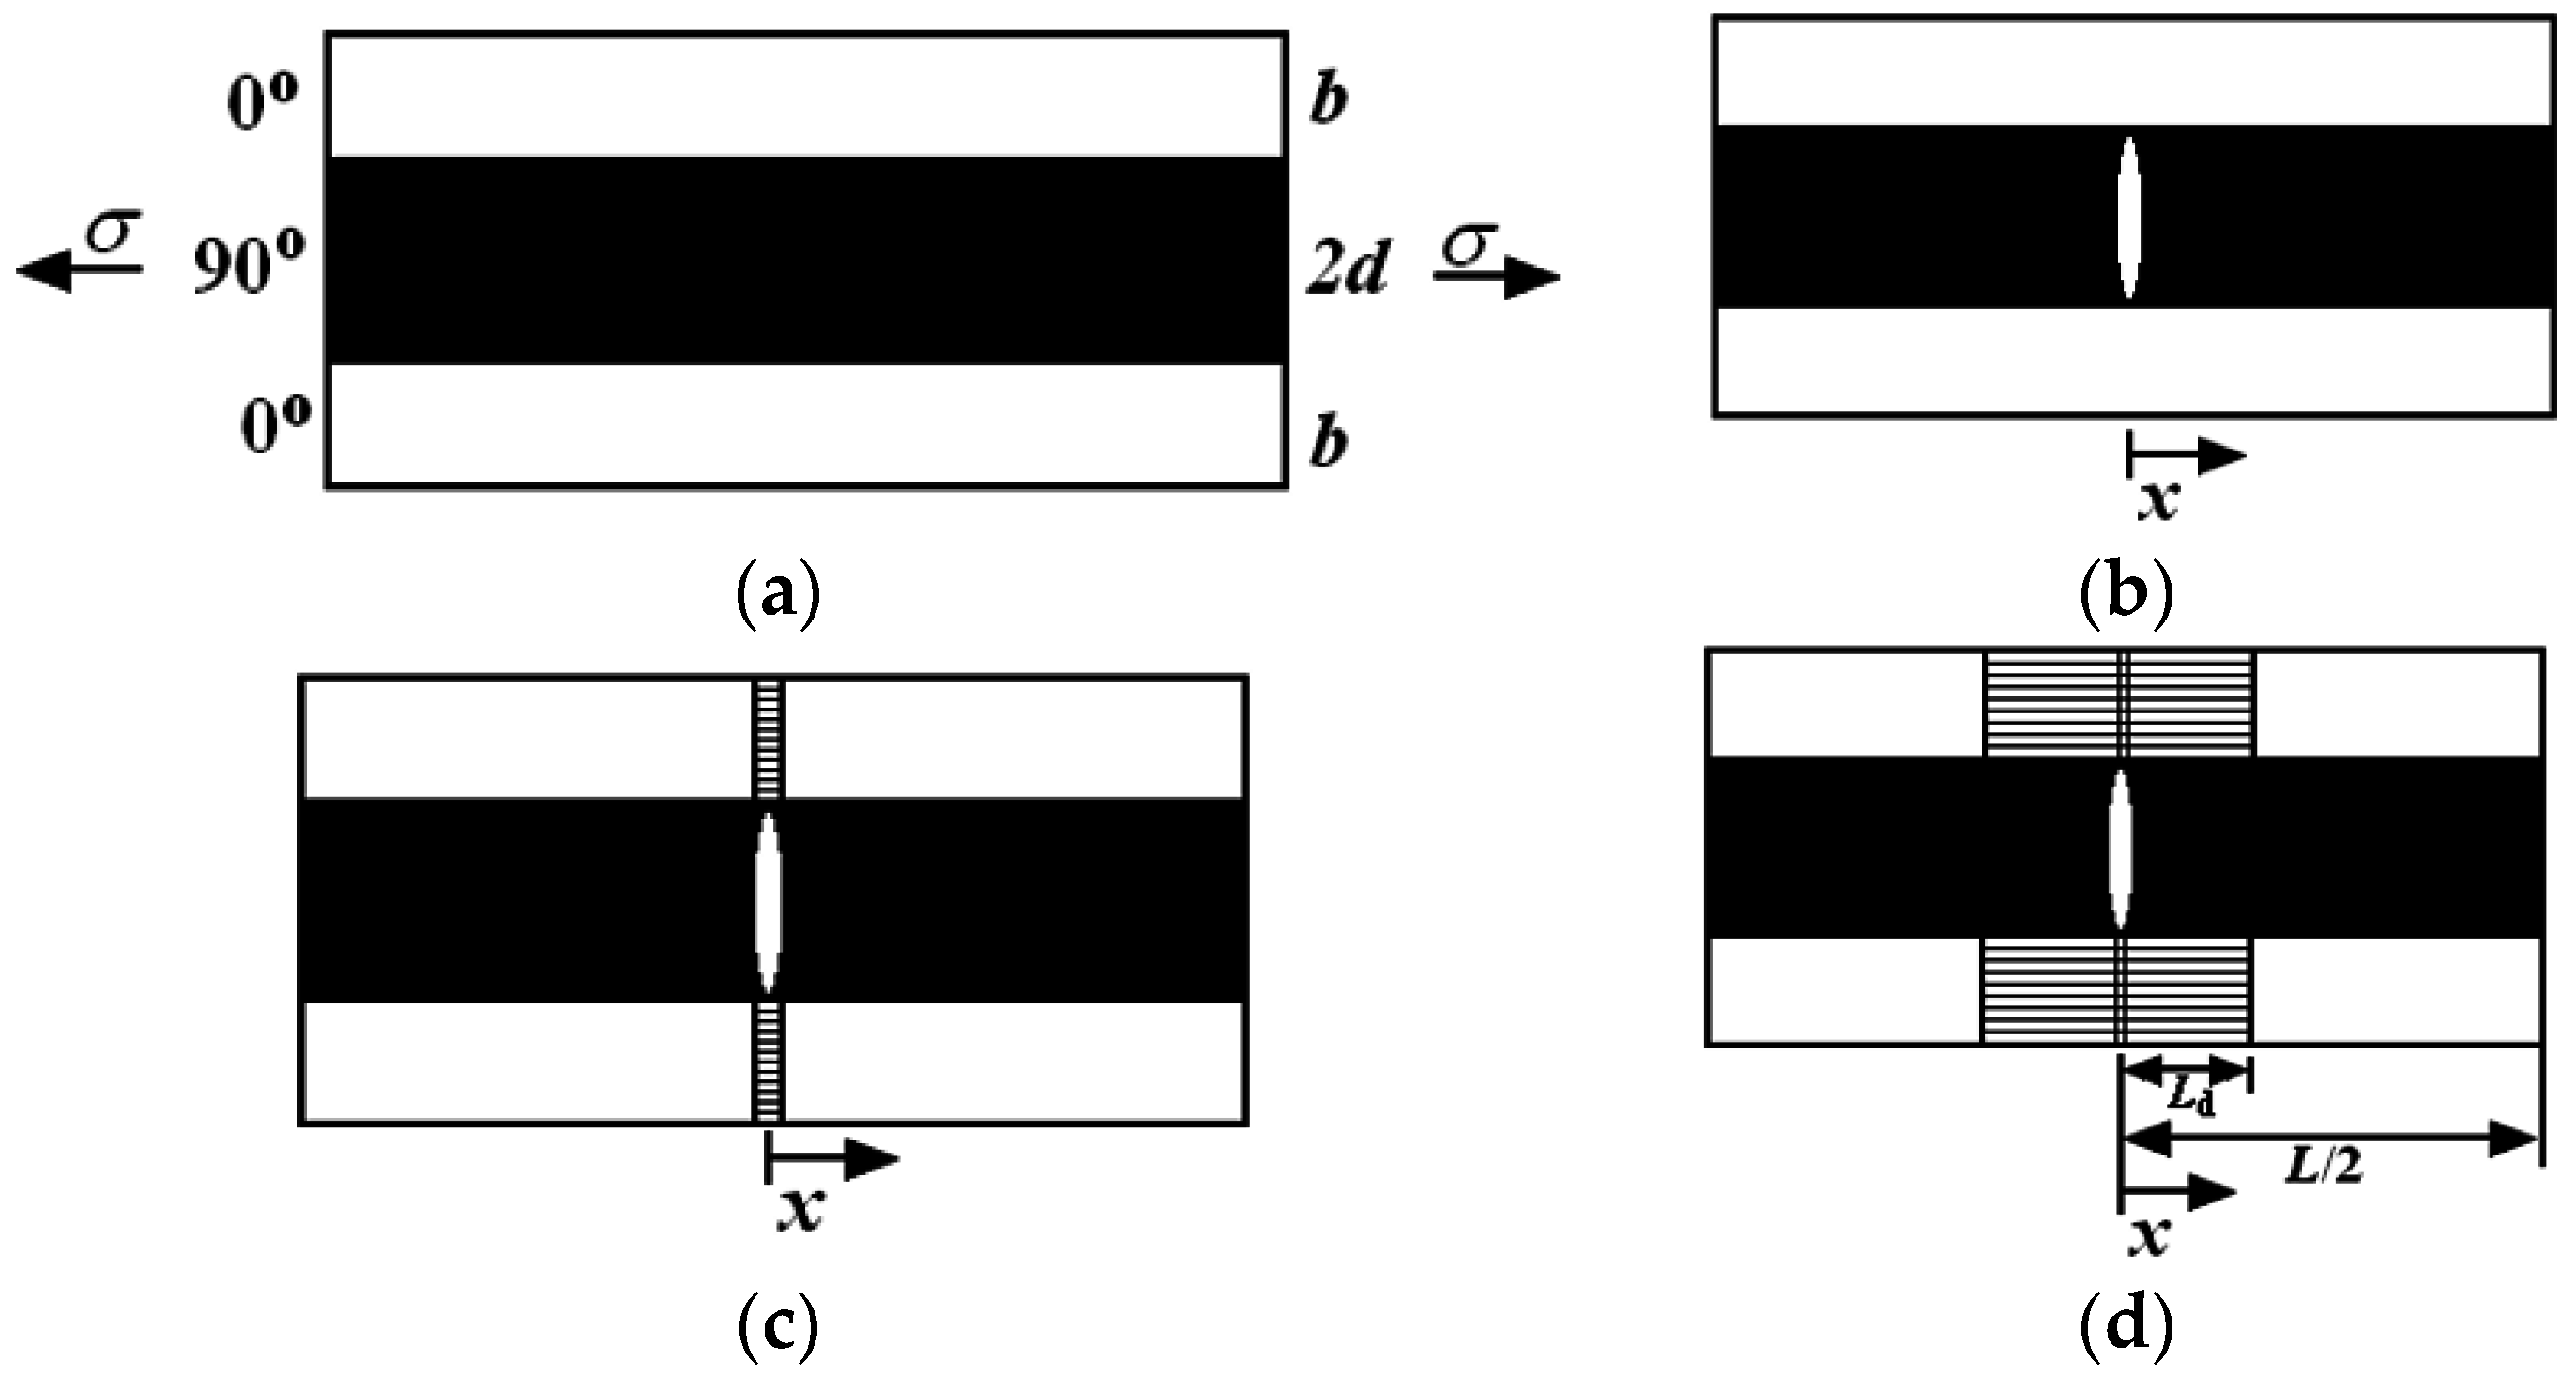
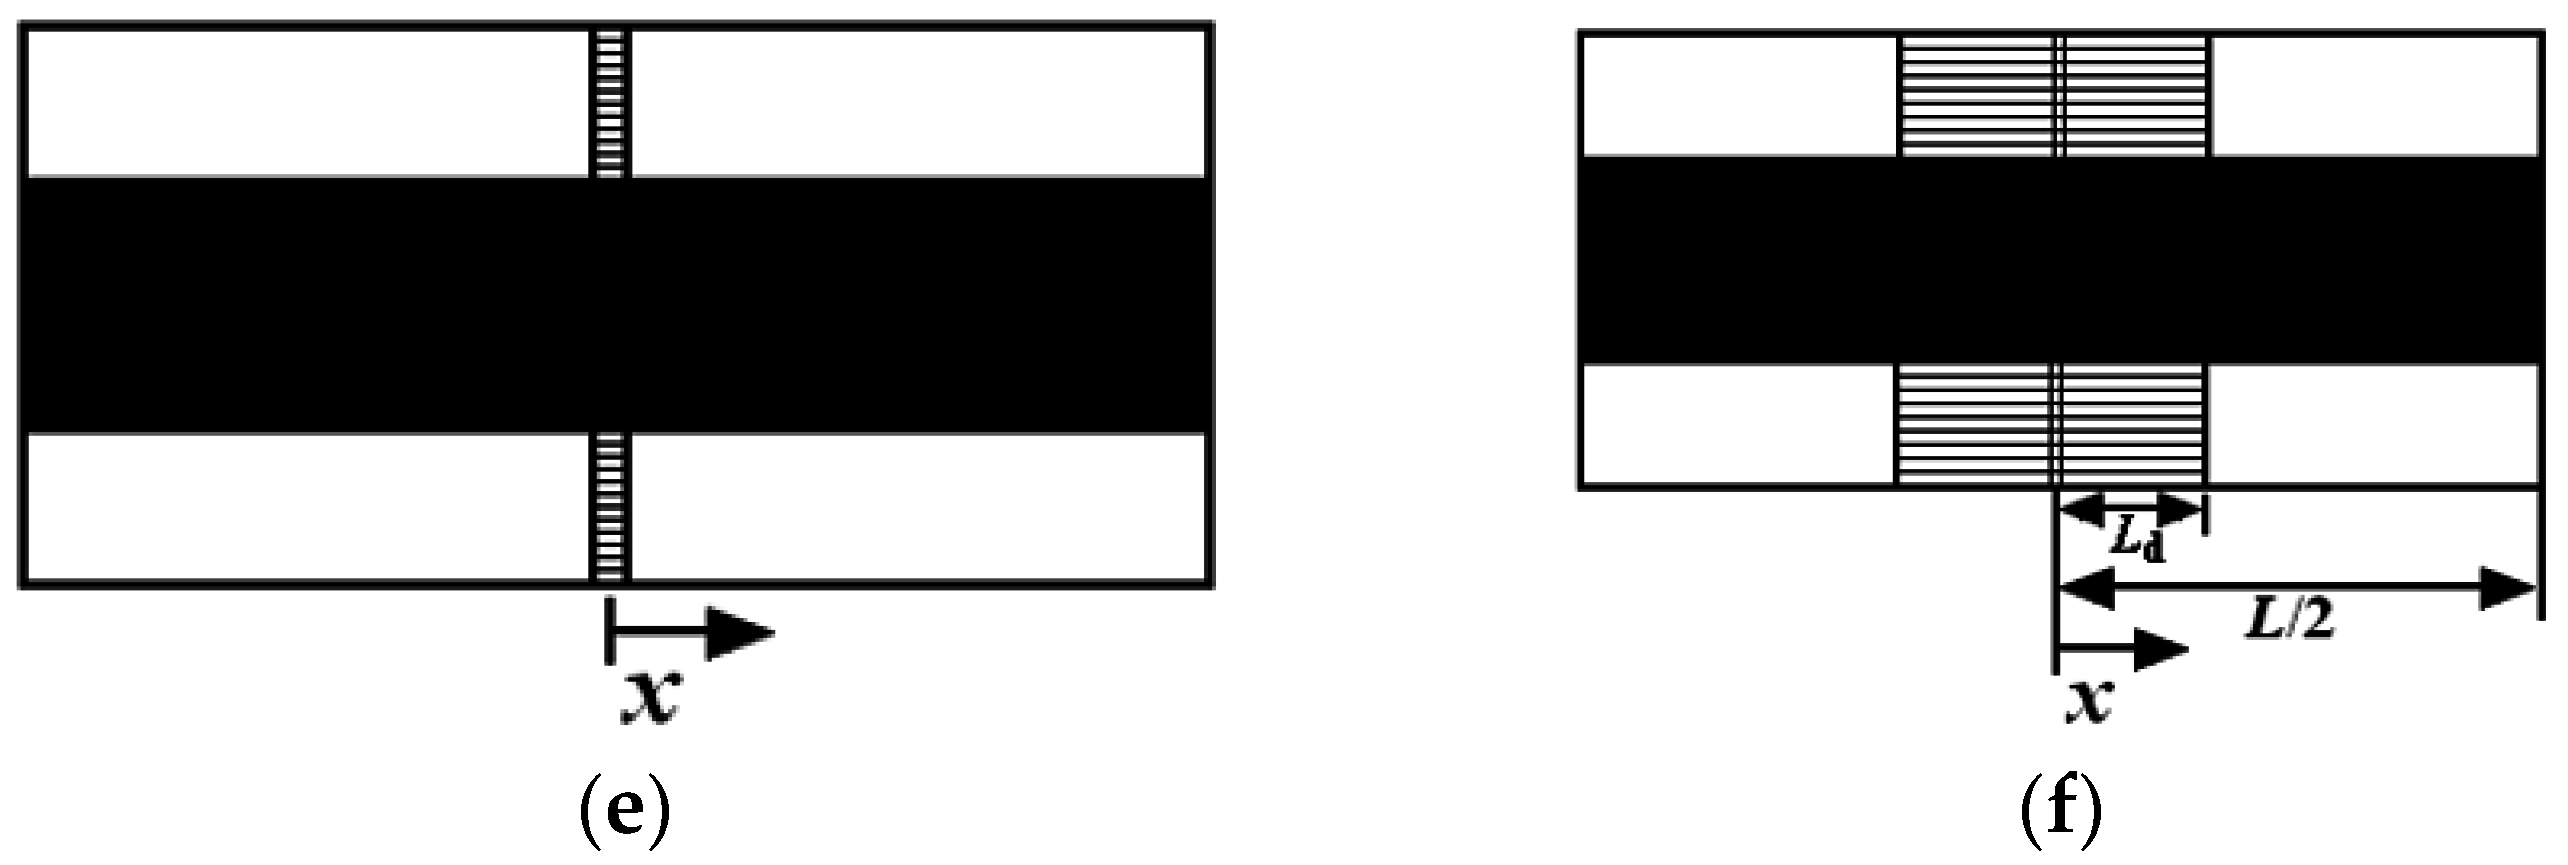
Under cyclic fatigue loading, the material properties, i.e., fiber volume content, peak stress, and damage state, i.e., matrix cracking mode proportion, affect the shape, location and area of hysteresis loops. The effect of these factors on interface slip and fatigue hysteresis dissipated energy evolution of matrix cracking mode 3 and mode 5, and composite would be analyzed.
3.1. Effect of Fiber Volume Fraction
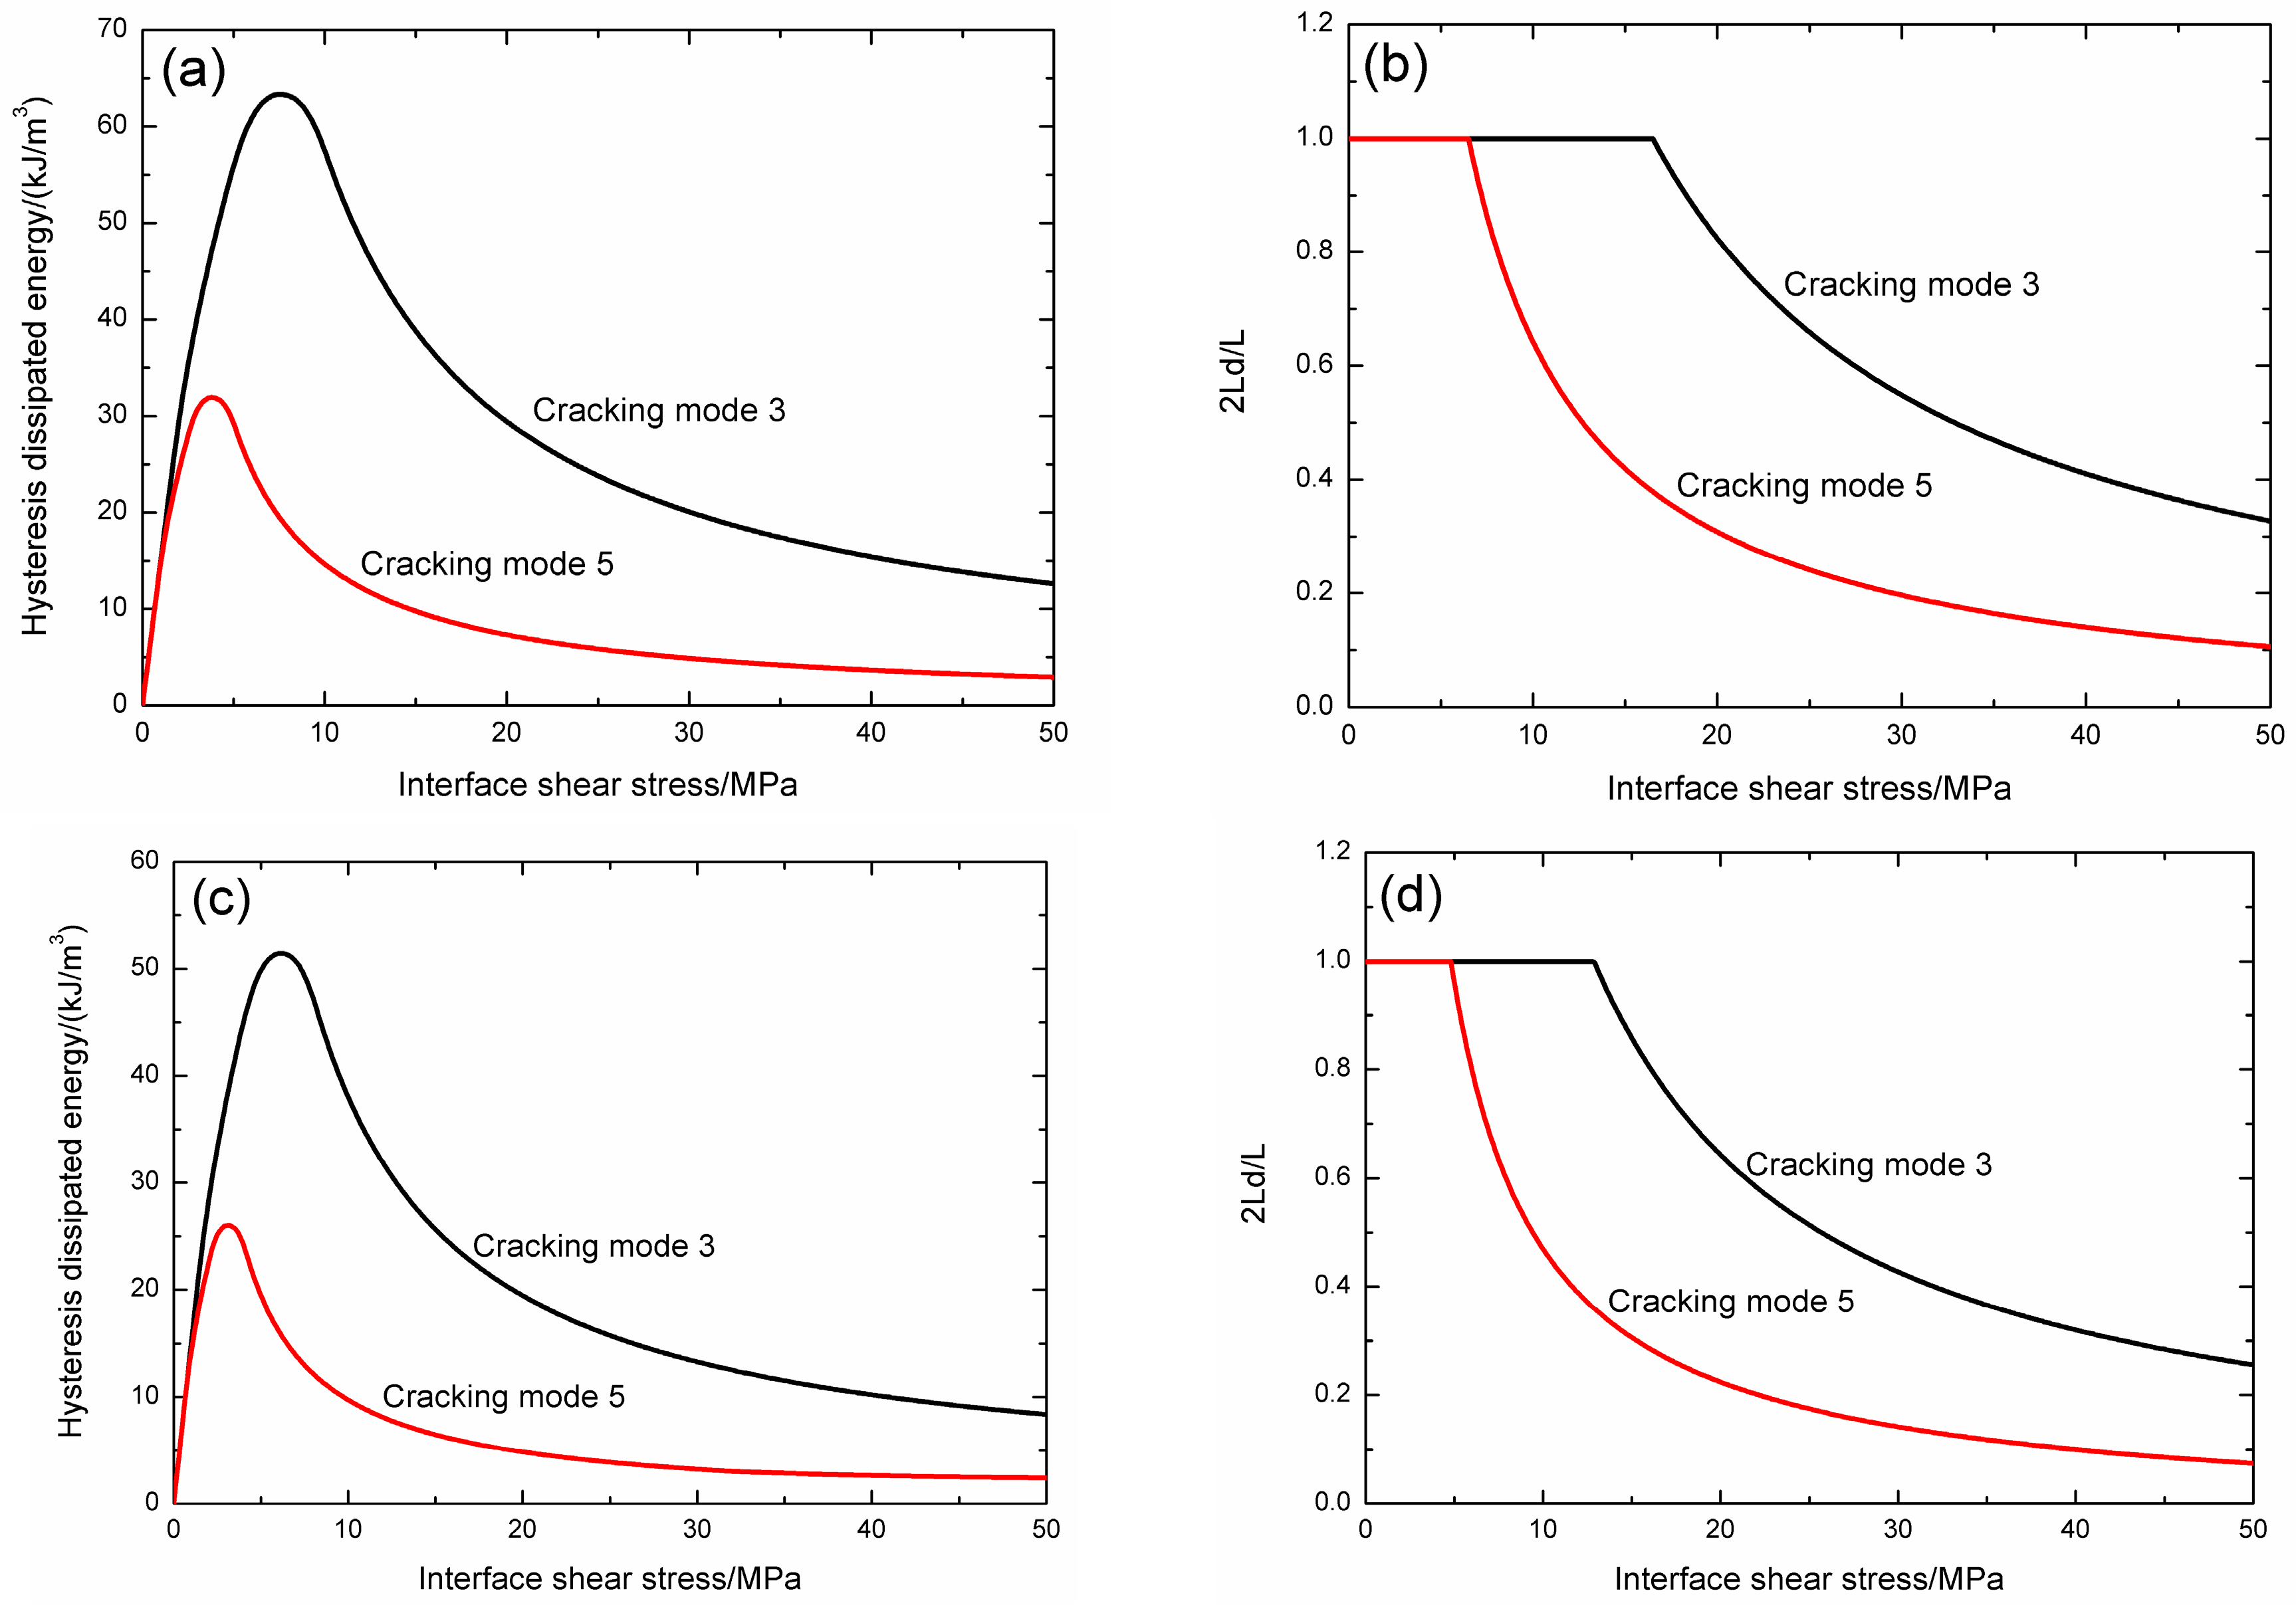
The effect of fiber volume content on fatigue hysteresis dissipated energy evolution and interface slip of matrix cracking mode 3, mode 5 and the composite is illustrated in
Figure 3.
When the fiber volume fraction is 40%, the fatigue hysteresis dissipated energy and interface debonded length 2
Ld/
L versus interface shear stress curves of matrix cracking mode 3 and mode 5 are illustrated in
Figure 3a,b. For matrix cracking mode 3, the hysteresis dissipated energy increases with decreasing interface shear stress from 12.6 kJ/m
3 at the interface shear stress of 50 MPa to the peak value of 63.3 kJ/m
3 at the interface shear stress of 7.6 MPa, and decreases to 0 kJ/m
3 at the interface shear stress of 0 MPa, as shown in
Figure 3a; and the interface debonded length 2
Ld/
L increases with decreasing interface shear stress from 0.32 at the interface shear stress of 50 MPa to the peak value of 1.0 at the interface shear stress of 16.4 MPa, and remains to be constant of 1.0 until the interface shear stress of 0 MPa, as shown in
Figure 3b. For matrix cracking mode 5, the hysteresis dissipated energy increases with decreasing interface shear stress from 2.9 kJ/m
3 at the interface shear stress of 50 MPa to the peak value of 31.9 kJ/m
3 at the interface shear stress of 3.8 MPa, and decreases to 0 kJ/m
3 at the interface shear stress of 0 MPa, as shown in
Figure 3a; and the interface debonded length 2
Ld/
L increases with decreasing interface shear stress from 0.10 at the interface shear stress of 50 MPa to the peak value of 1.0 at the interface shear stress of 6.5 MPa, and remains to be constant of 1.0 until the interface shear stress of 0 MPa, as shown in
Figure 3b.
When the fiber volume fraction is 45%, the fatigue hysteresis dissipated energy and interface debonded length 2
Ld/
L versus interface shear stress curves of matrix cracking mode 3 and mode 5 are illustrated in
Figure 3c,d. For matrix cracking mode 3, the hysteresis dissipated energy increases with decreasing interface shear stress from 8.3 kJ/m
3 at the interface shear stress of 50 MPa to the peak value of 51.4 kJ/m
3 at the interface shear stress of 6.1 MPa, and decreases to 0 kJ/m
3 at the interface shear stress of 0 MPa, as shown in
Figure 3c; and the interface debonded length 2
Ld/
L increases with decreasing interface shear stress from 0.25 at the interface shear stress of 50 MPa to the peak value of 1.0 at the interface shear stress of 12.8 MPa, and remains to be constant of 1.0 until the interface shear stress of 0 MPa, as shown in
Figure 3d. For matrix cracking mode 5, the hysteresis dissipated energy increases with decreasing interface shear stress from 2.4 kJ/m
3 at the interface shear stress of 50 MPa to the peak value of 26 kJ/m
3 at the interface shear stress of 3.1 MPa, and decreases to 0 kJ/m
3 at the interface shear stress of 0 MPa, as shown in
Figure 3c; and the interface debonded length 2
Ld/
L increases with decreasing interface shear stress from 0.07 at the interface shear stress of 50 MPa to the peak value of 1.0 at the interface shear stress of 4.8 MPa, and remains to be constant of 1.0 until the interface shear stress of 0 MPa, as shown in
Figure 3d.
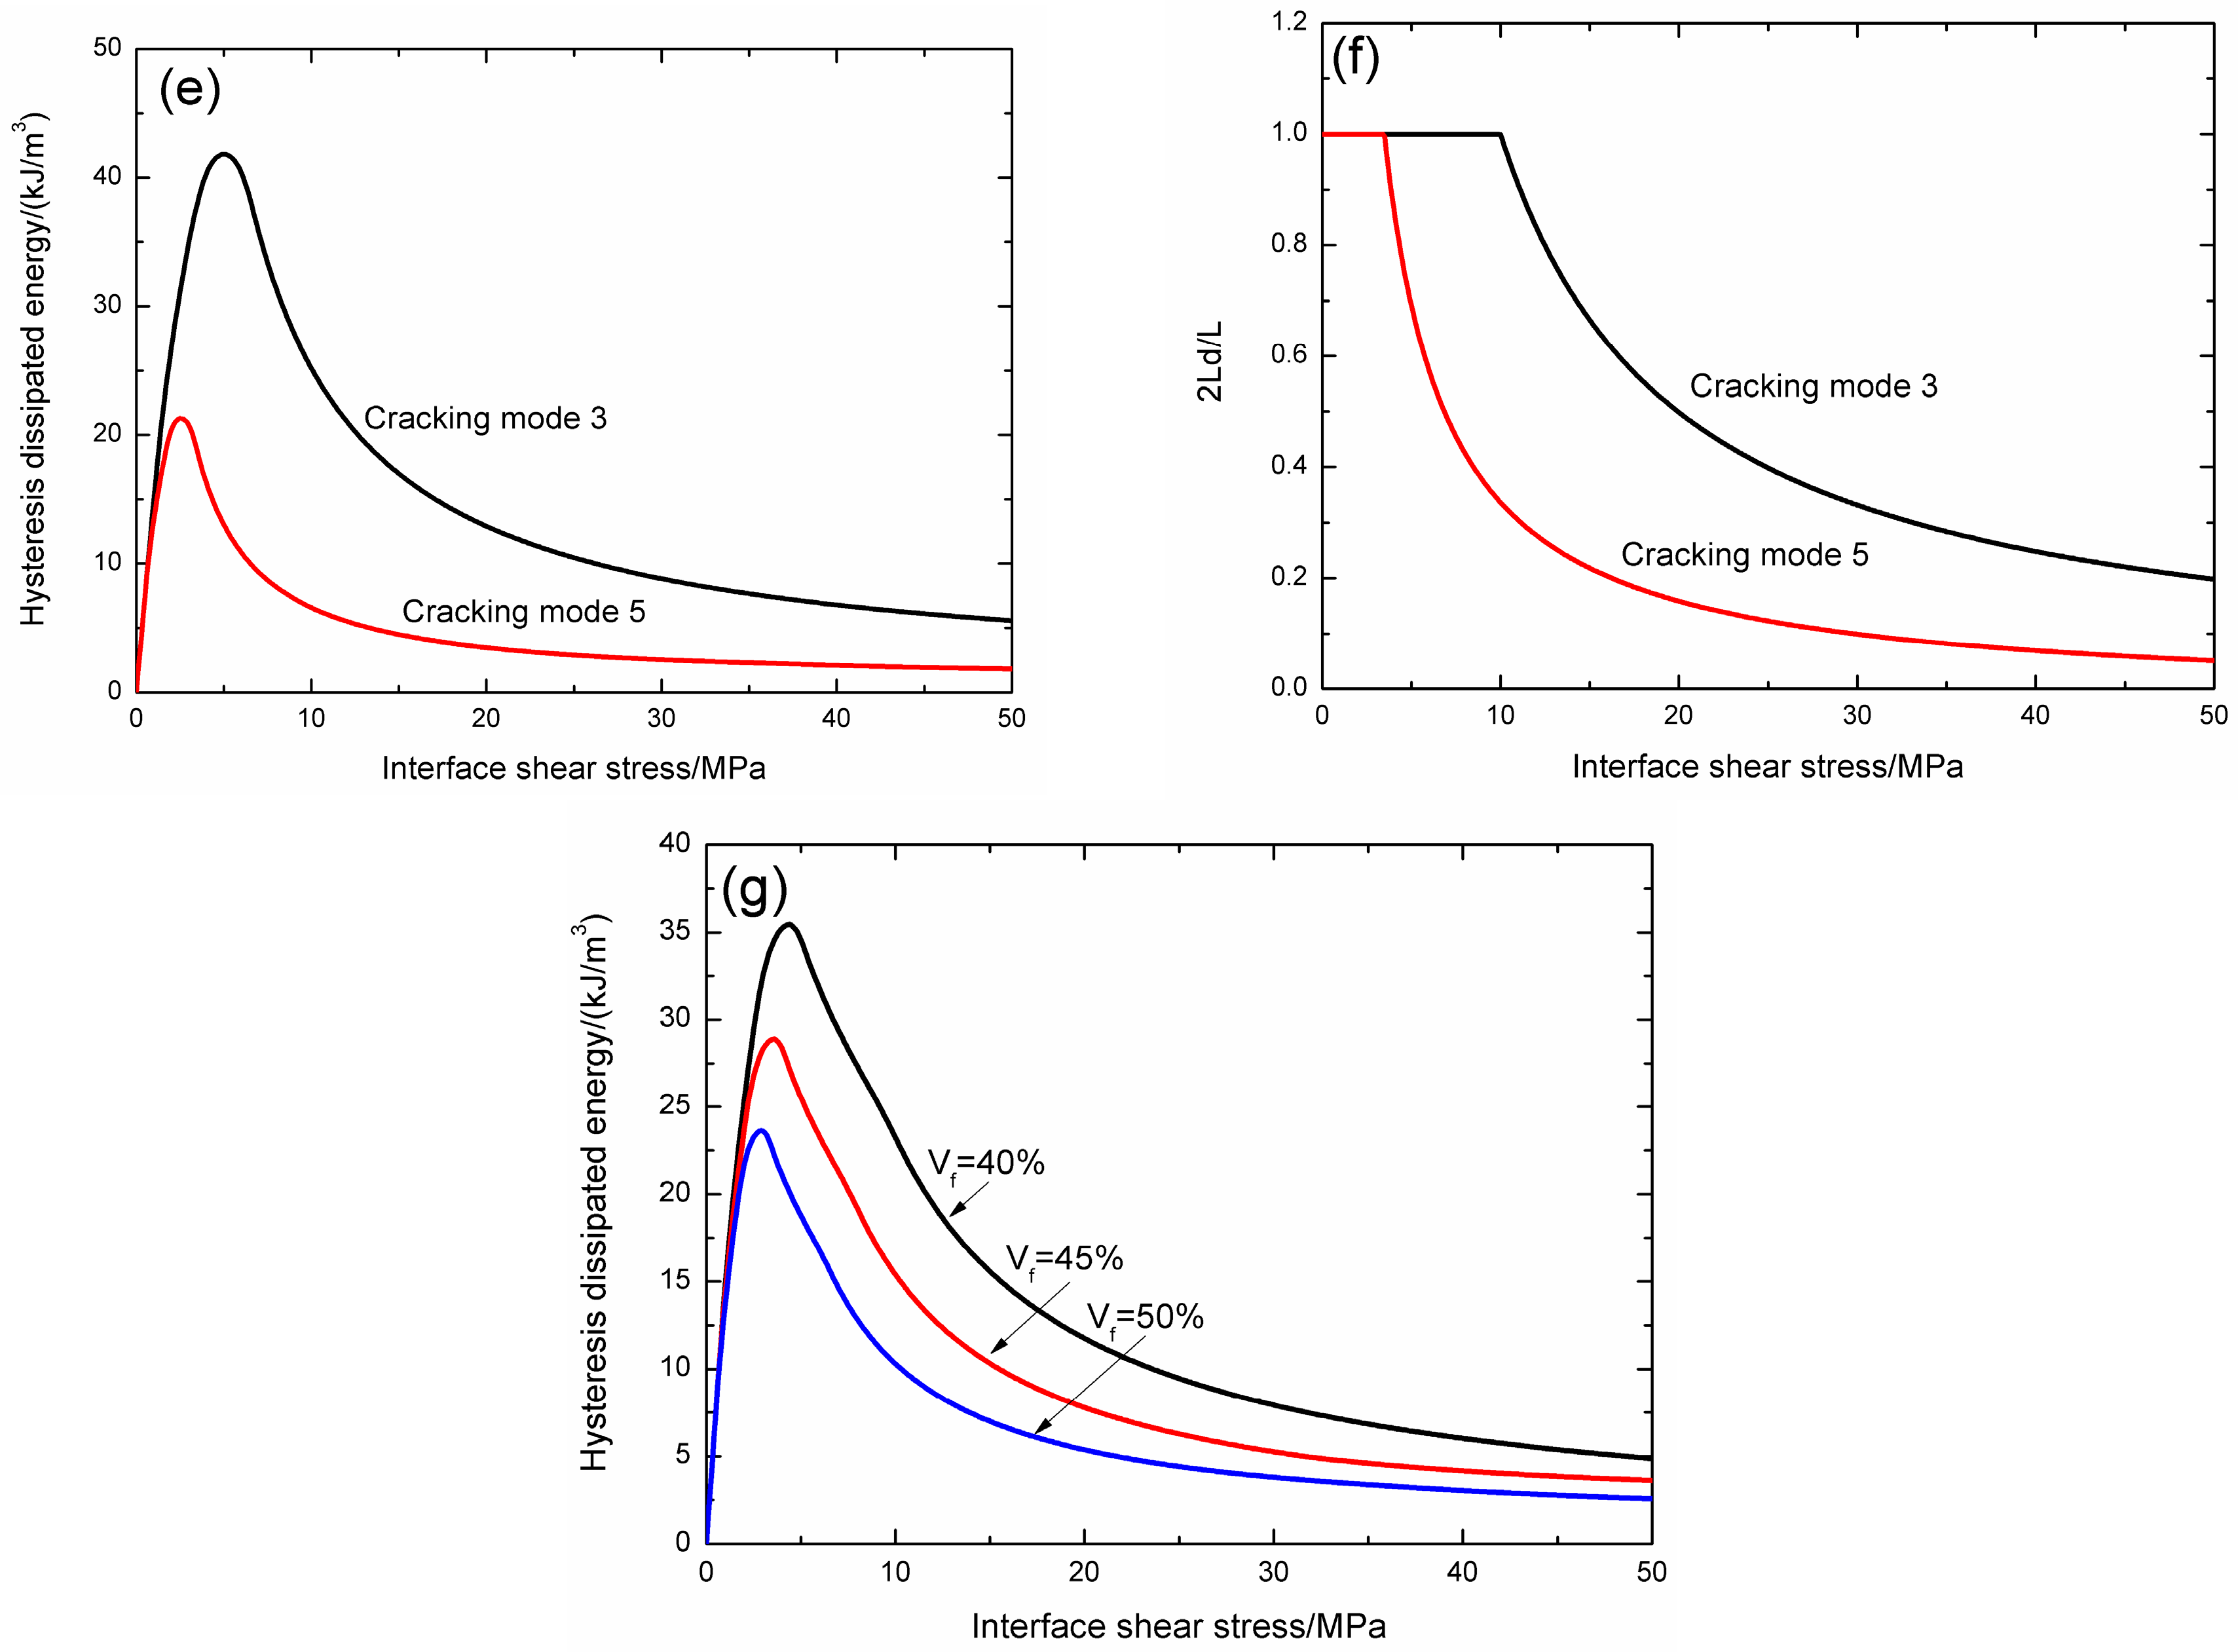
When the fiber volume fraction is 50%, the fatigue hysteresis dissipated energy and interface debonded length 2
Ld/
L versus interface shear stress curves of matrix cracking mode 3 and mode 5 are illustrated in
Figure 3e,f. For matrix cracking mode 3, the hysteresis dissipated energy increases with decreasing interface shear stress from 5.5 kJ/m
3 at the interface shear stress of 50 MPa to the peak value of 41.8 kJ/m
3 at the interface shear stress of 5 MPa, and decreases to 0 kJ/m
3 at the interface shear stress of 0 MPa, as shown in
Figure 3e; and the interface debonded length 2
Ld/
L increases with decreasing interface shear stress from 0.19 at the interface shear stress of 50 MPa to the peak value of 1.0 at the interface shear stress of 9.9 MPa, and remains to be constant of 1.0 until the interface shear stress of 0 MPa, as shown in
Figure 3f. For matrix cracking mode 5, the hysteresis dissipated energy increases with decreasing interface shear stress from 1.8 kJ/m
3 at the interface shear stress of 50 MPa to the peak value of 21.2 kJ/m
3 at the interface shear stress of 2.5 MPa, and decreases to 0 kJ/m
3 at the interface shear stress of 0 MPa, as shown in
Figure 3e; and the interface debonded length 2
Ld/
L increases with decreasing interface shear stress from 0.05 at the interface shear stress of 50 MPa to the peak value of 1.0 at the interface shear stress of 3.4 MPa, and remains to be constant of 1.0 until the interface shear stress of 0 MPa, as shown in
Figure 3f.
When matrix cracking mode 3 proportion
η is 0.2, the composite fatigue hysteresis dissipated energy versus interface shear stress curves when the fiber volume fraction is 40%, 45% and 50% are illustrated in
Figure 3g. When the fiber volume fraction is 40%, the composite hysteresis dissipated energy increases with decreasing interface shear stress from 4.8 kJ/m
3 at the interface shear stress of 50 MPa to the peak value of 35.4 kJ/m
3 at the interface shear stress of 4.4 MPa, and decreases to 0 kJ/m
3 at the interface shear stress of 0 MPa; when the fiber volume fraction is 45%, the composite hysteresis dissipated energy increases with decreasing interface shear stress from 3.6 kJ/m
3 at the interface shear stress of 50 MPa to the peak value of 28.8 kJ/m
3 at the interface shear stress of 3.6 MPa, and decreases to 0 kJ/m
3 at the interface shear stress of 0 MPa; and when the fiber volume fraction is 50%, the composite hysteresis dissipated energy increases with decreasing interface shear stress from 2.5 kJ/m
3 at the interface shear stress of 50 MPa to the peak value of 23.6 kJ/m
3 at the interface shear stress of 2.9 MPa, and decreases to 0 kJ/m
3 at the interface shear stress of 0 MPa.
When fiber volume content increases, the hysteresis dissipated energy of matrix cracking mode 3, mode 5 and the composite at the same interface shear stress decrease, due to less interface debonding and frictional slip between fibers and the matrix.
3.2. Effect of Fatigue Peak Stress
The effect of peak stress on fatigue hysteresis dissipated energy evolution and interface slip of matrix cracking mode 3, mode 5 and composite is illustrated in
Figure 4.
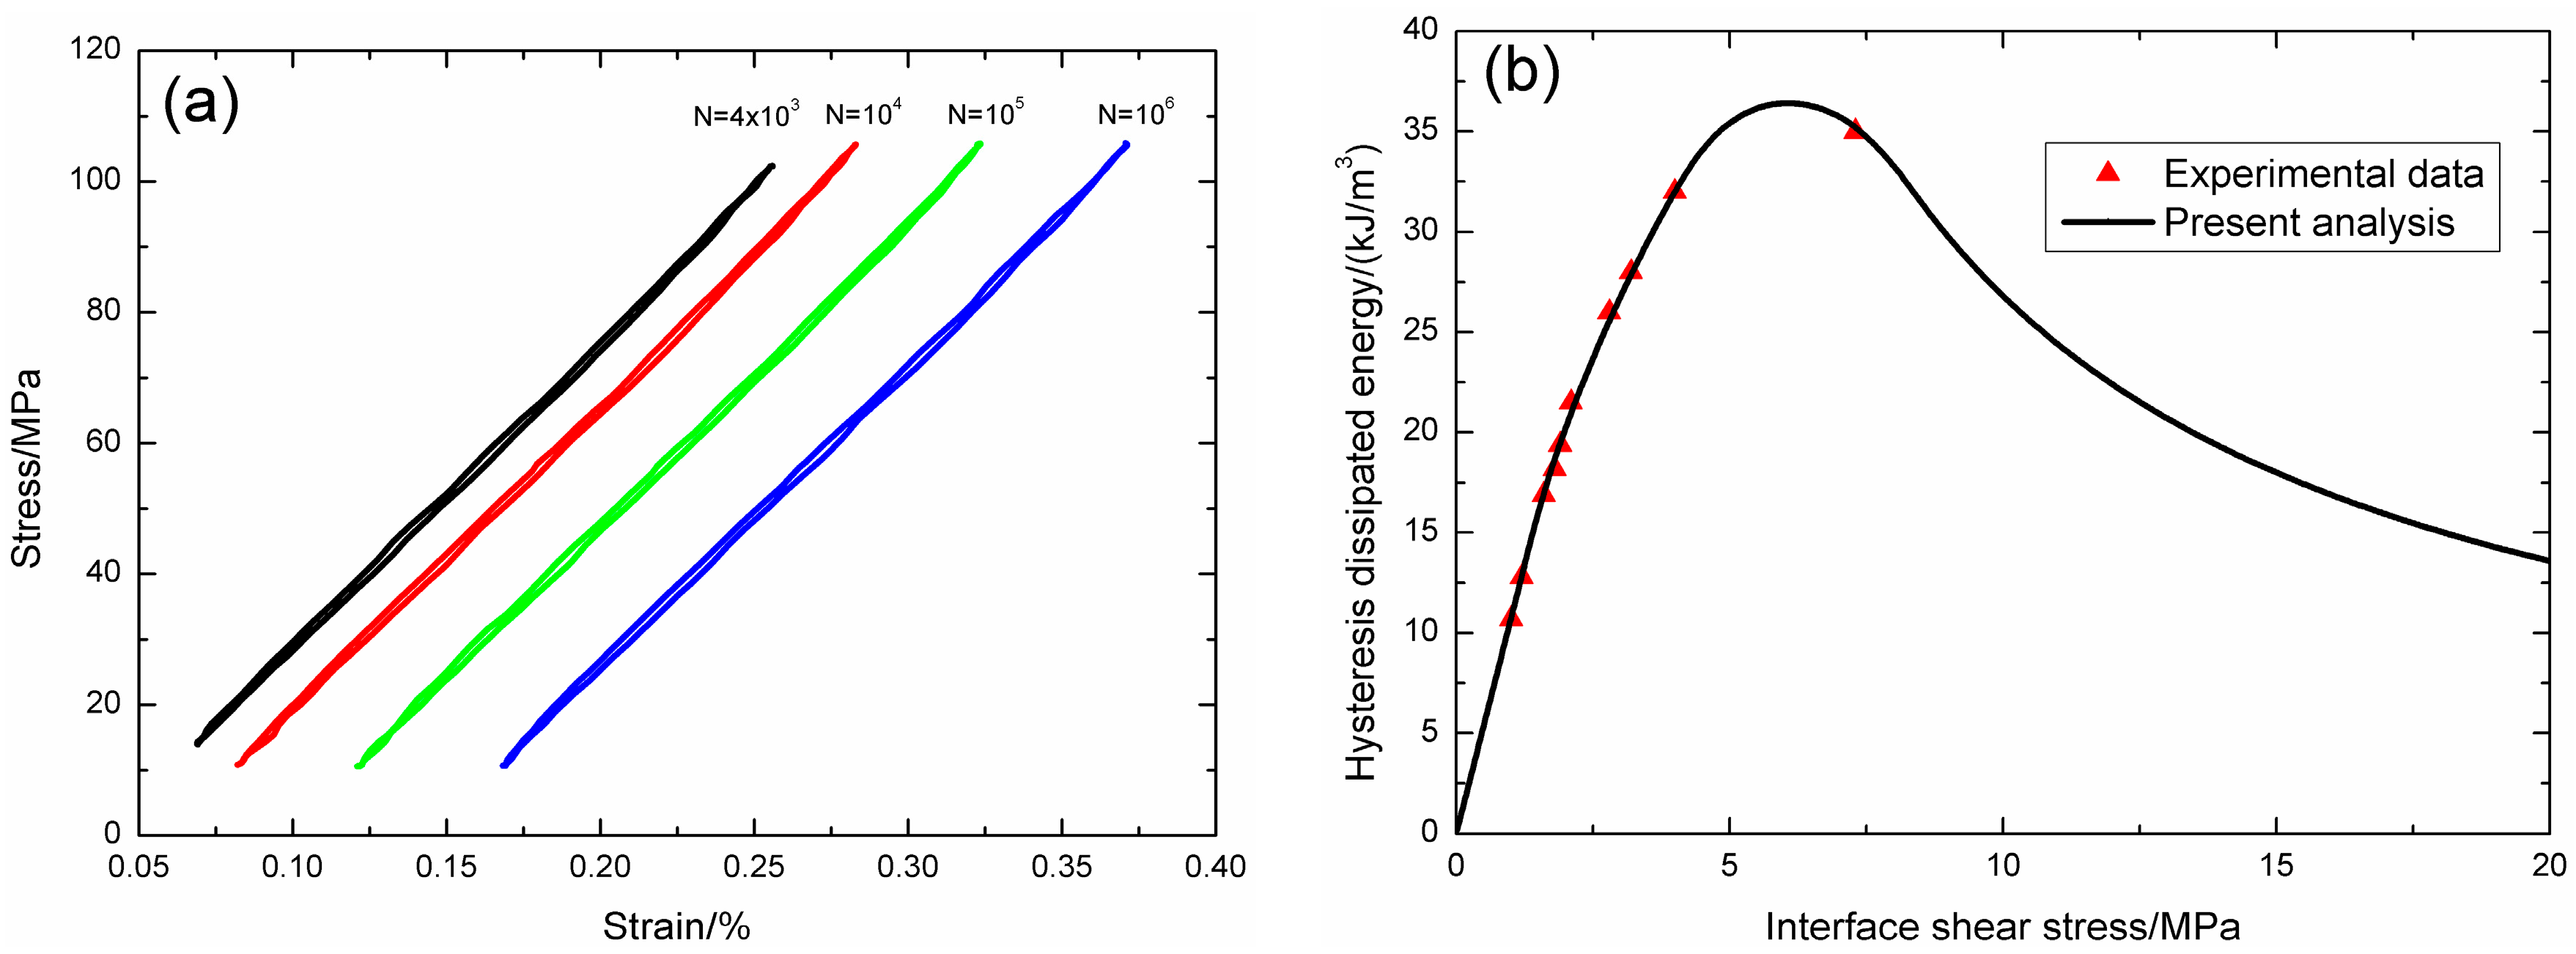
When the fatigue peak stress is 150 MPa, the fatigue hysteresis dissipated energy and interface debonded length 2
Ld/
L versus interface shear stress curves of matrix cracking mode 3 and mode 5 are illustrated in
Figure 4a,b. For matrix cracking mode 3, the hysteresis dissipated energy increases with decreasing interface shear stress from 8.2 kJ/m
3 at the interface shear stress of 50 MPa to the peak value of 44 kJ/m
3 at the interface shear stress of 7 MPa, and decreases to 0 kJ/m
3 at the interface shear stress of 0 MPa, as shown in
Figure 4a; and the interface debonded length 2
Ld/
L increases with decreasing interface shear stress from 0.34 at the interface shear stress of 50 MPa to the peak value of 1.0 at the interface shear stress of 17.2 MPa, and remains to be constant of 1.0 until the interface shear stress of 0 MPa, as shown in
Figure 4b. For matrix cracking mode 5, the hysteresis dissipated energy increases with decreasing interface shear stress from 1.9 kJ/m
3 at the interface shear stress of 50 MPa to the peak value of 22.2 kJ/m
3 at the interface shear stress of 3.5 MPa, and decreases to 0 kJ/m
3 at the interface shear stress of 0 MPa, as shown in
Figure 4a; and the interface debonded length 2
Ld/
L increases with decreasing interface shear stress from 0.1 at the interface shear stress of 50 MPa to the peak value of 1.0 at the interface shear stress of 6.6 MPa, and remains to be constant of 1.0 until the interface shear stress of 0 MPa, as shown in
Figure 4b.
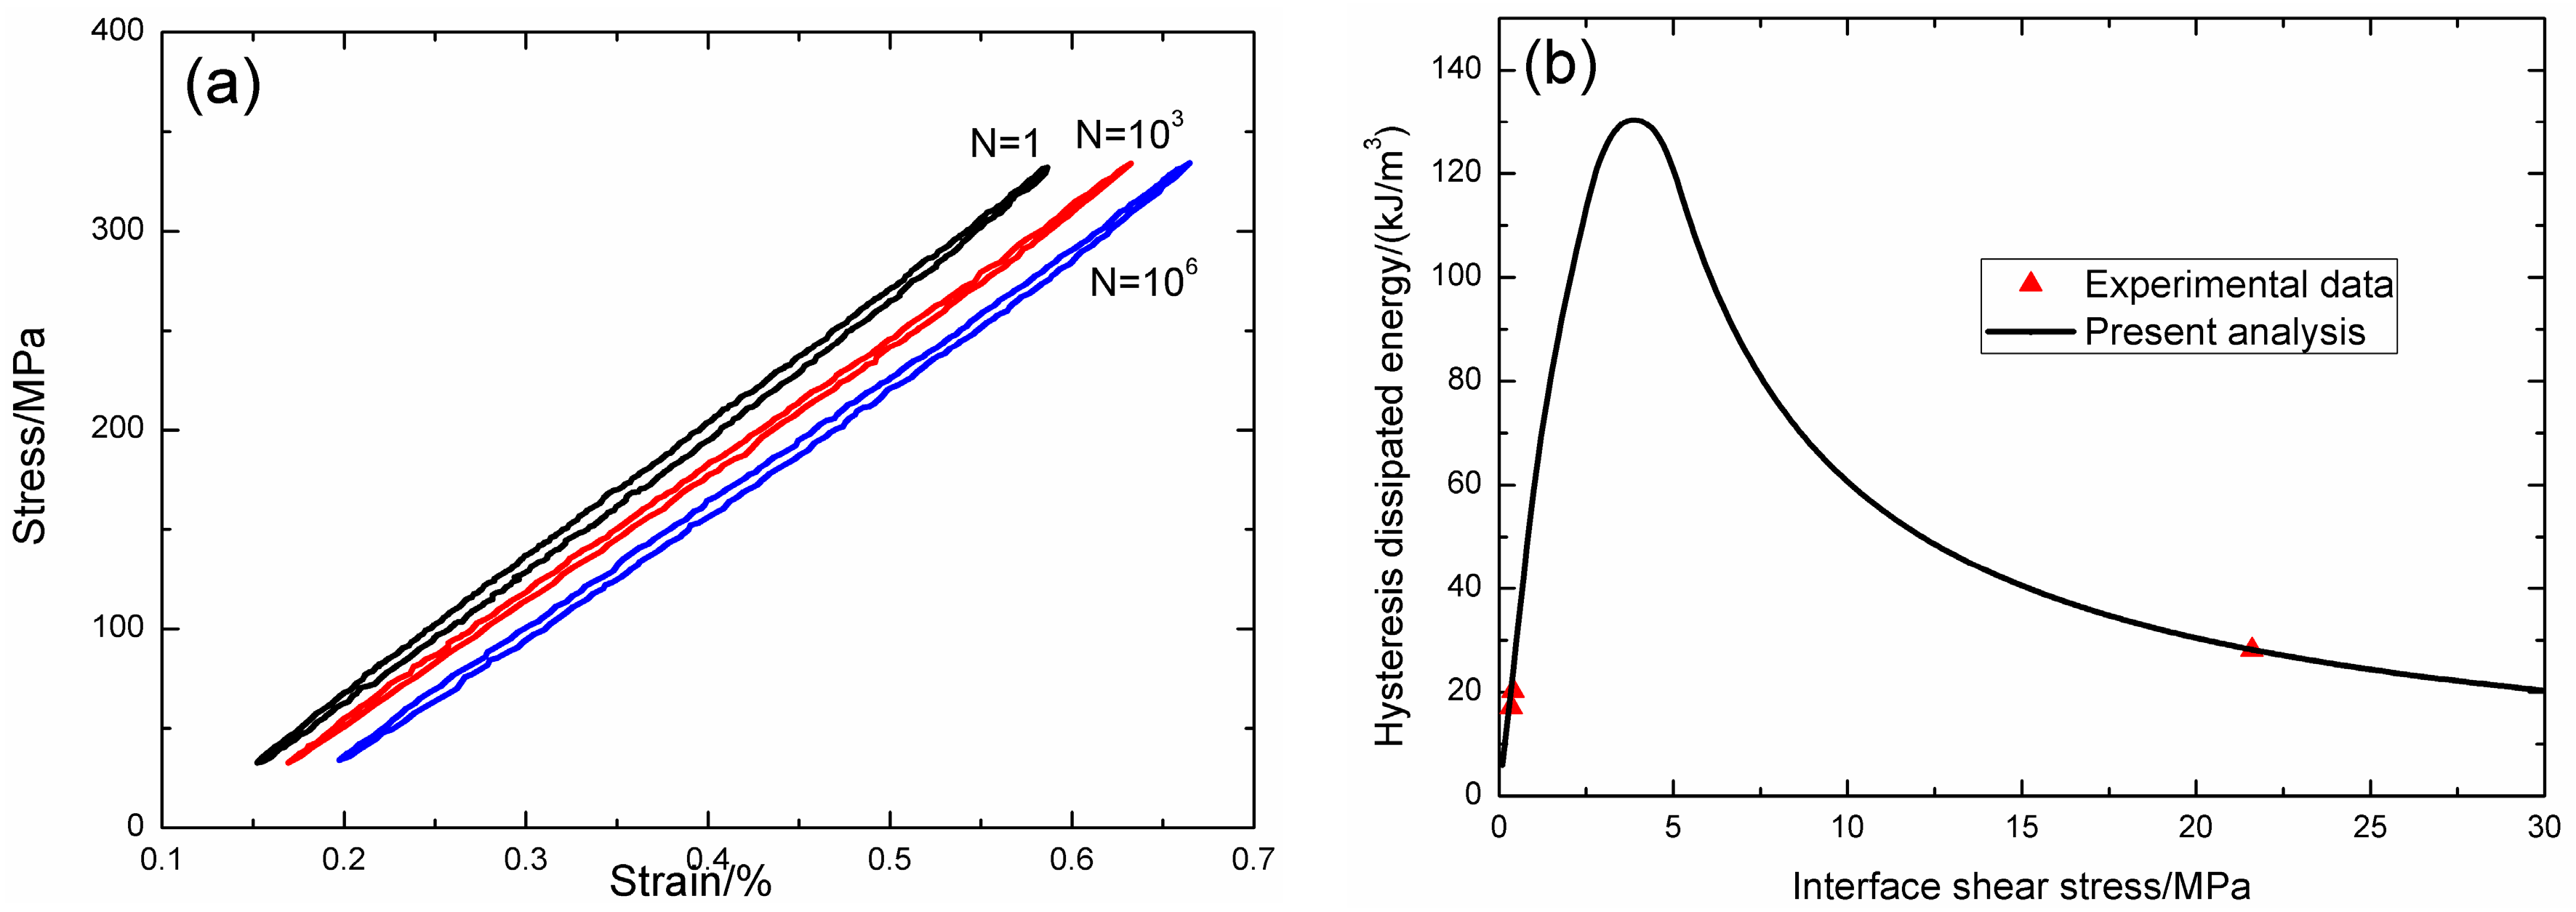
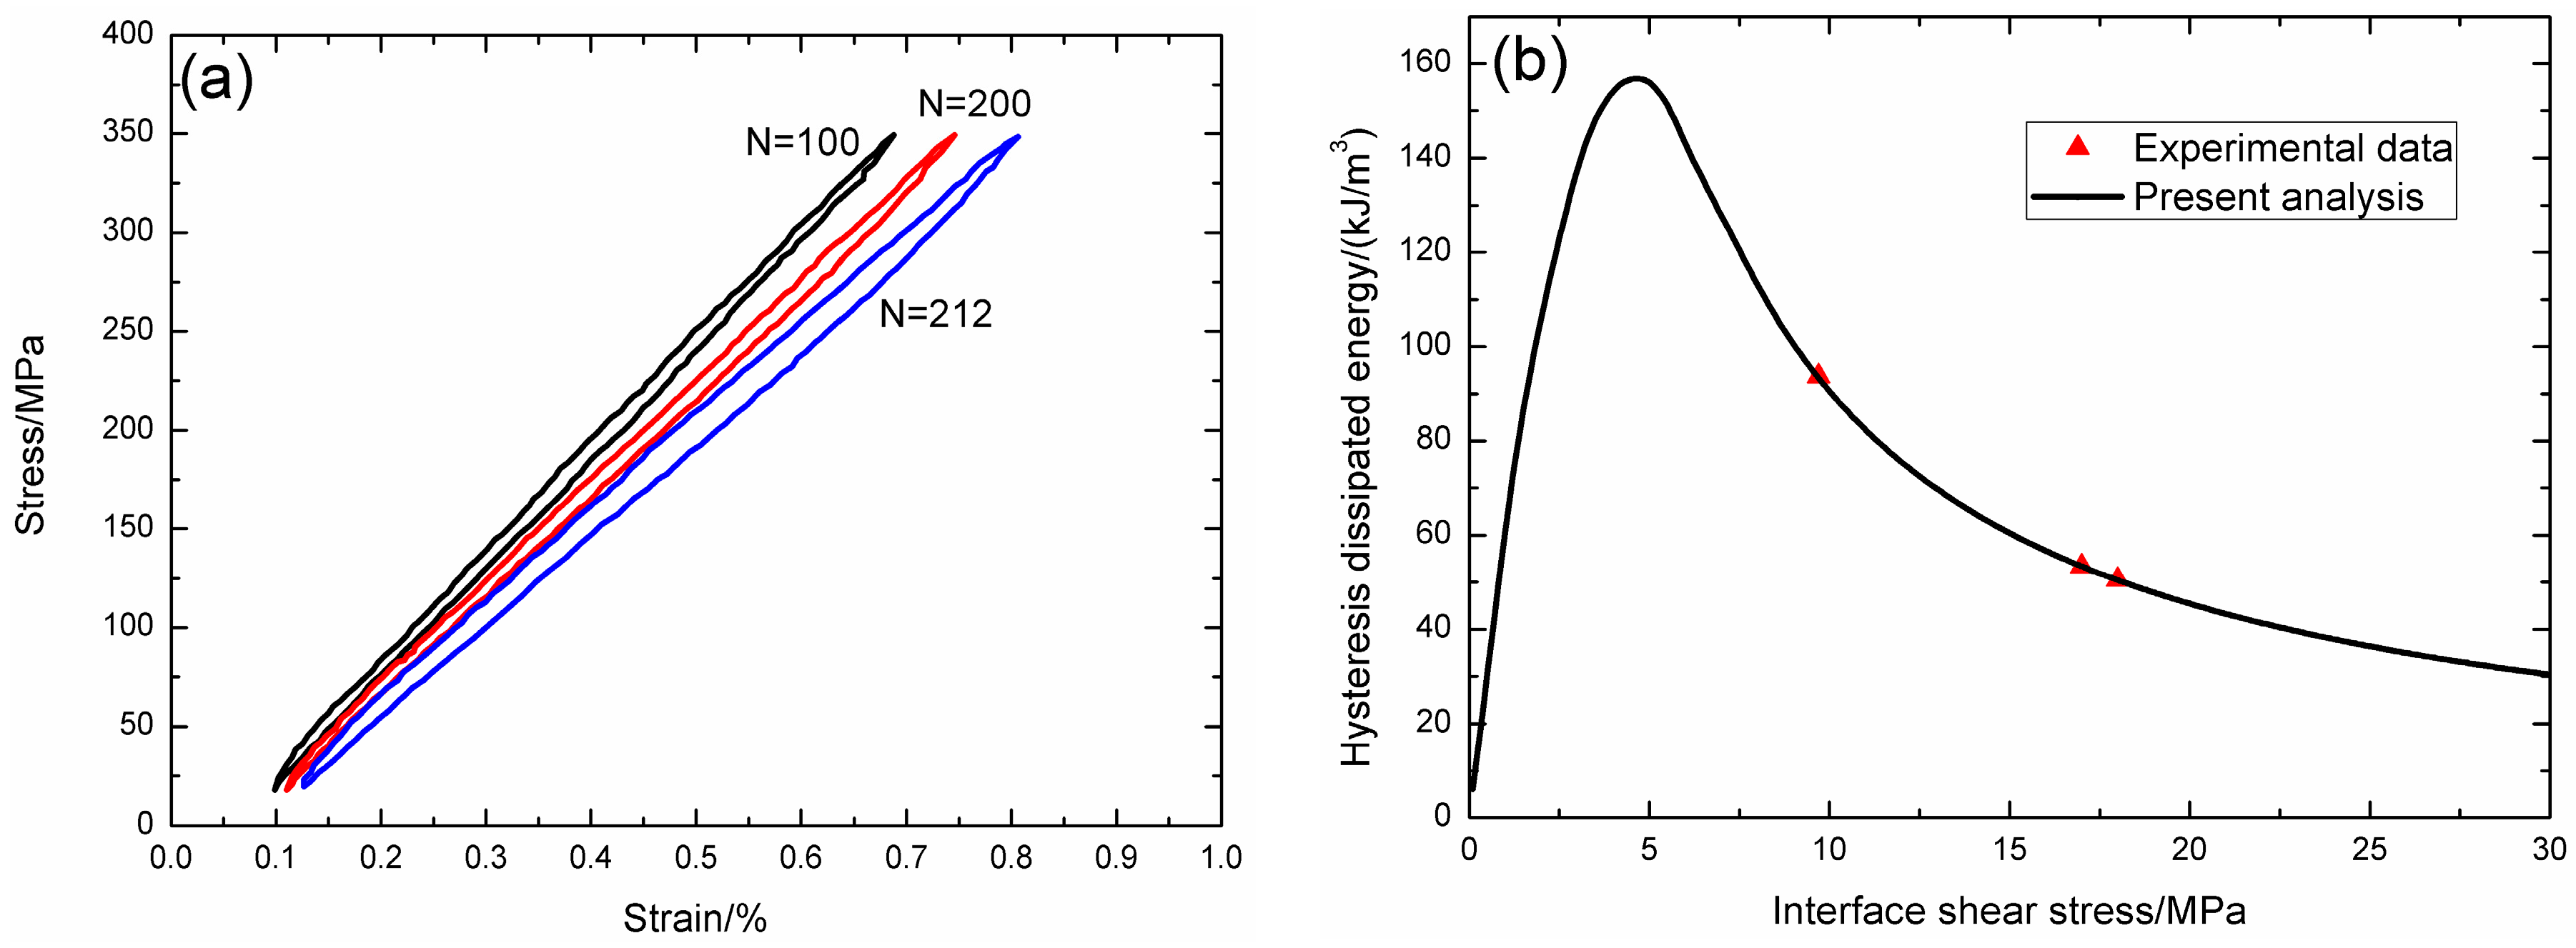
When
σmax = 200 MPa, the fatigue hysteresis dissipated energy and interface debonded length 2
Ld/
L versus interface shear stress curves of matrix cracking mode 3 and mode 5 are illustrated in
Figure 4c,d. For matrix cracking mode 3, the hysteresis dissipated energy increases with decreasing interface shear stress from 18.2 kJ/m
3 at the interface shear stress of 50 MPa to the peak value of 76.7 kJ/m
3 at the interface shear stress of 9.2 MPa, and decreases to 0 kJ/m
3 at the interface shear stress of 0 MPa, as shown in
Figure 4c; and the interface debonded length 2
Ld/
L increases with decreasing interface shear stress from 0.47 at the interface shear stress of 50 MPa to the peak value of 1.0 at the interface shear stress of 23.7 MPa, and remains to be constant of 1.0 until the interface shear stress of 0 MPa, as shown in
Figure 4d. For matrix cracking mode 5, the hysteresis dissipated energy increases with decreasing interface shear stress from 4.5 kJ/m
3 at the interface shear stress of 50 MPa to the peak value of 39.5 kJ/m
3 at the interface shear stress of 4.7 MPa, and decreases to 0 kJ/m
3 at the interface shear stress of 0 MPa, as shown in
Figure 4c; and the interface debonded length 2
Ld/
L increases with decreasing interface shear stress from 0.17 at the interface shear stress of 50 MPa to the peak value of 1.0 at the interface shear stress of 10 MPa, and remains to be constant of 1.0 until the interface shear stress of 0 MPa, as shown in
Figure 4d.
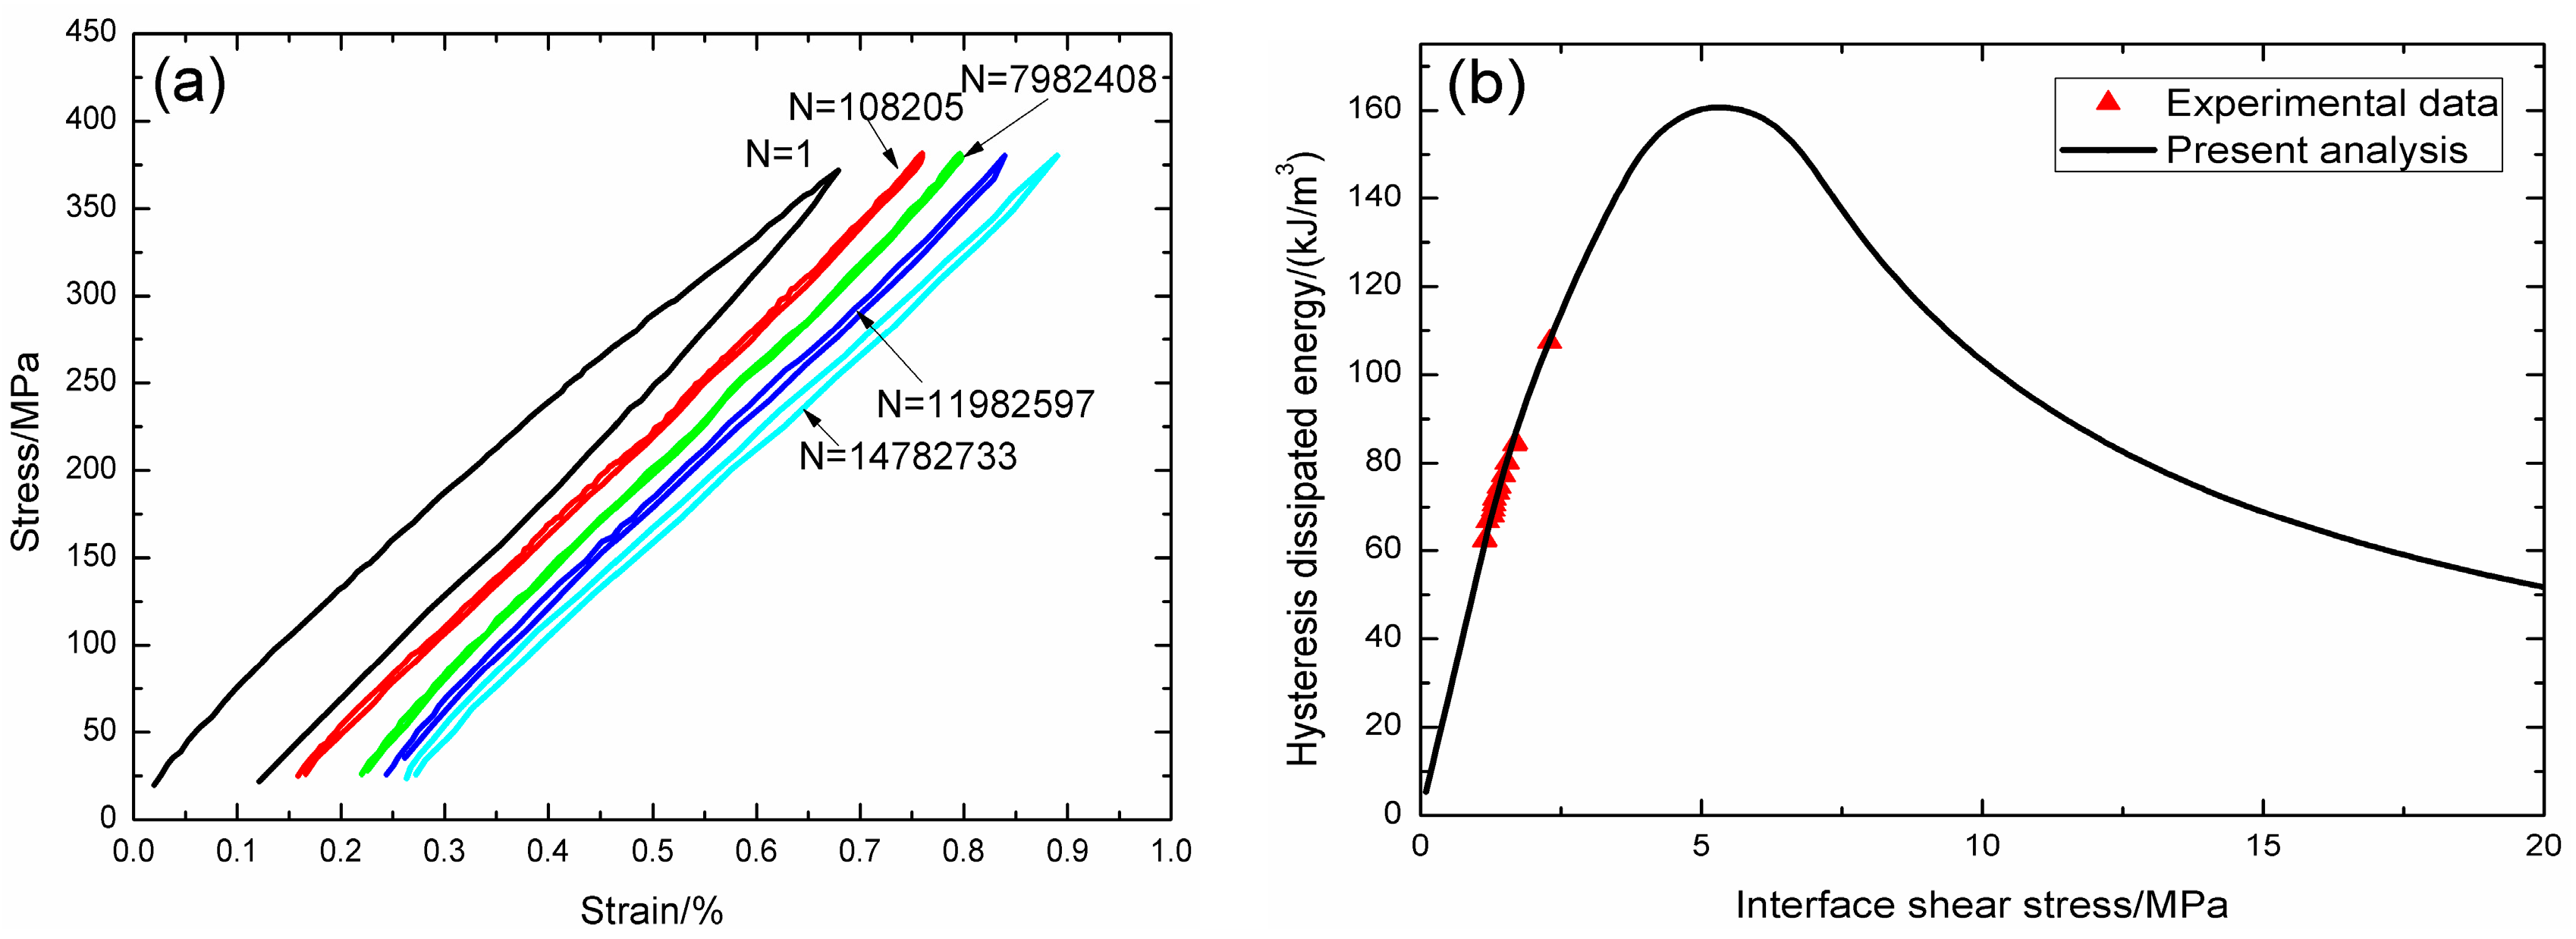
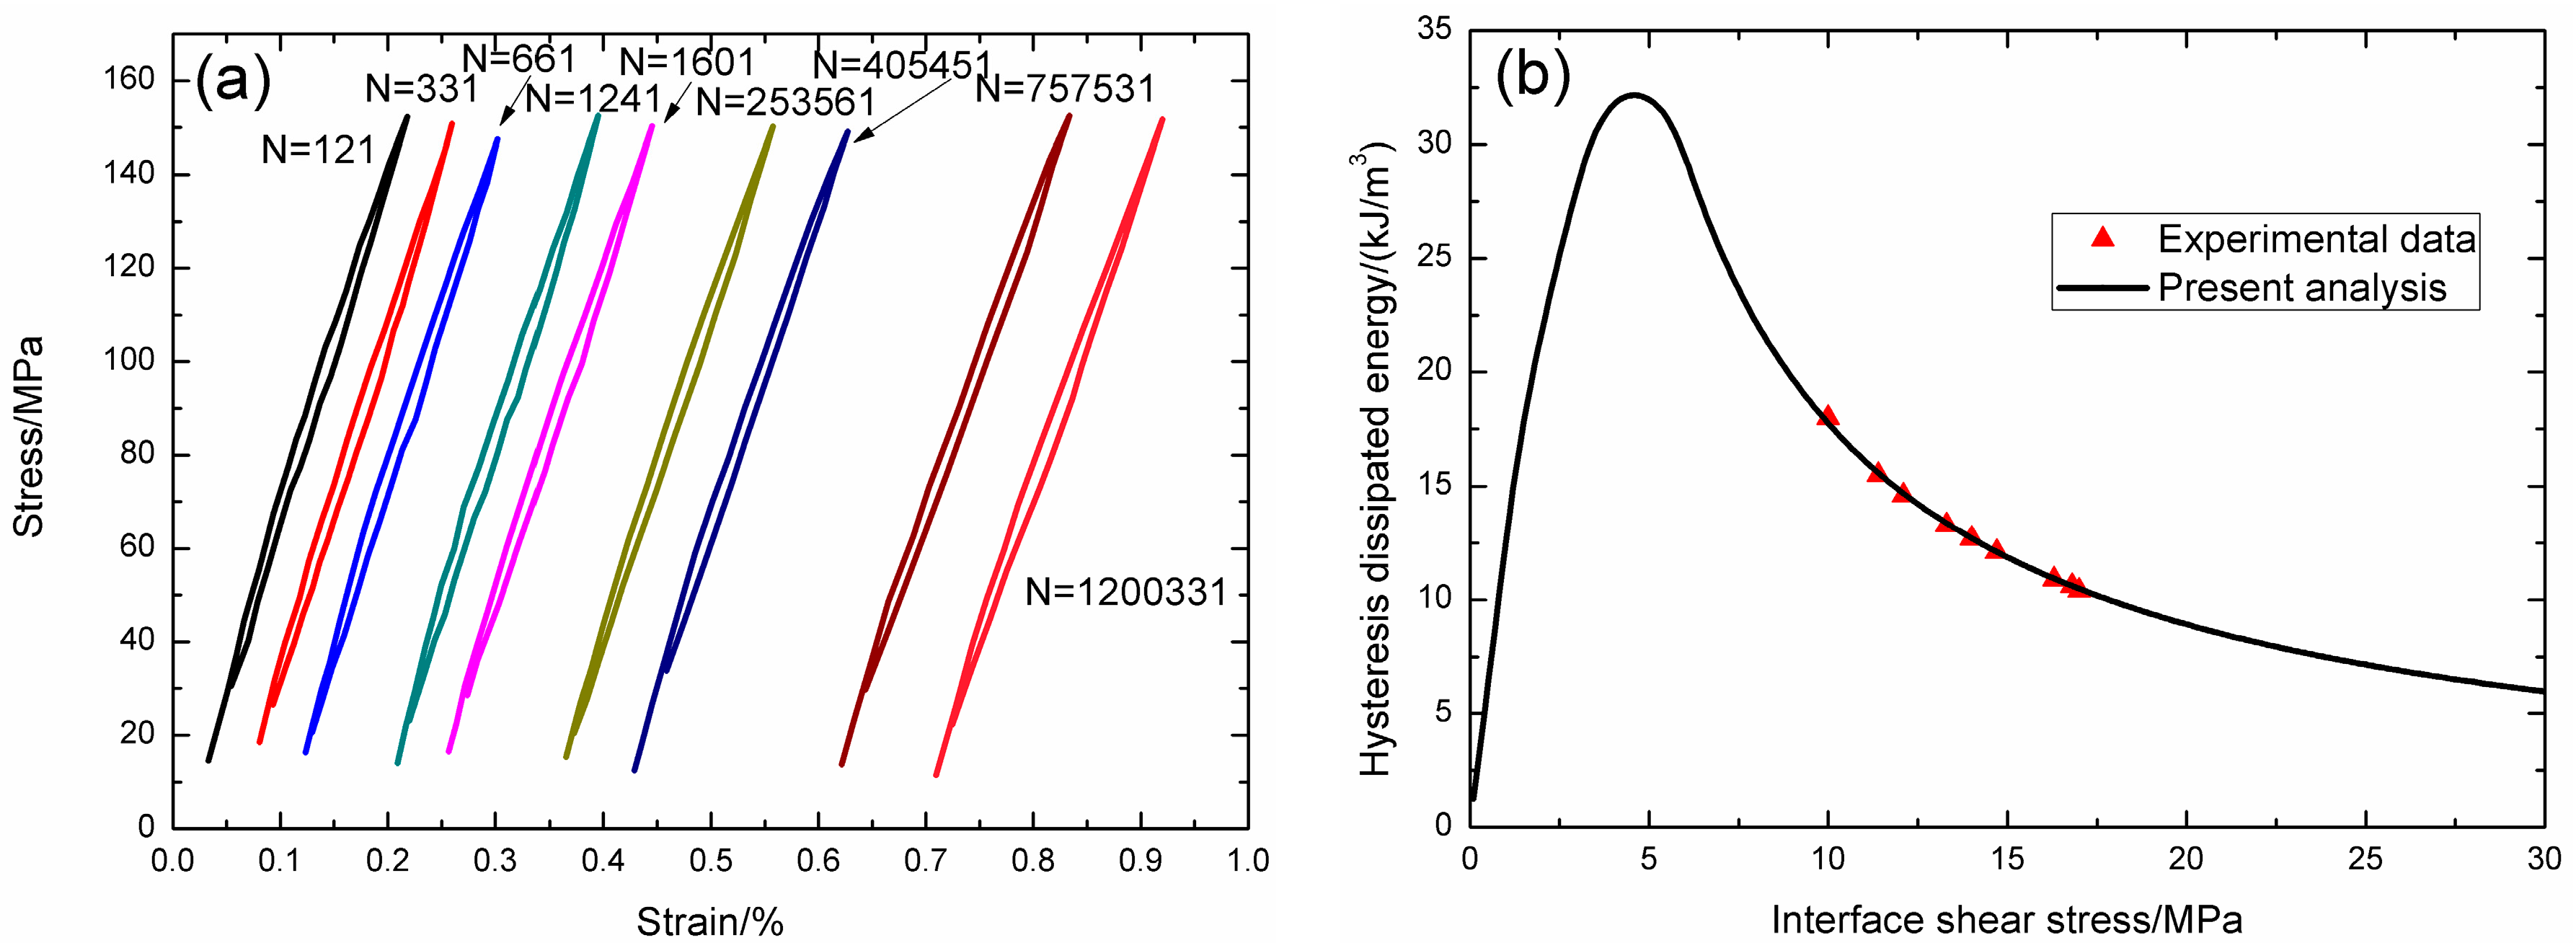
When
σmax = 250 MPa, the fatigue hysteresis dissipated energy and interface debonded length 2
Ld/
L versus interface shear stress curves of matrix cracking mode 3 and mode 5 are illustrated in
Figure 4e,f. For matrix cracking mode 3, the hysteresis dissipated energy increases with decreasing interface shear stress from 33.8 kJ/m
3 at the interface shear stress of 50 MPa to the peak value of 118.1 kJ/m
3 at the interface shear stress of 11.3 MPa, and decreases to 0 kJ/m
3 at the interface shear stress of 0 MPa, as shown in
Figure 4e; and the interface debonded length 2
Ld/
L increases with decreasing interface shear stress from 0.6 at the interface shear stress of 50 MPa to the peak value of 1.0 at the interface shear stress of 30.1 MPa, and remains to be constant of 1.0 until the interface shear stress of 0 MPa, as shown in
Figure 4f. For matrix cracking mode 5, the hysteresis dissipated energy increases with decreasing interface shear stress from 8.7 kJ/m
3 at the interface shear stress of 50 MPa to the peak value of 61.7 kJ/m
3 at the interface shear stress of 5.9 MPa, and decreases to 0 kJ/m
3 at the interface shear stress of 0 MPa, as shown in
Figure 4e; and the interface debonded length 2
Ld/
L increases with decreasing interface shear stress from 0.24 at the interface shear stress of 50 MPa to the peak value of 1.0 at the interface shear stress of 13.5 MPa, and remains to be constant of 1.0 until the interface shear stress of 0 MPa, as shown in
Figure 4f.
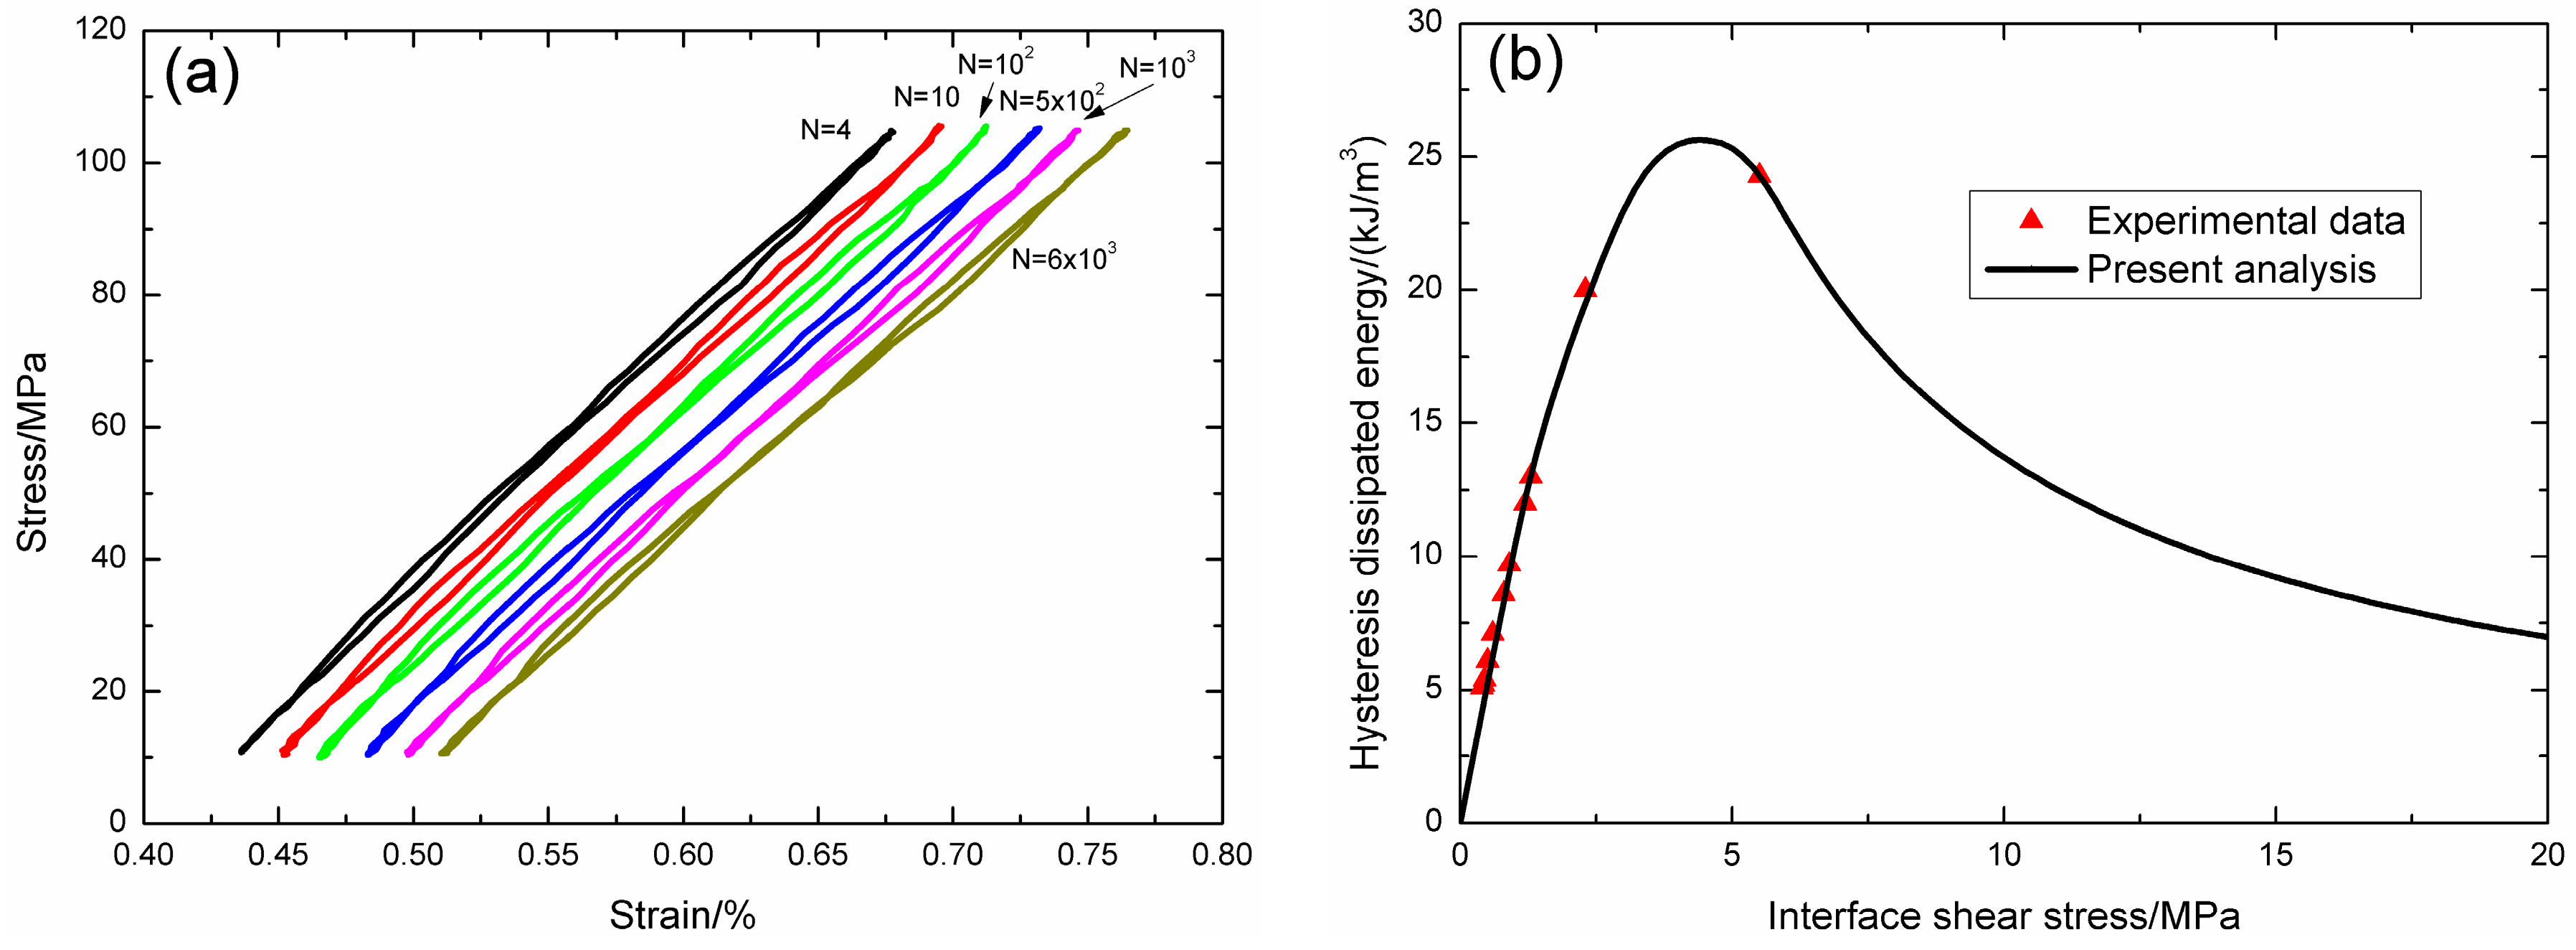
When the proportion of matrix cracking mode 3 is
η = 0.2, the composite hysteresis dissipated energy versus interface shear stress curves when the fatigue peak stress is 150 and 200 MPa are illustrated in
Figure 4g. When the fatigue peak stress is 150 MPa, the composite hysteresis dissipated energy increases with decreasing interface shear stress from 3.1 kJ/m
3 at the interface shear stress of 50 MPa to the peak value of 24.6 kJ/m
3 at the interface shear stress of 4.1 MPa, and decreases to 0 kJ/m
3 at the interface shear stress of 0 MPa; when the fatigue peak stress is 200 MPa, the composite hysteresis dissipated energy increases with decreasing interface shear stress from 7.2 kJ/m
3 at the interface shear stress of 50 MPa to the peak value of 43.7 kJ/m
3 at the interface shear stress of 5.4 MPa, and decreases to 0 kJ/m
3 at the interface shear stress of 0 MPa; and when the fatigue peak stress is 250 MPa, the composite hysteresis dissipated energy increases with decreasing interface shear stress from 13.8 kJ/m
3 at the interface shear stress of 50 MPa to the peak value of 68.3 kJ/m
3 at the interface shear stress of 6.8 MPa, and decreases to 0 kJ/m
3 at the interface shear stress of 0 MPa.
When the fatigue peak stress increases, the hysteresis dissipated energy of matrix cracking mode 3, mode 5 and composite at the same interface shear stress increase, due to more interface debonding and frictional slip between fibers and the matrix.
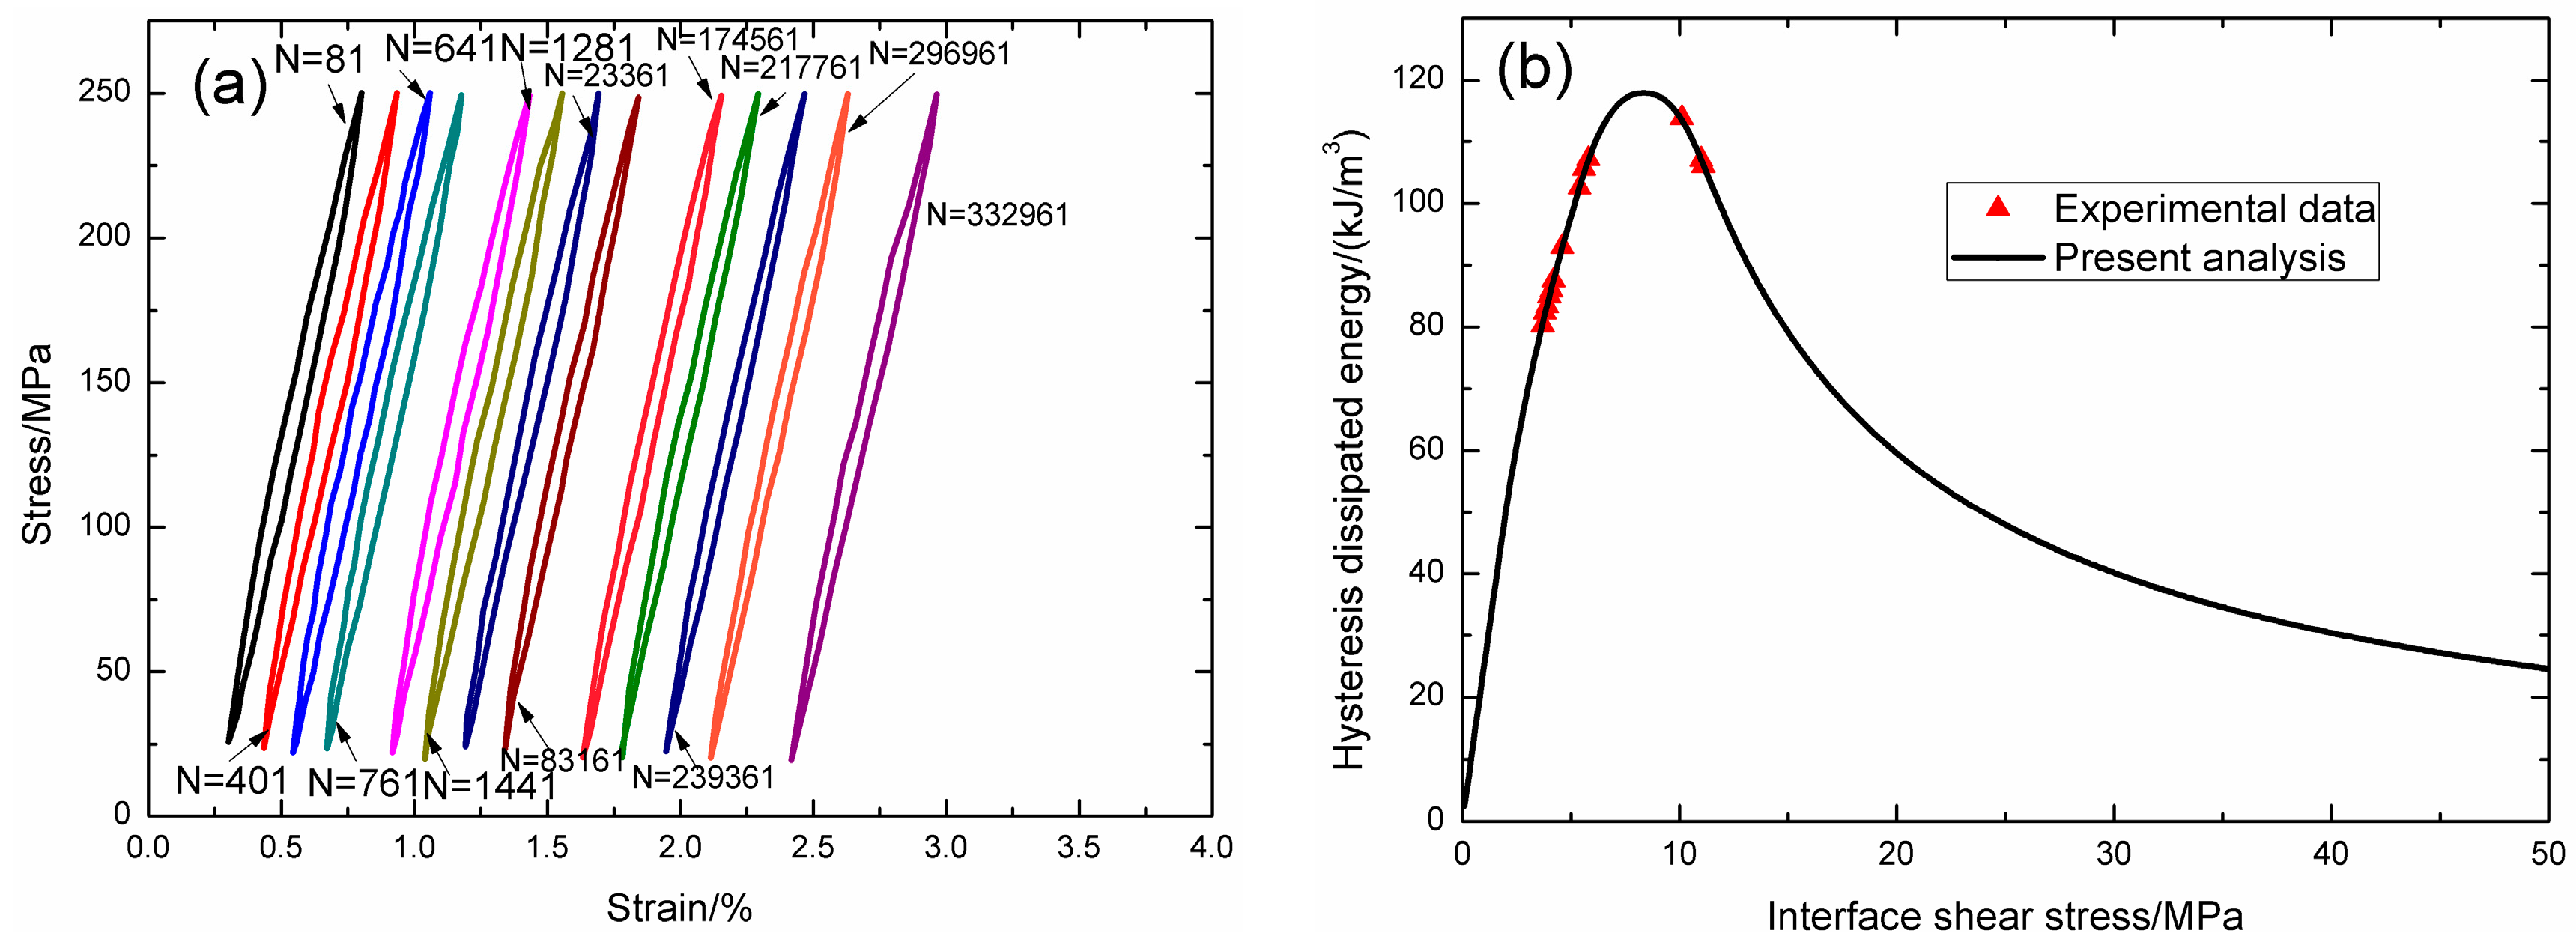
3.3. Effect of Matrix Cracking Mode Proportion
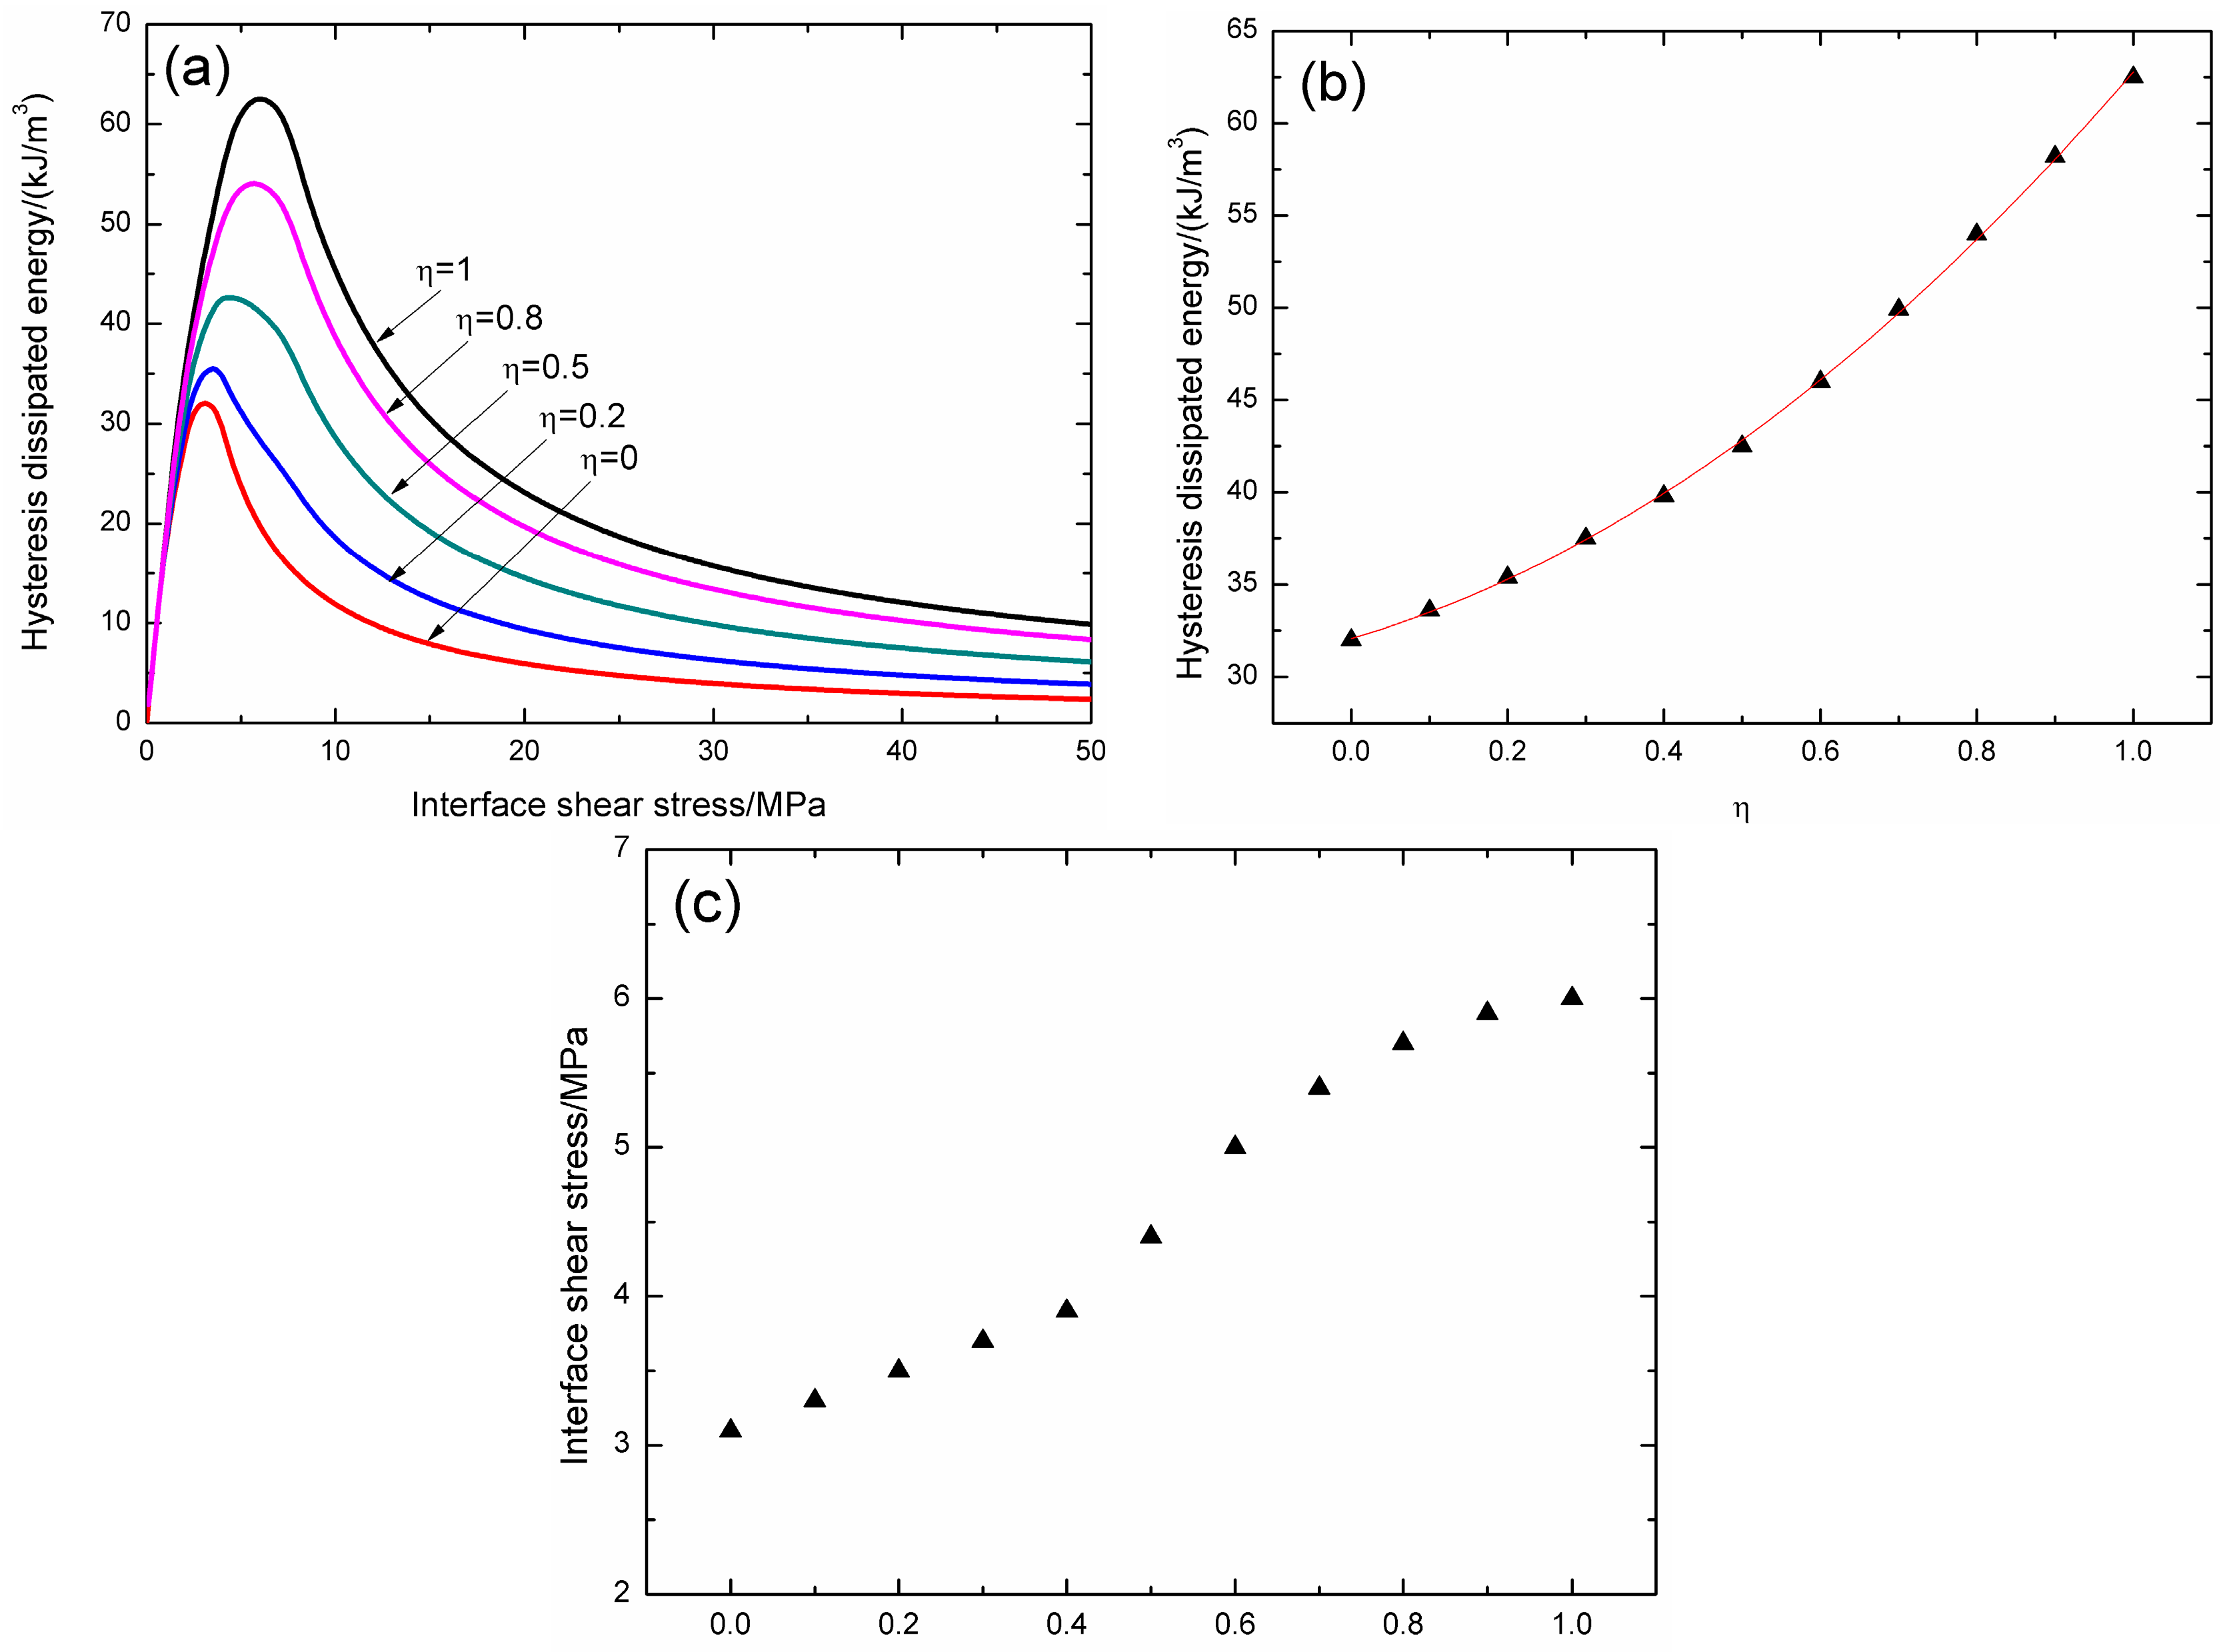
The effect of matrix cracking proportion
η on fatigue hysteresis dissipated energy versus interface shear stress curves is illustrated in
Figure 5a. When
η is 0, there is only matrix cracking mode 5 in the composite, the composite hysteresis dissipated energy increases from 2.3 kJ/m
3 at the interface shear stress of 50 MPa to the peak value of 32 kJ/m
3 at the interface shear stress of 3.1 MPa, as shown in
Figure 5a; when
η is 1, there is only matrix cracking mode 3 in the composite, the composite hysteresis dissipated energy increases from 9.8 kJ/m
3 at the interface shear stress of 50 MPa to the peak value of 62.5 kJ/m
3 at the interface shear stress of 6 MPa, as shown in
Figure 5a; and when 0 <
η < 1, there are both matrix cracking mode 3 and mode 5 in the composite, when
η is 0.2, the composite hysteresis dissipated energy increases from 3.8 kJ/m
3 at the interface shear stress of 50 MPa to the peak value of 35.4 kJ/m
3 at the interface shear stress of 3.5 MPa; when
η is 0.5, the composite hysteresis dissipated energy increases from 6.1 kJ/m
3 at the interface shear stress of 50 MPa to the peak value of 42.5 kJ/m
3 at the interface shear stress of 4.4 MPa; and when
η is 0.8, the composite hysteresis dissipated energy increases from 8.3 kJ/m
3 at the interface shear stress of 50 MPa to the peak value of 54 kJ/m
3 at the interface shear stress of 5.7 MPa, as shown in
Figure 5a. With increasing of matrix cracking mode 3 proportion
η, the peak value of hysteresis dissipated energy increases, as shown in
Figure 5b; and the interface shear stress corresponding to the peak value of hysteresis dissipated energy also increases, as shown in
Figure 5c.
When matrix cracking mode 3 proportion η increases, the composite hysteresis dissipated energy and the corresponding interface shear stress increase, which indicates that the hysteresis dissipated energy can approach to the peak value at high interface shear stress.


