
Degradation of Tetracycline with BiFeO3 Prepared by a Simple Hydrothermal Method


Abstract
:1. Introduction
2. Results and Discussion
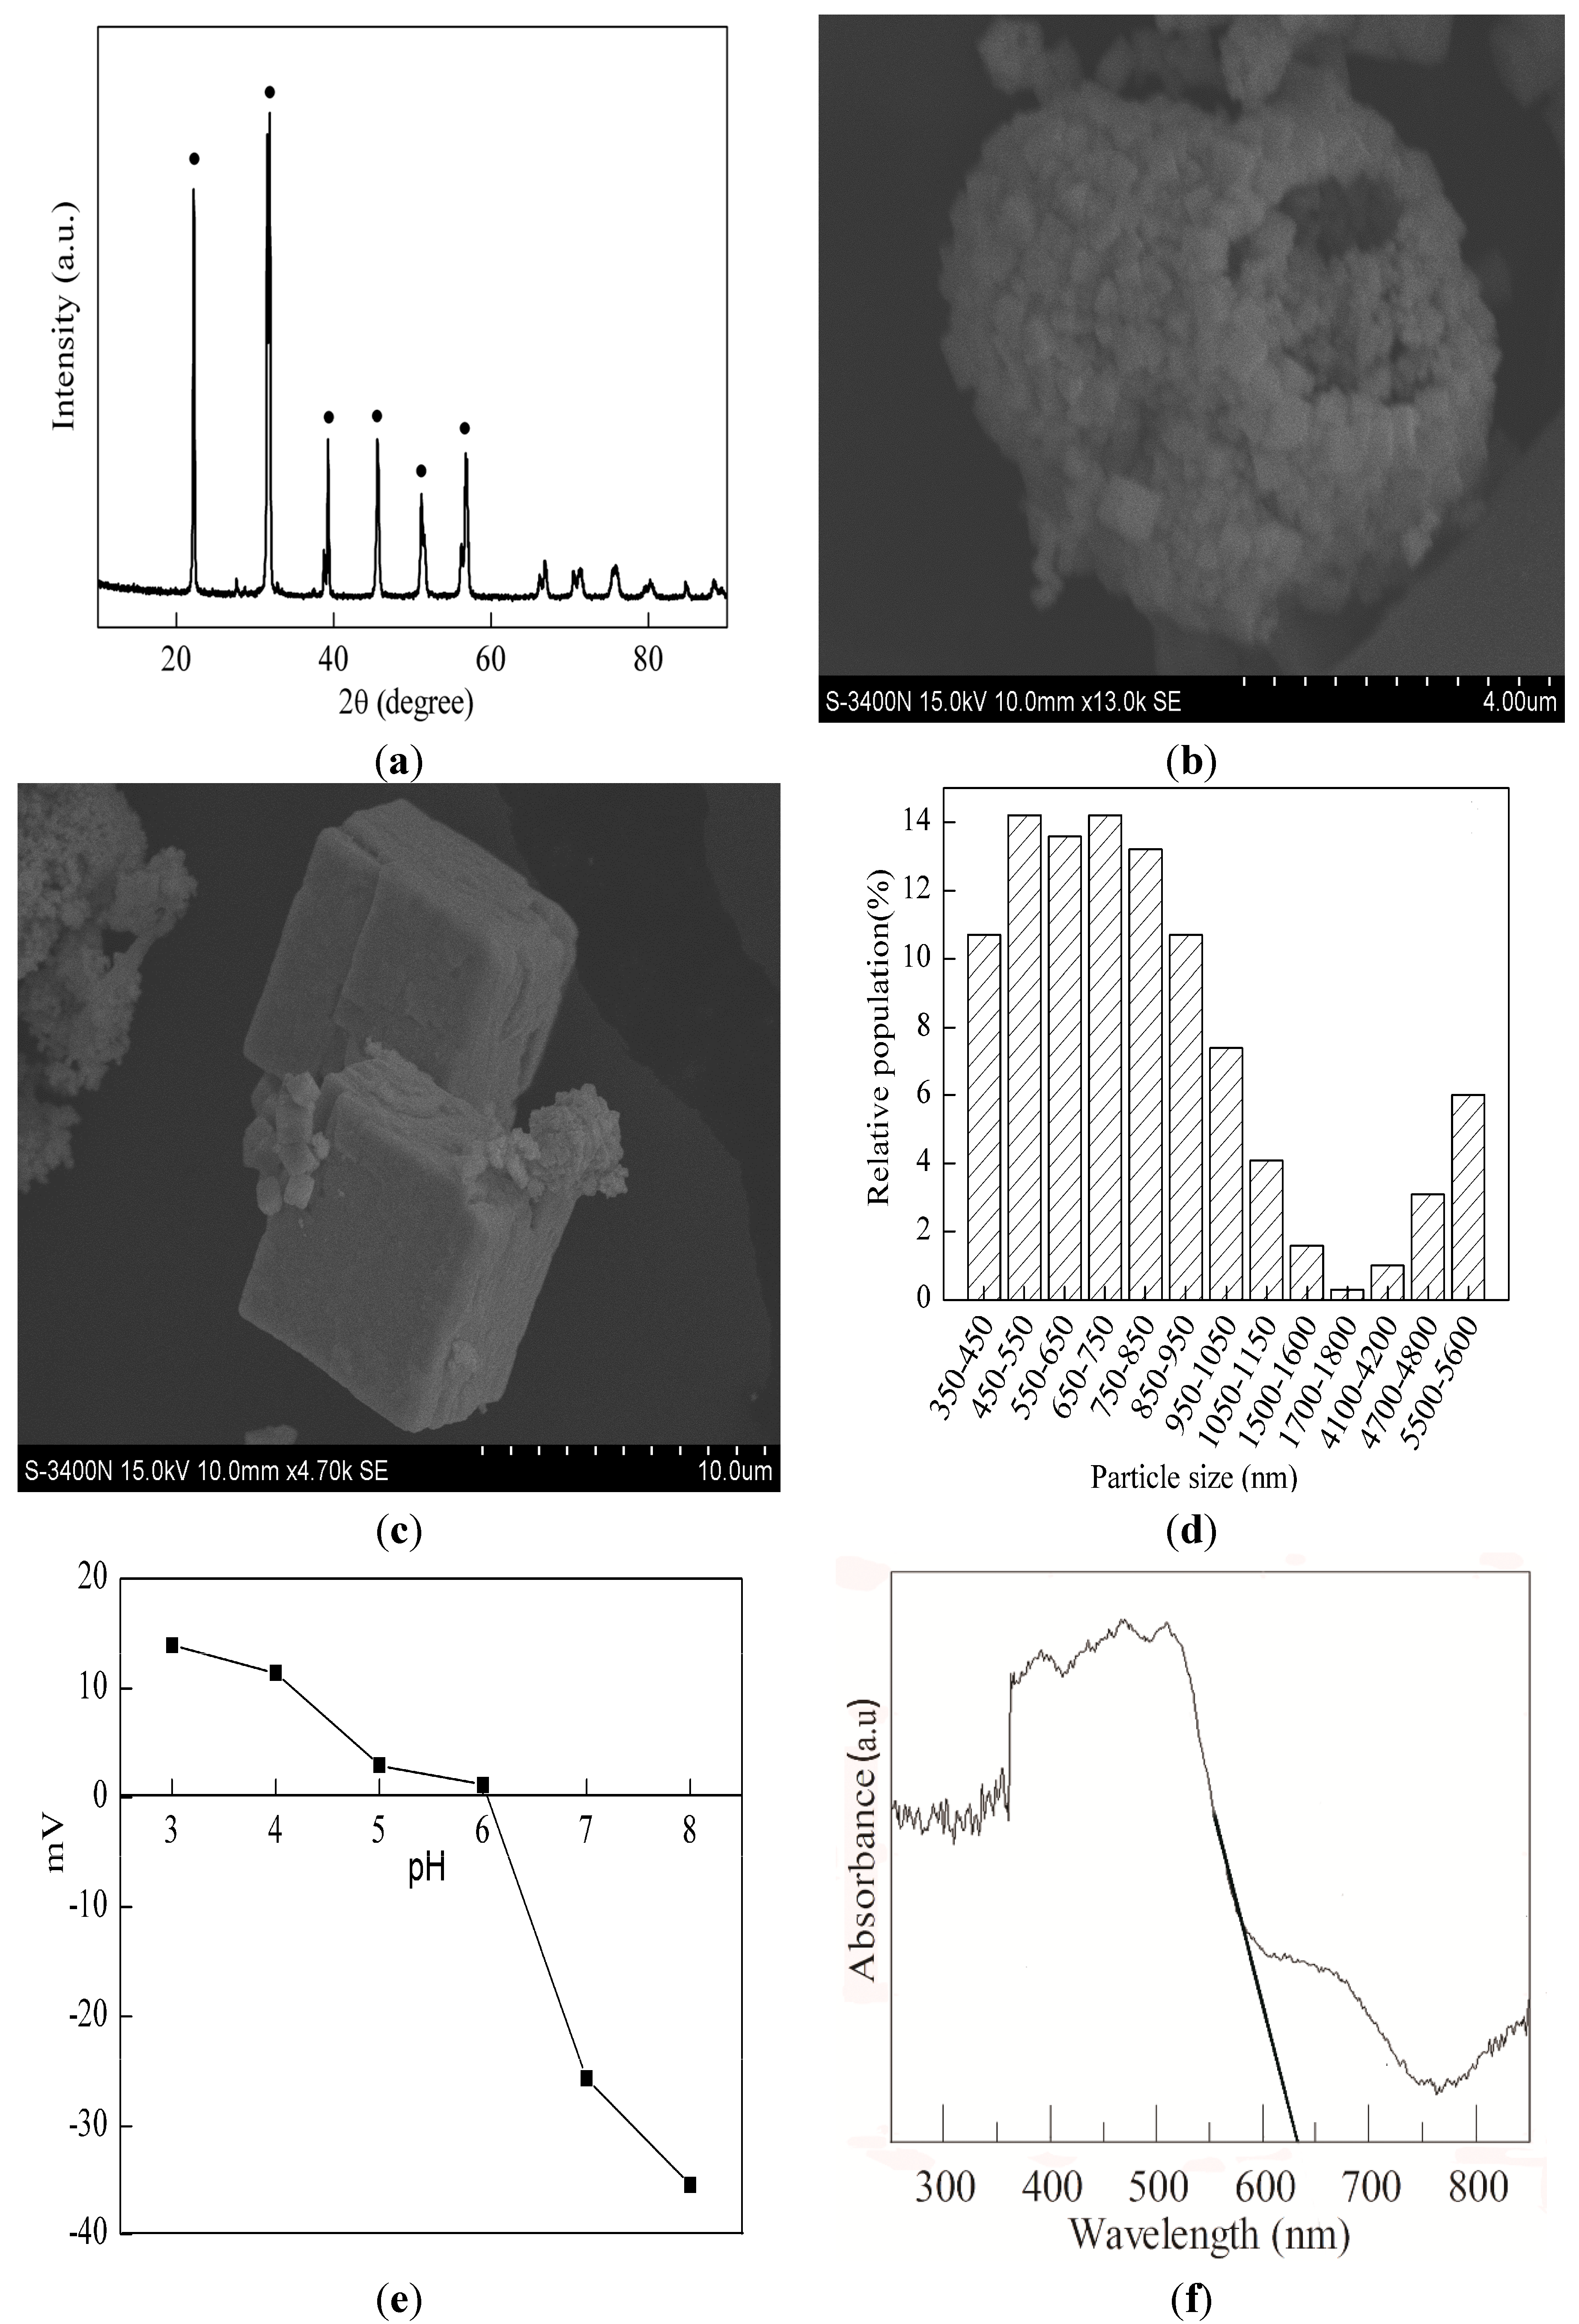
2.1. Materials Characterization

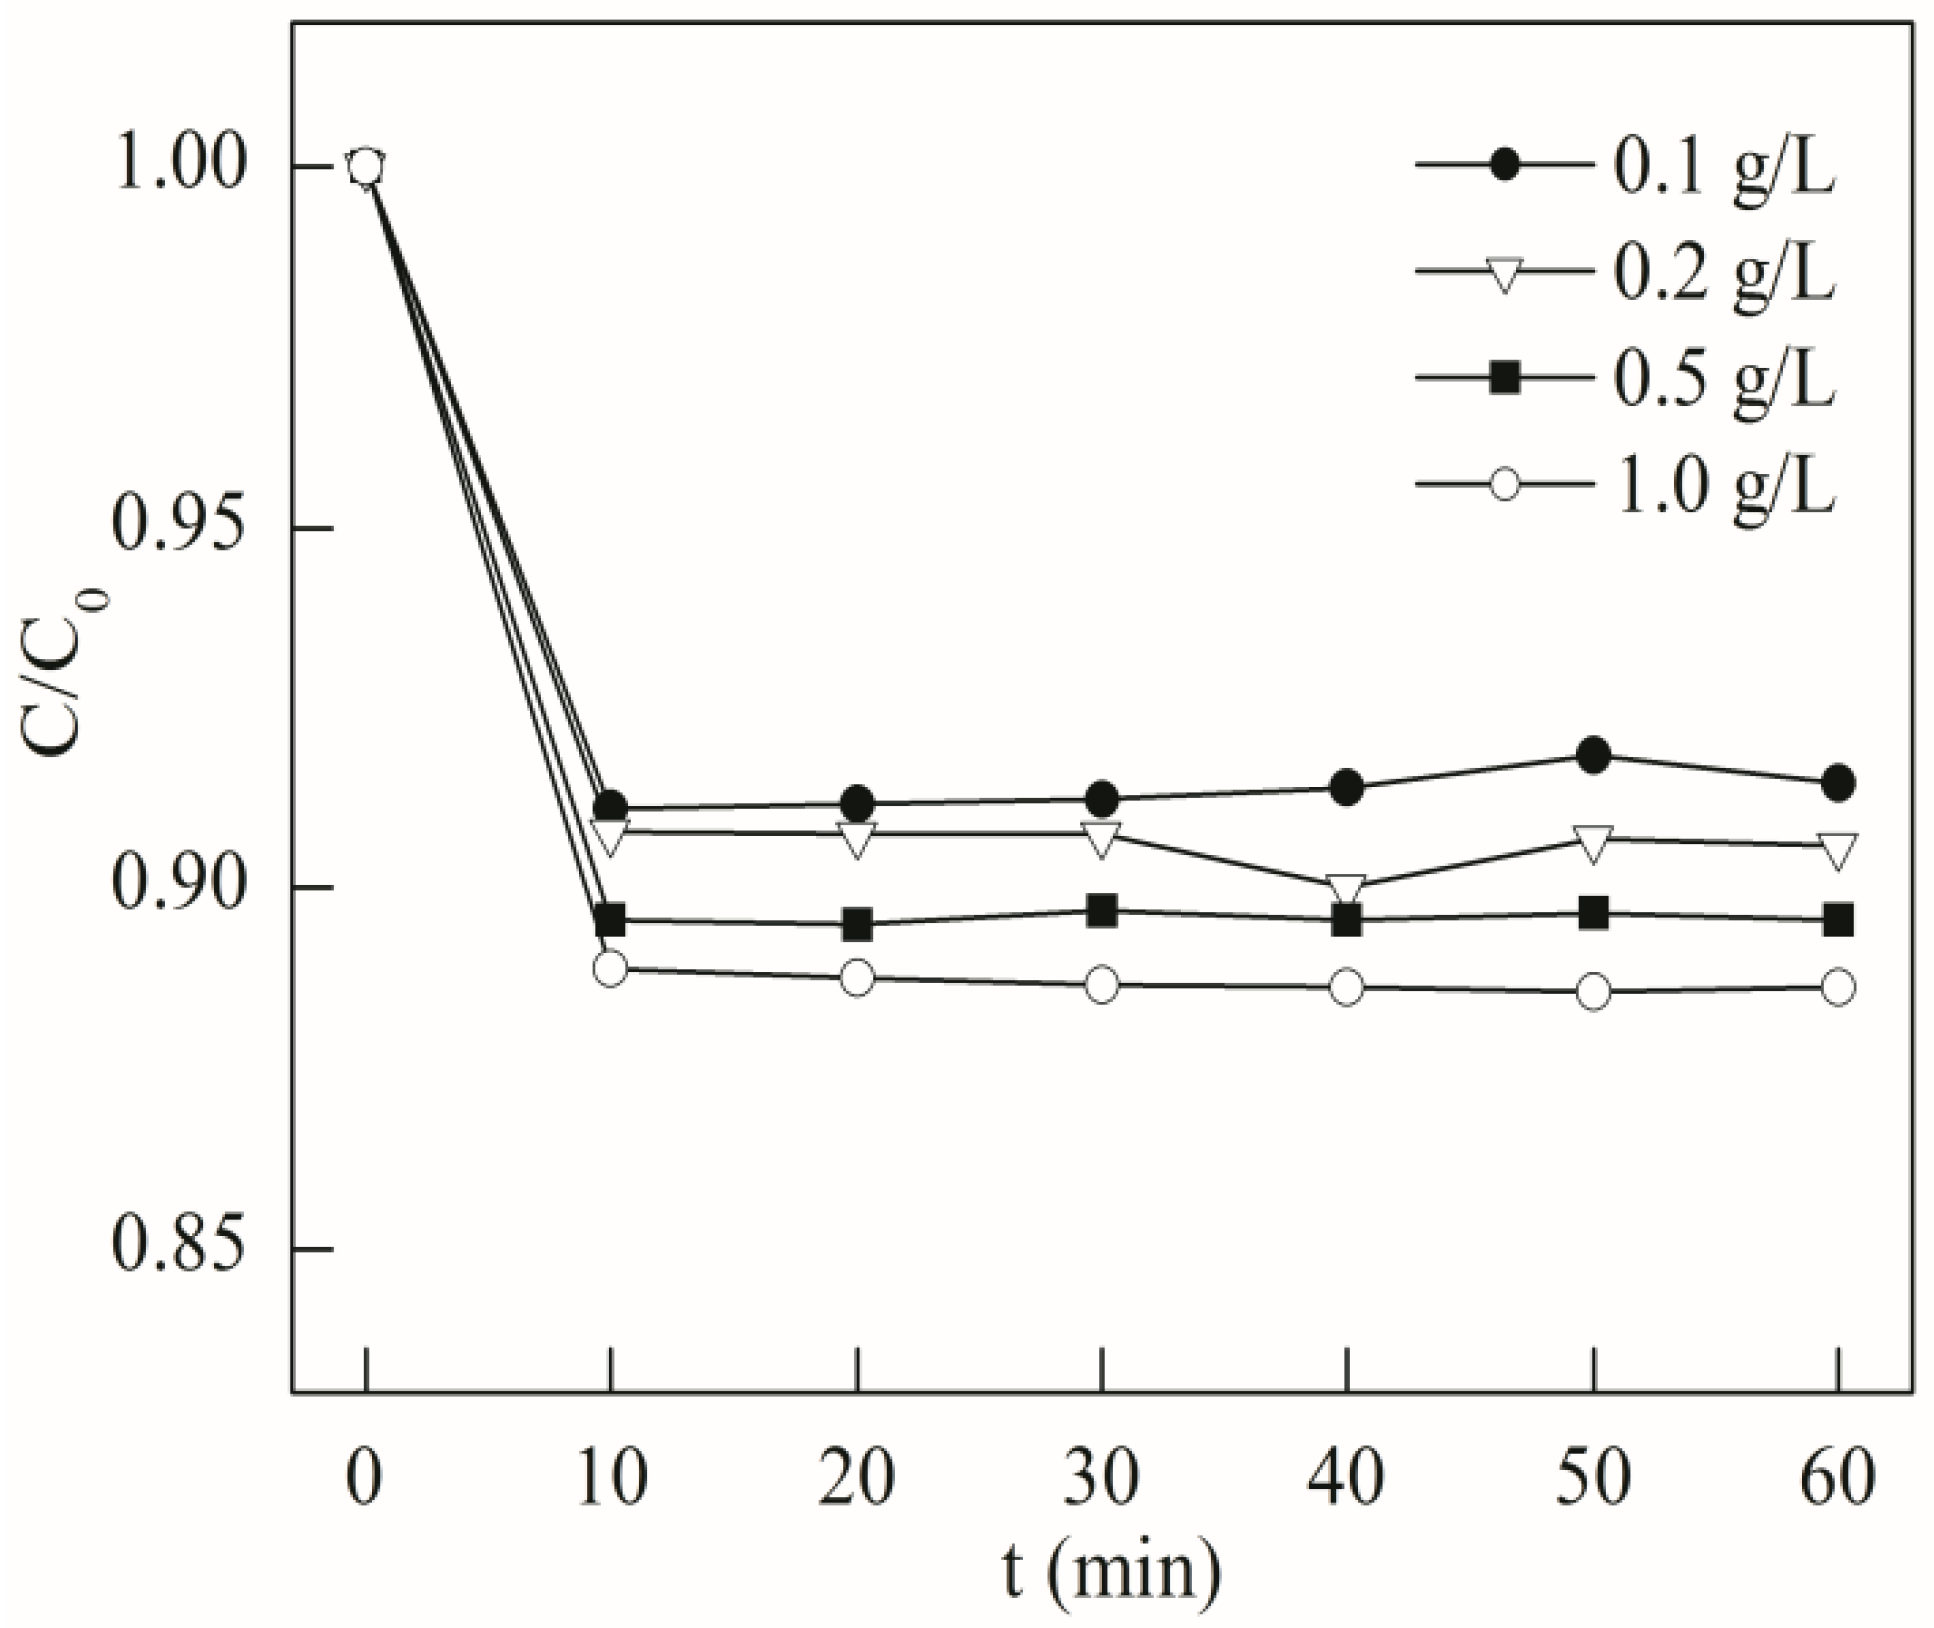
2.2. Adsorption Test
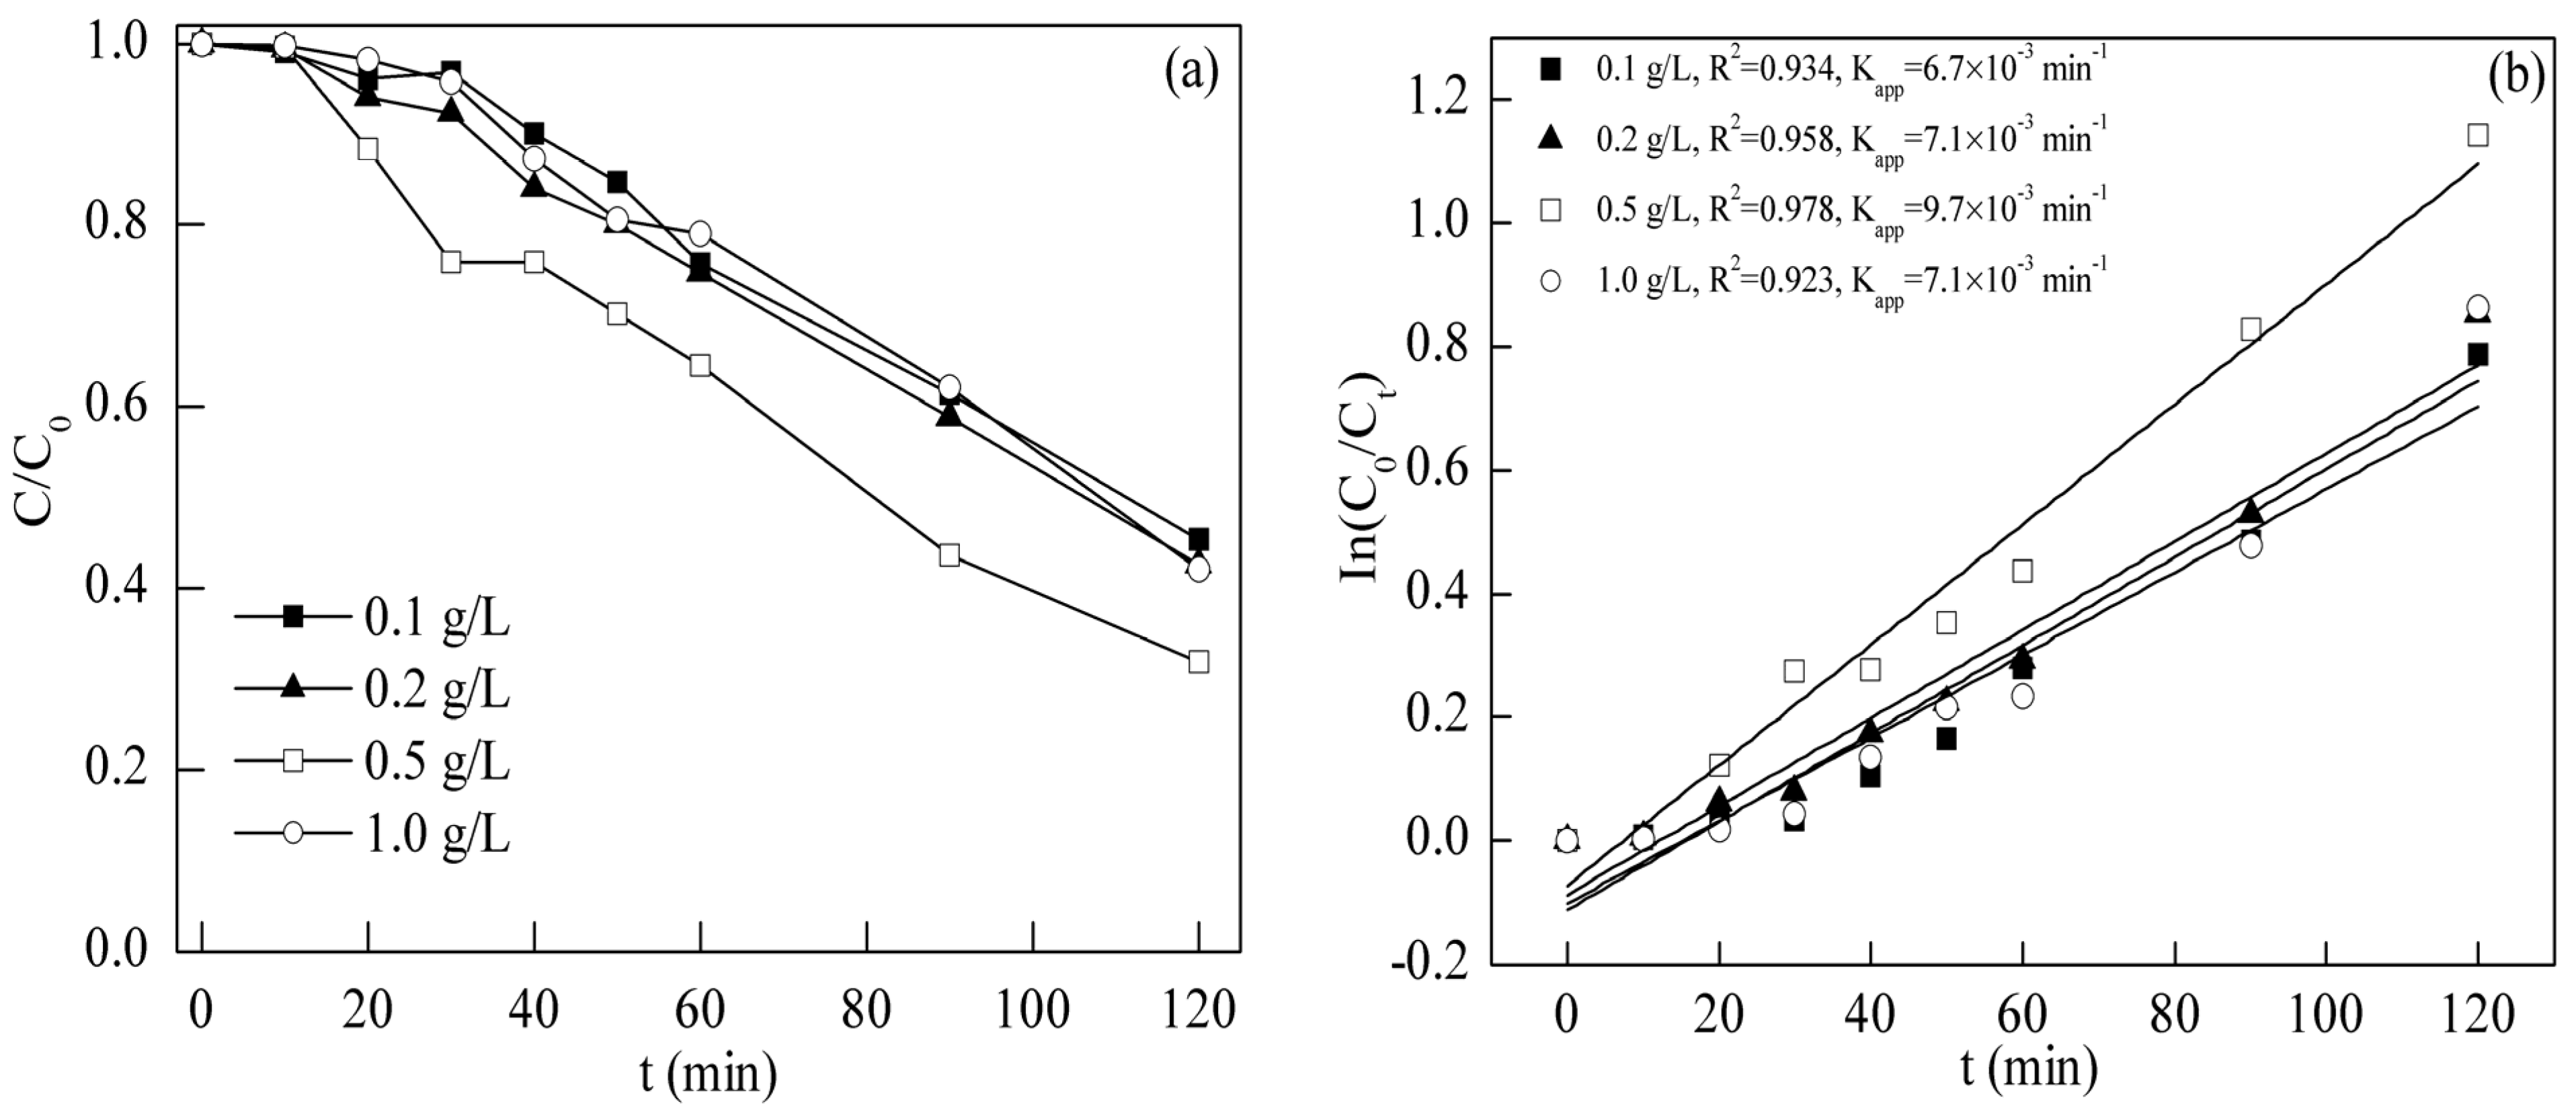
2.3. Photodegradation of Tetracycline
2.3.1. Effect of BFO Dosage
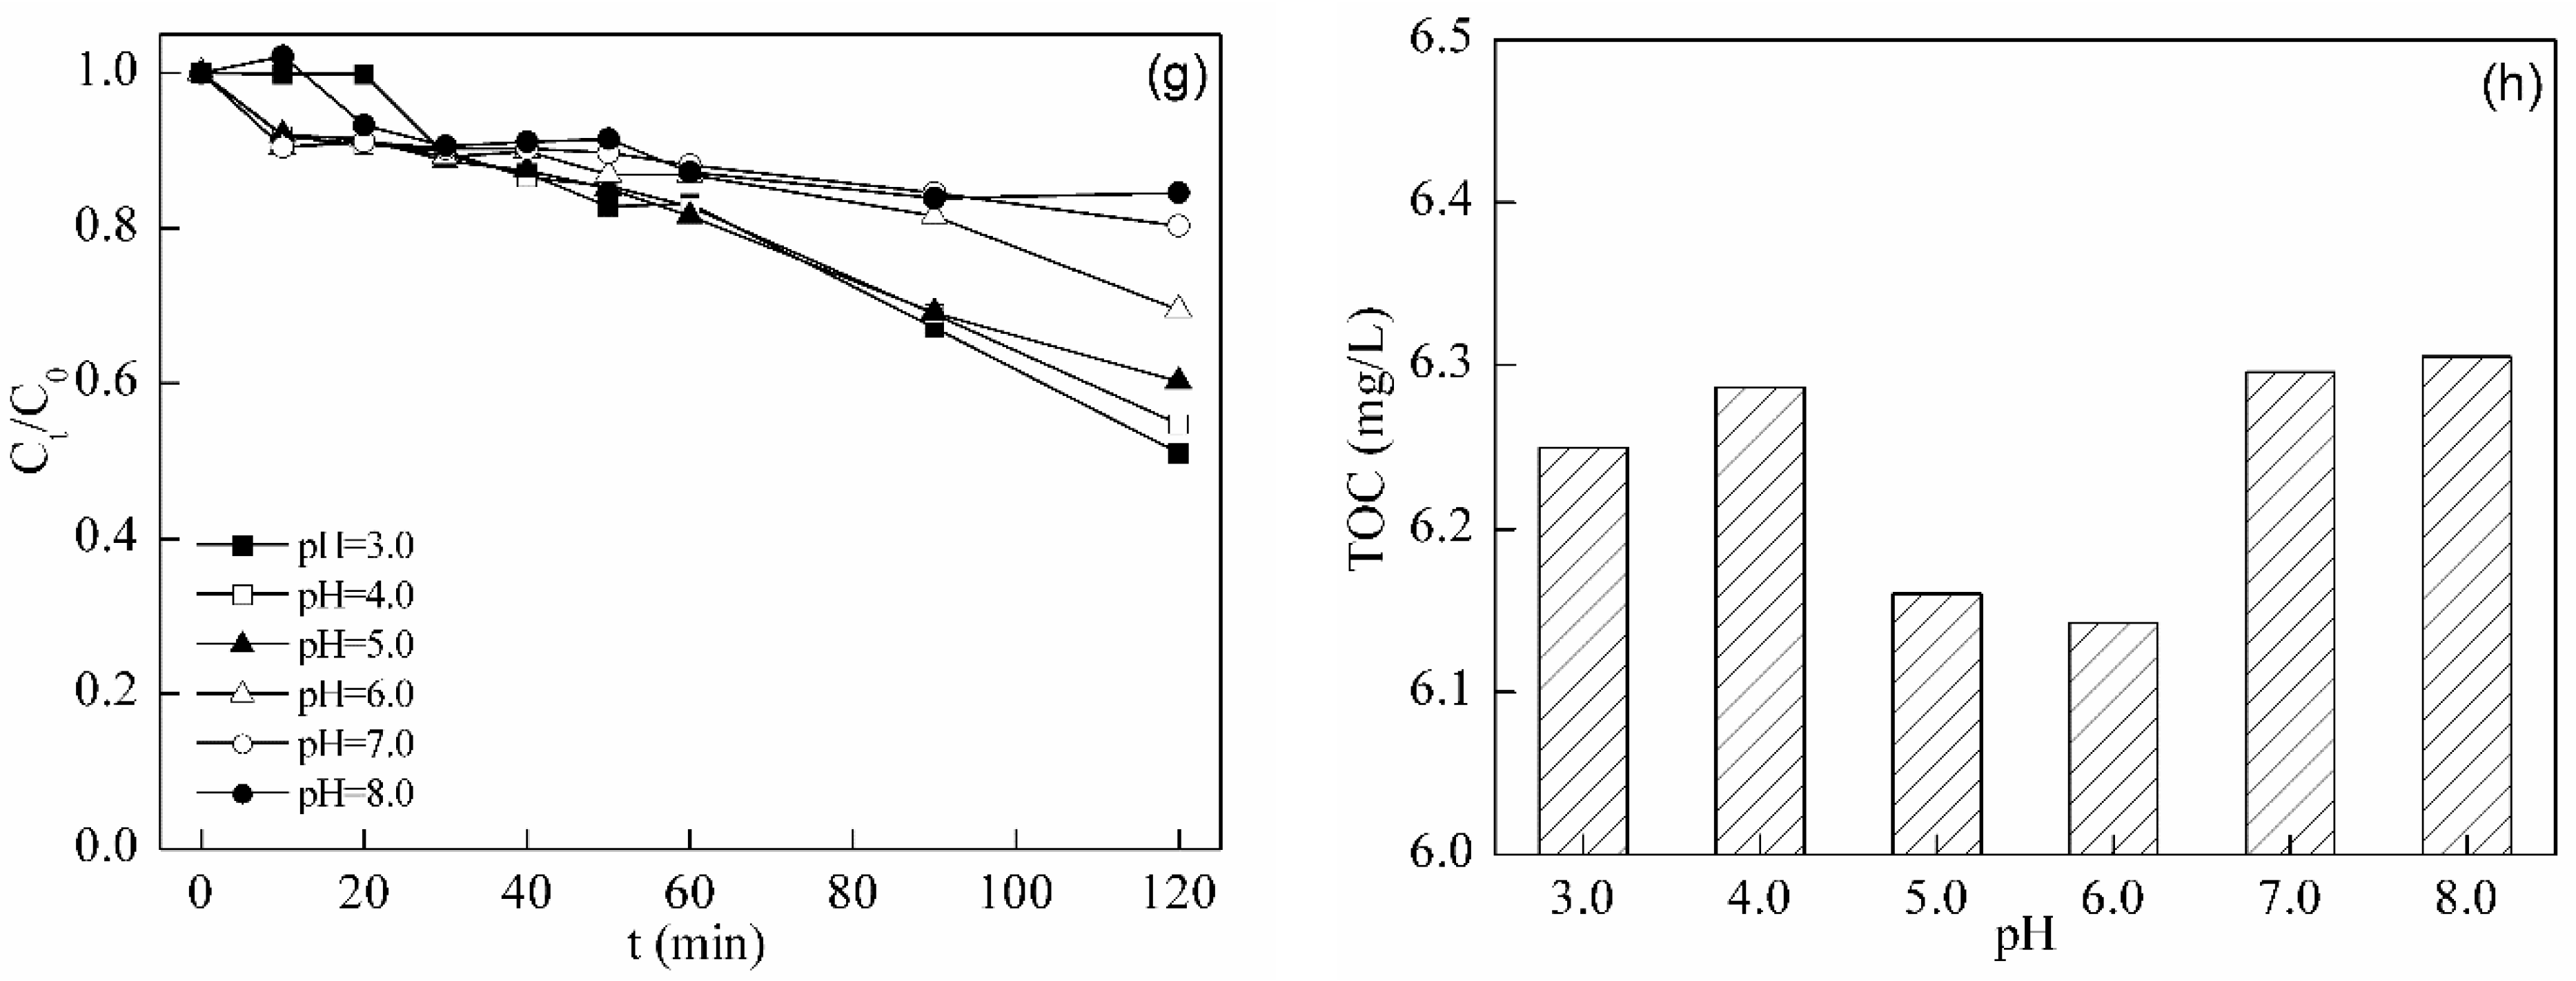
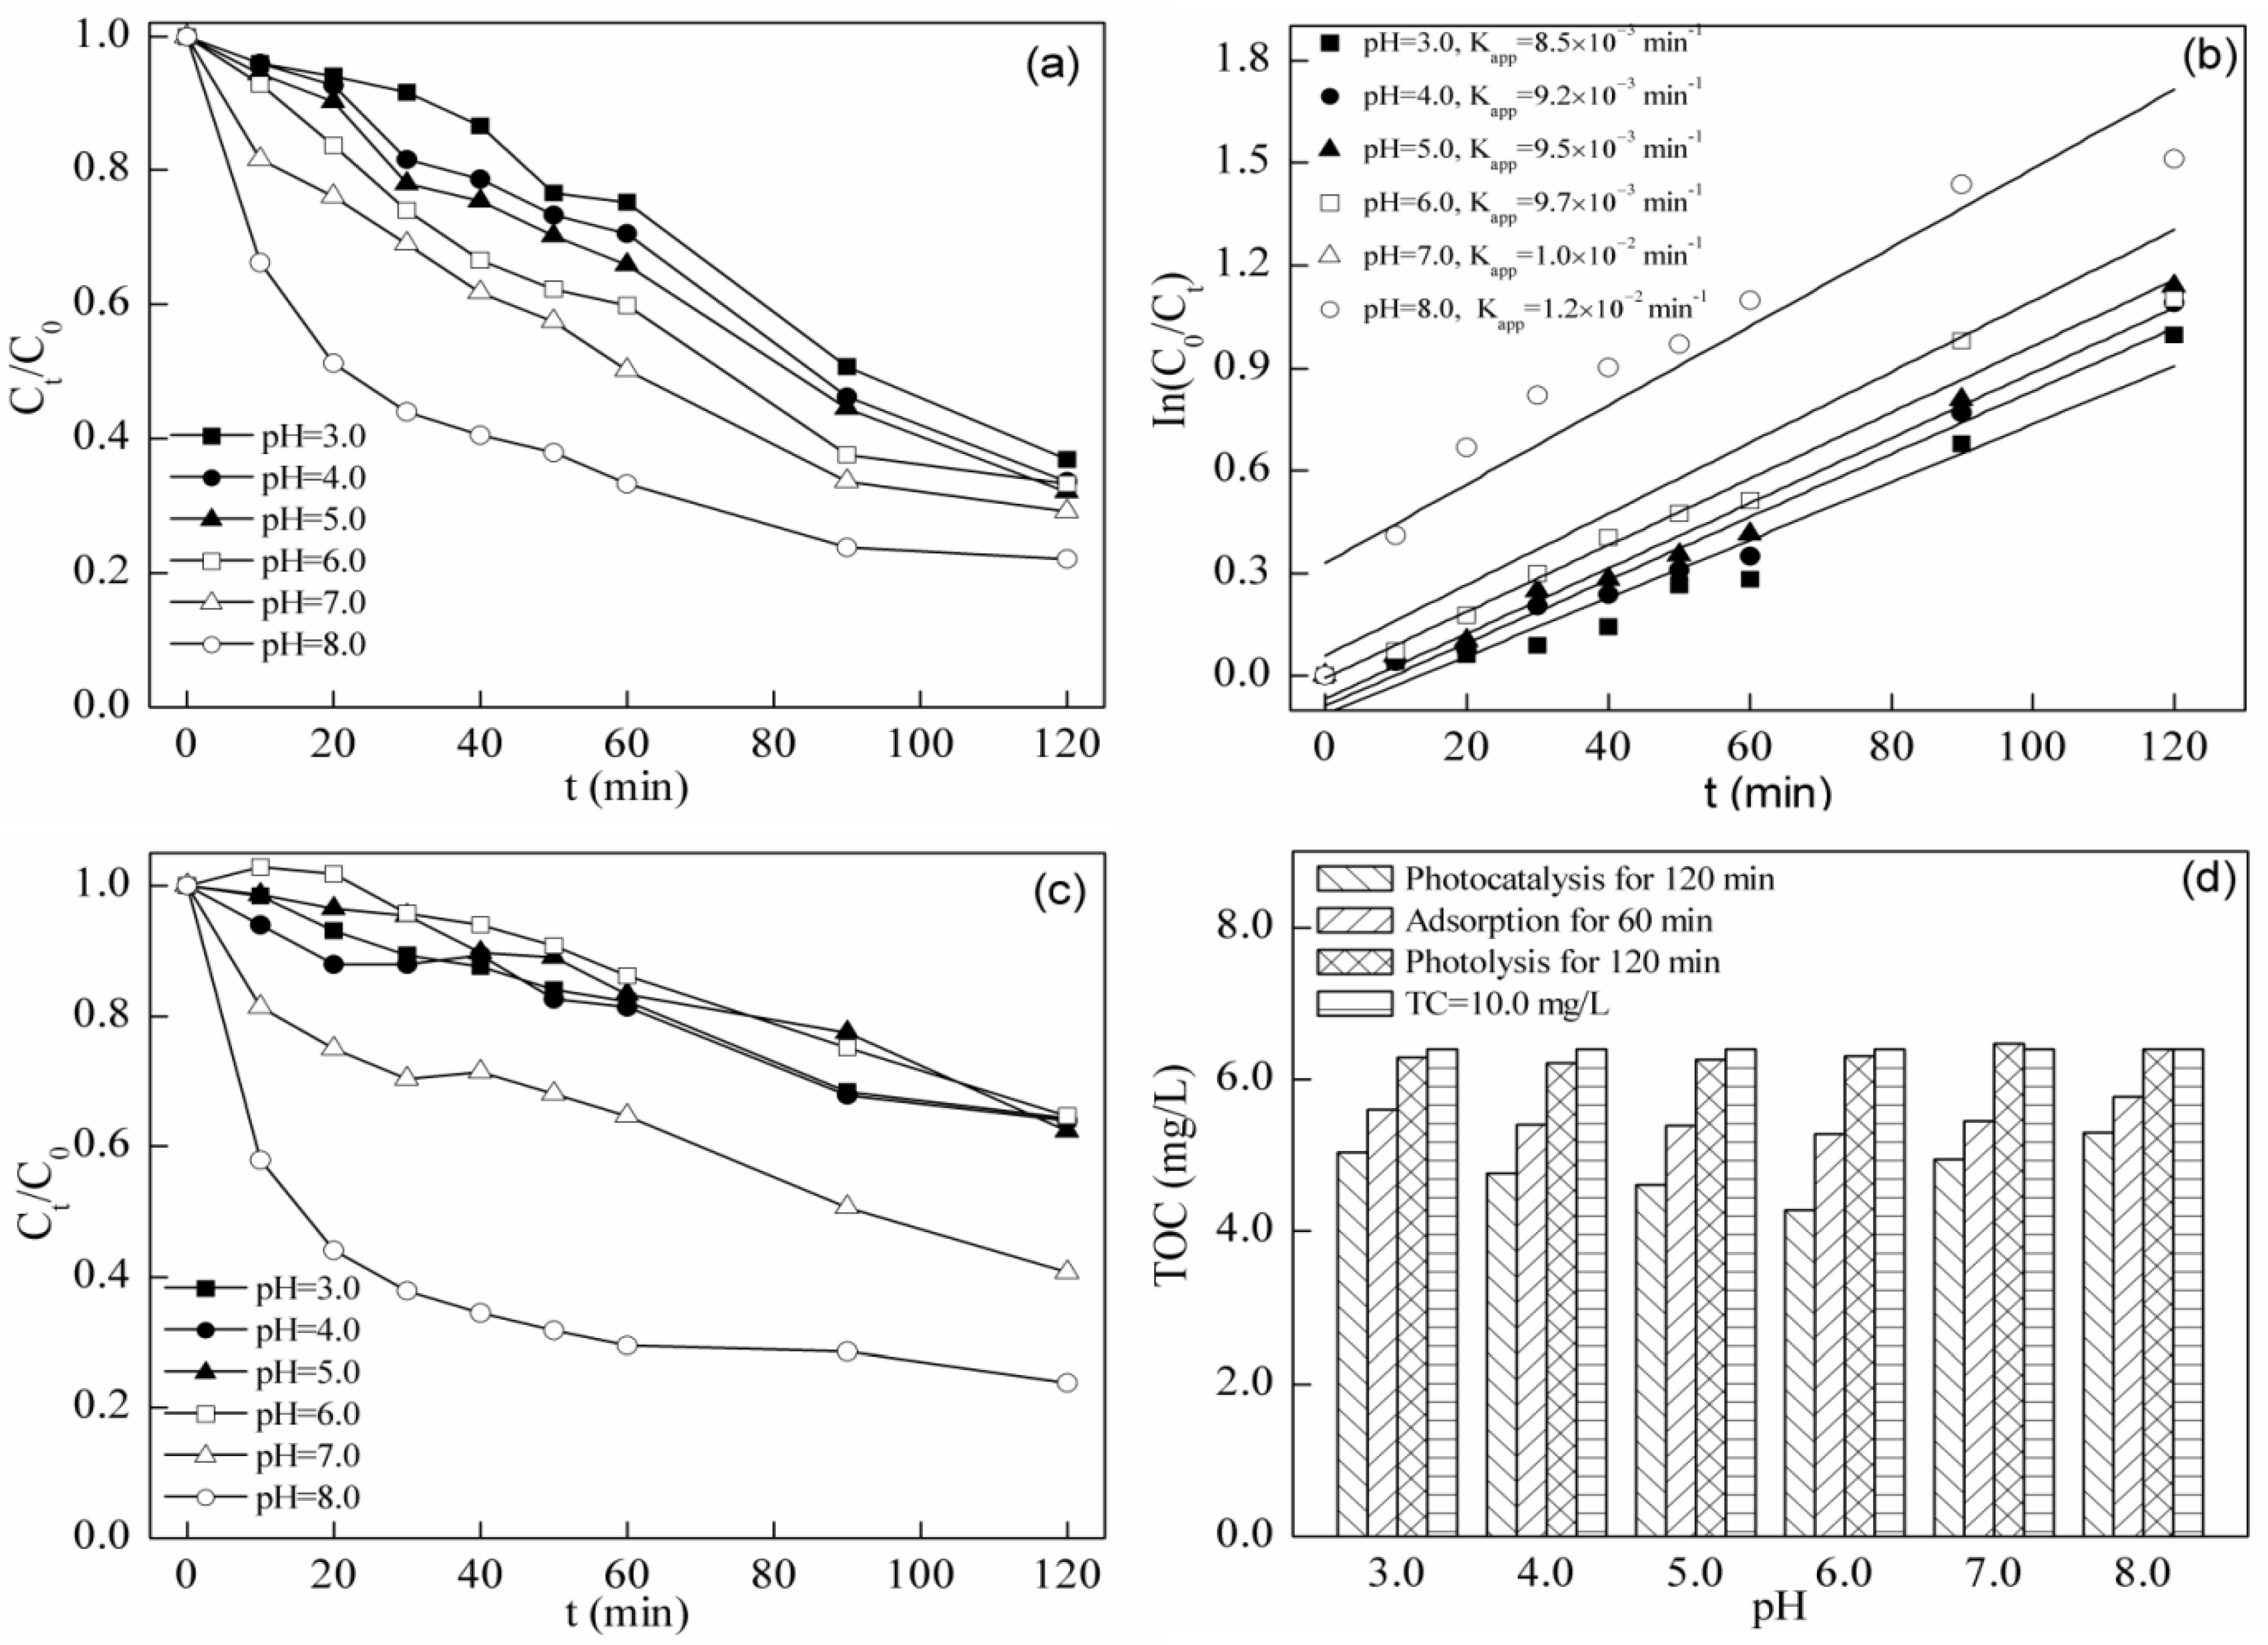
2.3.2. Effect of Initial pH

2.4. Fenton Degradation of Tetracycline
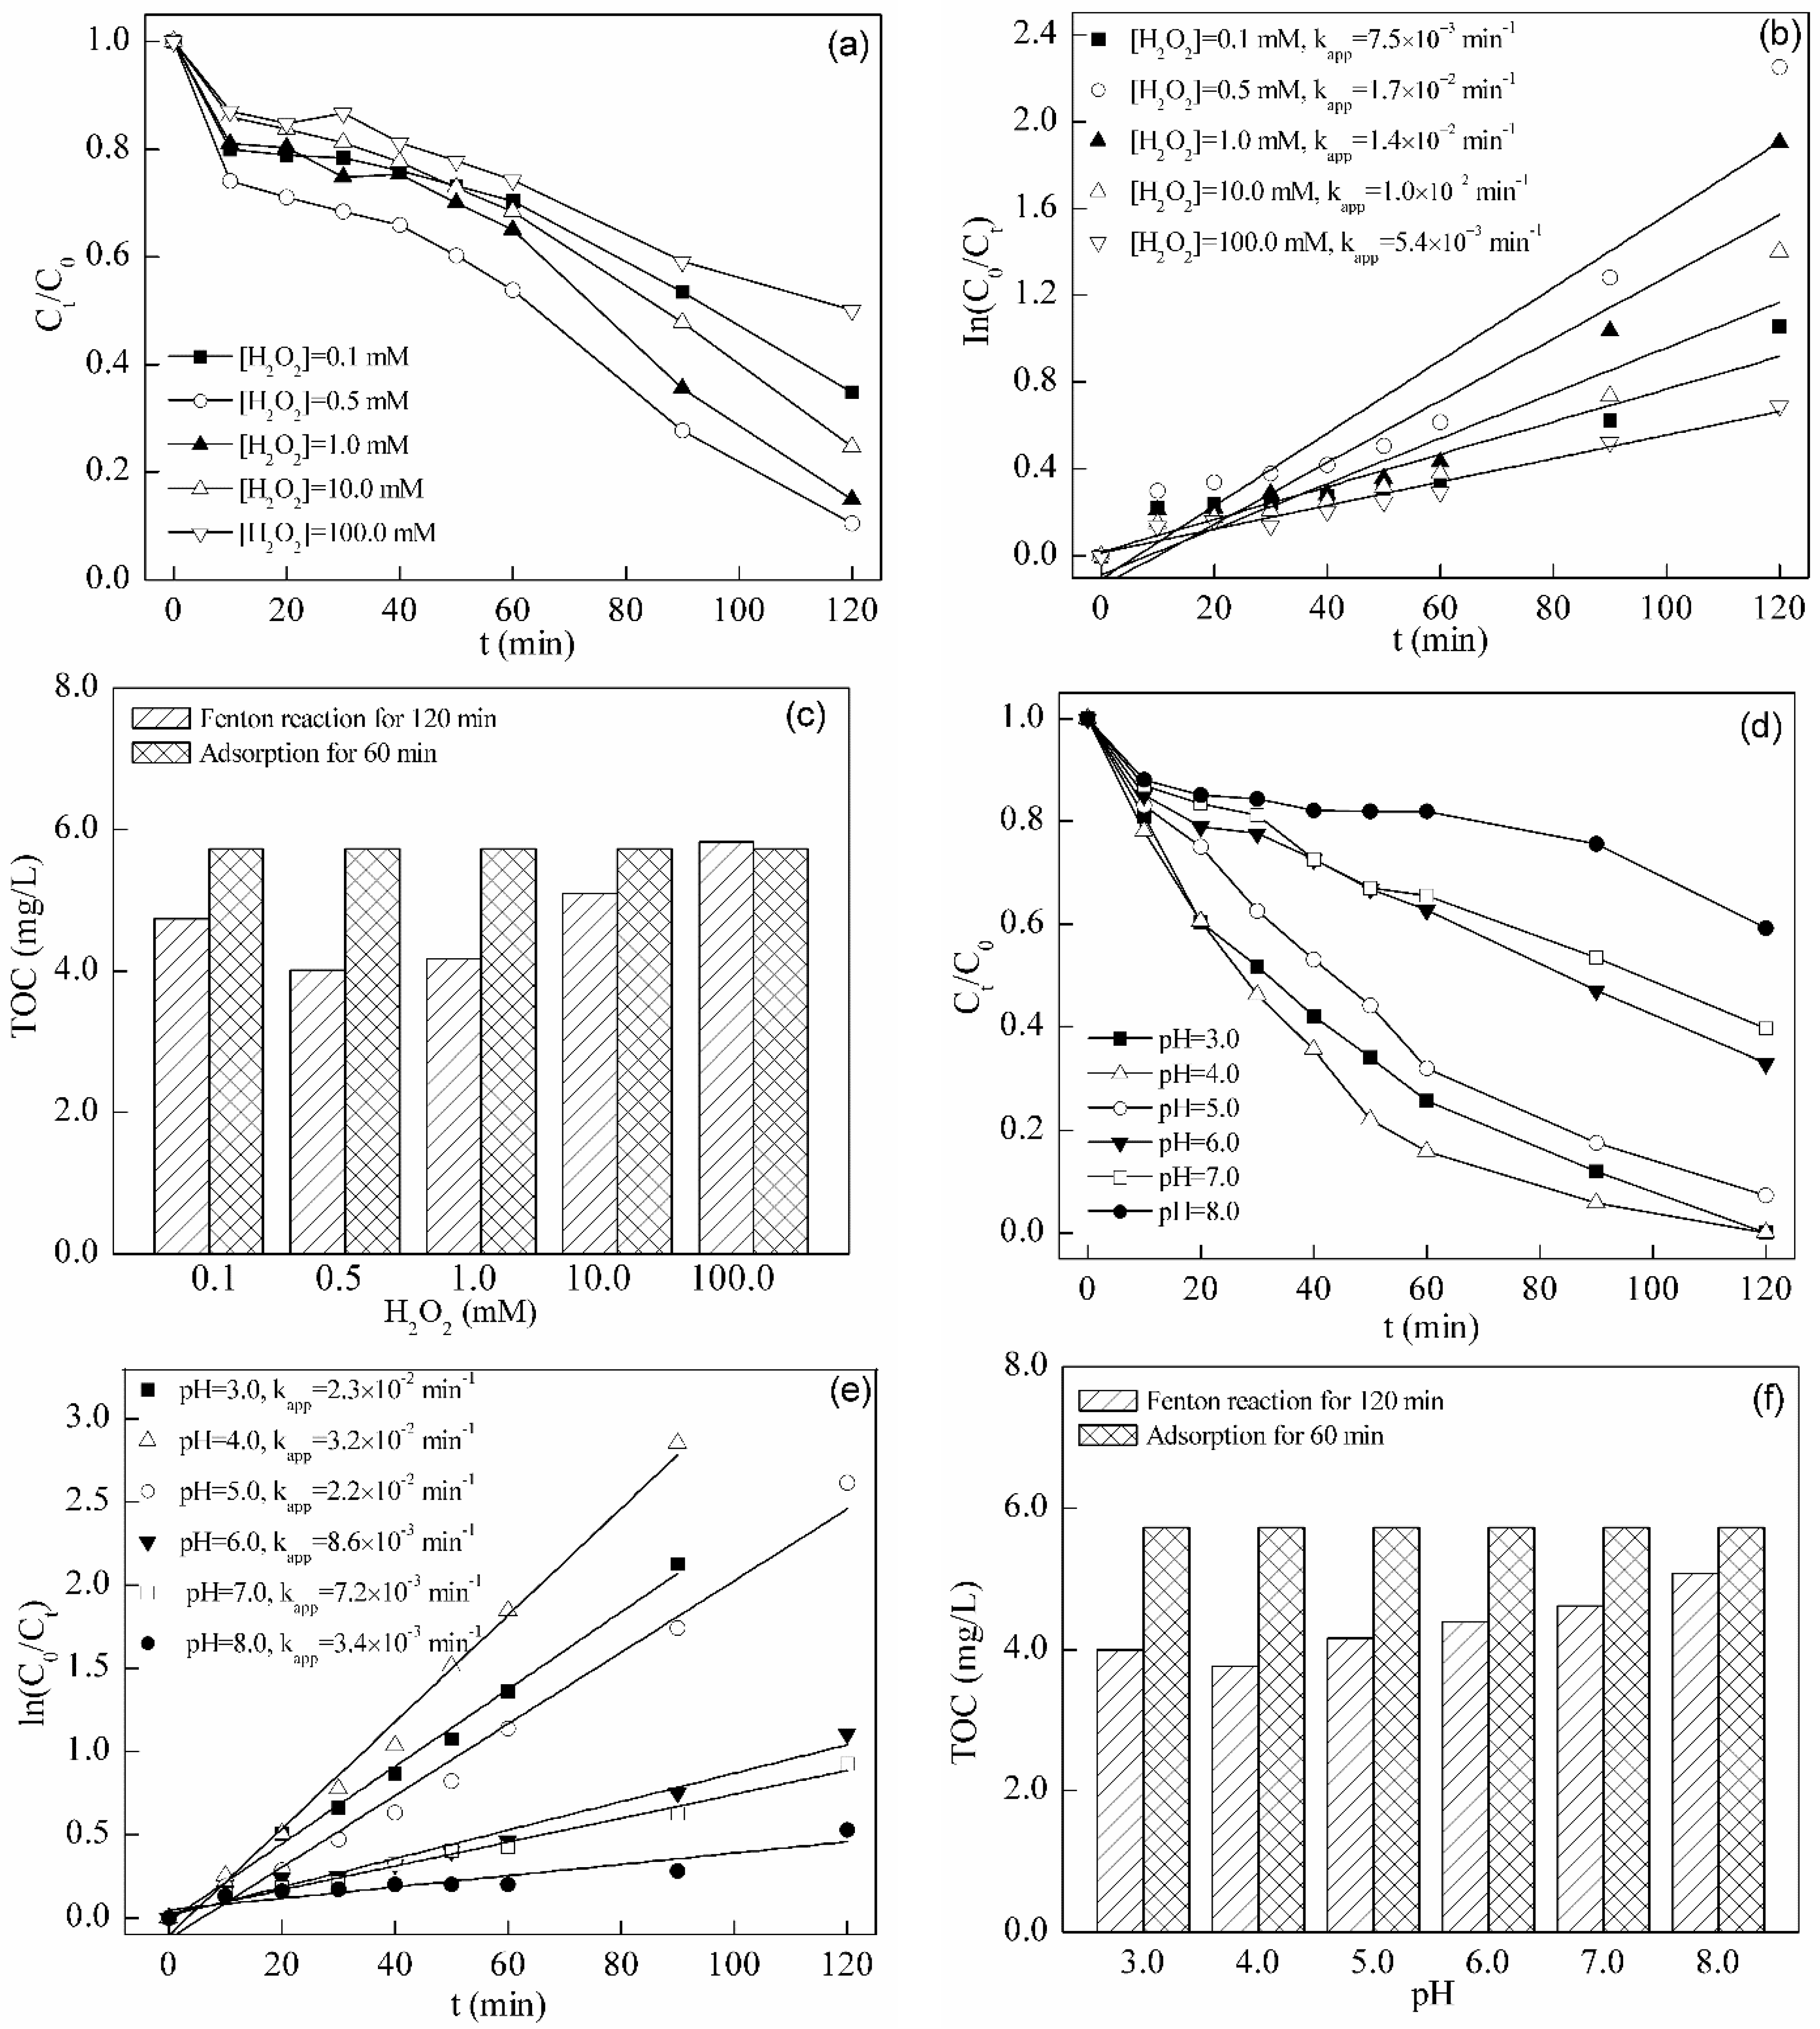
2.4.1. Effect of H2O2 Dosage
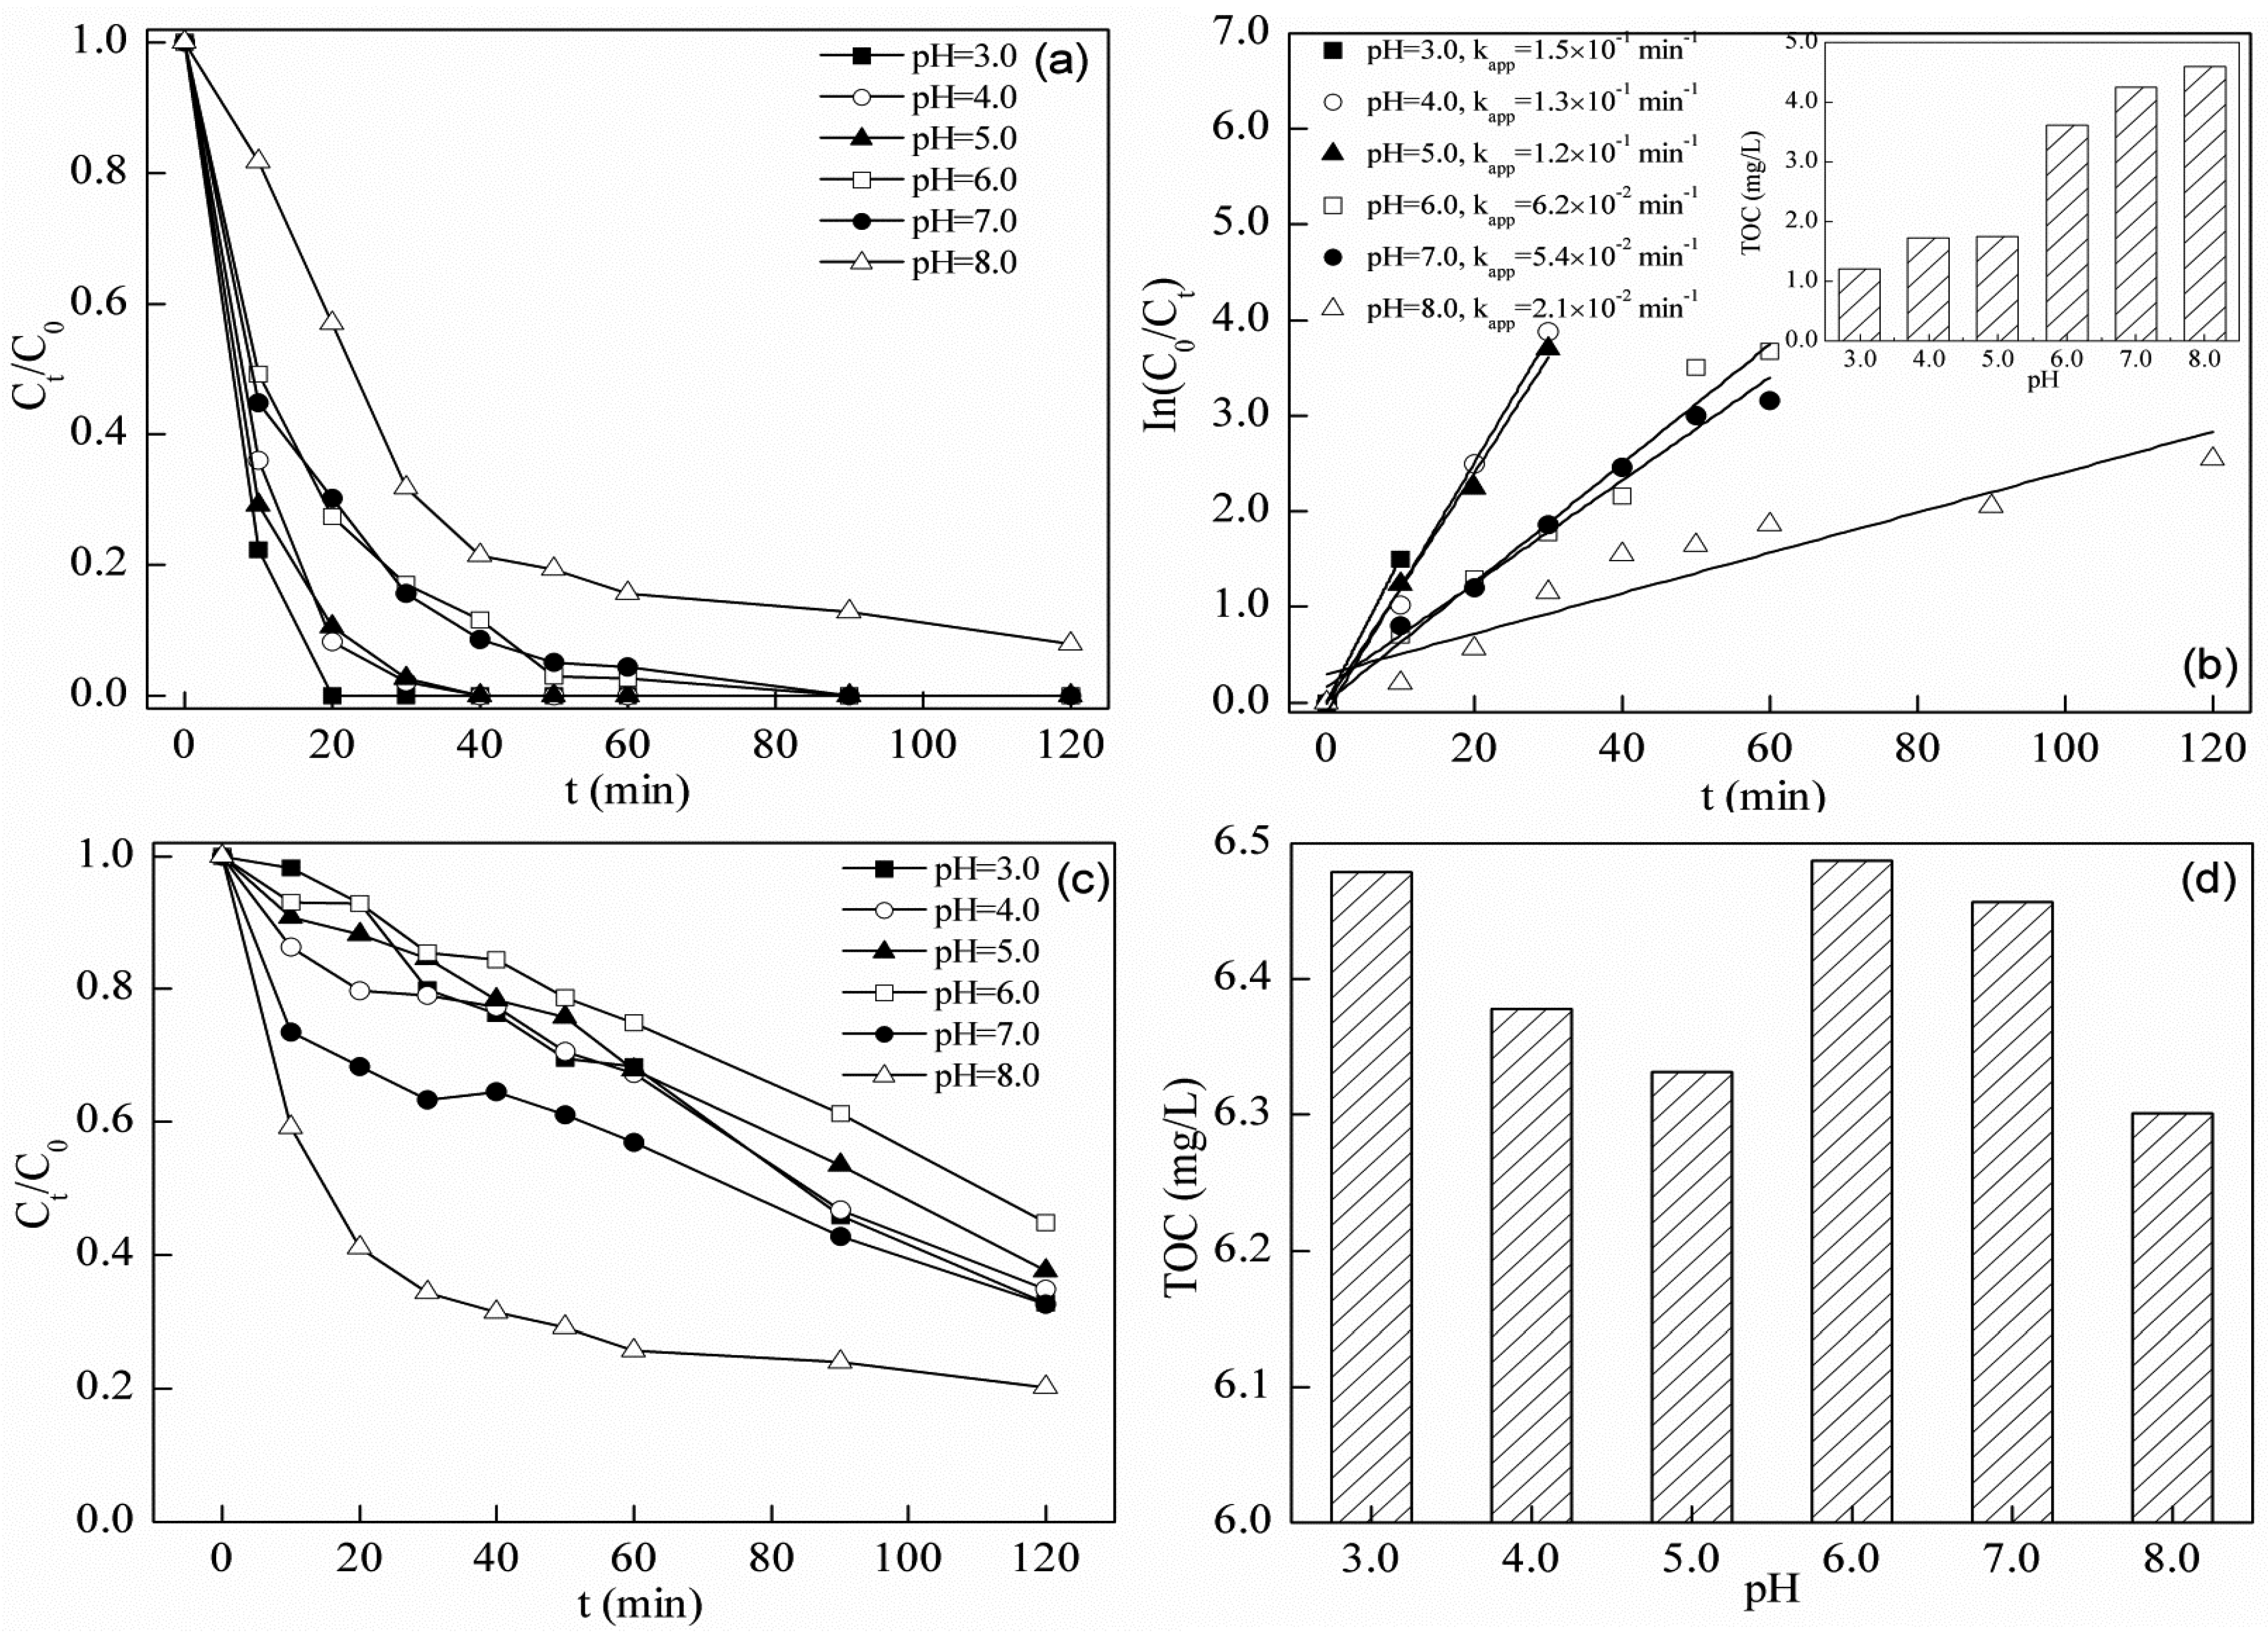
2.4.2. Effect of Initial pH

2.5. Photo-Fenton Degradation of Tetracycline

| Process | pH | kapp (min−1) | Residual TOC Concentration |
|---|---|---|---|
| Photocatalysis | 6.0 | 9.0 × 10⁻³ | 81% |
| Fenton | 4.0 | 3.2 × 10⁻² | 65% |
| Photo-Fenton | 3.0 | 1.5 × 10⁻¹ | 21% |
| Photo-Fenton | 4.0 | 1.3 × 10⁻¹ | 30% |
| Photo-Fenton | 5.0 | 1.2 × 10⁻¹ | 30% |
| Photo-Fenton | 6.0 | 6.2 × 10⁻² | 63% |
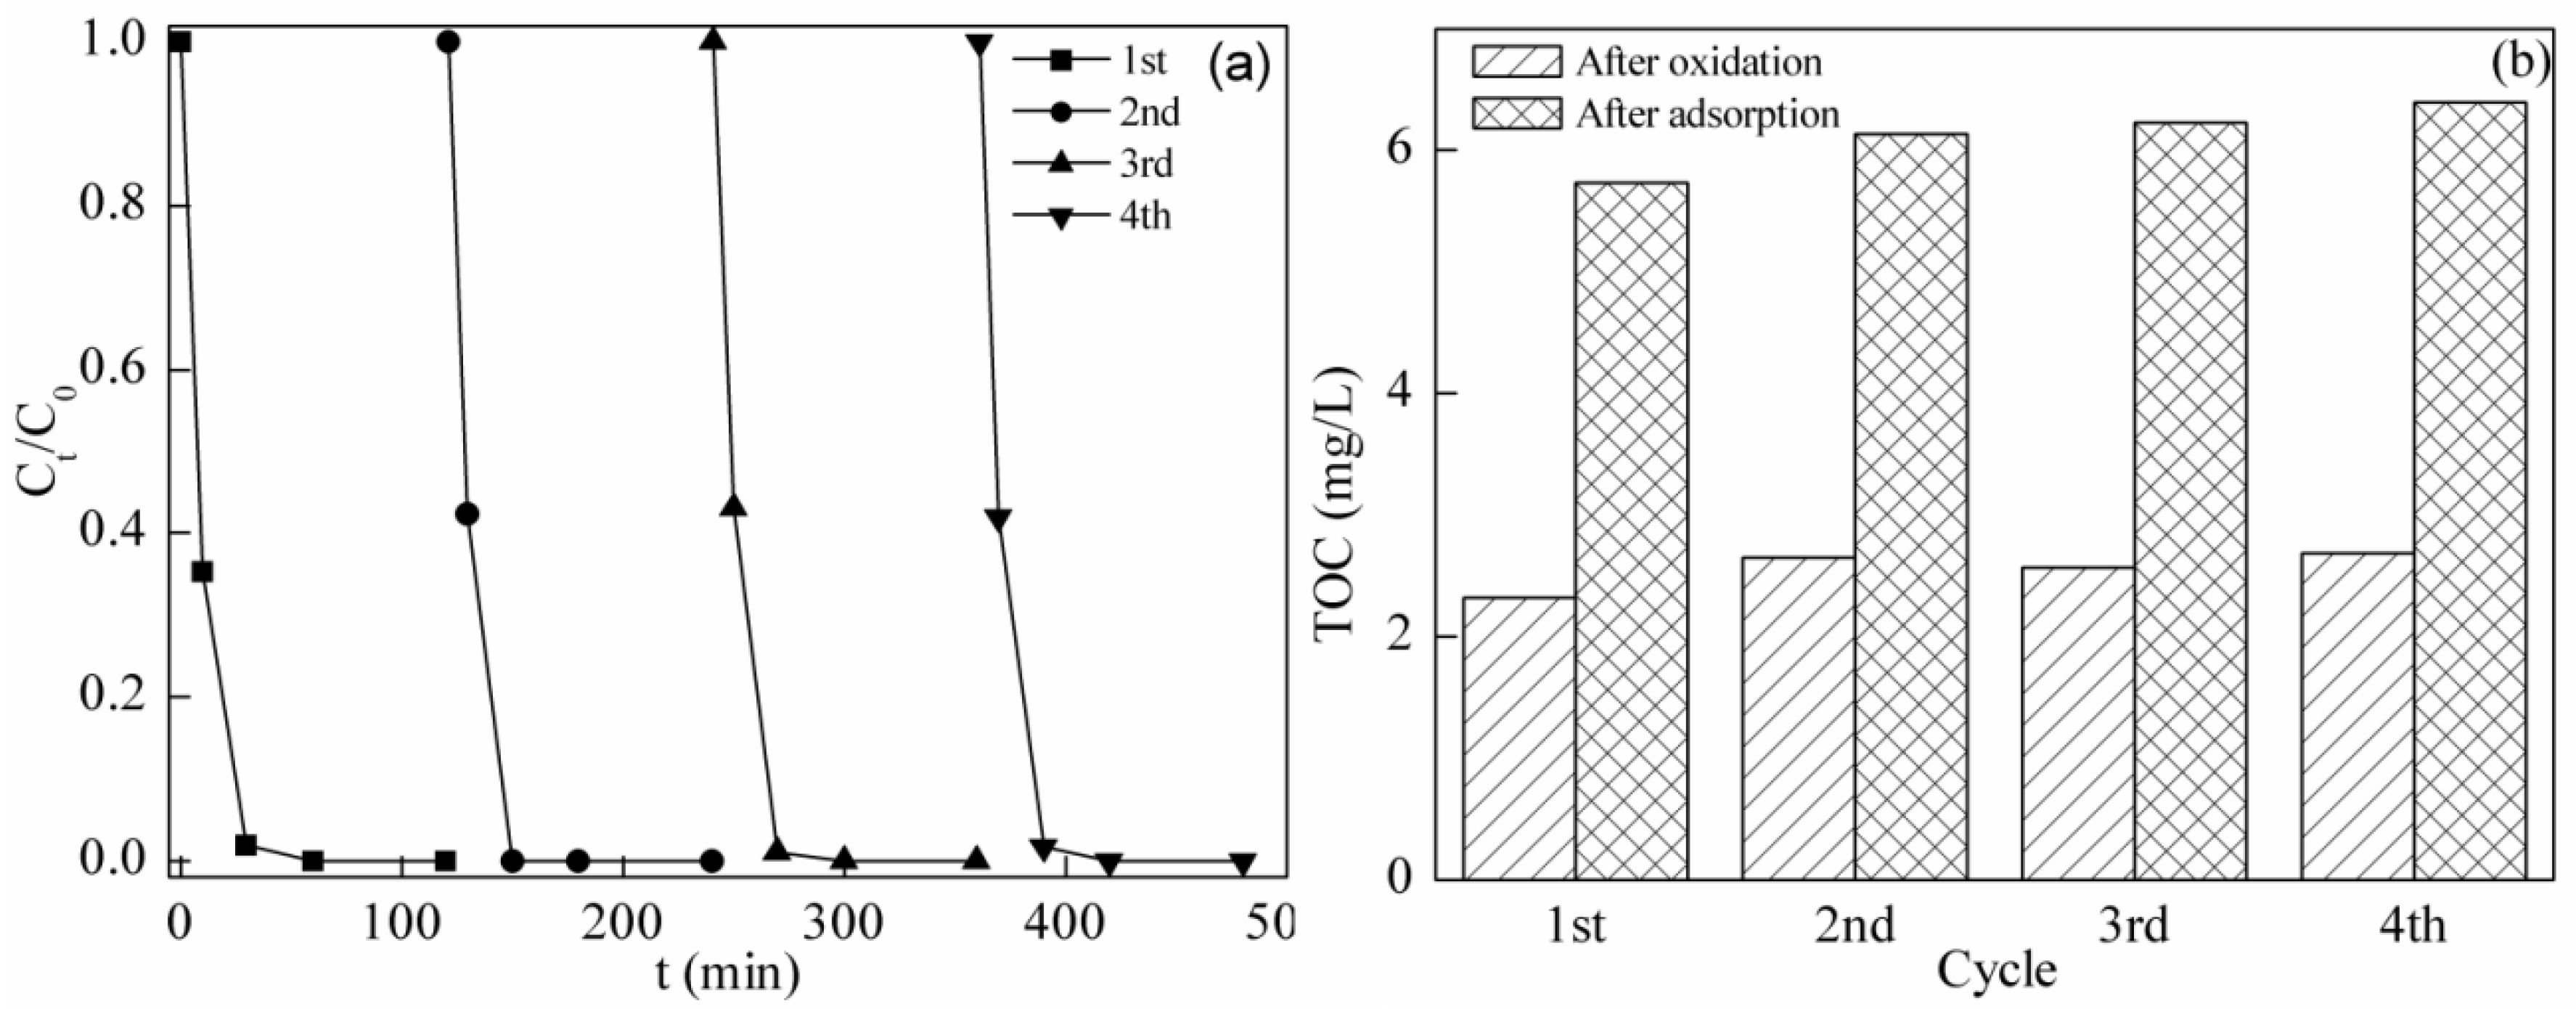
2.6. Stability and Reusability of BFO in the Photo-Fenton System

2.7. Removal of TC Using Different Processes
| Initial TC Concentration (mg/L) | Degradation Systems | Optimal Apparent Rate Constant (min−1) | Optimal Residual TOC after 120 min | Type of Catalyst | Reference |
|---|---|---|---|---|---|
| 55.0 | Photocatalysis | 6.6 × 10⁻² | NG * | TiO2 | [1] |
| 10.0 | Photocatalysis | 1.6 × 10⁻² | NG | SrTiO3 | [48] |
| 20.0 | Photocatalysis | 3.4 × 10⁻² | NG | Sr-Bi2O3 | [12] |
| 20.0 | Photocatalysis | 9.6 × 10⁻² | NG | MWNTs–Bi2WO6 | [49] |
| 10.0 | Photocatalysis | 9.9 × 10⁻³ | NG | AgIn(MoO4)2-Ag/Ag | [50] |
| 10.0 | Photocatalysis | 1.7 × 10⁻² | NG | SrTiO3 | [51] |
| 10.0 | Photocatalysis | 4.4 × 10⁻³ | 85% | Ni(1−x)Cu(x)Fe2O4 | [52] |
| 0.02 | Photo-electro-Fenton | 2.8 × 10⁻² | 70% | Fe3O4-graphite | [53] |
| 100.0 | Electro-Fenton | 1.8 × 10⁻¹ | 15% | Boron-doped diamond(BDD)/carbon-felt electrode, Fe3+, Fe2+ | [54] |
| 100.0 | Electro-Fenton | 2.7 × 10⁻¹ | 58% | carbon-felt electrode, Fe2+ | [55] |
| 10.0 | Photo-Fenton | 1.5 × 10⁻¹ | 21% | BFO | this article |
3. Experimental Section
3.1. Materials and Reagents
3.2. Preparation of BFO
3.3. Analytical Methods
3.4. Degradation Experiments
4. Conclusions
Acknowledgments
Author Contributions
Conflicts of Interest
References
- Safari, G.H.; Hoseini, M.; Seyedsalehi, M.; Kamani, H.; Jaafari, J.; Mahvi, A.H. Photocatalytic degradation of tetracycline using nanosized titanium dioxide in aqueous solution. Int. J. Environ. Sci. Technol. 2014, 12, 603–616. [Google Scholar] [CrossRef]
- Brain, R.A.; Johnson, D.J.; Richards, S.M.; Sanderson, H.; Sibley, P.K.; Solomon, K.R. Effects of 25 pharmaceutical compounds to lemna gibba using a seven-day static-renewal test. Environ. Toxicol. Chem. 2004, 23, 371–382. [Google Scholar] [CrossRef] [PubMed]
- Halling-Sorensen, B. Algal toxicity of antibacterial agents used in intensive farming. Chemosphere 2000, 40, 731–739. [Google Scholar] [CrossRef]
- Park, S.; Choi, K. Hazard assessment of commonly used agricultural antibiotics on aquatic ecosystems. Ecotoxicology 2008, 17, 526–538. [Google Scholar] [CrossRef] [PubMed]
- Gracia, T.; Hilscherova, K.; Jones, P.D.; Newsted, J.L.; Higley, E.B.; Zhang, X.; Hecker, M.; Murphy, M.B.; Yu, R.M.K.; Lam, P.K.S. Modulation of steroidogenic gene expression and hormone production of H295R cells by pharmaceuticals and other environmentally active compounds. Toxicol. Appl. Pharmacol. 2007, 225, 142–153. [Google Scholar] [CrossRef] [PubMed]
- Matos, M.; Pereira, M.A.; Parpot, P.; Brito, A.G.; Nogueira, R. Influence of tetracycline on the microbial community composition and activity of nitrifying biofilms. Chemosphere 2014, 117, 295–302. [Google Scholar] [CrossRef] [PubMed]
- Yu, J.; Liu, D.; Li, K. Influence of tetracycline on tetracycline-resistant heterotrophs and tet genes in activated sludge process. Curr. Microbiol. 2015, 70, 415–422. [Google Scholar] [CrossRef] [PubMed]
- Spongberg, A.L.; Witter, J.D. Pharmaceutical compounds in the wastewater process stream in northwest ohio. Sci. Total Environ. 2008, 397, 148–157. [Google Scholar] [CrossRef] [PubMed]
- Daghrir, R.; Drogui, P. Tetracycline antibiotics in the environment: A review. Environ. Chem. Lett. 2013, 11, 209–227. [Google Scholar] [CrossRef]
- Zhu, X.-D.; Wang, Y.-J.; Sun, R.-J.; Zhou, D.-M. Photocatalytic degradation of tetracycline in aqueous solution by nanosized TiO2. Chemosphere 2013, 92, 925–932. [Google Scholar] [CrossRef] [PubMed]
- Palominos, R.A.; Mondaca, M.A.; Giraldo, A.; Peñuela, G.; Pérez-Moya, M.; Mansilla, H.D. Photocatalytic oxidation of the antibiotic tetracycline on TiO2 and ZnO suspensions. Catal. Today 2009, 144, 100–105. [Google Scholar] [CrossRef]
- Niu, J.; Ding, S.; Zhang, L.; Zhao, J.; Feng, C. Visible-light-mediated Sr-Bi2O3 photocatalysis of tetracycline: Kinetics, mechanisms and toxicity assessment. Chemosphere 2013, 93, 1–8. [Google Scholar] [CrossRef] [PubMed]
- Pereira, J.H.O.S.; Queirós, D.B.; Reis, A.C.; Nunes, O.C.; Borges, M.T.; Boaventura, R.A.R.; Vilar, V.J.P. Process enhancement at near neutral pH of a homogeneous photo-Fenton reaction using ferricarboxylate complexes: Application to oxytetracycline degradation. Chem. Eng. J. 2014, 253, 217–228. [Google Scholar] [CrossRef]
- Bautitz, I.R.; Nogueira, R.F.P. Degradation of tetracycline by photo-Fenton process-solar irradiation and matrix effects. J. Photochem. Photobiol. A 2007, 187, 33–39. [Google Scholar] [CrossRef]
- Ramadan, W.; Shaikh, P.A.; Ebrahim, S.; Ramadan, A.; Hannoyer, B.; Jouen, S.; Sauvage, X.; Ogale, S. Highly efficient photocatalysis by BiFeO3/α(γ)-Fe2O3 ferromagnetic nano p/n junctions formed by dopant-induced phase separation. J. Nanopart. Res. 2013, 15, 1–10. [Google Scholar] [CrossRef]
- Guo, R.; Fang, L.; Dong, W.; Zheng, F.; Shen, M. Magnetically separable BiFeO3 nanoparticles with a γ-Fe2O3 parasitic phase: Controlled fabrication and enhanced visible-light photocatalytic activity. J. Mater. Chem. 2011, 21, 18645–18652. [Google Scholar] [CrossRef]
- Soltani, T.; Entezari, M.H. Photolysis and photocatalysis of methylene blue by ferrite bismuth nanoparticles under sunlight irradiation. J. Mol. Catal. A Chem. 2013, 377, 197–203. [Google Scholar] [CrossRef]
- Liu, Y.; Zuo, R. Tunable morphology and optical absorption of bismuth ferrite synthesized by sol-gel-hydrothermal method. J. Mater. Sci. Mater. Electron. 2012, 23, 2276–2281. [Google Scholar] [CrossRef]
- Rusevova, K.; Köferstein, R.; Rosell, M.; Richnow, H.H.; Kopinke, F.-D.; Georgi, A. LaFeO3 and BiFeO3 perovskites as nanocatalysts for contaminant degradation in heterogeneous fenton-like reactions. Chem. Eng. J. 2014, 239, 322–331. [Google Scholar] [CrossRef]
- Luo, W.; Zhu, L.; Wang, N.; Tang, H.; Cao, M.; She, Y. Efficient removal of organic pollutants with magnetic nanoscaled BiFeO3 as a reusable heterogeneous Fenton-like catalyst. Environ. Sci. Technol. 2010, 44, 1786–1791. [Google Scholar] [CrossRef] [PubMed]
- Liu, H.; Guo, Y.; Guo, B.; Zhang, D. Synthesis and visible-light photocatalysis capability of BiFeO3-(Na0.5Bi0.5)TiO3 nanopowders by a sol-gel method. Solid State Sci. 2013, 19, 69–72. [Google Scholar] [CrossRef]
- Soltani, T.; Entezari, M.H. Solar-Fenton catalytic degradation of phenolic compounds by impure bismuth ferrite nanoparticles synthesized via ultrasound. Chem. Eng. J. 2014, 251, 207–216. [Google Scholar] [CrossRef]
- Gao, L.; Zheng, S.; Zhang, Q.H. Nano Titanium Oxide Photocatalytic Materials and Applications; Chemical Industry Press: Beijing, China, 2002. [Google Scholar]
- Zhao, Y.; Geng, J.; Wang, X.; Gu, X.; Gao, S. Tetracycline adsorption on kaolinite: pH, metal cations and humic acid effects. Ecotoxicology 2011, 20, 1141–1147. [Google Scholar] [CrossRef] [PubMed]
- Ahmed, S.; Rasul, M.G.; Brown, R.; Hashib, M.A. Influence of parameters on the heterogeneous photocatalytic degradation of pesticides and phenolic contaminants in wastewater: A short review. J. Environ. Manag. 2011, 92, 311–330. [Google Scholar] [CrossRef] [PubMed]
- Wang, K.H.; Hsieh, Y.H.; Chen, L.J. The heterogeneous photocatalytic degradation, intermediates and mineralization for the aqueous solution of cresols and nitrophenols. J. Hazard. Mater. 1998, 59, 251–260. [Google Scholar] [CrossRef]
- Okamoto, K.-I.; Yamamoto, Y.; Tanaka, H.; Tanaka, M.; Itaya, A. Heterogeneous photocatalytic decomposition of phenol over TiO2 powder. Bull. Chem. Soc. Jpn. 1985, 58, 2015–2022. [Google Scholar] [CrossRef]
- Wang, K.H.; Hsieh, Y.H.; Chou, M.Y.; Chang, C.Y. Photocatalytic degradation of 2-chloro and 2-nitrophenol by titanium dioxide suspensions in aqueous solution. Appl. Catal. B Environ. 1999, 21, 1–8. [Google Scholar] [CrossRef]
- Chiou, C.-H.; Wu, C.-Y.; Juang, R.-S. Influence of operating parameters on photocatalytic degradation of phenol in UV/TiO2 process. Chem. Eng. J. 2008, 139, 322–329. [Google Scholar] [CrossRef]
- Najam Khan, M.; Dutta, J. Comparison of photocatalytic activity of zinc stannate particles and zinc stannate/zinc oxide composites for the removal of phenol from water, and a study on the effect of pH on photocatalytic efficiency. Mater. Sci. Semicond. Process. 2015, 36 , 124–133. [Google Scholar] [CrossRef]
- Vescovi, T.; Coleman, H.M.; Amal, R. The effect of pH on UV-based advanced oxidation technologies-1,4-dioxane degradation. J. Hazard. Mater. 2010, 182, 75–79. [Google Scholar] [CrossRef] [PubMed]
- Chu, W.; Choy, W.K.; So, T.Y. The effect of solution pH and peroxide in the TiO2-induced photocatalysis of chlorinated aniline. J. Hazard. Mater. 2007, 141, 86–91. [Google Scholar] [CrossRef] [PubMed]
- Nguyen, A.T.; Juang, R.S. Photocatalytic degradation of p-chlorophenol by hybrid H2O2 and TiO2 in aqueous suspensions under UV irradiation. J. Environ. Manage. 2015, 147, 271–277. [Google Scholar] [CrossRef] [PubMed]
- Werner, J.J.; Arnold, W.A.; McNeill, K. Water hardness as a photochemical parameter: Tetracycline photolysis as a function of calcium concentration, magnesium concentration, and pH. Environ. Sci. Technol. 2006, 40, 7236–7241. [Google Scholar] [CrossRef] [PubMed]
- Zhao, C.; Pelaez, M.; Duan, X.; Deng, H.; O’Shea, K.; Fatta-Kassinos, D.; Dionysiou, D.D. Role of pH on photolytic and photocatalytic degradation of antibiotic oxytetracycline in aqueous solution under visible/solar light: Kinetics and mechanism studies. Appl. Catal. B Environ. 2013, 134, 83–92. [Google Scholar] [CrossRef]
- Chen, Y.; Li, H.; Wang, Z.; Tao, T.; Wei, D.; Hu, C. Photolysis of chlortetracycline in aqueous solution: Kinetics, toxicity and products. J. Environ. Sci. China 2012, 24, 254–260. [Google Scholar] [CrossRef]
- Chen, Y.; Hu, C.; Qu, J.; Yang, M. Photodegradation of tetracycline and formation of reactive oxygen species in aqueous tetracycline solution under simulated sunlight irradiation. J. Photochem. Photobiol. A Chem. 2008, 197, 81–87. [Google Scholar] [CrossRef]
- Jiao, S.; Zheng, S.; Yin, D.; Wang, L.; Chen, L. Aqueous photolysis of tetracycline and toxicity of photolytic products to luminescent bacteria. Chemosphere 2008, 73, 377–382. [Google Scholar] [CrossRef] [PubMed]
- Son, H.-S.; Ko, G.; Zoh, K.-D. Kinetics and mechanism of photolysis and TiO2 photocatalysis of triclosan. J. Hazard. Mater. 2009, 166, 954–960. [Google Scholar] [CrossRef] [PubMed]
- Cao, G.; He, R.; Cai, Z.; Liu, J. Photolysis of bisphenols in aqueous solutions and the effects of different surfactants. React. Kinet. Mech. Catal. 2013, 109, 259–271. [Google Scholar] [CrossRef]
- Gajović, A.; Silva, A.M.T.; Segundo, R.A.; Šturm, S.; Jančar, B.; Čeh, M. Tailoring the phase composition and morphology of Bi-doped goethite-hematite nanostructures and their catalytic activity in the degradation of an actual pesticide using a photo-Fenton-like process. Appl. Catal. B Environ. 2011, 103, 351–361. [Google Scholar] [CrossRef]
- Georgi, A.; Schierz, A.; Trommler, U.; Horwitz, C.P.; Collins, T.J.; Kopinke, F.D. Humic acid modified fenton reagent for enhancement of the working pH range. Appl. Catal. B Environ. 2007, 72, 26–36. [Google Scholar] [CrossRef]
- Sun, J.H.; Sun, S.P.; Fan, M.H.; Guo, H.Q.; Qiao, L.P.; Sun, R.X. A kinetic study on the degradation of p-nitroaniline by Fenton oxidation process. J. Hazard. Mater. 2007, 148, 172–177. [Google Scholar] [CrossRef] [PubMed]
- Rusevova, K.; Kopinke, F.-D.; Georgi, A. Nano-sized magnetic iron oxides as catalysts for heterogeneous Fenton-like reactions-influence of Fe(II)/Fe(III) ratio on catalytic performance. J. Hazard. Mater. 2012, 241–242, 433–440. [Google Scholar] [CrossRef] [PubMed]
- Duesterberg, C.K.; Mylon, S.E.; Waite, T.D. pH effects on iron-catalyzed oxidation using Fenton’s reagent. Environ. Sci. Technol. 2008, 42, 8522–8527. [Google Scholar] [CrossRef] [PubMed]
- Cheng, M.M.; Ma, W.H.; Li, J.; Huang, Y.P.; Zhao, J.C. Visible-light-assisted degradation of dye pollutants over Fe(III)-loaded resin in the presence of H2O2 at neutral pH values. Environ. Sci. Technol. 2004, 38, 1569–1575. [Google Scholar] [CrossRef] [PubMed]
- Miller, C.M.; Valentine, R.L. Mechanistic studies of surface catalyzed H2O2 decomposition and contaminant degradation in the presence of sand. Water Res. 1999, 33, 2805–2816. [Google Scholar] [CrossRef]
- Cai, F.; Tang, Y.; Chen, F.; Yan, Y.; Shi, W. Enhanced visible-light-driven photocatalytic degradation of tetracycline by Cr3+ doping SrTiO3 cubic nanoparticles. RSC Adv. 2015, 5, 21290–21296. [Google Scholar] [CrossRef]
- Yue, L.; Wang, S.; Shan, G.; Wu, W.; Qiang, L.; Zhu, L. Novel mwnts-Bi2WO6 composites with enhanced simulated solar photoactivity toward adsorbed and free tetracycline in water. Appl. Catal. B Environ. 2015, 176–177, 11–19. [Google Scholar] [CrossRef]
- Yan, X.; Wang, X.; Gu, W.; Wu, M.; Yan, Y.; Hu, B.; Che, G.; Han, D.; Yang, J.; Fan, W.; et al. Single-crystalline AgIn(MoO4)2 nanosheets grafted Ag/AgBr composites with enhanced plasmonic photocatalytic activity for degradation of tetracycline under visible light. Appl. Catal. B Environ. 2015, 164, 297–304. [Google Scholar] [CrossRef]
- Wu, G.; Li, P.; Xu, D.; Luo, B.; Hong, Y.; Shi, W.; Liu, C. Hydrothermal synthesis and visible-light-driven photocatalytic degradation for tetracycline of Mn-doped SrTiO3 nanocubes. Appl. Surf. Sci. 2015, 333, 39–47. [Google Scholar] [CrossRef]
- Hong, Y.; Ren, A.; Jiang, Y.; He, J.; Xiao, L.; Shi, W. Sol-gel synthesis of visible-light-driven Ni(1−x)Cu(x)Fe2O4 photocatalysts for degradation of tetracycline. Ceram. Int. 2015, 41, 1477–1486. [Google Scholar] [CrossRef]
- Liu, S.; Zhao, X.R.; Sun, H.Y.; Li, R.P.; Fang, Y.F.; Huang, Y.P. The degradation of tetracycline in a photo-electro-Fenton system. Chem. Eng. J. 2013, 231, 441–448. [Google Scholar] [CrossRef]
- Oturan, N.; Wu, J.; Zhang, H.; Sharma, V.K.; Oturan, M.A. Electrocatalytic destruction of the antibiotic tetracycline in aqueous medium by electrochemical advanced oxidation processes: Effect of electrode materials. Appl. Catal. B Environ. 2013, 140–141, 92–97. [Google Scholar] [CrossRef]
- Ferrag-Siagh, F.; Fourcade, F.; Soutrel, I.; Aït-Amar, H.; Djelal, H.; Amrane, A. Tetracycline degradation and mineralization by the coupling of an electro-fenton pretreatment and a biological process. J. Chem. Technol. Biotechnol. 2013, 88, 1380–1386. [Google Scholar] [CrossRef]
© 2015 by the authors; licensee MDPI, Basel, Switzerland. This article is an open access article distributed under the terms and conditions of the Creative Commons Attribution license (http://creativecommons.org/licenses/by/4.0/).
Share and Cite
Xue, Z.; Wang, T.; Chen, B.; Malkoske, T.; Yu, S.; Tang, Y. Degradation of Tetracycline with BiFeO3 Prepared by a Simple Hydrothermal Method. Materials 2015, 8, 6360-6378. https://doi.org/10.3390/ma8095310
Xue Z, Wang T, Chen B, Malkoske T, Yu S, Tang Y. Degradation of Tetracycline with BiFeO3 Prepared by a Simple Hydrothermal Method. Materials. 2015; 8(9):6360-6378. https://doi.org/10.3390/ma8095310
Chicago/Turabian StyleXue, Zhehua, Ting Wang, Bingdi Chen, Tyler Malkoske, Shuili Yu, and Yulin Tang. 2015. "Degradation of Tetracycline with BiFeO3 Prepared by a Simple Hydrothermal Method" Materials 8, no. 9: 6360-6378. https://doi.org/10.3390/ma8095310
APA StyleXue, Z., Wang, T., Chen, B., Malkoske, T., Yu, S., & Tang, Y. (2015). Degradation of Tetracycline with BiFeO3 Prepared by a Simple Hydrothermal Method. Materials, 8(9), 6360-6378. https://doi.org/10.3390/ma8095310