
Effect of Hybrid Talc-Basalt Fillers in the Shell Layer on Thermal and Mechanical Performance of Co-Extruded Wood Plastic Composites


Abstract
:
1. Introduction
2. Experimental
2.1. Materials
2.2. Sample Preparation
2.2.1. BF/Talc/HDPE Composites
2.2.2. Co-Extruded WPCs with BF and Talc Reinforced HDPE Shells
2.3. Characterization of BF/Talc/HDPE Composites
2.4. Characterization of Co-Extruded WPCs with BF/Talc/HDPE Shells
3. Results and Discussion
3.1. BF/Talc/HDPE Composite
3.1.1. Basic Morphology and Bending Properties

| BF/Talc (wt %) | Flexural | Tensile | Impact Strength (KJ/m2) a,b | ||
|---|---|---|---|---|---|
| Strength (MPa) a,b | Modulus (GPa) a,b | Strength (MPa) a,b | Modulus (GPa) a,b | ||
| 0/40 | 29.00 (0.80)A | 2.35 (0.08)A | 22.22 (0.56)B | 3.24 (0.17)A | 4.60 (0.39)A |
| 4/36 | 30.38 (0.51)B | 2.39 (0.08)AB | 21.37 (0.55)A | 3.21 (0.11)A | 4.87 (0.17)AB |
| 8/32 | 31.27 (0.34)C | 2.48 (0.04)BC | 21.33 (0.62)A | 3.46 (0.07)B | 5.01 (0.16)B |
| 12/28 | 32.16 (0.50)D | 2.49 (0.04)C | 21.53 (0.51)AB | 3.60 (0.18)B | 5.13 (0.12)B |
| 20/20 | 32.44 (0.55)EF | 2.58 (0.08)D | 21.79 (0.75)AB | 3.88 (0.11)C | 5.49 (0.25)C |
| 40/0 | 33.11 (0.37)F | 2.75 (0.05)E | 21.31 (0.27)A | 4.11 (0.09)D | 6.70 (0.25)D |
3.1.2. Surface energy Estimation
| Phase | γ (mN/m) | γLW (mN/m) | (mN/m) | γΘ (mN/m) | γAB (mN/m) |
|---|---|---|---|---|---|
| HDPE | 40.9 | 32 | - | - | 8.9 |
| BF | 140–240 | 61 | 159 | 11 | 83.64 |
| Talc | 47.7–53.3 | 45.5 | 0.02 | 57.01 | 2.14 |
| Interface Type | (mN/m) | WA (mN/m) |
|---|---|---|
| HDPE-Talc | 20.2 | 85.0 |
| HDPE-BF | 29.9 | 142.9 |
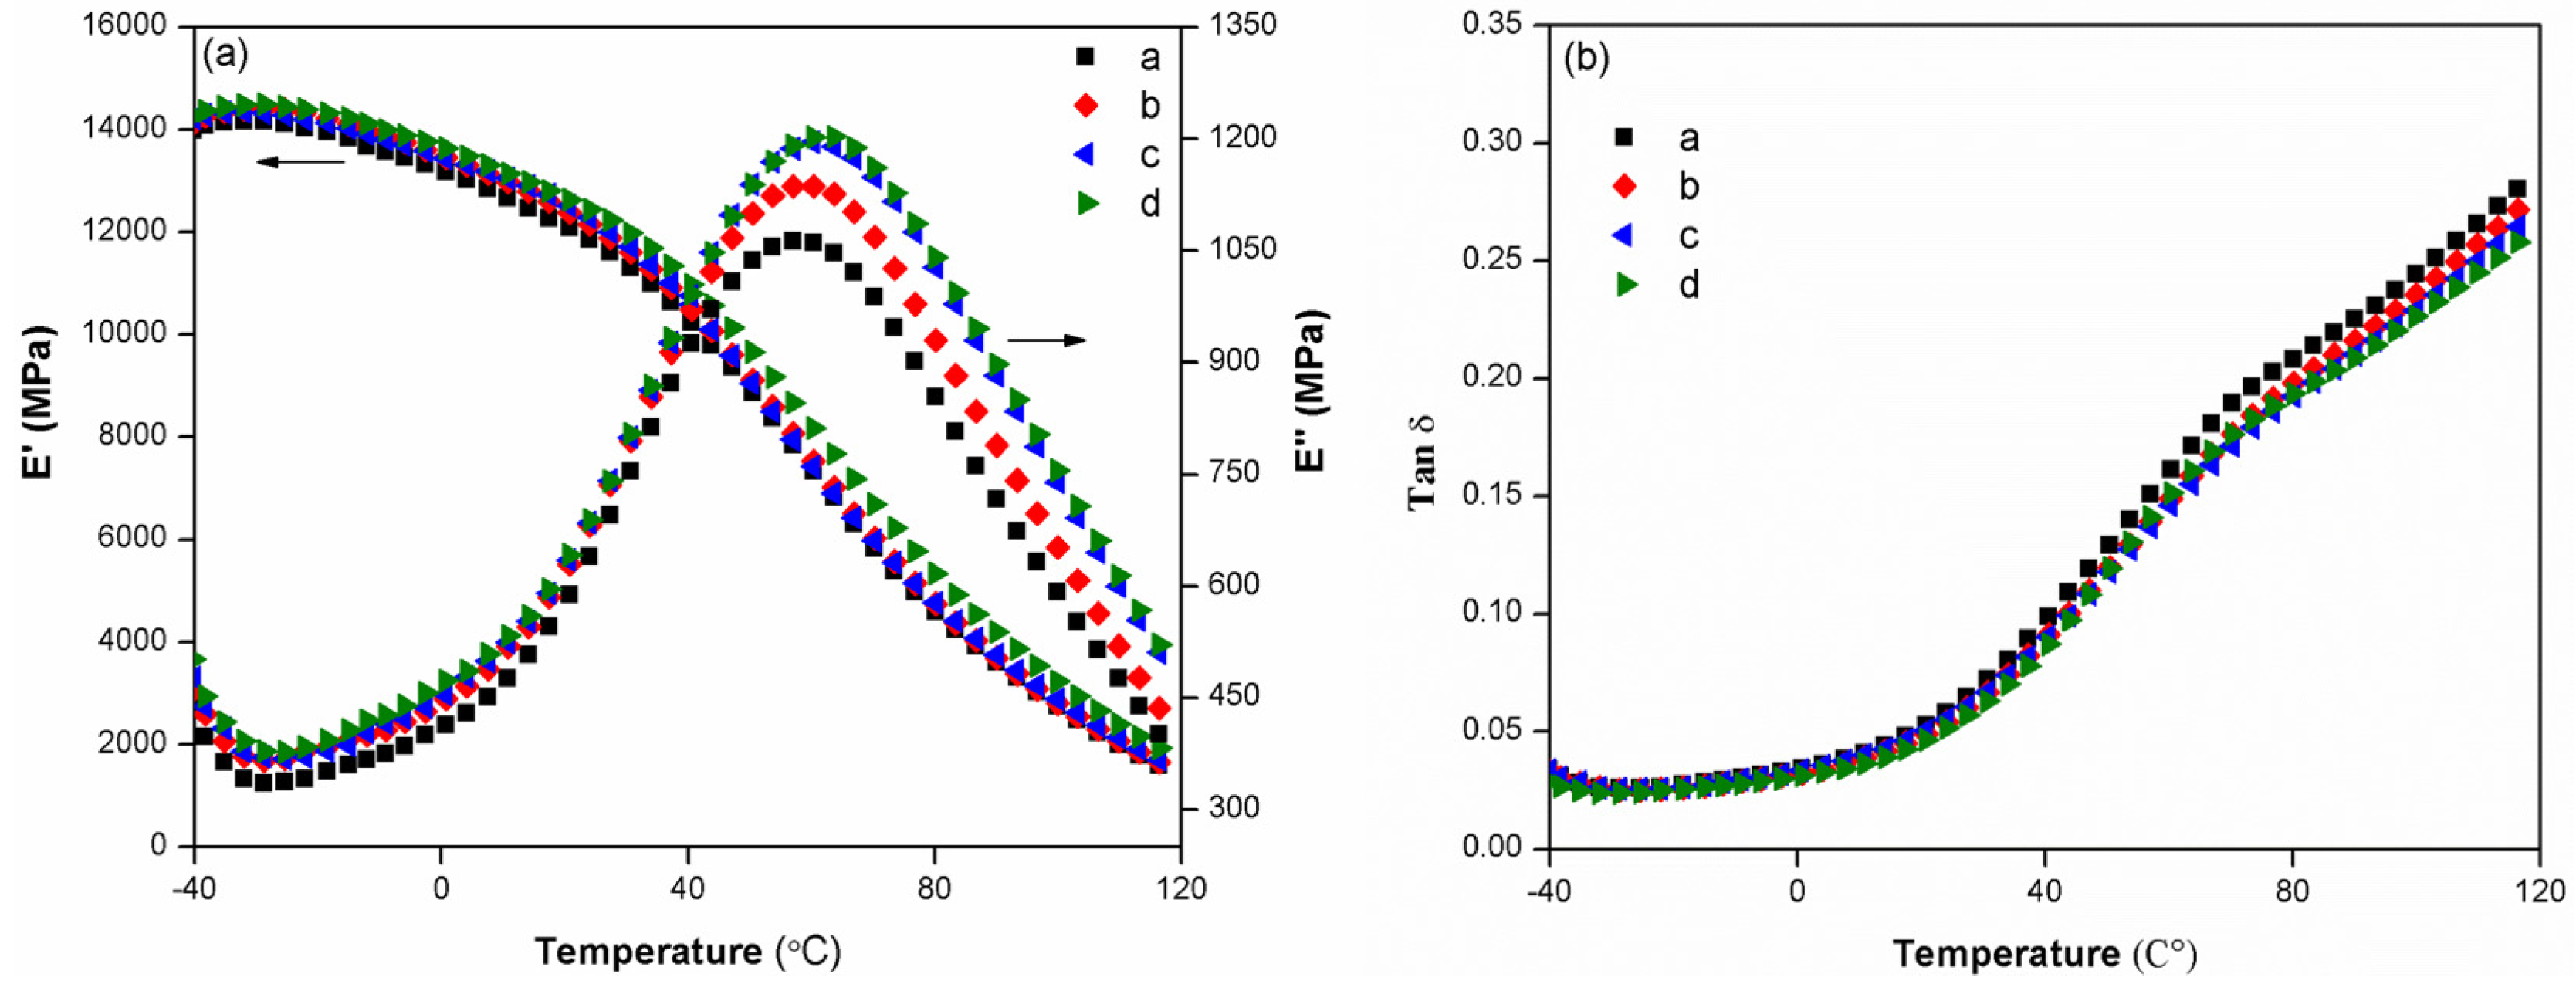
3.1.3. DMA Properties
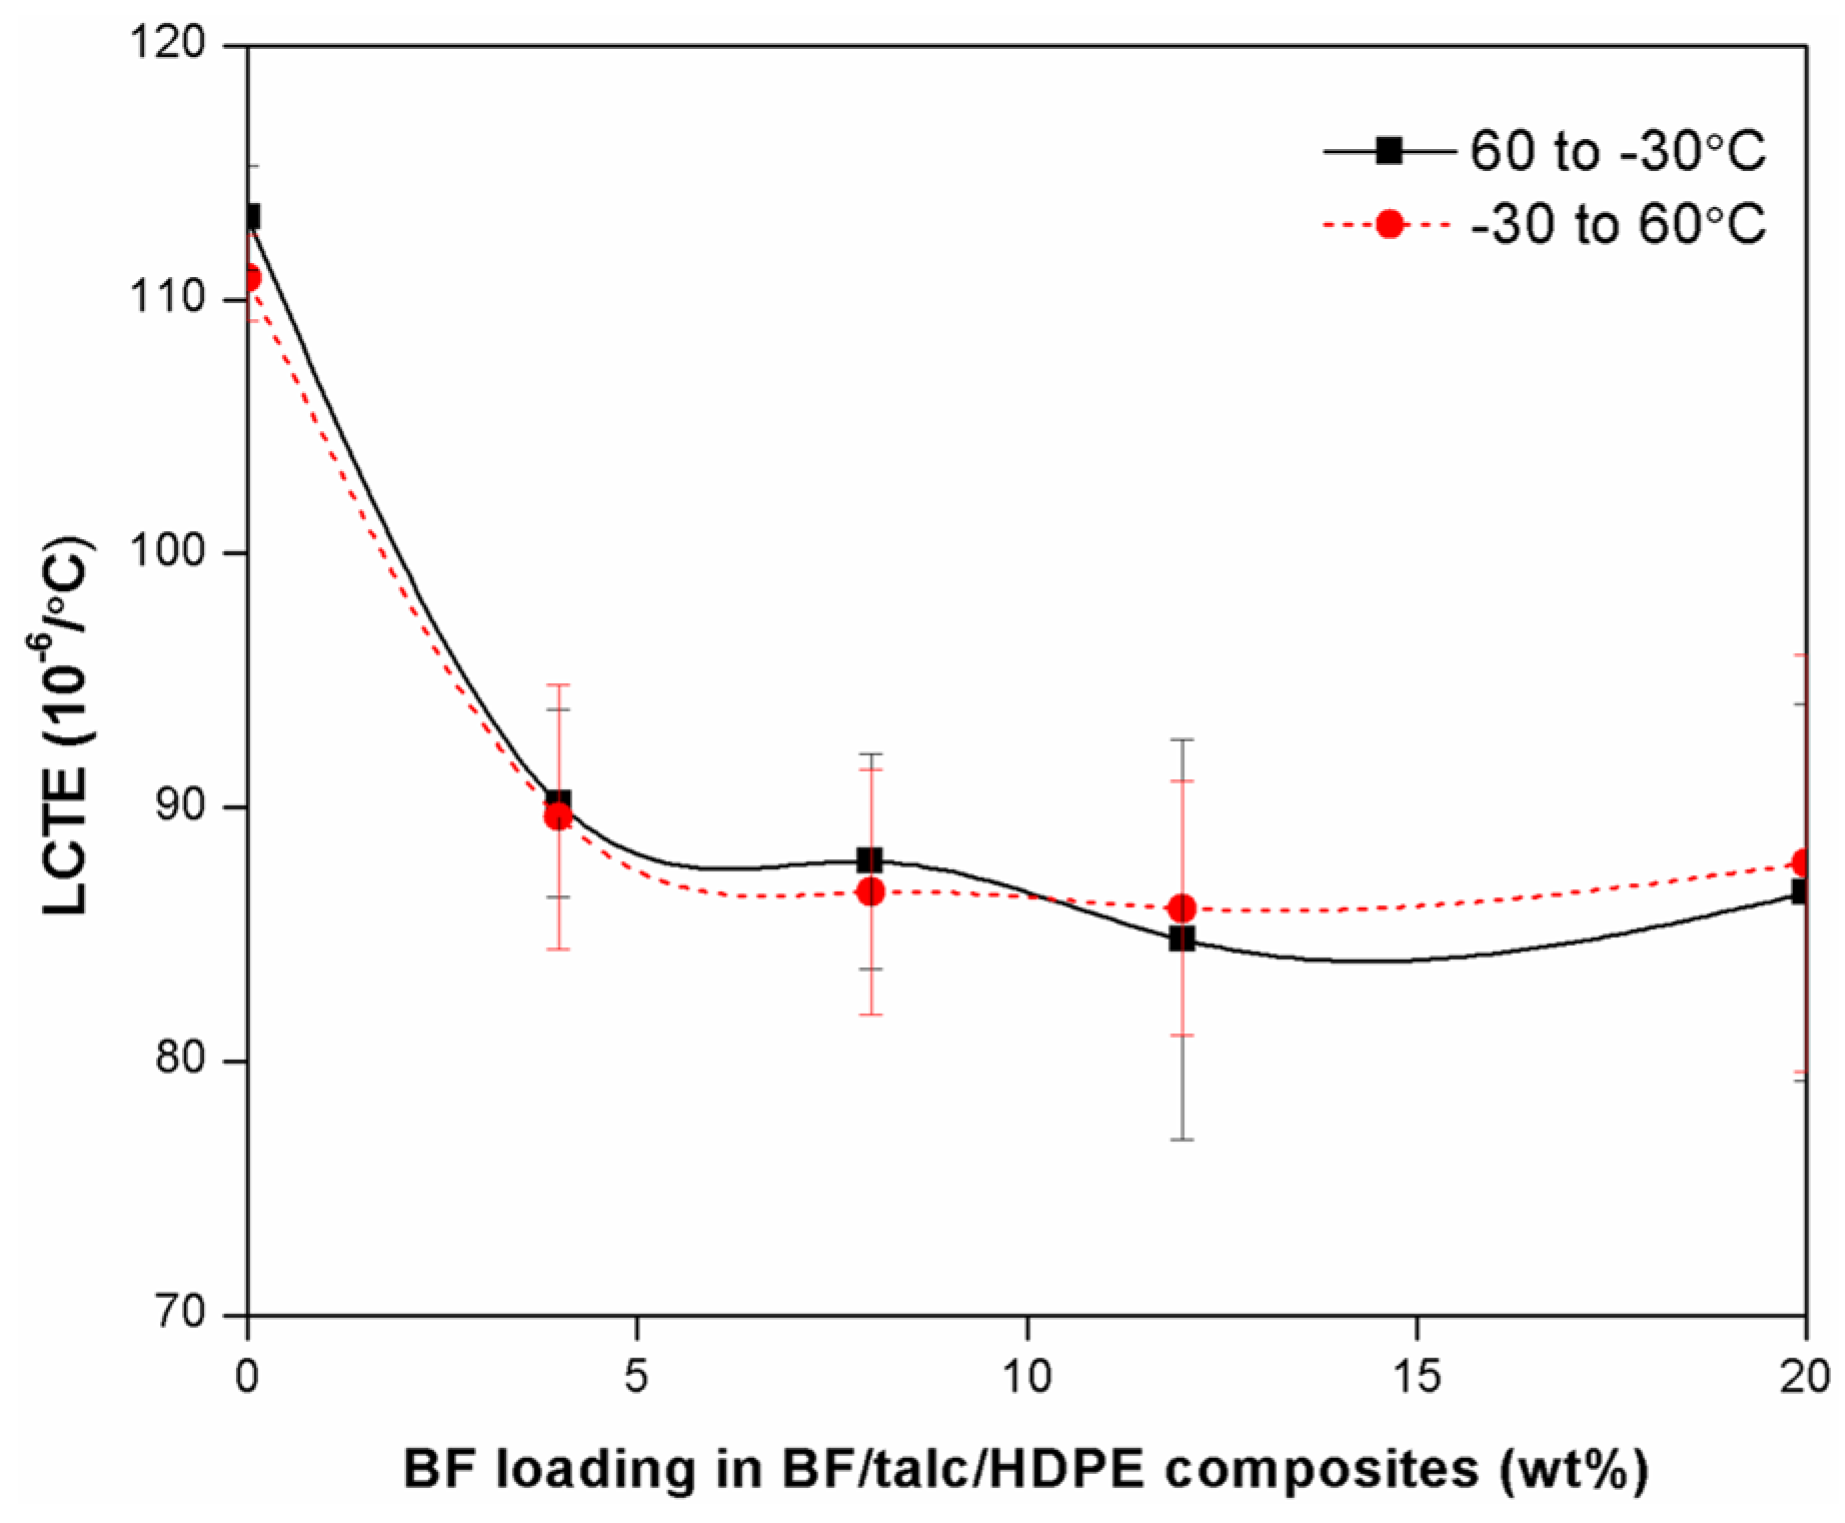
3.1.4. Thermal Expansion Property
3.2. Co-Extruded WPCs with BF/Talc/HDPE Shells
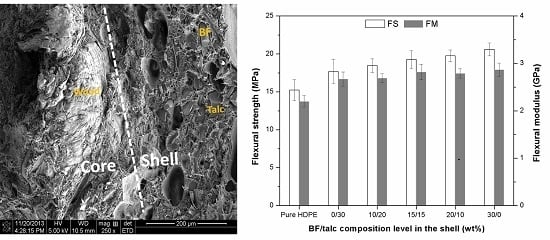
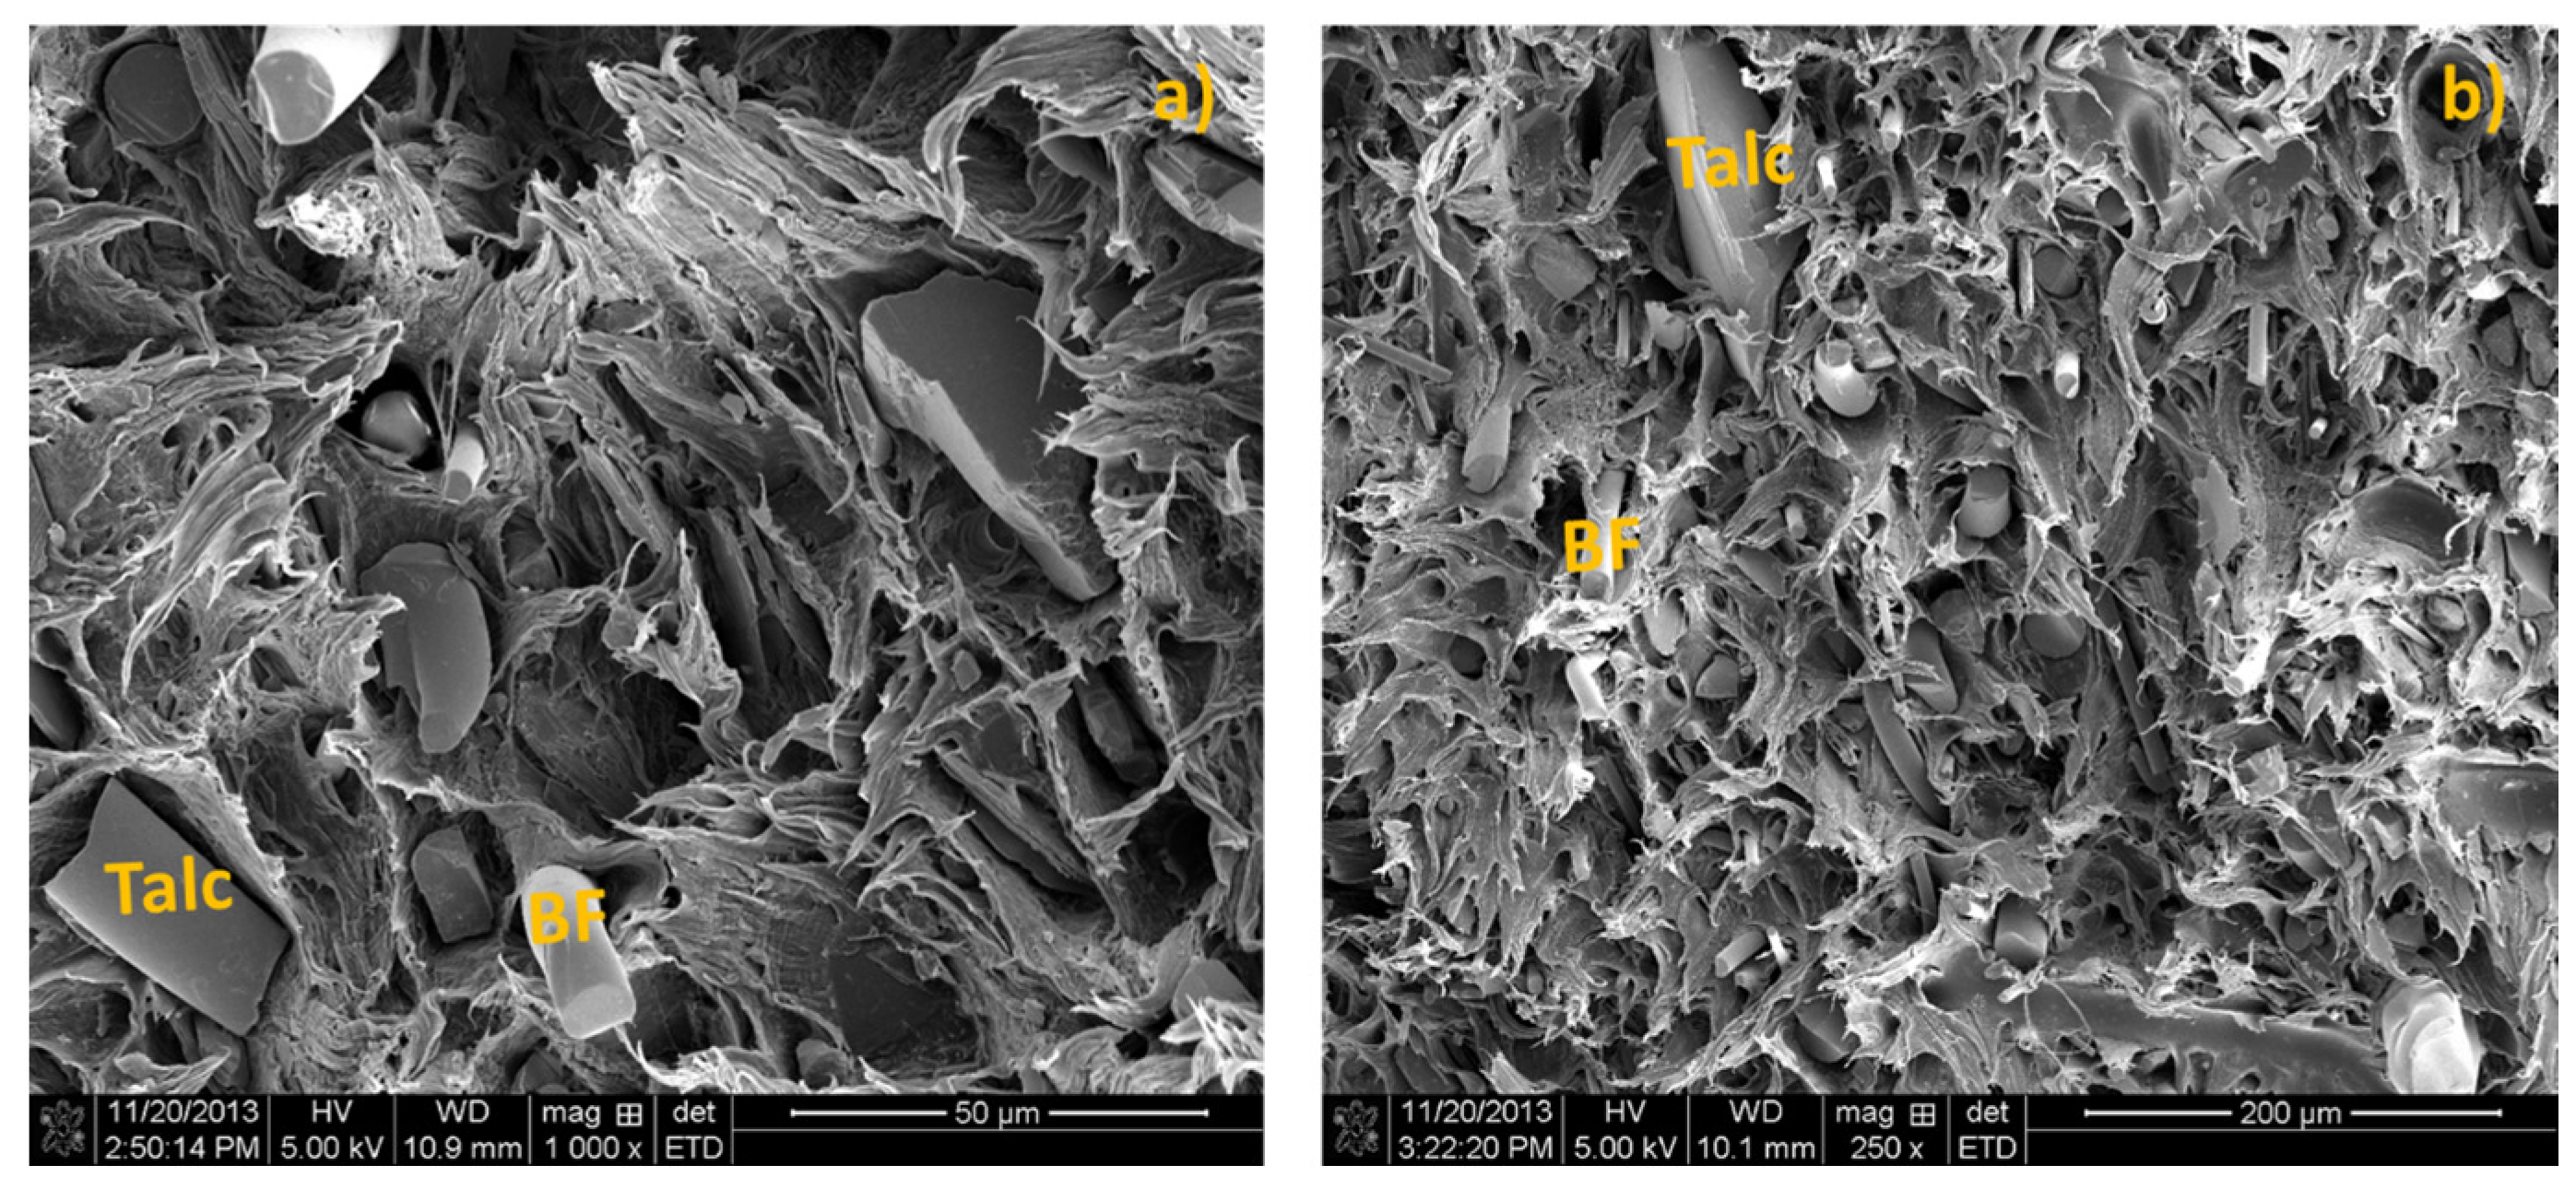
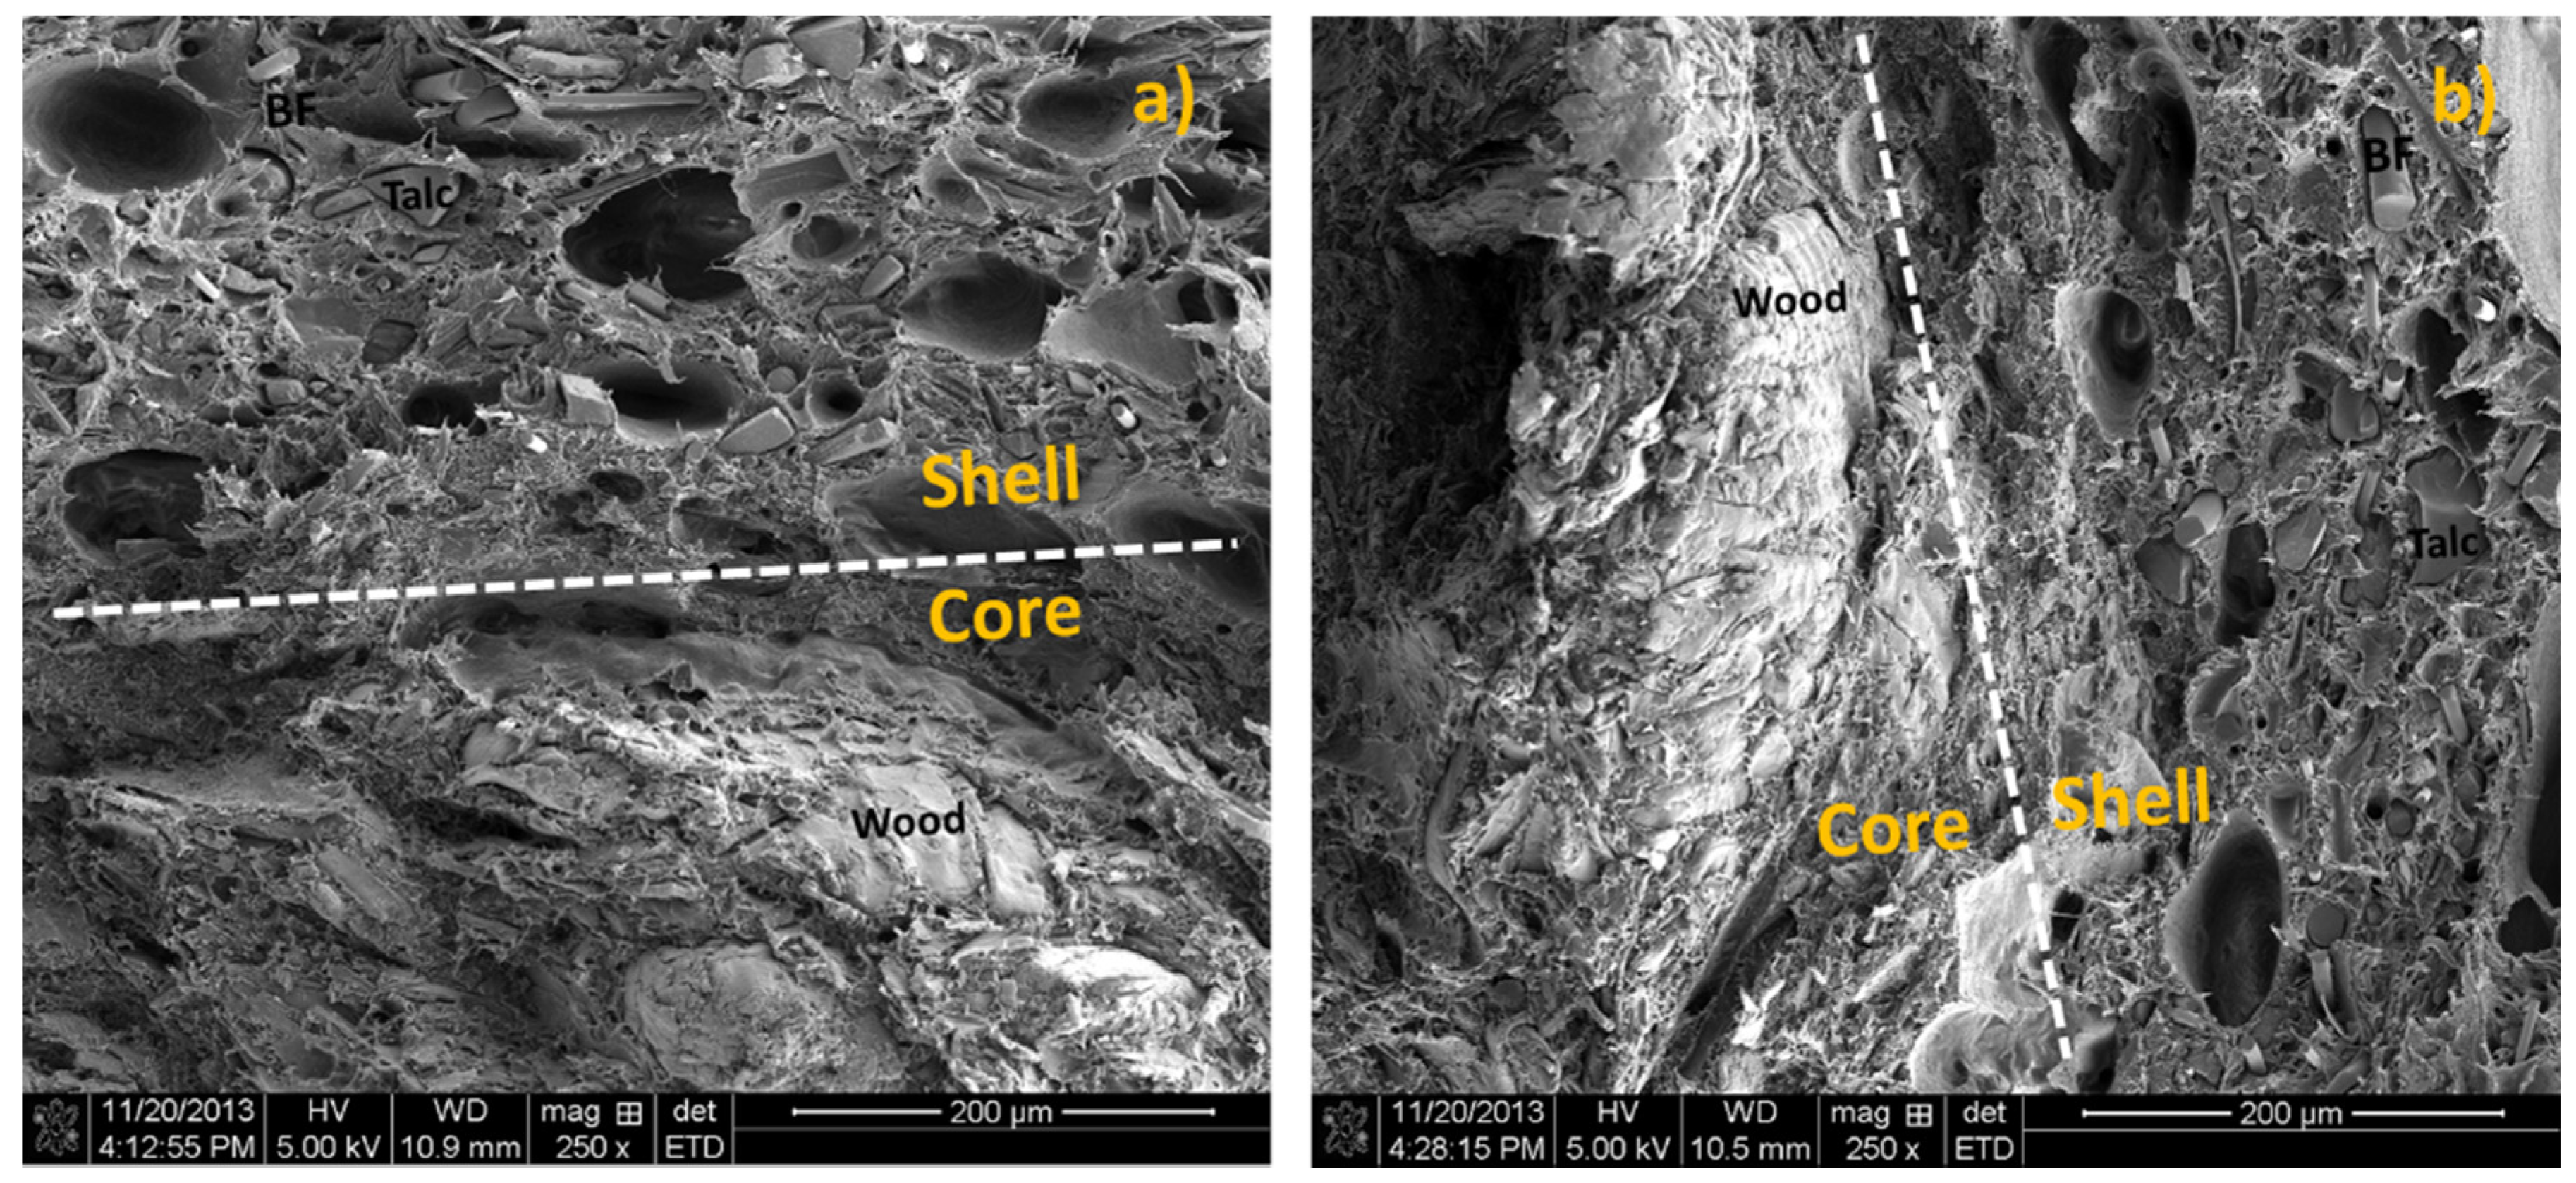
3.2.1. Morphology
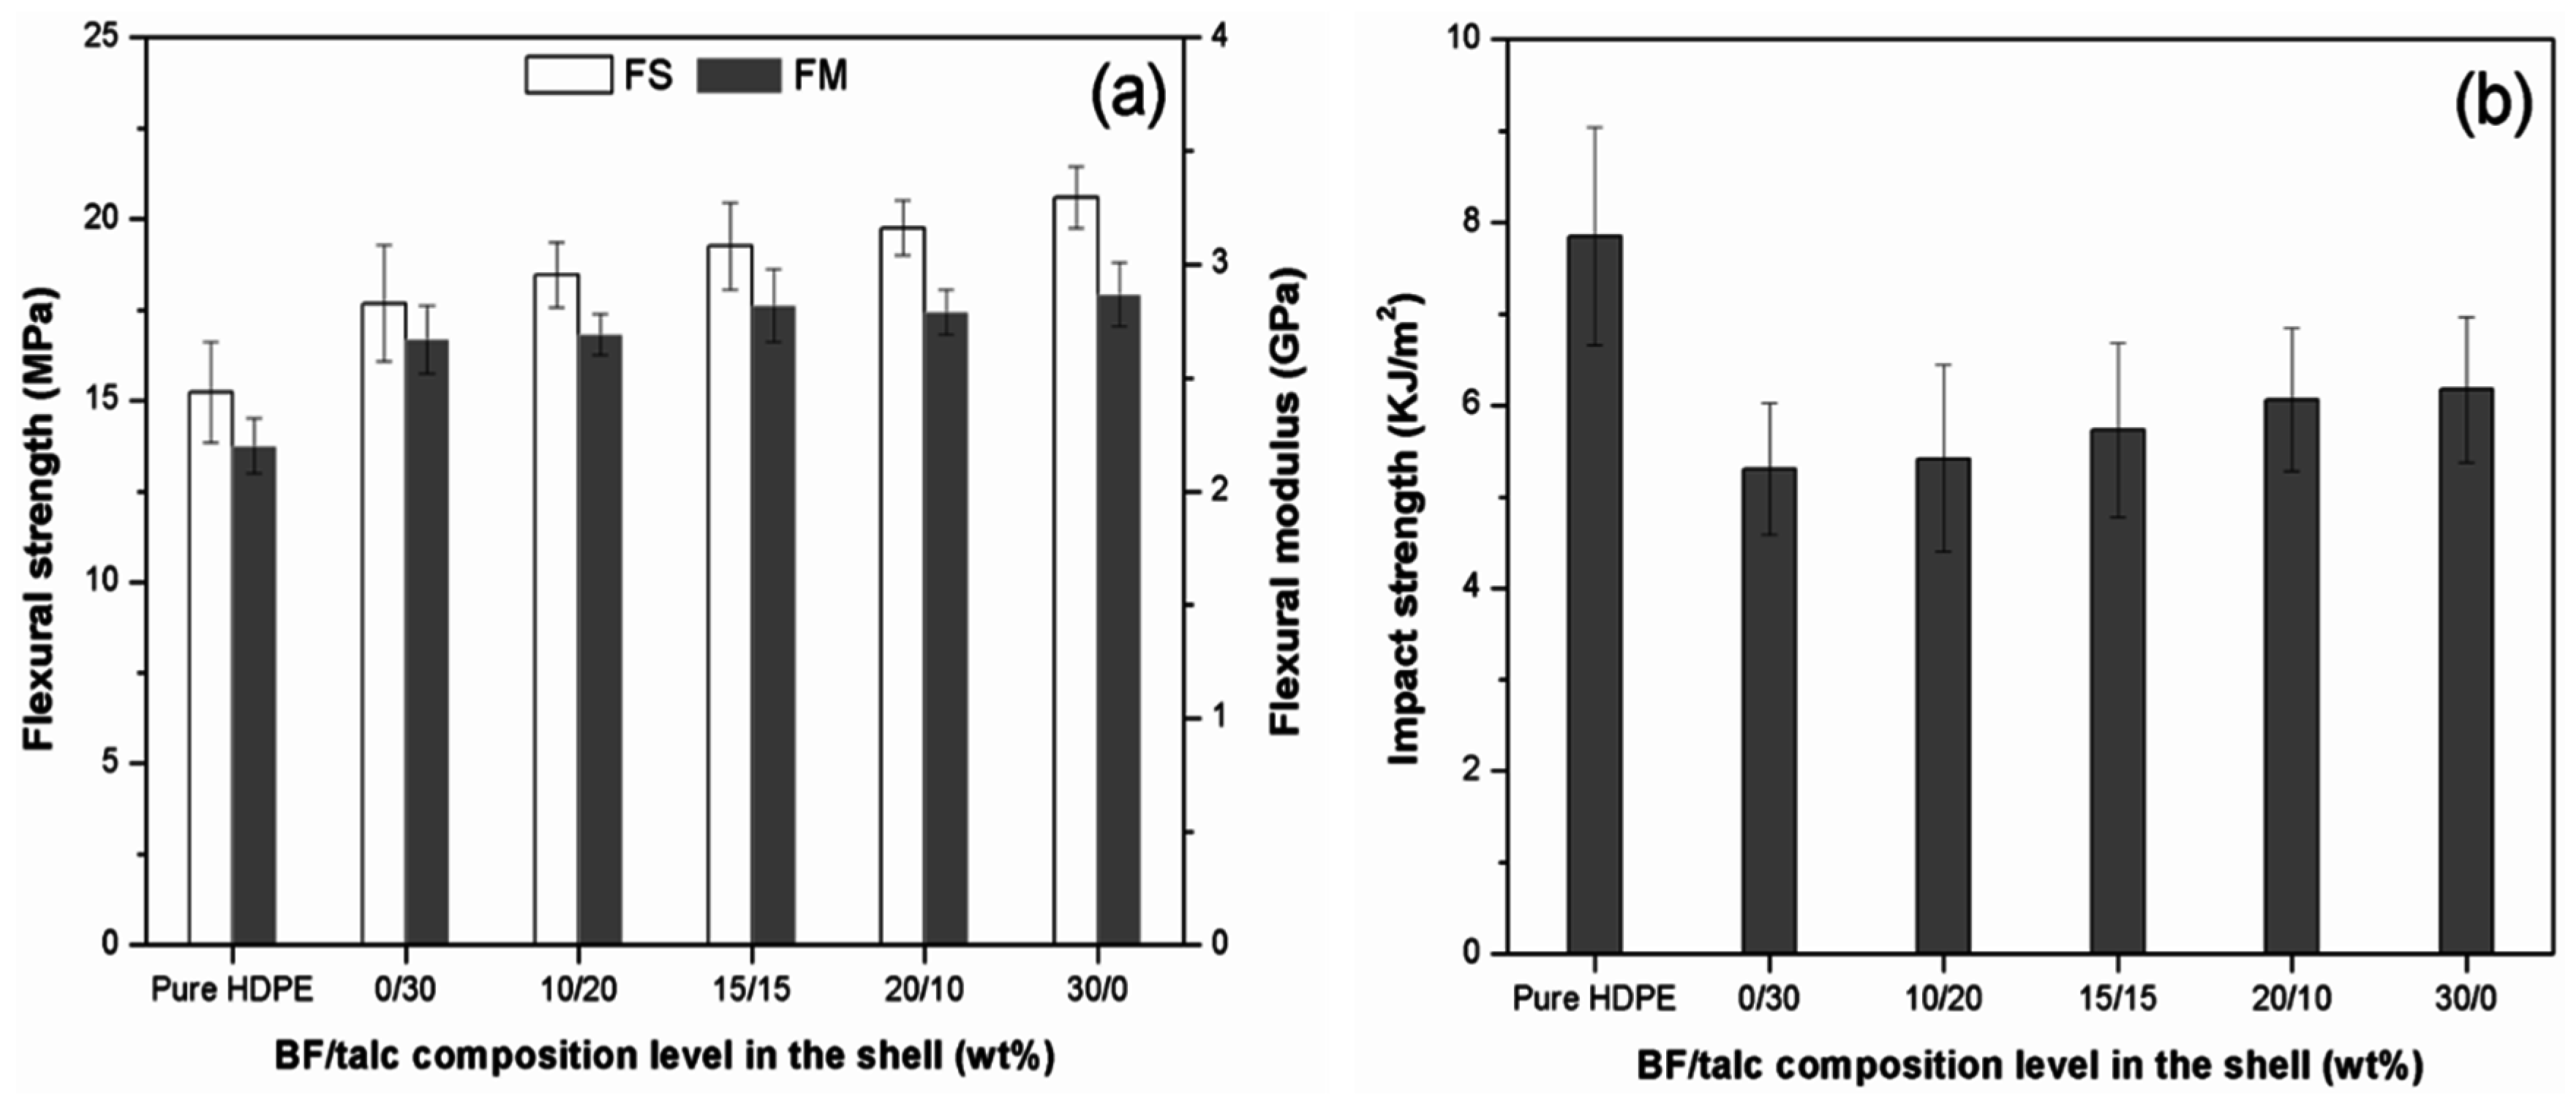
3.2.2. Mechanical Properties
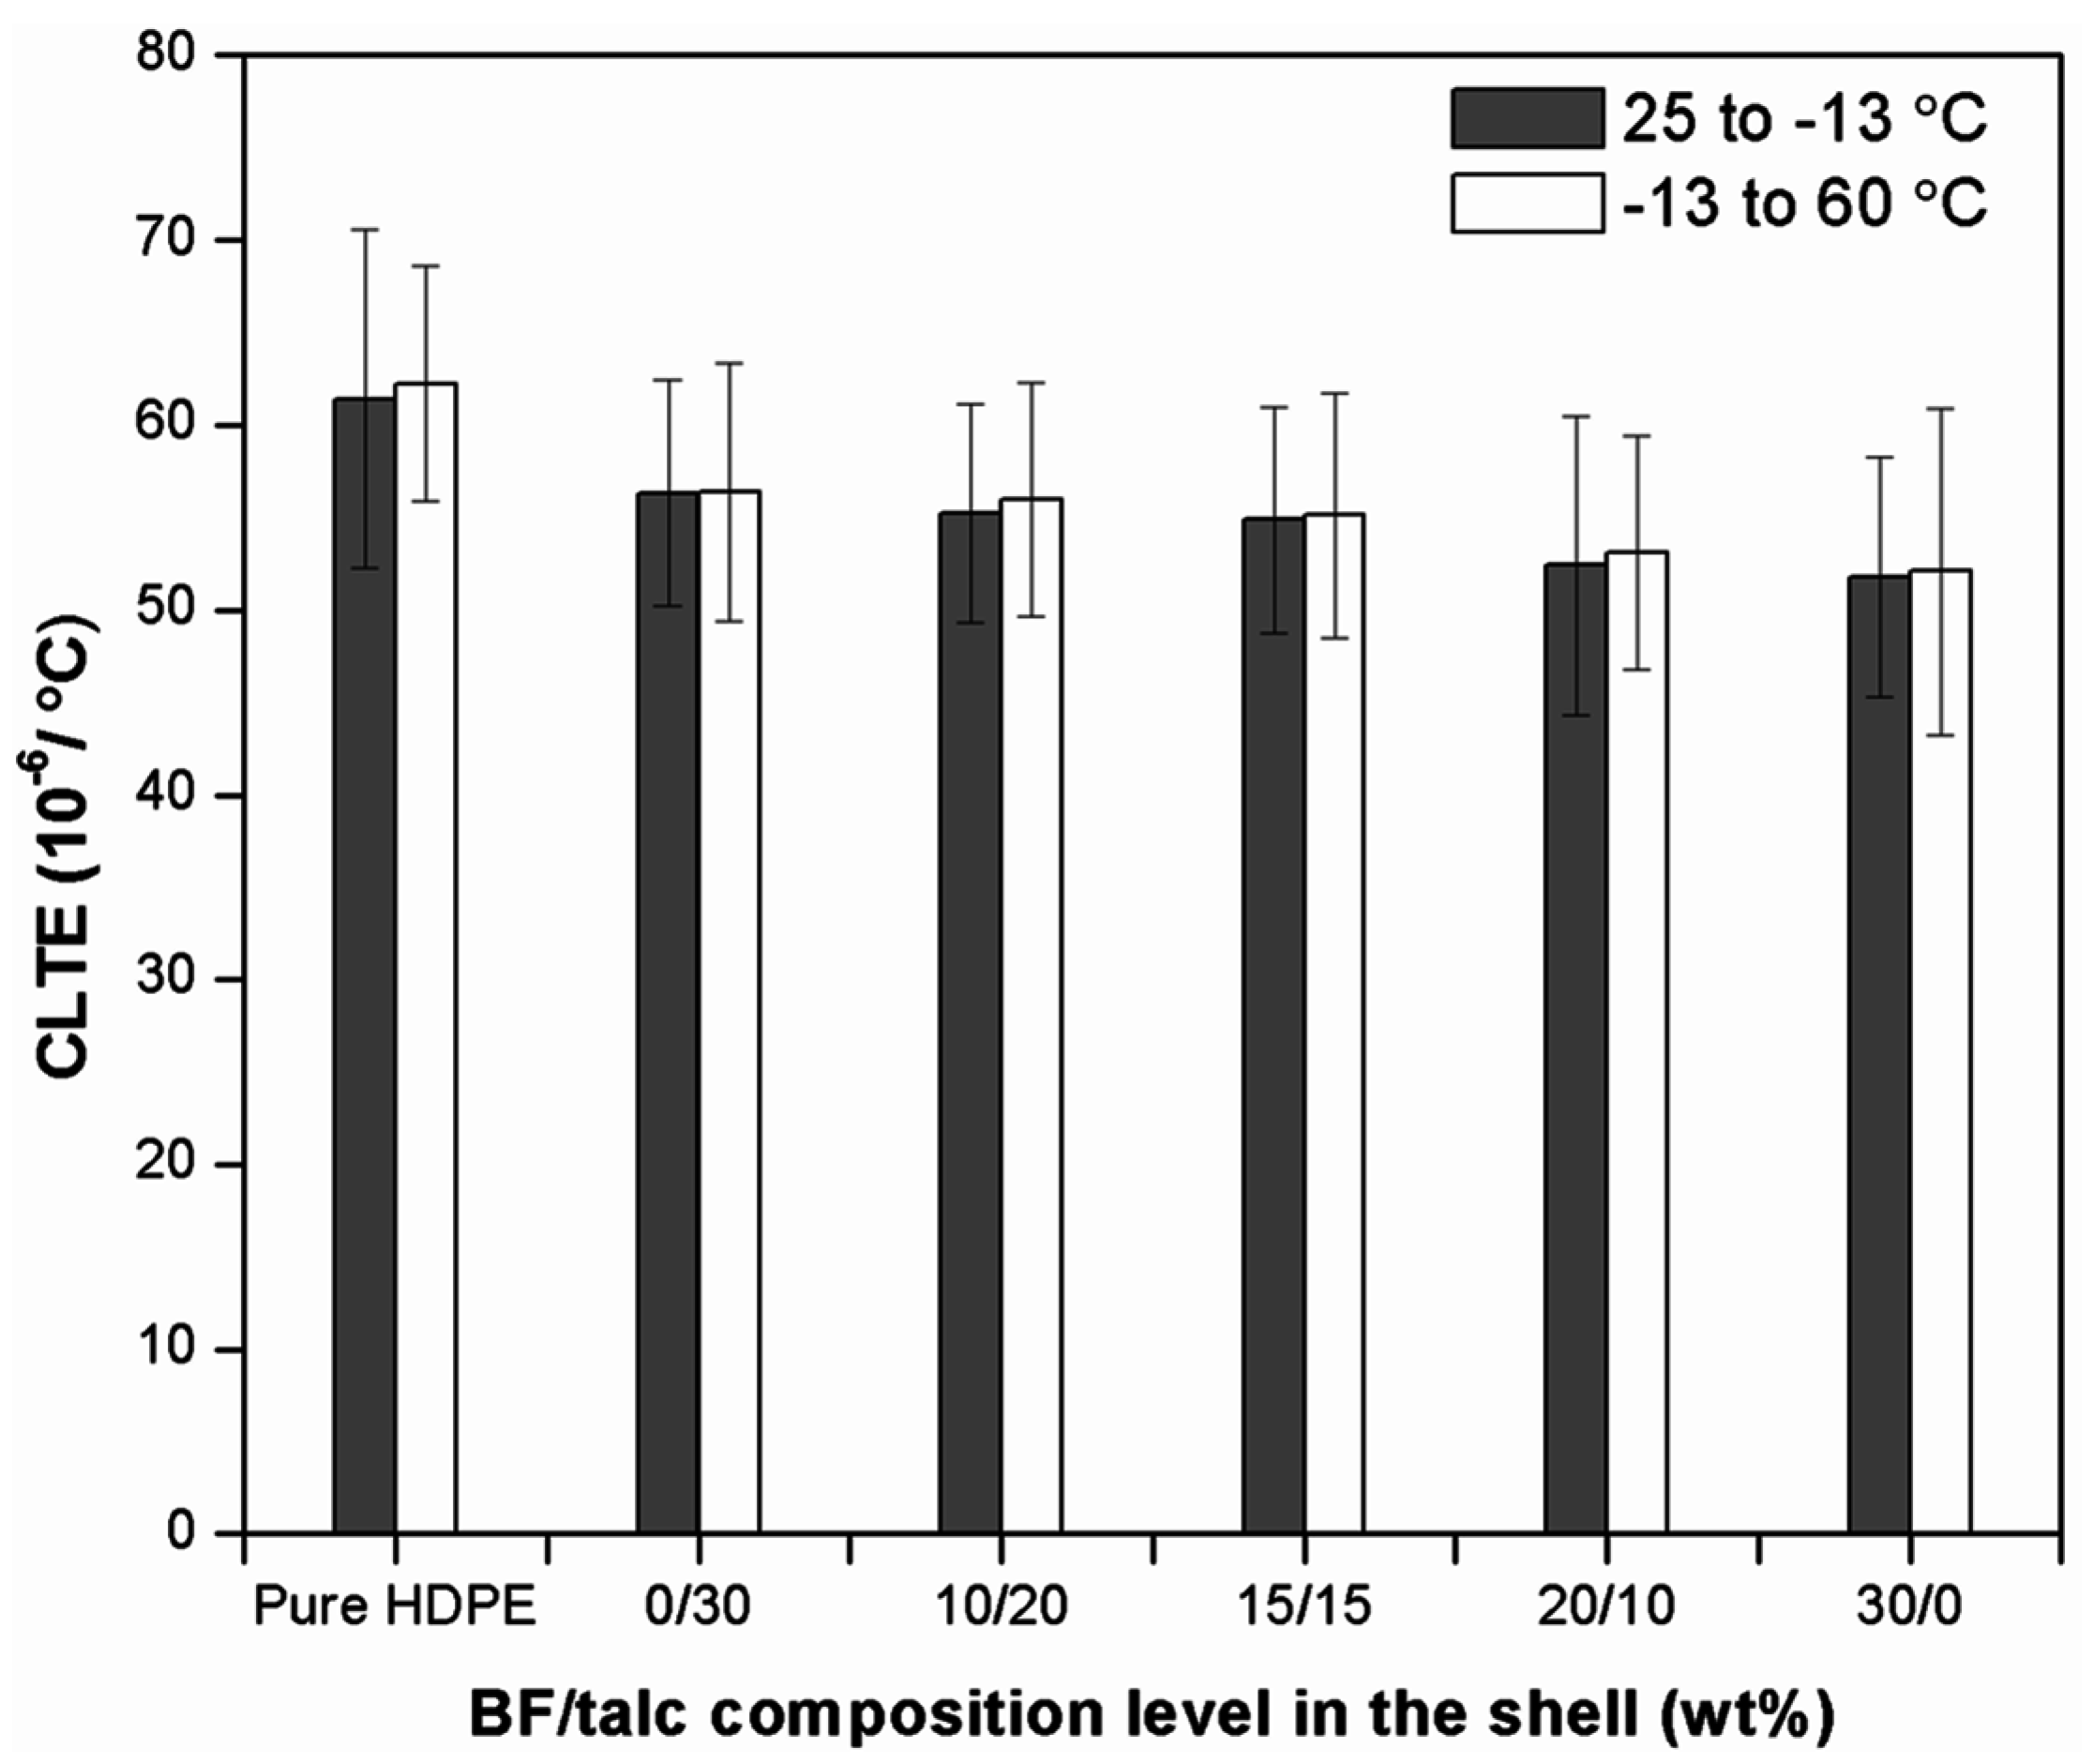
3.2.3. Thermal Expansion Property
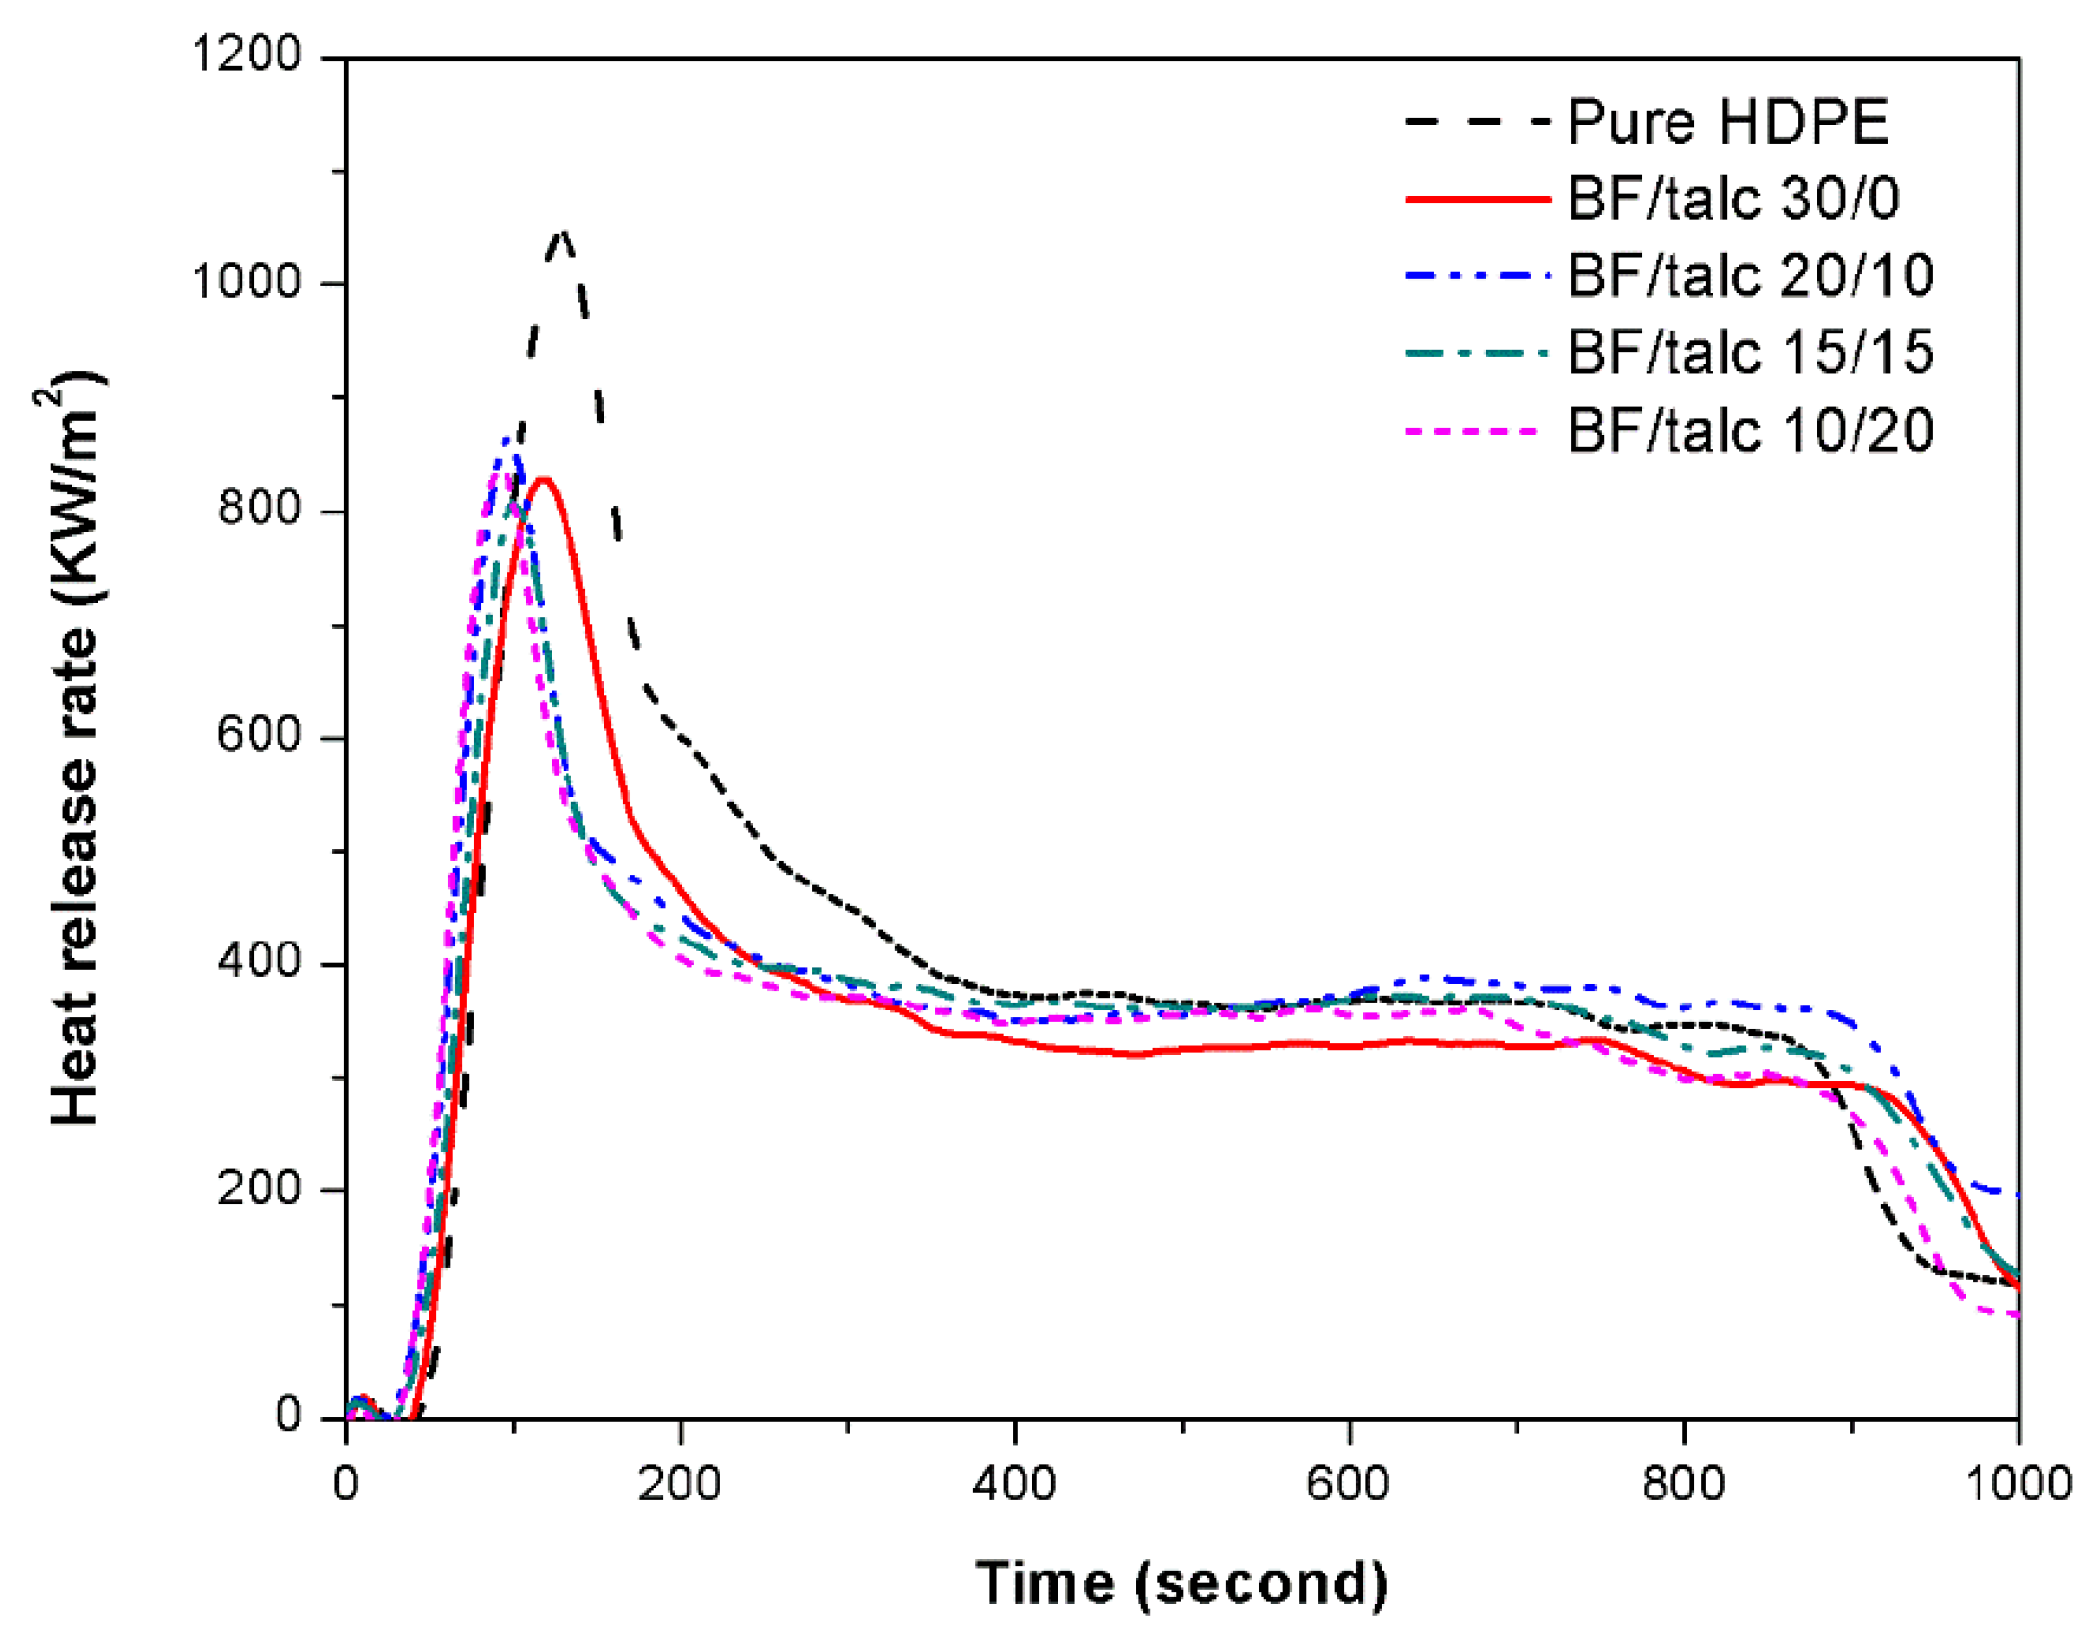
3.2.4. Flammability Property
| WPC with HDPE/BF/Talc | Cone Calorimetry Data a | |||||
|---|---|---|---|---|---|---|
| PHRR KW/m2 | AHRR KW/m2 | THR MJ/m2 | AMLR g/(m2s) | ASEA m2/kg | AEHC (MJ/kg) | |
| Core b | 507.64 | 303.48 | 259.54 | 14.57 | 420.58 | 25.72 |
| 0/0 c | 1082.7 | 380.50 | 397.95 | 15.54 | 455.57 | 30.12 |
| 30/0 c | 869.93 | 340.97 | 349.51 | 13.98 | 395.44 | 28.56 |
| 20/10 c | 877.21 | 336.50 | 368.84 | 13.99 | 423.97 | 32.95 |
| 15/15 c | 878.36 | 330.89 | 367.74 | 14.07 | 460.56 | 29.44 |
| 10/20 c | 883.61 | 321.75 | 380.42 | 14.47 | 426.21 | 29.20 |

4. Conclusions
Acknowledgments
Author Contributions
Conflicts of Interest
References
- Klyosov, A.A. Wood-Plastic Composites; John Wiley & Sons, Inc.: Hoboken, NJ, USA, 2007. [Google Scholar]
- Wechslera, A.; Hiziroglu, S. Some of the properties of wood-plastic composites. Build. Environ. 2007, 42, 2637–2644. [Google Scholar] [CrossRef]
- Karrad, S.; Lopez Cuesta, J.M.; Crespy, A. Influence of a fine talc on the properties of composites with high density polyethylene and polyethylene/polystyrene blends. J. Mater. Sci. 1998, 33, 453–461. [Google Scholar]
- Huda, M.S.; Mohanty, A.K.; Drzal, L.T.; Misra, M.; Schut, E. Green composites from recycled cellulose and poly(lactic acid): Physicomechanical and morphological properties evaluation. J. Mater. Sci. 2005, 40, 4221–4229. [Google Scholar] [CrossRef]
- Weon, J.I.; Sue, H.J. Mechanical properties of talcand CaCO3-reinforced high-crystallinity polypropylene composites. J. Mater. Sci. 2006, 41, 2291–2300. [Google Scholar] [CrossRef]
- Noel, O.; Clark, R. Recent advances in the use of talc in wood-plastic composites. In Proceeding of the 8th International Conference on Wood Fiber-Plastic Composites, Madison, WI, USA, 23–25 May 2005.
- Huang, R.; Xiong, W.; Xu, X.; Wu, Q. Thermal expansion behavior of co-extruded wood plastic composites with glass-fiber reinforced shells. BioResources 2012, 7, 5514–5526. [Google Scholar] [CrossRef]
- Huang, R.; Kim, B.J.; Lee, S.Y.; Zhang, Y.; Wu, Q. Co-extruded wood plastic composites with talc filled shells: Morphology, mechanical, and thermal expansion performance. BioResources 2013, 8, 2283–2299. [Google Scholar] [CrossRef]
- Czigany, T.; Vad, J.; Poloskei, K. Basalt fiber as a reinforcement of polymer composites. Period. Polytech. Mech. Eng. 2005, 49, 3–14. [Google Scholar]
- Sim, J.; Park, C.; Moon, D.Y. Characteristics of basalt fiber as a strengthening material for concrete structures. J. Compos. Part B 2005, 36, 504–512. [Google Scholar] [CrossRef]
- Wang, M.C.; Zhang, Z.G.; Li, Y.B. Chemical durability and mechanical properties of alkali-proof basalt fiber and its reinforced epoxy composites. J. Reinf. Plast. Compos. 2008, 27, 393–407. [Google Scholar] [CrossRef]
- Botev, M.; Betchev, H.; Bikiaris, D.; Panayiotou, C. Mechanical properties and viscoelastic behavior of basalt fiber-reinforced polypropylene. J. Appl. Polym. Sci. 1999, 74, 523–531. [Google Scholar] [CrossRef]
- Liu, Q.; Shaw, M.T.; Parnas, R.S.; McDonnell, A.M. Investigation of basalt fiber composite mechanical properties for applications in transportation. Polym. Compos. 2006, 27, 41–48. [Google Scholar] [CrossRef]
- Dalinkevich, A.A.; Gumargalieva, K.Z.; Marakhovsky, S.S.; Soukhanov, A.V. Modern basalt fibrous materials and basalt fiber-based polymeric composites. J. Nat. Fibers 2009, 6, 248–271. [Google Scholar] [CrossRef]
- Chen, J.; Wang, Y.; Gu, C.; Liu, J.; Liu, Y.; Li, M.; Lu, M. Enhancement of the mechanical properties of basalt fiber-wood-plastic composites via maleic anhydride grafted high-density polyethylene (MAPE) addition. Materials 2013, 6, 2483–2496. [Google Scholar] [CrossRef]
- Wu, Q.; Chi, K.; Wu, Y.; Lee, S. Mechanical, thermal expansion, and flammability properties of co-extruded wood polymer composites with basalt fiber reinforced shells. Mater. Design 2014, 60, 334–342. [Google Scholar] [CrossRef]
- Singh, S.; Mohanty, A.K.; Misra, M. Hybrid bio-composite from talc, wood fiber and bioplastic: Fabrication and characterization. Compos. Part A Appl. Sci. Manuf. 2010, 41, 304–312. [Google Scholar] [CrossRef]
- Moorthy, S.S.; Manonmani, K. Fabrication and characterization of TiO2 particulate filled glass fiber reinforced polymer composites. Mater. Phys. Mech. 2013, 18, 28–34. [Google Scholar]
- Kim, B.J.; Yao, F.; Han, G.; Wang, Q.; Wu, Q. Mechanical and physical properties of core-shell structured wood plastic composites: Effect of shells with hybrid mineral and wood fillers. J. Compos. Part B 2013, 45, 1040–1048. [Google Scholar] [CrossRef]
- Yao, F.; Wu, Q. Coextruded polyethylene and wood-flour composite: Effect of shell thickness, wood loading, and core quality. J. Appl. Polym. Sci. 2010, 118, 3594–3601. [Google Scholar] [CrossRef]
- American Society for Testing and Materials (ASTM) International. Standard Test Methods for Flexural Properties of Unreinforced and Reinforced Plastics and Electrical Insulating Materials; ASTM D790-03; ASTM International: West Conshohocken, PA, USA, 2003. [Google Scholar]
- American Society for Testing and Materials (ASTM) International. Standard Test Method for Tensile Properties of Plastics; ASTM D638-03; ASTM International: West Conshohocken, PA, USA, 2003. [Google Scholar]
- American Society for Testing and Materials (ASTM) International. Standard Test Methods for Determining the Izod Pendulum Impact Resistance of Plastics; ASTM D256-10e1; ASTM International: West Conshohocken, PA, USA, 2010. [Google Scholar]
- American Society for Testing and Materials (ASTM) International. Standard Test Method for Flexural Properties of Unreinforced and Reinforced Plastics and Electrical Insulating Materials by Four-Point Bending; ASTM D6272-10; ASTM International: West Conshohocken, PA, USA, 2010. [Google Scholar]
- International Organization for Standardization (ISO). Reaction-to-Fire Tests—Heat Release, Smoke Production and Mass Loss Rate—Part 1: Heat Release Rate (Cone Calorimeter Method); ISO 5660-1:2002; International Organization for Standardization: Geneva, Switzerland, 2002. [Google Scholar]
- Van Oss, C.J.; Chaudhury, M.K.; Good, R.J. Interfacial Lifshitz-van der Waals and polar interactions in macroscopic systems. Chem. Reviews 1988, 88, 927–941. [Google Scholar] [CrossRef]
- De Meijer, M.; Haemers, S.; Cobben, W.; Militz, H. Surface energy determinations of wood: Comparison of methods and wood species. Langmuir 2000, 16, 9352–9359. [Google Scholar] [CrossRef]
- Lewin, M.; Mey-Marom, A.; Frank, R. Surface free energies of polymeric materials, additives and minerals. Polym. Adv. Technol. 2005, 16, 429–441. [Google Scholar] [CrossRef]
- Douillard, J.M.; Salles, F.; Henry, M.; Malandrini, H.; Clauss, F. Surface energy of talc and chlorite: Comparison between electronegativity calculation and immersion results. J. Colloid Interface Sci. 2007, 305, 352–360. [Google Scholar] [CrossRef] [PubMed]
- Van der Leeden, M.C.; Frens, G. Surface properties of plastic materials in relation to their adhering performance. Adv. Eng. Mater. 2002, 4, 280–289. [Google Scholar] [CrossRef]
- Giese, R.; Costanzo, P.; van Oss, C. The surface free energies of talc and pyrophyllite. Phys. Chem. Miner. 1991, 17, 611–616. [Google Scholar] [CrossRef]
- Terada, K.; Yonemochi, E. Physicochemical properties and surface free energy of ground talc. Solid State Ionics 2004, 172, 459–462. [Google Scholar] [CrossRef]
- Tu, L.; Kruger, D.; Wagener, J.; Carstens, P. Wettability of surface oxyfluorinated polypropylene fibres and its effect on interfacial bonding with cementitious matrix. J. Adhesion 1997, 62, 187–211. [Google Scholar] [CrossRef]
- Giese, R.F.; Van Oss, C.J. Colloid and Surface Properties of Clays and Related Minerals; CRC Press: Boca Raton, FL, USA, 2002. [Google Scholar]
- Li, Z.; Giese, R.; Van Oss, C.; Yvon, J.; Cases, J. The surface thermodynamic properties of talc treated with octadecylamine. J. Colloid Interface Sci. 1993, 156, 279–284. [Google Scholar] [CrossRef]
- Kaggwa, G.B.; Huynh, L.; Ralston, J.; Bremmell, K. The influence of polymer structure and morphology on talc wettability. Langmuir 2006, 22, 3221–3227. [Google Scholar] [CrossRef] [PubMed]
- Owens, D.K.; Wendt, R. Estimation of the surface free energy of polymers. J. Appl. Polym. Sci. 1969, 13, 1741–1747. [Google Scholar] [CrossRef]
- Kwok, D.; Cheung, L.; Park, C.; Neumann, A. Study on the surface tensions of polymer melts using axisymmetric drop shape analysis. Polym. Eng. Sci. 1998, 38, 757–764. [Google Scholar] [CrossRef]
- Liu, H.; Wu, Q.; Han, G.; Yao, F.; Kojima, Y.; Suzuki, S. Compatibilizing and toughening bamboo flour-filled HDPE composites: Mechanical properties and morphologies. Compos. Part A 2008, 39, 1891–1900. [Google Scholar] [CrossRef]
- Huang, Y.; Jiang, S.; Wu, L.; Hua, Y. Characterization of LLDPE/nano-SiO2 composites by solid-state dynamic mechanical spectroscopy. Polym. Test. 2004, 23, 9–15. [Google Scholar] [CrossRef]
© 2015 by the authors; licensee MDPI, Basel, Switzerland. This article is an open access article distributed under the terms and conditions of the Creative Commons by Attribution (CC-BY) license (http://creativecommons.org/licenses/by/4.0/).
Share and Cite
Huang, R.; Mei, C.; Xu, X.; Kärki, T.; Lee, S.; Wu, Q. Effect of Hybrid Talc-Basalt Fillers in the Shell Layer on Thermal and Mechanical Performance of Co-Extruded Wood Plastic Composites. Materials 2015, 8, 8510-8523. https://doi.org/10.3390/ma8125473
Huang R, Mei C, Xu X, Kärki T, Lee S, Wu Q. Effect of Hybrid Talc-Basalt Fillers in the Shell Layer on Thermal and Mechanical Performance of Co-Extruded Wood Plastic Composites. Materials. 2015; 8(12):8510-8523. https://doi.org/10.3390/ma8125473
Chicago/Turabian StyleHuang, Runzhou, Changtong Mei, Xinwu Xu, Timo Kärki, Sunyoung Lee, and Qinglin Wu. 2015. "Effect of Hybrid Talc-Basalt Fillers in the Shell Layer on Thermal and Mechanical Performance of Co-Extruded Wood Plastic Composites" Materials 8, no. 12: 8510-8523. https://doi.org/10.3390/ma8125473
APA StyleHuang, R., Mei, C., Xu, X., Kärki, T., Lee, S., & Wu, Q. (2015). Effect of Hybrid Talc-Basalt Fillers in the Shell Layer on Thermal and Mechanical Performance of Co-Extruded Wood Plastic Composites. Materials, 8(12), 8510-8523. https://doi.org/10.3390/ma8125473