Abstract
We make glassy water in the form of nanofibers by electrospraying liquid water into a hyperquenching chamber. It is measured with means of differential scanning calorimetry, wide angle X-ray diffraction and Raman spectroscopy. It is found that two apparent glass transitions at Tg1 = 136 K and Tg2 = 228 K are detected and non-crystallized water is observed at temperatures up to 228 K. This finding may expand the research objects for liquid water at low temperatures.
1. Introduction
It has been a challenge for scientists to take a deep insight into the thermodynamic properties of water at a temperature between its spontaneous crystallization (Tx) and homogeneous crystallization temperature (TH), where bulk water inevitably crystallizes. On one hand, bulk water can be supercooled down to TH = 235 K without crystallization [1,2]. On the other hand, when hyperquenched glassy water is heated, it undergoes glass transition at the conventionally assigned Tg = 136 K, followed by crystallization at Tx = 150 K [3,4]. The temperature gap between Tx and TH is so-called no man’s land of water [5]. Recent studies have found that thermodynamic response functions increase so fast that it seems to diverge at some point in this forbidden region, raising questions over whether these functions do really diverge or just experience a maximum [6,7,8,9,10]. Meanwhile, the Tg of water is also controversial. In particular, Angell and co-workers argued consistently that conventional Tg of water (136 K) should be reassigned to a higher value inside the crystalline region [11,12,13]. Furthermore, it has long been suggested that water exists in two forms: fragile and strong, and a fragile-to-strong (FS) transition [11] may fall in this forbidden region as well [14]. To avoid crystallization, recent studies have focused on water confined in nanospace where the external surface helps in restraining the water molecular motion [15,16]. The thermodynamic properties of the confined water were systematically investigated with an adiabatic calorimeter [17,18,19,20]. But it is also likely that the general structural and dynamical properties of bulk water are substantially altered in such systems [21,22].
In the present work, we make glassy water in the morphology of freestanding nanofibers by electrospraying pure water into a hyperquenching chamber. This method is reported in detail previously [23]. We also systematically exam the properties of the obtained samples over a temperature range from 120 K to 250 K with means of differential scanning calorimeter, X-ray diffraction and Raman spectroscopy.
2. Results and Discussion
The morphology of the prepared nanofibrous ice is shown in Figure 1A, appearing in white-cotton on a mesh near the hyperquenching chamber bottom (in black). Its microscopic image is shown in Figure 1B. These ice fibers are measured to be from 40 to 400 nm in diameter. Varicose shape dominates smooth one. Occasionally, straight ice fiber with relatively smooth surface can be observed (inset in Figure 1B).
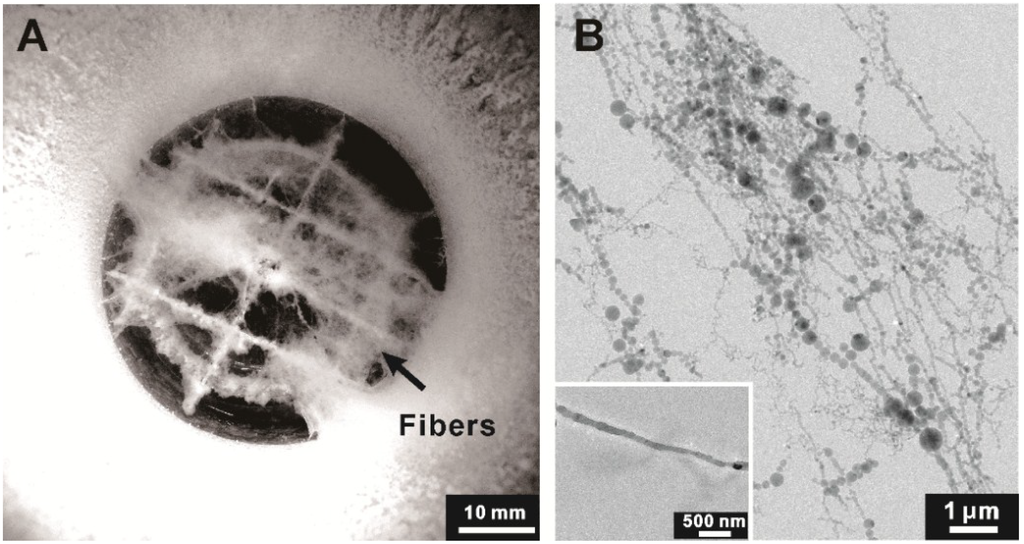
Figure 1.
(A) A typical top-view image of the chamber with cotton-like ice inside suspended on a mesh near the bottom (black); (B) A cryo-transmission electron microscopic image of the ice. The inset presents a single ice with relatively smooth surface.
In order to measure the thermodynamic properties of the ice, we carried out measurements with differential scanning calorimetry (DSC). The results are shown in Figure 2. Apparently, there exist two very similar thermodynamic patterns around 140 K and 230 K, showing the features of the conventional glass transition of water. By analyzing the curves as shown in the insets, the first glass transition temperature is assigned as Tg1 = 136 K, which is consistent with the value reported [3,4]. The following exothermic peak immediately after Tg1 centers at about 145 K, which supposedly is due to crystallization of the glassy sample to ice Ic [24]. But the area ratio of the glass transition peak to the crystallization peak is considerably large in comparison with the literature [3,24], implying that the glass transition into a more relaxed state is incomplete. Similarly, we can sign a second glass transition temperature as Tg2 = 228 K. By contrast, the following exothermic peak after Tg2 turns very sharp, indicating that the transition is complete. Interestingly, Maruyama et al. [25] have conducted an experiment on adiabatic calorimetry of water confined within nonporous of silica gel and found a CP peak near 228 K at ambient pressure, and claimed it is the glass transition temperature for the internal water.
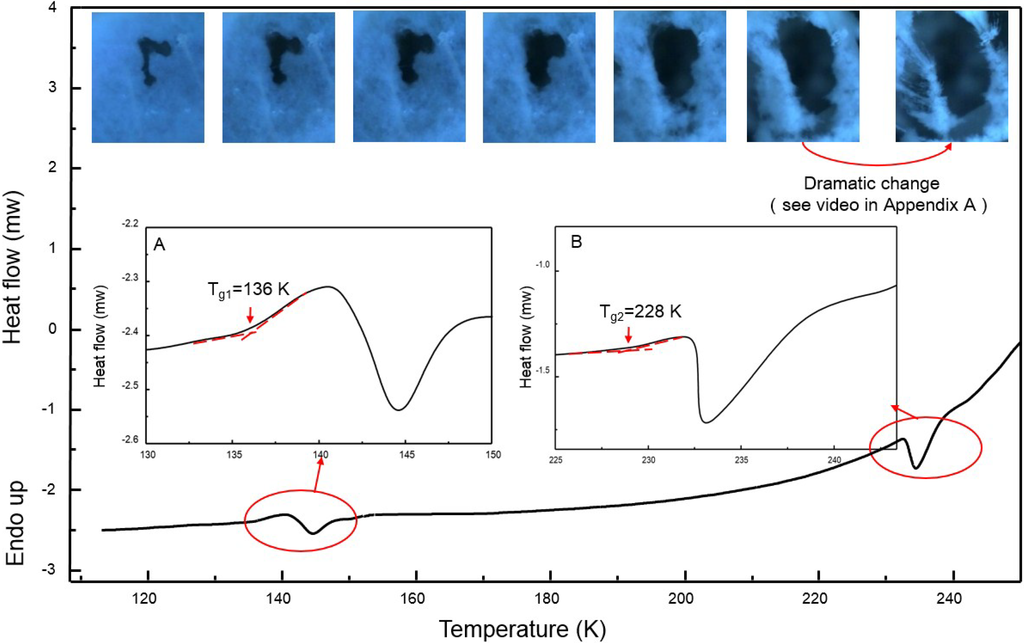
Figure 2.
Differential scanning calorimetry (DSC) scan of the fibrous ice. The insets are the enlarged views of the heat flow around the two thermal transition temperatures at Tg1 = 136 K and Tg2 = 228 K. The heating rate is 30 K·min−1. The series of pictures present the morphological change of the intact fibrous ice in Figure 1A over spontaneously elevated temperatures. A hole throughout the ice matrix is in black.
We also tried to directly observe the mechanical behaviors of the ice around the two thermal transition regions. Intact fibrous ice inside the hyper-chamber is video-recorded for its dynamic morphological change under the gravity over time at spontaneously elevated temperature. A series of the top-view images taken from the recorded video is shown in Figure 2, where the black presents a hole throughout the ice matrix. The whole heating process lasts around 2 h. As a result, both the transitions around Tg1 = 136 K and Tg2 = 228 K are identified. Apparently, no change was observed at all below Tg1, indicating the molecular motion is frozen. However, the hole size is found to increase steadily until Tg2, followed by a dramatic collapse of the nanofibrous ice (see video in Supplementary Materials). This behavior of a viscous liquid or viscoelastic body implies that any phase transition into cubic ice Ic just above Tg1 is incomplete. Thus the thermal transition at Tg2 = 228 K might be a liquid-liquid related transition instead of a real glass transition.
To justify our idea, we carried out measurements with wide-angle X-ray diffraction and Raman spectroscopy. The X-ray diffraction results are shown in Figure 3A. The samples were quenched with liquid nitrogen and then measured at elevated temperature up to 240 K. The Bragg peaks at about 2θ ≈ 22.7°, 24.2°, 25.8° are the (100), (002), (101) reflection of hexagonal ice Ih, respectively [26], whereas the peak at 2θ ≈ 24.2° also presents the (111) reflection of cubic ice Ic [24,27]. Apparently, hexagonal form ice presents in the sample below its glass transition temperature. By analyzing the relative peak intensities, we can see the proportion change of the two different types of ice at elevated temperatures.
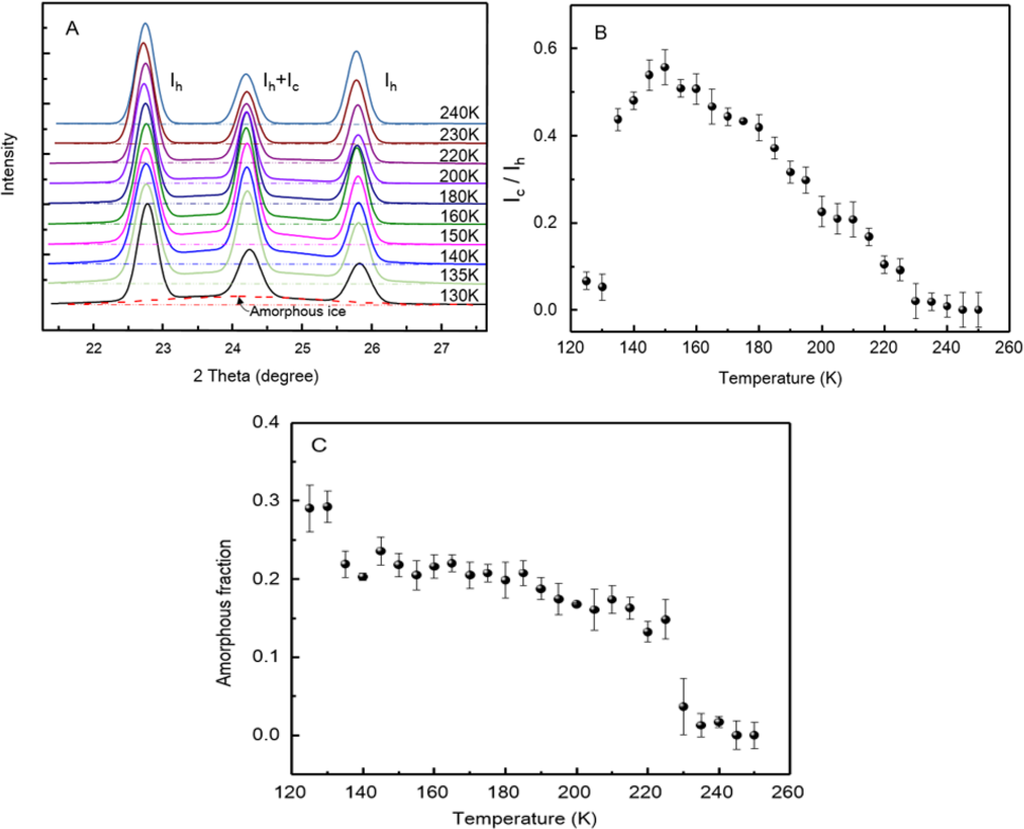
Figure 3.
(A) The wide-angle X-ray diffractions (WAXD, Cu Kα) spectra changes of nanofibrous ice with increase of temperature from 130 K to 240 K; (B) The intensity ratio Ic/Ih as a function of the temperature; (C) The amorphous fraction of the tested sample as a function of the temperature.
As shown in Figure 3B, the Ic/Ih ratio presents a very small value below 130 K, but take a big jump around 140 K and then reach a peak at 150 K. Afterwards, it keeps decreasing until 230 K. The ratio change of the two form ice is the reflection of both sample purity and the Ic → Ih phase transition. On the other hand, we notice that the amorphous ice, appearing as the broad band [28], presents at all temperatures measured up to 230 K. A plot of the amorphous fraction as a function of the temperature is presented in Figure 3C. As a result, the amorphous fraction is observed to fall dramatically near Tg1 and Tg2, but remains relatively steady between them. This observation is distinct to these with bulk water and confined water. Actually, it is worth to point out that the tested samples are inevitably mixed with some crystallized water droplets during preparation, so the calculated amorphous fraction should be lower than the actual value of the pure fibrous ice [23].
The results measured with Raman spectroscopy are shown in Figure 4. All the obtained Raman profiles are typical ones from the coupled OH stretching vibration mode for ice [29]. According to previous reports [30], the profiles below 230 K are found to be identical to that of low density amorphous (LDA) ice; whereas these at 230 K and above presents the phase of hexagonal ice. As a result, only a slight change in peak position or intensity is observed between 130 K and 140 K, implying that the thermal transition around Tg1 has a minor impact on the reconstruction of the surface water molecules of the sample. In contrast, a distinguished change in profile has been found between 220 K and 230 K, indicating that the sample has relaxed completely due to crystallization into the hexagonal form of ice Ih. We also notice that the sample surfaces at least remain amorphous at all the temperatures tested, up to 220 K.
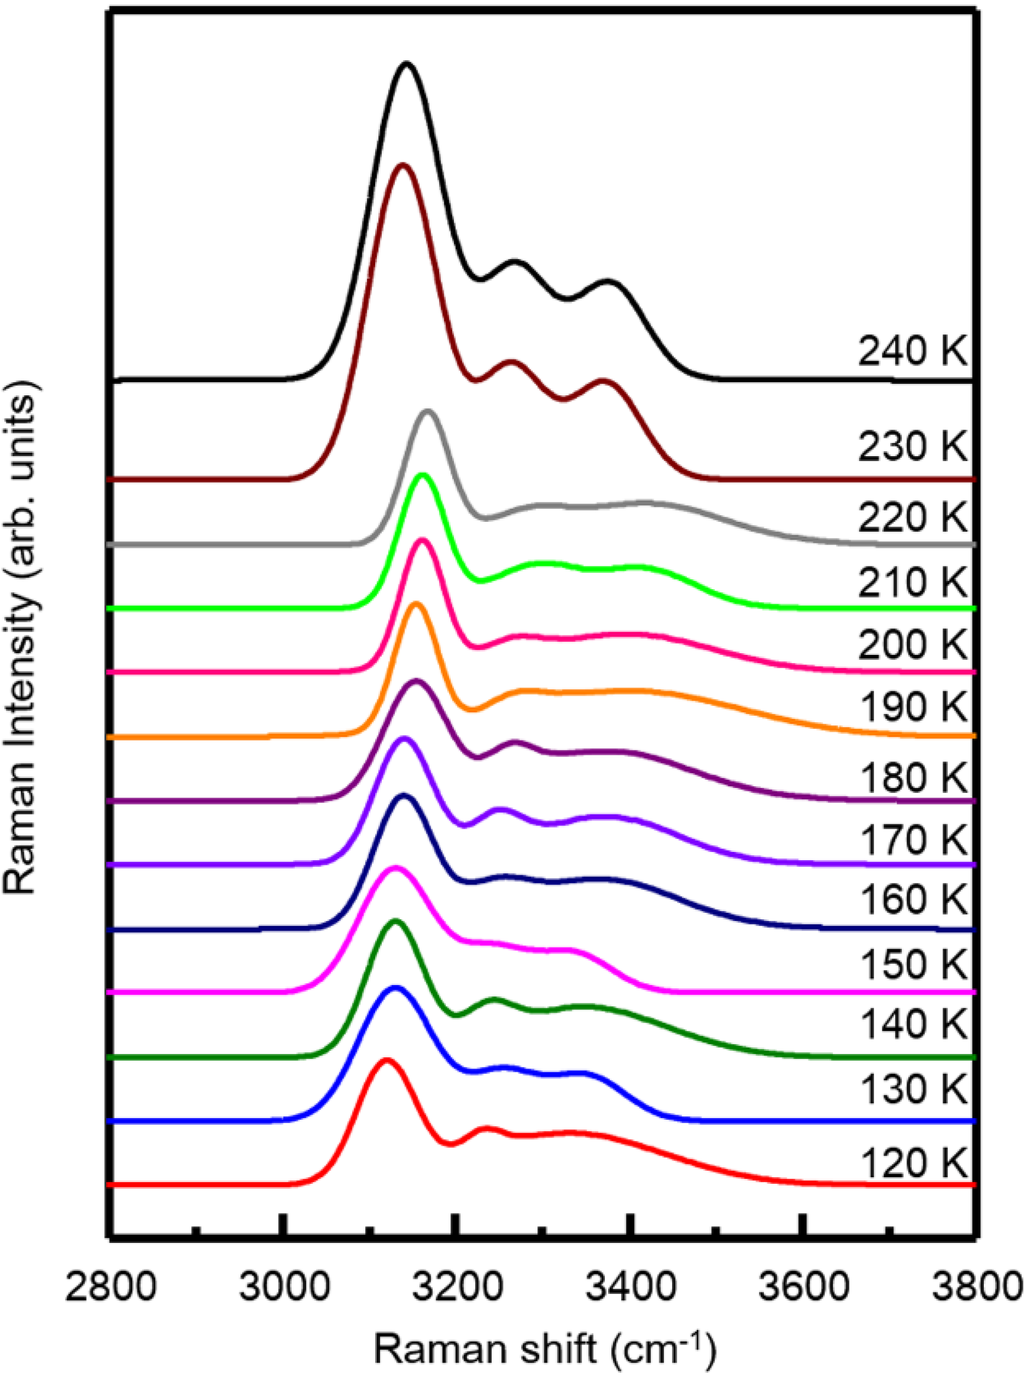
Figure 4.
In situ Raman OH stretching spectral changes of the nanofibrous ice during the heating process from 120 K to 240 K.
In summary, we discover the distinct properties of nanofibrous ice, which apparently embodies an incomplete glass transition at Tg1 = 136 K, an amorphous/liquid state persisting throughout the conventional crystalline region and a second thermal transition at Tg2 = 228 K. Interestingly, Tg = 228 K was also signed as the glass transition temperature for confined water [31]. However, the two systems seem to be quite different. Form the Raman spectra shown in Figure 4, the nanofibrous ices are actually crystal-free on their surfaces at a temperature below 220 K. Thus, our observations mostly like to be size-related phenomena of water. On one hand, the size distribution of the nanofibrous ices may result in two glass transitions due to size effects [32,33]. On the other hand, if the size effect is sufficiently enough to hinder the viscous state of water immediately after Tg1 from crystallization [34], then the Tg2 is related to the liquid-liquid transition of water [14].
3. Experimental Section
3.1. Materials
Milli-Q deionized water (resistivity: 18.2 MΩ cm) was used throughout the experiments.
3.2. Preparation of Nanofibrous Ice
Experimental setup is reported previously [23], which consists of an electrospray unit and a hyperquenching chamber. The former is used to produce charged micron-sized water droplets at room temperature and the latter is used to hyperquench any formed liquid threads and collect fibrous ice samples.
3.3. Characterization of Fibrous Ice
The morphology of the ice was characterized with a cryoEM (Tecnai F20, FEI Company, Hillsboro, OR, USA). Field emission gun of 200,000 voltage was used for electron beam generation. The images were obtained by a 4 k × 4 k multiport CCD camera (F415mp, TVIPS, Gauting, Germany) with a 4-port readout and 15 µm pixel size.
The crystal structures were monitored by in situ WAXD measurement at an in-house setup with a 30 W micro X-ray source (Incoatec, GmbH, Geesthacht, Germany) that provides highly parallel beam (divergence about 1 mrad) of monochromatic Cu Kα radiation (=0.154 nm). PSD-50M 1D detector was purchased from Braun Germany. Sample was placed inside an optical cryostat (THMS600, Linkam, Surrey, UK). The cryostat allows to be set between 90 and 300 K and positioned inside a working chamber purged with a dry flow of N2 to prevent testing sample from frosting at low temperatures.
The thermodynamic properties of the ice were measured with a DSC (DSC8000, PerkinElmer, Waltham, MA, USA). The DSC instrument was calibrated with cyclopentane and cyclohexane. DSC scans were recorded at heating rate of 30 K·min−1 from 113 to 298 K.
Raman spectral (LabRAM-HR, Horiba Scientific, Grenoble, France) was measured at low temperatures by a cryostat system (FDCS196, Linkam, Surrey, UK). The 514.5 nm line of argon ion laser excitation (~300 mW) was selected for use. The temperature distributions in the cooling chamber were measured by a Pt-100 thermistor (Heraeus, Hanau, Germany).
4. Conclusions
We have demonstrated that freestanding nanofibrous ice prepared with electrospraying unit retains in amorphous/liquid state at temperatures up to 228 K, and found two thermal transitions at Tg1 = 136 K and Tg2 = 228 K. We believe that the first transition at Tg1 = 136 K is the glass transition water and the second one is the consequence of an incomplete phase transition near Tg1 due to size effects. Our results explicitly indicate that this new approach is effective to avoid water crystallization at no costs of losing its fundamental properties.
Supplementary Materials
A video shows the dynamic morphological change of the ice fibers under the gravity over time at spontaneously elevated temperature. The real process lasts around 2 h and the presented video is fast forward.
Supplementary materials can be accessed at: http://www.mdpi.com/1996-1944/7/12/7653/s1.
Acknowledgments
This work is supported by the National Natural Science Foundation of China (Nos. 21273207 and 21274138), and in part by the Hundred Talents Program of CAS. The authors thank the team in the Synchrotron Radiation Facility of Shanghai for supporting the WAXD measurements. We also thank Liangbing Li for the assistance with the WAXD measurements and helpful discussion.
Author Contributions
The research work outlined in this publication was performed by Fanyi Cai, Chunye Xu and Jianming Zheng. The study was designed by Fanyi Cai and Jianming Zheng, the experiments were carried out by Fanyi Cai, and the initial manuscript was prepared by Fanyi Cai. Revision of the manuscript was performed by Chunye Xu and Jianming Zheng.
Conflicts of Interest
The authors declare no conflict of interest.
References
- Mossop, S.C. The freezing of supercooled water. Proc. Phys. Soc. Lond. Sect. B 1955, 68, 193–208. [Google Scholar] [CrossRef]
- Koop, T.; Luo, B.P.; Tsias, A.; Peter, T. Water activity as the determinant for homogeneous ice nucleation in aqueous solutions. Nature 2000, 406, 611–614. [Google Scholar] [CrossRef] [PubMed]
- Johari, G.P.; Hallbrucker, A.; Mayer, E. The glass liquid transition of hyperquenched water. Nature 1987, 330, 552–553. [Google Scholar] [CrossRef]
- Handa, Y.P.; Klug, D.D. Heat-capacity and glass-transition behavior of amorphous ice. J. Phys. Chem. 1988, 92, 3323–3325. [Google Scholar] [CrossRef]
- Debenedetti, P.G.; Stanley, H.E. Supercooled and glassy water. Phys. Today 2003, 56, 40–46. [Google Scholar] [CrossRef]
- Kanno, H.; Speedy, R.J.; Angell, C.A. Supercooling of water to −92 °C under pressure. Science 1975, 189, 880–881. [Google Scholar] [CrossRef] [PubMed]
- Anisimov, M.A.; Ovodov, G.I.; Voronel, A.V.; Zaugolni, N.S. Specific-heat of water near melting-point and ornstein-zernike fluctuation corrections. J. Exp. Theor. Phys. Lett. 1972, 15, 317–319. [Google Scholar]
- Smith, R.S.; Kay, B.D. The existence of supercooled liquid water at 150 K. Nature 1999, 398, 788–791. [Google Scholar] [CrossRef]
- Hare, D.E.; Sorensen, C.M. Densities of supercooled H2O and D2O in 25-Mu glass-capillaries. J. Chem. Phys. 1986, 84, 5085–5089. [Google Scholar] [CrossRef]
- Andersson, O. Dielectric relaxation of low-density amorphous ice under pressure. Phys. Rev. Lett. 2007, 98. [Google Scholar] [CrossRef]
- Angell, C.A. Insights into phases of liquid water from study of its unusual glass-forming properties. Science 2008, 319, 582–587. [Google Scholar] [CrossRef] [PubMed]
- Angell, C.A. Amorphous water. Annu. Rev. Phys. Chem. 2004, 55, 559–583. [Google Scholar] [CrossRef] [PubMed]
- Giovambattista, N.; Angell, C.A.; Sciortino, F.; Stanley, H.E. Glass-transition temperature of water: A simulation study. Phys. Rev. Lett. 2004, 93. [Google Scholar] [CrossRef]
- Liu, L.; Chen, S.H.; Faraone, A.; Yen, C.W.; Mou, C.Y. Pressure dependence of fragile-to-strong transition and a possible second critical point in supercooled confined water. Phys. Rev. Lett. 2005, 95. [Google Scholar] [CrossRef]
- Oguni, M.; Kanke, Y.; Nagoe, A.; Namba, S. Calorimetric study of waterʼs glass transition in nanoscale confinement, suggesting a value of 210 k for bulk water. J. Phys. Chem. B 2011, 115, 14023–14029. [Google Scholar] [CrossRef] [PubMed]
- Chen, S.H.; Liu, L.; Chu, X.; Zhang, Y.; Fratini, E.; Baglioni, P.; Faraone, A.; Mamontov, E. Experimental evidence of fragile-to-strong dynamic crossover in DNA hydration water. J. Chem. Phys. 2006, 125. [Google Scholar] [CrossRef]
- Nagoe, A.; Oguni, M. Hydroxylamine-doping effect on the Tg of 160 K for water confined in silica-gel nanopores. J. Phys. Condens. Matter 2013, 25. [Google Scholar] [CrossRef]
- Nagoe, A.; Kanke, Y.; Oguni, M.; Namba, S. Findings of Cp maximum at 233 K for the water within silica nanopores and very weak dependence of the T-max on the pore size. J. Phys. Chem. B 2010, 114, 13940–13943. [Google Scholar] [CrossRef] [PubMed]
- Aso, M.; Ito, K.; Sugino, H.; Yoshida, K.; Yamada, T.; Yamamuro, O.; Inagaki, S.; Yamaguchi, T. Thermal behavior, structure, and dynamics of low-temperature water confined in mesoporous organosilica by differential scanning calorimetry, X-ray diffraction, and quasi-elastic neutron scattering. Pure Appl. Chem. 2013, 85, 289–305. [Google Scholar]
- Johari, G.P. Origin of the enthalpy features of water in 1.8 nm pores of MCM-41 and the large C(p) increase at 210 K. J. Chem. Phys. 2009, 130. [Google Scholar] [CrossRef]
- Khodadadi, S.; Pawlus, S.; Sokolov, A.P. Influence of hydration on protein dynamics: Combining dielectric and neutron scattering spectroscopy data. J. Phys. Chem. B 2008, 112, 14273–14280. [Google Scholar] [CrossRef] [PubMed]
- Kittaka, S.; Takahara, S.; Matsumoto, H.; Wada, Y.; Satoh, T.J.; Yamaguchi, T. Low temperature phase properties of water confined in mesoporous silica MCM-41: Thermodynamic and neutron scattering study. J. Chem. Phys. 2013, 138. [Google Scholar] [CrossRef]
- Cai, F.; Wang, Z.; Xu, C.; Zheng, J. Preparation of ice nanofibers with electrospray. Mater. Lett. 2014, 133, 115–118. [Google Scholar] [CrossRef]
- Kohl, I.; Mayer, E.; Hallbrucker, A. The glassy water-cubic ice system: A comparative study by X-ray diffraction and differential scanning calorimetry. Phys. Chem. Phys. 2000, 2, 1579–1586. [Google Scholar] [CrossRef]
- Maruyama, S.; Wakabayashi, K.; Oguni, M. Thermal properties of supercooled water confined within silica gel pores. In Slow Dynamics in Complex Systems; Tokuyama, M., Oppenheim, I., Eds.; Amer Inst Physics: Melville, SK, Canada, 2004; Volume 708, pp. 675–676. [Google Scholar]
- Dowell, L.G.; Rinfret, A.P. Low-temperature forms of ice as studied by X-ray diffraction. Nature 1960, 188, 1144–1148. [Google Scholar] [CrossRef]
- Mayer, E.; Hallbrucker, A. Cubic ice from liquid water. Nature 1987, 325, 601–602. [Google Scholar] [CrossRef]
- Malkin, T.L.; Murray, B.J.; Brukhno, A.V.; Anwar, J.; Salzmann, C.G. Structure of ice crystallized from supercooled water. Proc. Natl. Acad. Sci. 2012, 109, 1041–1045. [Google Scholar] [CrossRef] [PubMed]
- Xue, X.; He, Z.-Z.; Liu, J. Detection of water-ice phase transition based on Raman spectrum. J. Raman Spectrosc. 2013, 44, 1045–1048. [Google Scholar] [CrossRef]
- Suzuki, Y.; Mishima, O. Two distinct raman profiles of glassy dilute LiCl solution. Phys. Rev. Lett. 2000, 85, 1322–1325. [Google Scholar] [CrossRef] [PubMed]
- Swenson, J.; Teixeira, J. The glass transition and relaxation behavior of bulk water and a possible relation to confined water. J. Chem. Phys. 2010, 132. [Google Scholar] [CrossRef]
- Bhattacharya, D.; Payne, C.N.; Sadtchenko, V. Bulk and interfacial glass transitions of water. J. Phys. Chem. A 2011, 115, 5965–5972. [Google Scholar] [CrossRef] [PubMed]
- Sepulveda, A.; Leon-Gutierrez, E.; Gonzalez-Silveira, M.; Rodriguez-Tinoco, C.; Clavaguera-Mora, M.T.; Rodriguez-Viejo, J. Glass transition in ultrathin films of amorphous solid water. J. Chem. Phys. 2012, 137. [Google Scholar] [CrossRef]
- Lu, Y.J.; Zhang, X.X.; Chen, M. Size Effect on nucleation rate for homogeneous crystallization of nanoscale water film. J. Phys. Chem. B 2013, 117, 10241–10249. [Google Scholar] [CrossRef] [PubMed]
© 2014 by the authors; licensee MDPI, Basel, Switzerland. This article is an open access article distributed under the terms and conditions of the Creative Commons Attribution license (http://creativecommons.org/licenses/by/4.0/).